Article

Comparison of Factors of Spatiotemporal Variability of 7-Day Low-Flow Timing in Southern Quebec

by
Ali Arkamose Assani
Department of Environmental Sciences, Research Centre for Watershed-Aquatic Ecosystem Interactions (RIVE, UQTR), University of Quebec at Trois-Rivières, 3351 Boulevard des Forges, Trois-Rivières, QC G9A 5H7, Canada
Atmosphere 2025, 16(9), 1024; https://doi.org/10.3390/atmos16091024
Submission received: 14 July 2025 / Revised: 18 August 2025 / Accepted: 27 August 2025 / Published: 29 August 2025
(This article belongs to the Special Issue The Water Cycle and Climate Change (3rd Edition))

Abstract

The objective of this article is to analyze the impacts of climatic, physiographic, and land use/cover factors on the spatiotemporal variability of 7-day low-flow occurrence dates for 17 rivers during the period 1950–2023 in winter and summer in southern Quebec. Regarding spatial variability, correlation analysis revealed that these occurrence dates are primarily negatively correlated with agricultural surface area (early occurrence) during both seasons. In winter, they are also negatively correlated with total rainfall and daily mean maximum temperatures, but positively correlated with forest area and mean watershed slopes. Regarding temporal variability, the application of three Mann–Kendall tests showed that in summer, 7-day low flows tend to occur late in the season due to increased rainfall, particularly in the most agricultural watersheds. In contrast, in winter, very few significant changes were observed in the long-term trend of the analyzed hydrological series. Correlation analysis using redundancy analysis between eight climate indices and the occurrence dates of 7-day low flows showed that in summer, these dates are positively correlated with the global warming climate index, while they are not correlated with any climate index in winter. This study demonstrated that the spatiotemporal variability of the occurrence dates and magnitude of 7-day low flows are not influenced by the same factors in southern Quebec, except for the global warming climate index in summer. Finally, this study shows that the timing is much less sensitive to changes in climate change than the magnitude of low flows in southern Quebec.

1. Introduction

According to the concept of natural flow regime [1], streamflow is defined by the following five characteristics: magnitude, duration, frequency, timing, and variability. These five characteristics influence the dynamics and evolution of river ecosystems [1,2]. Of these five characteristics, flow magnitude is the most extensively studied. Studies on flow timing have primarily focused on the impacts of climate change on flood flow timing (e.g., [3,4,5,6]). On the other hand, the low-flow timing is still very little studied in the scientific literature. The few works already published on this characteristic have been limited to the analysis of seasonality (seasons of occurrence of low flows) or the stationarity of the dates of occurrence of minimum flows during a season (e.g., [7,8,9,10,11,12]). As for the few studies specifically devoted to the dates of occurrence of low water flows [7,10], they have been limited exclusively to the analysis of their temporal variability (long-term trend), to be able to determine whether these low waters occur early or late in each season. They have never analyzed the factors of their spatial variability, nor their link with climatic indices. These are the two new subjects that will be analyzed in this study, in addition to the long-term trend.
In Quebec, the impacts of global warming on precipitation patterns are reflected in a significant decrease in the amount of snow and its early melting, but by an increase in the amount of rainfall [13,14,15]. Regarding low flows, these impacts have been analyzed only for their magnitude. Thus, a general increase in this magnitude was observed in winter. However, decreases in magnitude were also observed in some of the snowiest basins in summer (e.g., [16,17]). Unlike magnitude, there are still no studies on the impacts of this climate warming on the occurrence dates of 7-day low flows. To fill this gap, this study pursues the following objectives:
  • Determine the climatic, physiographic, and land cover/use factors that influence the spatial variability of 7-day low-flow timing.
  • Analyze the long-term trend (stationarity) of the temporal variability of 7-day low-flow timing. The aim is to determine whether these 7-day low flows now tend to occur earlier or later in winter and summer.
  • Determine the climate indices that influence the temporal variability of 7-day low-flow timing.
  • Compare the climatic and physiographic factors of spatiotemporal variability that influence timing with those that influence the magnitudes of 7-day low flows.
It is important to remember that this study is part of the research program which aims to compare the factors of spatiotemporal variability of five characteristics of the flow in southern Quebec in the context of current global warming. The aim of this research program is to be able to identify the flow characteristics most sensitive to climate change and changes in land use, to serve as an indicator for monitoring these changes over time.

2. Materials and Methods

2.1. Description of the Study Sites

This study is based on the analysis of daily discharges from 17 rivers (Table 1). These were selected based primarily on the following two criteria: the existence of daily discharge data measured continuously for at least a 70-year period, and the low influence of water reservoirs (dams and reservoirs) on these discharges. These 17 rivers are grouped into three hydroclimatic regions (Figure 1), already described in detail in previous studies (e.g., [16]). The first hydroclimatic region in the southwest is located on the north shore of the St. Lawrence River. The rivers in this region flow primarily over the Canadian Shield, a Precambrian geological formation consisting of igneous and metamorphic rocks overlain by Quaternary sedimentary deposits of marine, fluvial, and glacial origin. The climate of this region is a temperate continental climate characterized by very cold winters and very hot summers. Agriculture is almost absent on the Shield. The main activity is forestry. There are numerous wetlands, including peat bogs, swamps, and small lakes, as well as other different types of wetlands. The second hydroclimatic region of the southeast is located on the south shore of the St. Lawrence River, south of 47° N (Figure 1). The rivers of this region incise the St. Lawrence Lowlands, a geological formation consisting mainly of sedimentary rocks that form a relatively flat topography. It is mainly covered by Quaternary sediments of mainly marine and glacial origin. The climate of this region is a mixed temperate climate, subject to oceanic and continental influences. Winters are less harsh and summers less hot than in the previous region. This is the most agricultural region in Quebec, where the agricultural surface area in the watersheds exceeds 20%, on average. This agricultural development has caused a very significant decrease in wetlands, which have been drained in favor of agricultural areas. However, these agricultural areas have significantly decreased since 1950, following the intensification of agriculture in Quebec [18]. Agricultural areas have been gradually replaced over time by fallow land and forests. The third hydroclimatic region to the east is also located on the south shore of the St. Lawrence River, but north of 47° N. The rivers in this climatic region flow over the Appalachians, an ancient, folded mountain range consisting mainly of sedimentary rocks from the primary era covered by sedimentary deposits of fluvioglacial and marine origin. The climate is temperate maritime, with less severe but relatively long winters, and relatively cooler summers than in the two previous hydroclimatic regions. Agriculture is practiced there, but the agricultural areas in the watersheds are smaller (<20% on average) than in the region located south of 47° N.

2.2. Data Sources and Composition of Hydroclimatic Series

Daily flow data were extracted from the website of the Centre d’expertise hydrique de la province du Québec (https://www.cehq.gouv.qc.ca/index_en.asp, accessed on 21 March 2024). Temperature and precipitation (snow and rain) normal data were extracted from the website of the federal government’s Department of Environment and Climate Change (https://climat.meteo.gc.ca/climate_normals/index_e.html, accessed on 20 August 2024). These are the monthly averages of climate normals for the following two periods: 1951–1980 and 1981–2010. As for the climate index data, they were extracted from the NOAA website (https://psl.noaa.gov/data/climateindices/list/, accessed on 12 September 2024). This study extracted monthly data from eight climate indices calculated over the period 1950–2023. The eight climate indices are AMO (Atlantic Multi-decadal Oscillation), AO (Arctic Oscillation), GMLOT (Global Mean Land/Ocean Temperature Index), NAO (North Atlantic Oscillation), SOI (Southern Oscillation index), NINO3.4, PDO (Pacific Decadal Oscillation) and PNA (Pacific Northern American index). The choice of these eight indices is justified by the fact that they influence the climate and river flows in Canada, in general, and in Quebec, in particular. Finally, data on the physiographic characteristics of watersheds, as well as land use and land cover, were provided to us by the glaciology laboratory at the Université du Québec à Trois-Rivières. These are the following data: drainage density (km/km2), average slope (°), forest surface area (%), wetland surface area (%) and agricultural surface area (%). The methods for calculating these different variables have already been described in detail by [19], in particular. This data is provided in Supplementary Materials. It is important to note that there are no quantitative data on the characteristics of aquifers for many rivers analyzed. In fact, groundwater is one of the main factors in the spatiotemporal variability of low-flow characteristics.
Regarding low flows, for each year and for each river, the average of the lowest flows measured over a period of 7 consecutive days (Q7) in winter (January to April) and in summer (June to September) was calculated using the method described in detail by [20] during the period 1950–2023. These averages were used to create the hydrological series of the magnitude of 7-day low flows during the period 1950–2023. Similarly, the averages of the dates of occurrence, expressed in Julian days, corresponding to the lowest flows measured over a period of 7 consecutive days, were also calculated. These averages were used to create hydrological series of the dates of occurrence of 7-day flows during the same period. Along with these hydrological series, series of the eight climatic indices were also compiled using averages calculated over a four-month period in winter (January to April) and summer (June to September) during the period 1950–2023.

2.3. Statistical Analysis

The statistical analysis was performed in the following steps:
In the first step, to determine the factors of spatial variability in the occurrence period and magnitude of 7-day low-flow events, the averages of climatic variables (temperature and precipitation), physiographic variables (watershed areas, drainage density, and average slope), and land use/cover variables (areas of forests, agriculture, and wetlands) were correlated with the averages of the occurrence periods and magnitudes of 7-day low-flow events. These averages were calculated for the period 1950–2023. To this end, the linear correlation (parametric) and Spearman’s rank correlation coefficient (nonparametric) methods were applied. Both methods yielded the same results.
In the second step, the Mann–Kendal (MK) test and its derivatives were applied to detect changes in the series means of timing and magnitudes of 7-day low flows. The first test applied was the original MK test [21]. However, this test does not eliminate the effects of short- and long-term persistence in the analyzed series. To overcome these two difficulties, two other tests derived from the first were applied. These are the STP test, which eliminates short-term persistence [22], and the LTP test, which eliminates long-term persistence [23].
The mathematical equations of these tests are extensively described in the scientific literature (e.g., [7,24,25,26,27]). However, we present some main equations. The general equation of the original Mann–Kendall test is as follows:
S = k = 1 n 1 j = k + 1 n s g n ( x j x k )
where xj and xi are the data values in years j and i, respectively, with j > i, and sgn(xj-xi) is the sign function.
The variance (S2) is calculated using the following equation
V a r S 2 = n n 1 2 n + 5 i = 1 m t ( t 1 ) ( 2 t + 5 ) 18
where n is actual sample size or the number of sample data, and m is the number of groups of tied ranks, each with tied observations.
To eliminate short-term persistence (STP) effects, the modified variance is calculated using the following equation:
V a r S 2 = n n * V a r S 2 = η s   V a r ( S 2 )
where n* is the effective sample size, and η s is the correction factor for serial correlation
Finally, to eliminate long-term persistence (LTP) effects, the modified variance is calculated using the following relationship:
V a r ( S 2 ) =   n 1 n n 2 H 1       S 2 = 1 n n 2 H 1 t = 1 n ( V t V ¯ ) 2
where H is the Hurst coefficient of the observational time series, and V t denotes a hydrometeorological process with t = 1, 2, 3, 4, … denoting time (years).
In the last step, the series of eight climate indices were correlated with the series of occurrence periods and magnitudes of 7-day low-flow rates using redundancy analysis [28]. This method proved to be the best suited to the analyzed data matrices, unlike other multivariate analysis methods such as the canonical correlation analysis method, among others.

3. Results

3.1. Comparison of Spatial Variability Factors of the Timing and Magnitude of 7-Day Minimum Flows in Winter and Summer

Table 2 presents the correlation coefficients calculated between the average of the dates of occurrence and magnitudes of 7-day minimum flows in winter and summer for the period 1950–2023. In winter, the dates of occurrence are positively correlated with average watershed slopes and forest areas. However, they are negatively correlated with agricultural surface area, total winter rainfall, and maximum winter daily temperatures. In summer, they are negatively correlated only with agricultural surface area.
Regarding the magnitude of 7-day low flows, in winter, it is positively correlated with wetland surface area and daily mean maximum temperatures in winter and March, but negatively correlated with the drainage density of watersheds. In summer, the magnitude is not significantly correlated with any physiographic or climatic factor.

3.2. Comparison of the Temporal Variability of Timing and Magnitude of 7-Day Low Flows in Winter and Summer

3.2.1. Comparison of the Long-Term Trend

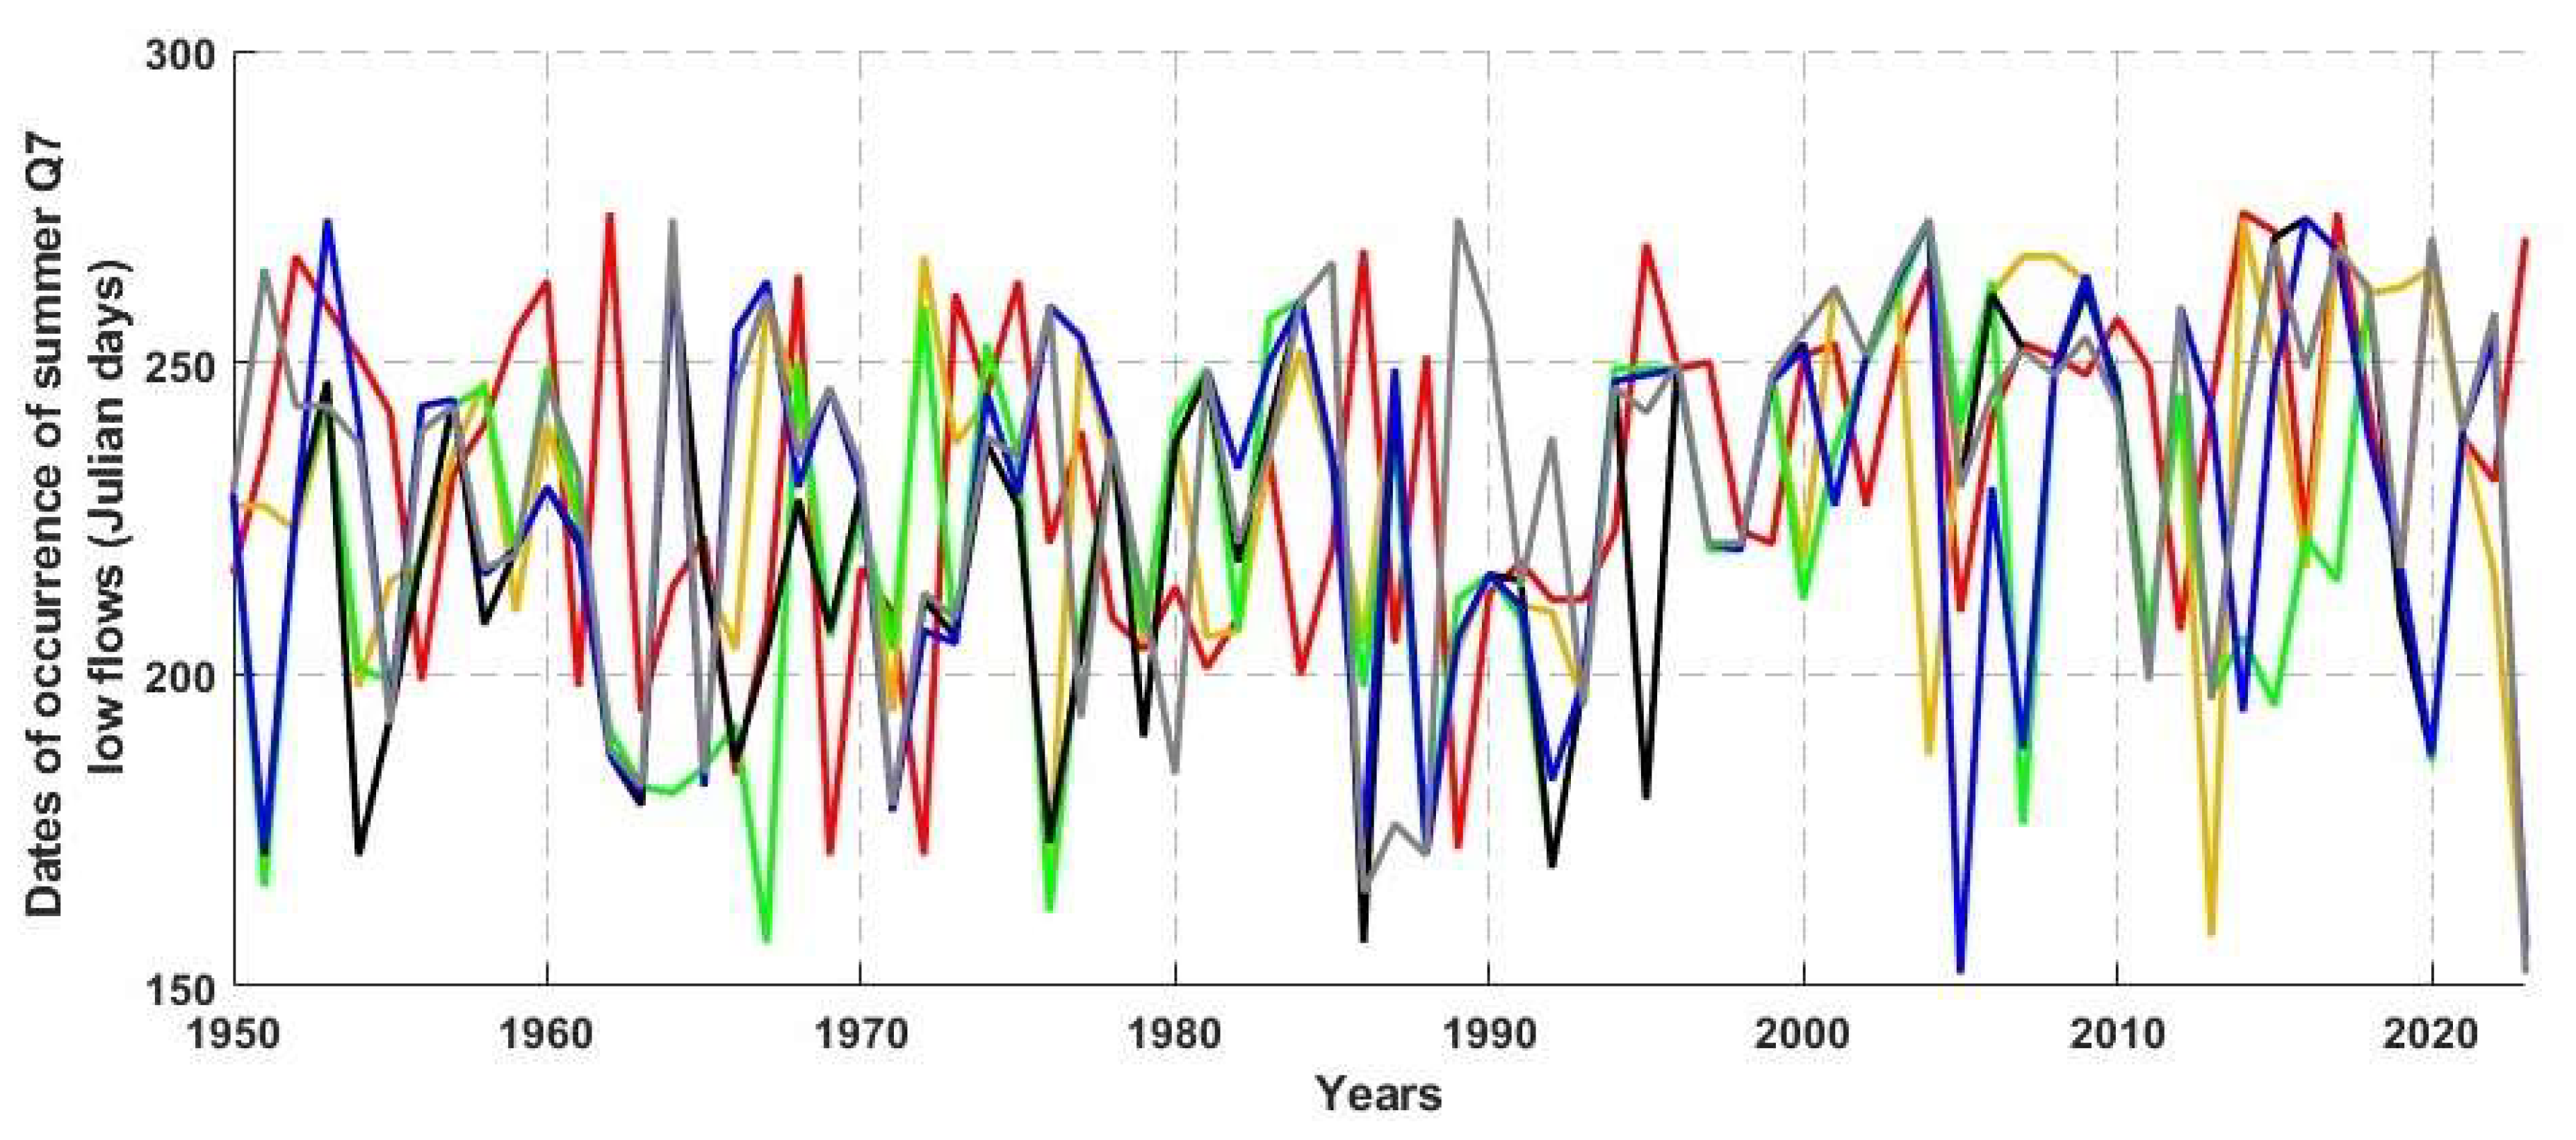
The results of the application of three Mann–Kendall tests are presented in Table 3, for the timing, and Table 4, for the magnitude. Regarding the timing, in winter, only three rivers (less than 20% of stations) experienced a significant increase in the dates of occurrence of 7-day low flows; i.e., a trend toward a later occurrence of 7-day low flows. Two of these rivers are in the southeastern hydroclimatic region, and the third is in the eastern hydroclimatic region. It follows that all three rivers are located on the south shore. In summer, eight rivers (more than 50% of stations) experienced a significant increase in the average (late occurrence) of the 7-day low-flow period (Figure 2, Figure 3 and Figure 4). Four are in the southeastern hydroclimatic region, only one is in the eastern hydroclimatic region, and three are in the southwestern hydroclimatic region. However, in the case of the latter hydroclimatic region, two of these three are not affected by long-term persistence.
As for the magnitude, in winter, the 7-day minimum discharge averages of almost all rivers significantly increased over time, apart from one river in the southeastern hydroclimatic region and two rivers in each of the two other hydroclimatic regions. In summer, the long-term trend is not uniform across the three hydroclimatic regions. In the southeastern hydroclimatic region, two rivers are characterized by a positive trend; i.e., a significant increase in the average over time. In contrast, in the other two hydroclimatic regions, almost all rivers are characterized by a negative trend; i.e., a significant decrease in magnitude over time.

3.2.2. Relationship Between the Dates of Occurrence/Magnitude of 7-Day Flows and Climate Indices

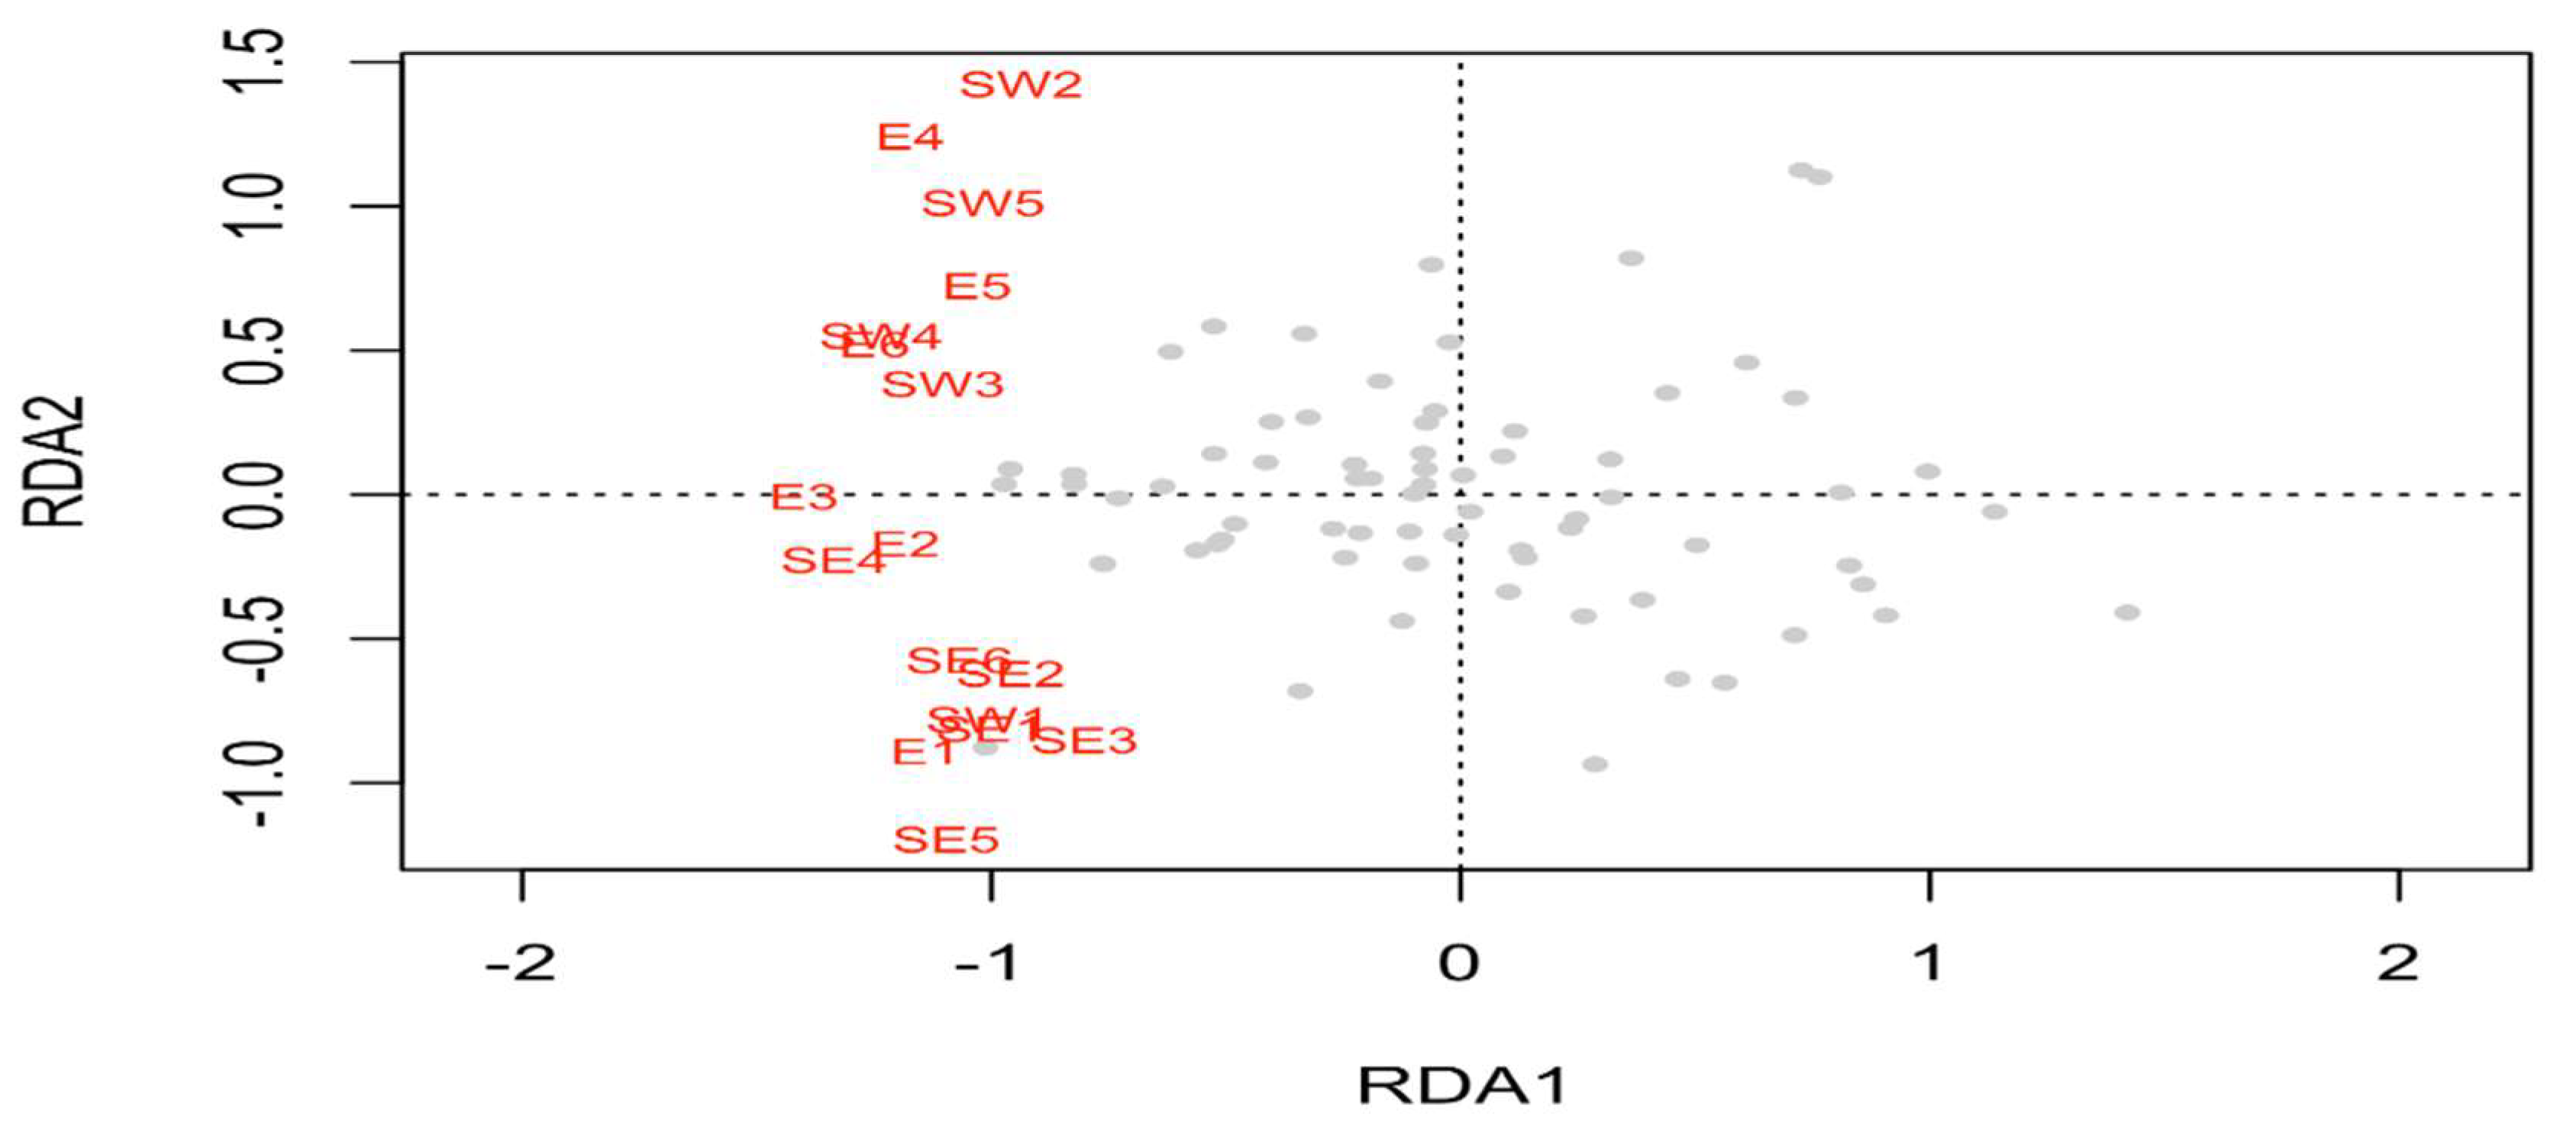
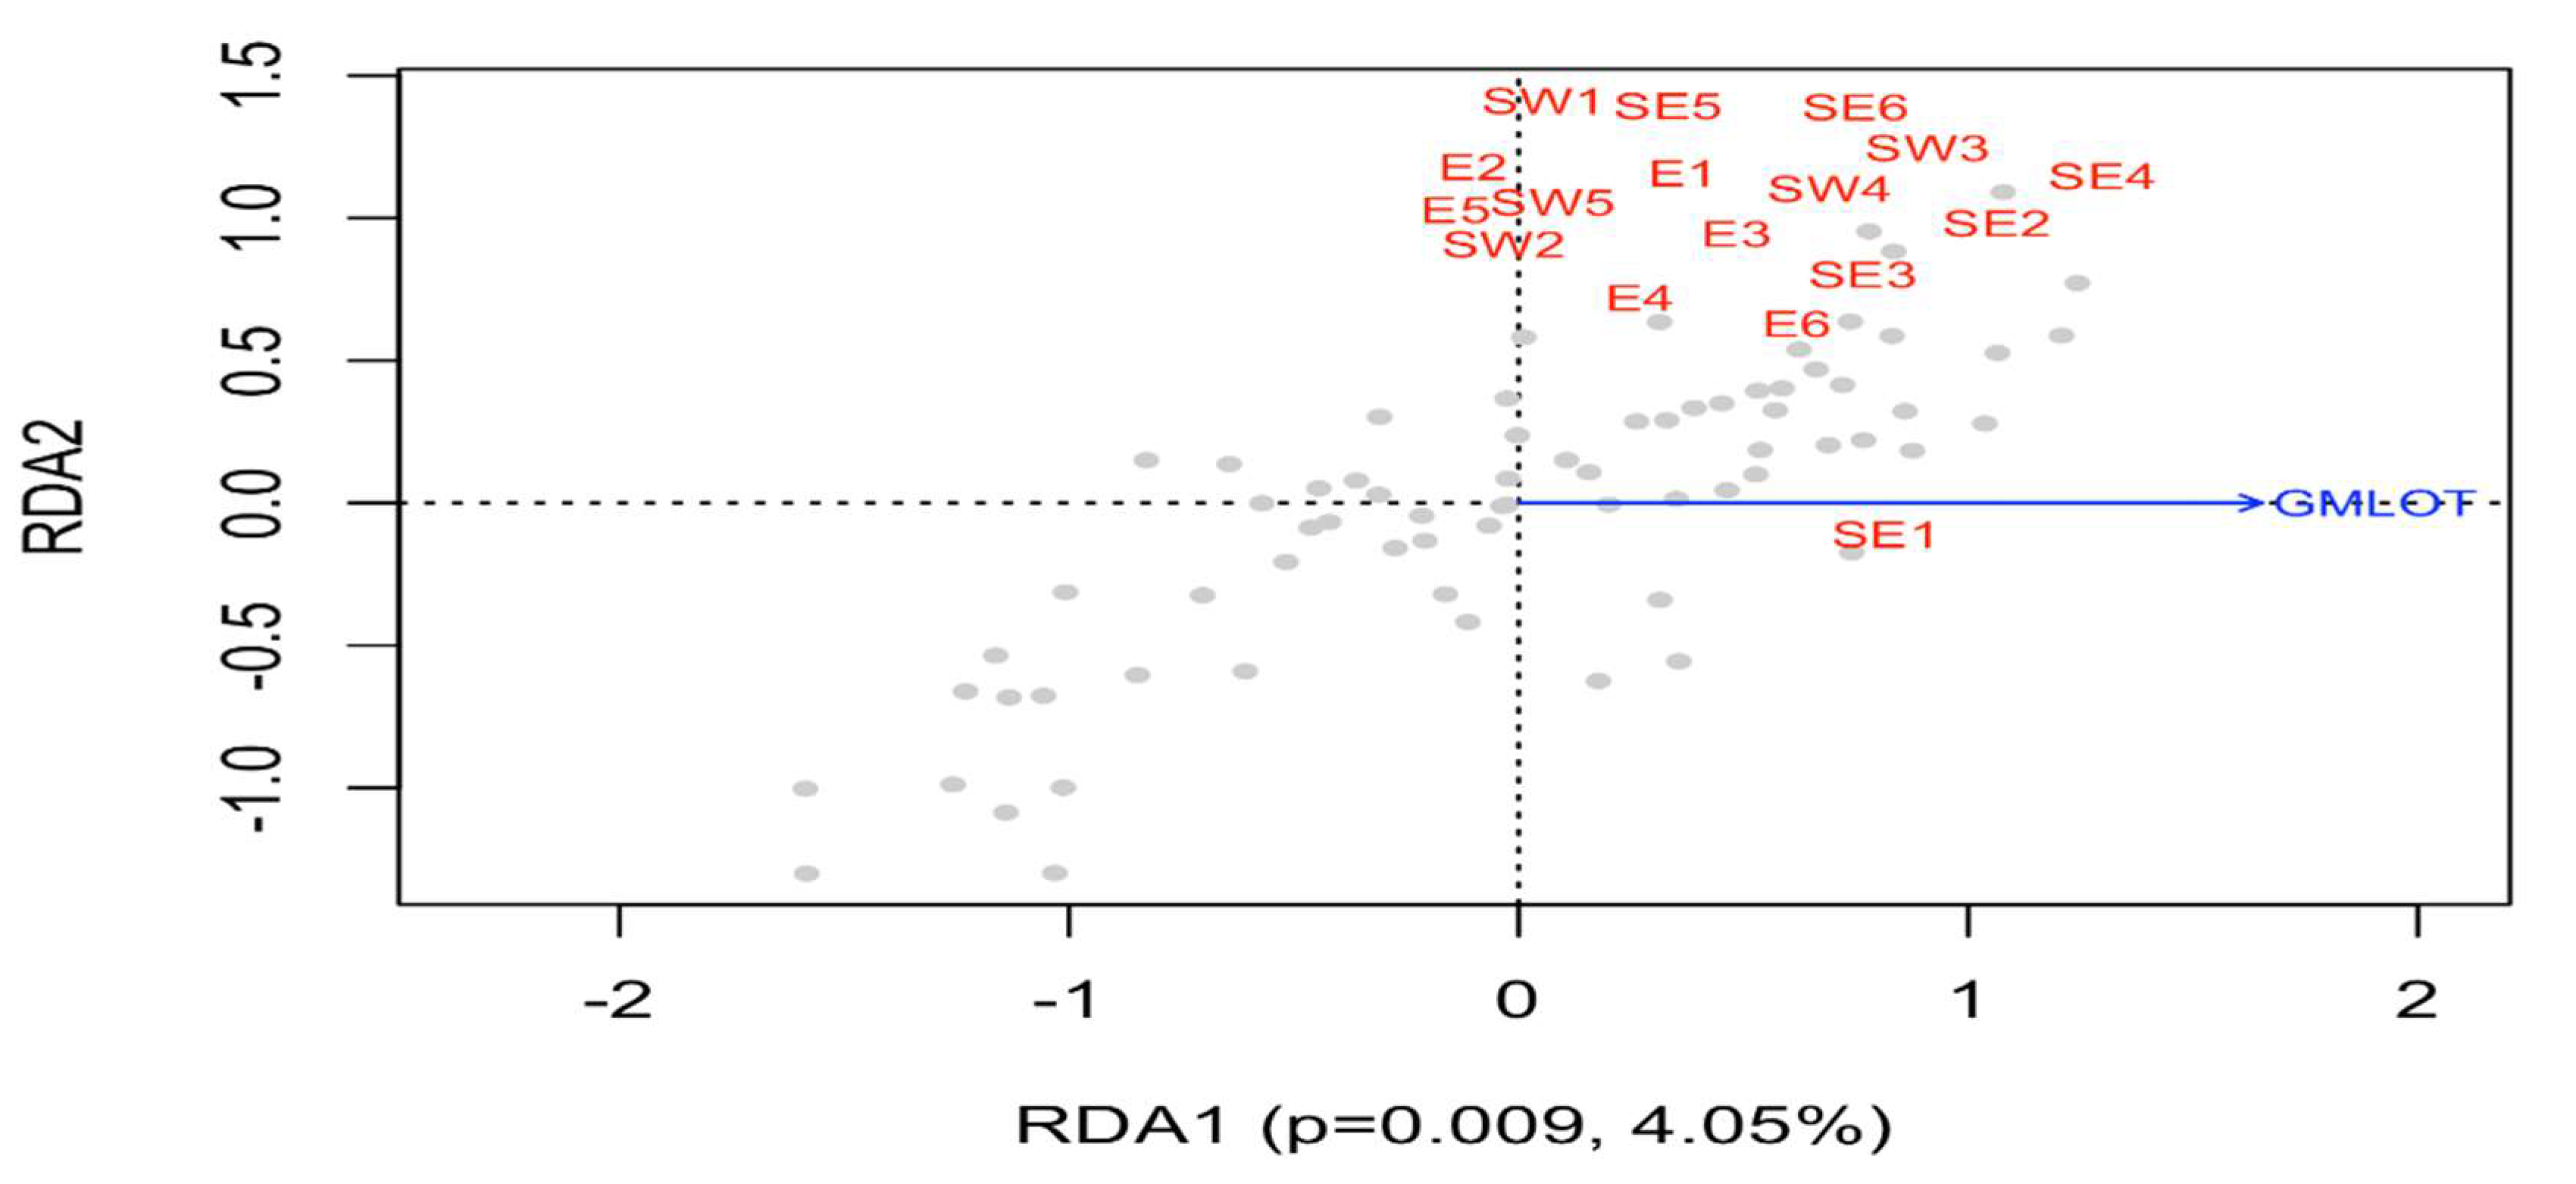
The results of the redundancy analysis are summarized in Figure 5, Figure 6, Figure 7 and Figure 8. Regarding the timing, it is not significantly correlated with any climate index in winter. However, in summer, the occurrence period is positively correlated with the global warming index (GMLOT). It is important to note that only the first axis is statistically significant, but that it only explains 4.05% of this relationship. It follows that the part of the interannual variability of the dates of occurrence of 7-day flows explained by the indices is relatively low.
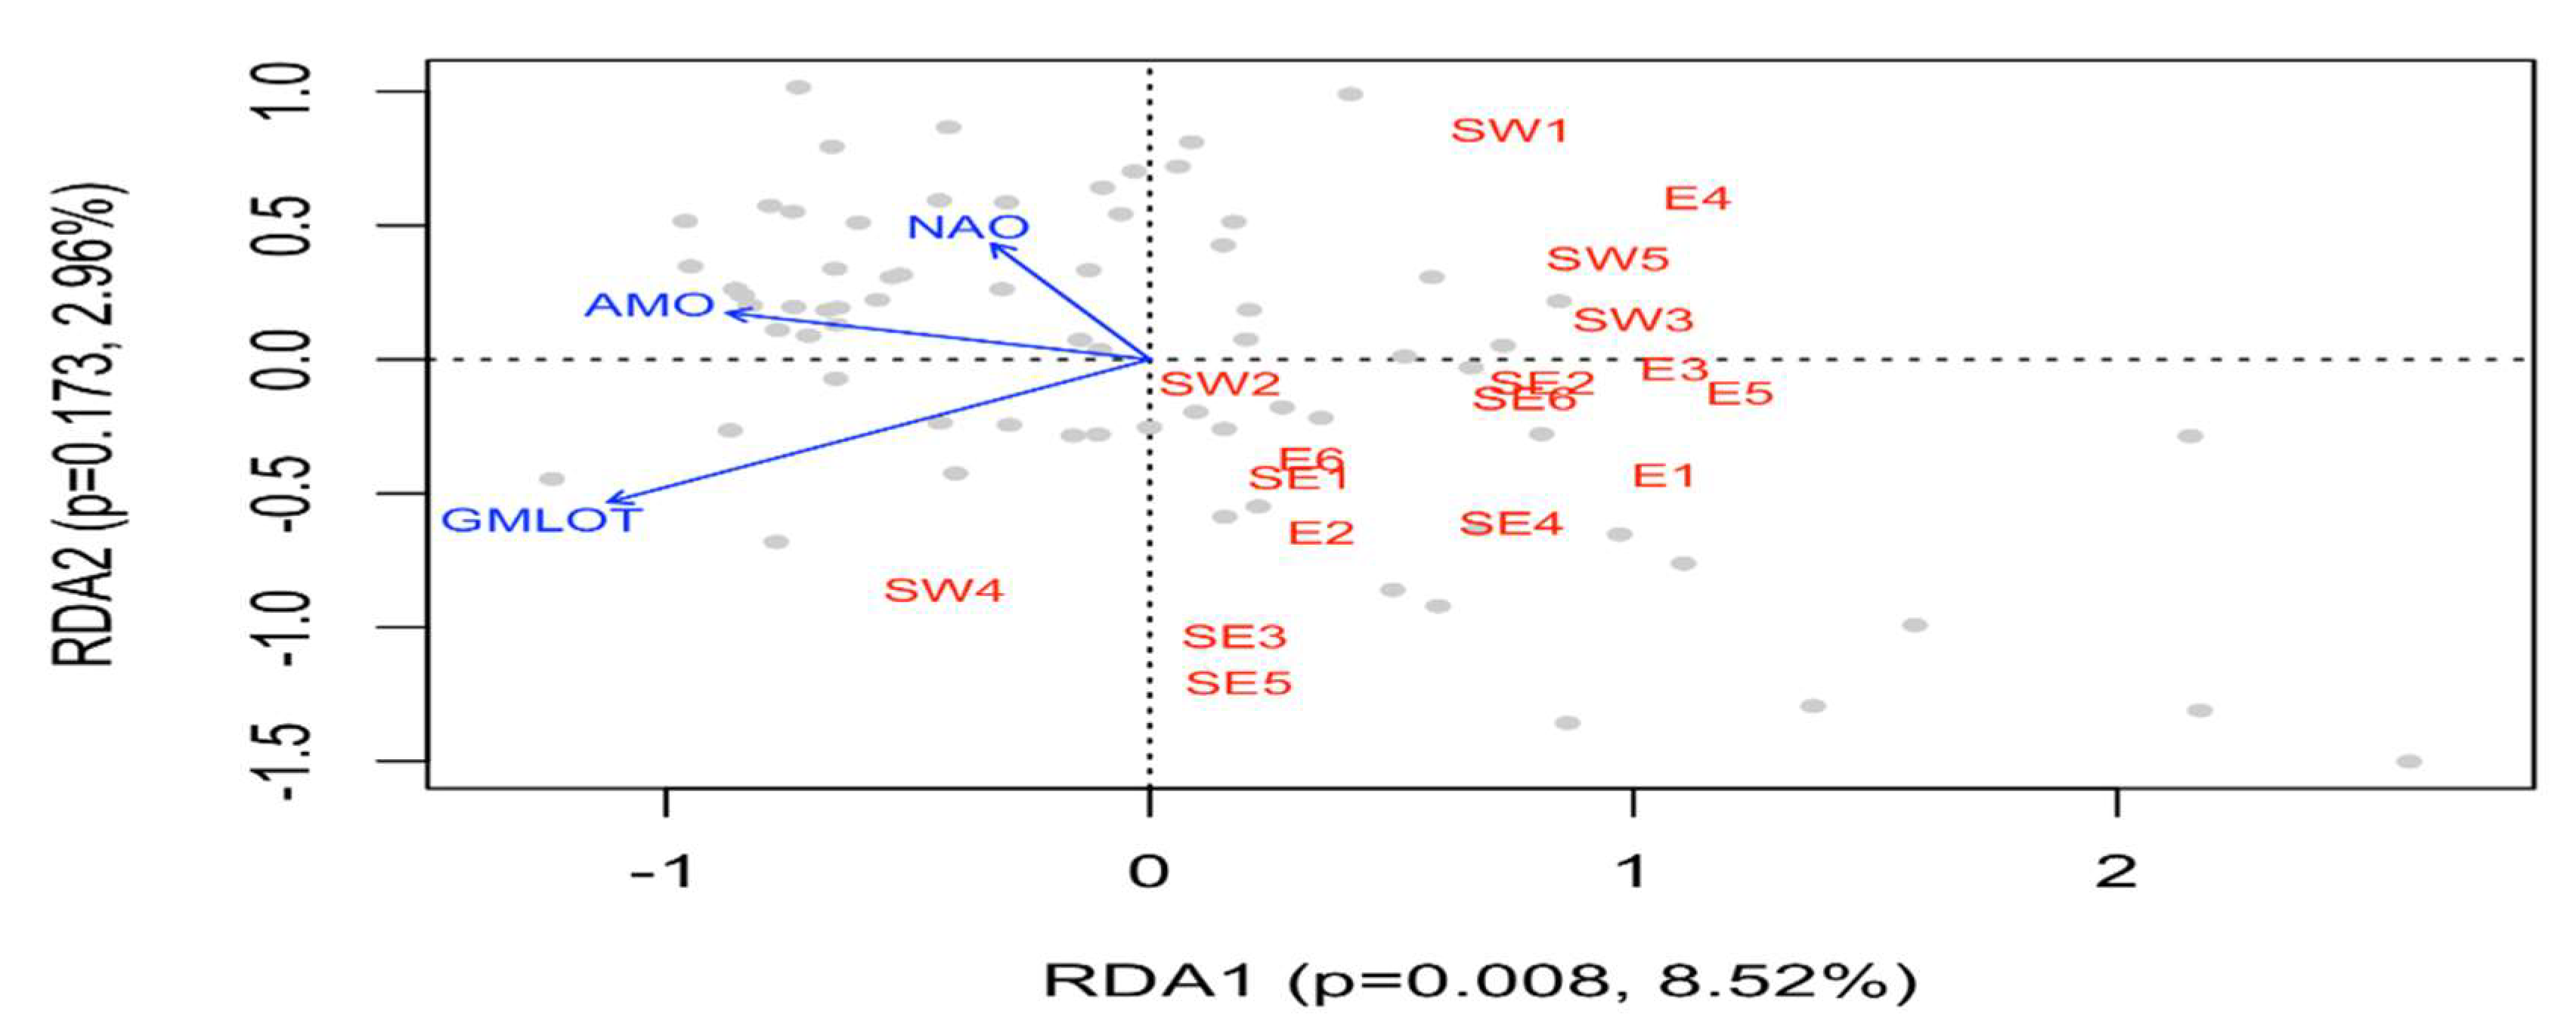
As for magnitude, Figure 7 shows that it is positively correlated with the GMLOT and PNA indices in winter. In summer, it is negatively correlated with GMLOT, AMO, and NAO indices (Figure 8). But the share explained by the first axis becomes much lower than in winter.

4. Discussion

4.1. Spatial Variability of the 7-Day Low-Flow Timing

Regarding the spatial variability of 7-day low-flow timing, correlation analysis revealed a negative correlation between the dates of occurrence of 7-day low flows and agricultural areas in winter and summer. Indeed, 7-day low flows occur early in the season in the most agricultural watersheds. This early occurrence is explained by the runoff that occurs early in these agricultural basins, thus causing an early rise in water levels in the channels. This results in a consequent interruption of the low-flow period. Unlike in the summer season, during the winter season, the 7-day low-flow occurrence period is also negatively correlated with total rainfall and daily mean maximum temperatures. Winter rains cause an increase in flows, interrupting the low-flow period (early occurrence of 7-day low flows). This early interruption of the low-flow period is also caused by early snowmelt due to high daily maximum winter temperatures in the watersheds. In addition to these factors, in winter, the dates of 7-day low flows are rather positively correlated with forest surface area and drainage density of watersheds. Regarding forest areas, it is important to remember that in southern Quebec, the reduction in forest areas leads to an increase in the low-flow magnitude (e.g., [29]). It follows that the increase in forest areas in a watershed will have the impact of a decrease in the low-flow magnitude and the early occurrence in the season. This relationship should, theoretically, result in a negative correlation between forest areas and the dates of occurrence of low water flows. However, it is also important to remember that in Quebec, this positive correlation is explained by the fact that the most agricultural watersheds have fewer forest areas. This agriculture is practiced on the lowlands of Saint-Laurent, characterized by a relatively flat topography (low values of average slopes of watersheds). Low average slopes theoretically favor infiltration to the detriment of surface runoff, thus leading to a late occurrence (positive correlation) of low flows in the season. It follows that, from a hydrological point of view, the positive correlation observed between these two factors (forest areas and averages slopes) and the 7-day low-flow timing can be interpreted as a simple covariation, due to the same factor: agricultural surface areas
If we compare the factors that influence the spatial variability of the dates of occurrence of 7-day low flows with those that influence the magnitude of these flows, we observe that these two characteristics are not influenced by the same factors. Indeed, in summer, the magnitude of 7-day low flows is not correlated with any factor. In winter, this magnitude is positively correlated with the wetlands surface area and daily maximum temperatures, but negatively with the drainage density of the watersheds.

4.2. Temporal Variability of the 7-Day Low-Flow Timing

The application of three Mann–Kendall tests to the time series of the 7-day low-flow timing revealed few significant changes in their averages in winter (fewer than 20% of the stations analyzed) than in summer (more than 50% of the stations analyzed). However, during both seasons, these changes were characterized by a significant increase in the averages, i.e., a late occurrence of 7-day low flows in the season. Moreover, these changes were mainly observed in the southeastern hydroclimatic region, the most agricultural of the three hydroclimatic regions analyzed. These results are different from those obtained by [7], who conducted a similar study on the pan-Canadian scale during the period 1901 to 2003. These authors observed that in summer, most analyzed stations affected by a significant long-term trend were characterized by an early occurrence of 7-day low flows, except for stations located in western Canada and in the Atlantic provinces. This was also the case in winter for almost all stations in the country. As for Sadri et al. (2016) [10], in their study carried out on the scale of the United States, they detected very few changes in the dates of occurrence of 7-day low flows in both winter and summer. The divergence of the results of these studies can be partly explained by the difference in the period and duration of the hydrological series analyzed. Indeed, a significant trend can be detected in long-term series rather than in short-term series, and vice versa.
Furthermore, the differences in the long-term trend observed between rivers in the same hydroclimatic region could be explained by the differences in the hydrogeological characteristics of the aquifers that influence the characteristics of low flows (magnitude, timing, duration, frequency and variability). However, as already mentioned, quantitative data on these hydrogeological characteristics of the aquifers for many watersheds studied are not available. y climate index in winter. This lack of correlation could be attributed to the fact that during this season, the occurrence dates are influenced by several factors, as revealed by the analysis of their spatial variability. On the other hand, in summer, the 7-day low-flow occurrence dates are positively correlated with the global warming index (GMLOT). Indeed, the impacts of the increase in temperature reflected by this climate index are reflected in southern Quebec by an increase in rainfall during the four seasons [12]. This increase may delay the dates of occurrence of 7-day low flows, by the increase in the frequency of runoff throughout the year on the one hand, and by the increase in the levels of aquifers, which influence the duration of the low flow period, on the other hand. This last factor could explain the fact that changes in occurrence dates (late occurrence) were observed mainly in the southeastern hydroclimatic region, the most agricultural. It should be remembered that this hydroclimatic region has experienced a significant change in land use since 1950, following the modernization (mechanization and intensification) of agriculture. The impacts of this modernization resulted in a very significant decrease in cultivated areas [18]. These areas were reforested or abandoned as fallow land. On the hydrological level, this reduction in cultivated areas resulted in an increase in water infiltration, thus increasing the levels of aquifers in the most agricultural watersheds. This increase in aquifer levels could thus delay the occurrence of the lowest low flows. In this regard, the results of the analysis of the temporal variability of the magnitude of 7-day low flows (Table 4) clearly demonstrated that it is the southeastern hydroclimatic region, the most agricultural, which is characterized by a significant increase in magnitude in winter and summer, unlike the other two hydroclimatic regions, characterized rather by a decrease in this magnitude in summer. This decrease results from the decrease in the quantity of snow, the meltwater of which mainly influences summer low flows by recharging aquifers in spring [19].
Table 4. Results of three Mann–Kendall (MK) tests applied to time series of 7-day low-flow magnitude during the period 1950–2023.
RiversWinterSummer
MKSTPLTPMKSTPLTP
Zp-ValueZp-ValueZp-ValueZp-ValueZp-ValueZp-Value
Southeastern Hydroclimatologic Region
Châteaugay2.469 **0.0142.243 **0.0252.359 **0.01831.1290.2590.8140.4151.1120.266
Eaton1.773 *0.0762.062 **0.0390.7600.449−0.5180.604−0.9000.368−0.3880.702
Nicolet SW2.744 *0.0062.500 **0.0123.135 **0.0022.623 **0.0092.624 **0.0092.173 **0.029
Etchemin2.585 **0.0102.938 **0.0031.796 *0.0720.2890.772−0.1380.8900.3350.738
Beaurivage4.505 **0.0004.545 **0.0003.236 **0.0013.157 **0.0022.990 **0.0032.727 **0.006
Du Sud1.0780.2811.2050.2281.1330.257−1.3630.173−1.3860.166−1.6170.109
Eastern Hydrologic Region
Ouelle0.5190.6040.5010.6170.3050.761−1.745 *0.081−2.262 **0.024−2.022 **0.049
Du Loup4.326 **0.0004.634 **0.0002.142 **0.0320.6210.5350.2720.7860.3460.729
Trois-Pistoles3.929 **0.0003.919 **0.0002.971 **0.003−2.833 **0.005−2.891 **0.004−2.433 **0.015
Rimouski0.1030.9180.4240.6720.0560.956−5.068 **0.000−4.986 **0.000−3.718 **0.002
Matane2.319 **0.0202.719 **0.0071.3650.172−2.585 **0.010−2.843 **0.005−2.909 **0.004
Blanche4.616 **0.0004.624 **0.0002.850 **0.0040.9100.3630.7670.4431.0320.302
Southwestern Hydrologic Region
Du Nord1.969 *0.0492.053 **0.0402.150 **0.032−3.248 **0.001−3.329 **0.001−1.926 *0.055
Petite Nation3.705 **0.0003.681 **0.0003.770 **0.001−0.2430.809−0.2910.771−0.2440.814
L’Assomption0.9750.3291.3390.1810.5950.552−2.333 **0.020−2.672 **0.008−2.020 **0.049
Matawin1.0220.3070.7290.4660.4410.659−0.0280.9780.9480.343−0.0200.988
Vermillon2.462 **0.0142.115 **0.0352.013 **0.044−3.281 **0.001−3.415 **0.001−3.434 **0.001
STP = short-term persistence; LTP = long-term persistence; ** = statistically significant values at the 5% level; * = statistically significant values at the 10%; red = positive trend; blue = negative trend.
Furthermore, the rise in summer temperature also results in an increase in evapotranspiration. This has the effect of extending the duration of the low-flow period, thus causing the late occurrence of 7-day low flows in the season.

5. Conclusions

The impacts of global warming are reflected in a decrease in snowfall and its earlier melting during cold periods, but an increase in rainfall in all seasons. The impacts of these precipitation changes have been extensively studied regarding the spatiotemporal variability of minimum flow magnitude. However, there is still no study of these impacts on their timing, which is one of the five fundamental characteristics of streamflow. To address this gap, this study analyzed the factors underlying the spatiotemporal variability of this flow characteristic in winter and summer, in the context of climate change.
Regarding spatial variability, the correlation analysis shows that in both seasons, the dates of occurrence of 7-day low flows are negatively correlated with the agricultural surface area of the watersheds, due to the early runoff that shortens the duration of the low-flow period. In winter, these dates are also negatively correlated with the total amount of rainfall and daily mean maximum temperatures, but positively correlated with the forest surface area and average slopes of the watersheds.
Regarding temporal variability, the application of trend tests on the series of occurrence dates between 1950 and 2023 generally revealed a significant trend towards the late occurrence of 7-day low flows in the season. This trend was observed mainly in the most agricultural watersheds in summer, probably due to the increase in infiltration over time following the increase in rainfall on the one hand, and the decrease in agricultural areas since 1950 in favor of fallow land and forests, on the other hand. However, the differences in this long-term trend observed between rivers in the same hydroclimatic region could be explained by the differences in the hydrogeological characteristics of the groundwater tables of the watersheds for which quantitative data are not available, which applies to many of the watersheds analyzed. This constitutes a limitation of this study.
The analysis of the relationship between these occurrence dates and eight climate indices during the same period, using redundancy analysis, showed that in summer, the occurrence dates are mainly negatively correlated with the global warming climate index, probably due to a significant increase in rainfall. In winter, however, few changes in the long-term trend of the occurrence dates of 7-day low flows were observed. Moreover, these dates are not correlated with any climatic index during this season.
Comparing the factors of spatiotemporal variability of 7-day flow timing with those influencing their magnitudes revealed differences between these factors. Regarding spatial variability, the magnitude of 7-day low flows is positively correlated with wetlands surface area but negatively with watershed drainage density in winter. However, in summer, it is not correlated with any physiographic or climatic factor. Regarding temporal variability, an almost generalized increase in magnitude was observed in winter, due to early snowmelt and increased rainfall in autumn, which influence winter low flows. In summer, this increase in magnitude was observed only in the most agricultural watersheds, while in the least agricultural basins this magnitude decreased significantly over time, due to the amount of snow, which influences summer low flows through aquifer recharge during snowmelt. However, during both seasons, the magnitude is positively correlated with the global warming climate index.
This study demonstrated that the spatiotemporal variability of the timing and magnitude of 7-day low flows is not influenced by the same factors in winter and summer in southern Quebec. Finally, this study shows that the timing is much less sensitive to changes in climate change than the magnitude of low flows in southern Quebec.
Ecologically, the last months of the summer season (August and September), and, to a lesser extent, those of the winter season (March and April) are becoming increasingly warmer in Quebec. The increasingly late occurrence of low water flows risks amplifying the warming of river waters. This warming can thus affect water quality and the dynamics of river fauna and flora.

Supplementary Materials

The following supporting information can be downloaded at: https://www.mdpi.com/article/10.3390/atmos16091024/s1. Excel File: Summer-DATA-TIMING, Summer-DATA-FACTORS, Winter-DATA-Timing, Winter-DATA-FACTORS.

Funding

This research was funded by the Natural Sciences and Engineering Research Council of Canada (NSERC), grant number 261274/2019.

Data Availability Statement

The data presented in this study are available in Supplementary Materials (Excel File).

Conflicts of Interest

The author declares no conflict of interest.

References

  1. Poff, N.L.; Allan, J.D.; Bain, M.B.; Karr, J.R.; Prestegaard, K.L.; Richter, B.D.; Sparks, R.E.; Stromberg, J.C. The natural flow regime. A paradigm for river. Bioscience 1997, 47, 769–784. [Google Scholar] [CrossRef]
  2. Nilsson, C.; Svedmark, M. Basic principles and ecological consequences of changing water regimes: Riparian plant communities. Environ. Manag. 2002, 30, 468–480. [Google Scholar] [CrossRef]
  3. Beauchamp, M.; Assani, A.A.; Landry, R.; Massicotte, P. Temporal variability of the magnitude and timing of winter maximum daily flows in Southern Quebec (Canada). J. Hydrol. 2015, 529, 410–417. [Google Scholar] [CrossRef]
  4. Cunderlik, J.M.; Ouarda, T.B.M.J. Trend in the timing and magnitude of floods in Canada. J. Hydrol. 2009, 375, 471–480. [Google Scholar] [CrossRef]
  5. Déry, S.J.; Stahl, K.; Moore, R.D.; Whitfield, P.H.; Menounos, B. Detection of runoff timing changes in pluvial, nival, and glacial rivers of western Canada. Water Resour. Res. 2009, 45, W04426. [Google Scholar] [CrossRef]
  6. Hodgkins, G.A.; Dudley, R.W.; Huntington, T.G. Change in the timing of high river flows in New England over the 20th century. J. Hydrol. 2003, 278, 244–252. [Google Scholar] [CrossRef]
  7. Ehsanzadeh, E.; Adamowski, K. Trends in timing of low stream flows in Canada: Impact of autocorrelation and long-term persistence. Hydrol. Process. 2010, 24, 970–980. [Google Scholar] [CrossRef]
  8. Floriancic, M.G.; Berghuijs, W.R.; Molmar, P.; Kirchner, J.W. Seasonality and drivers of low flows across Europe and the United States. Water Resour. Res. 2021, 57, e2019WR026928. [Google Scholar] [CrossRef]
  9. Kormos, P.R.; Luce, C.H.; Wenger, S.J.; Berghuijs, W.R. Trends and sensitivities of low streamflow extremes to discharge timing and magnitude in Pacific Northwest mountain streams. Water Resour. Res. 2016, 52, 4990–5007. [Google Scholar] [CrossRef]
  10. Sadri, S.; Kam, J.; Sheffield, J. Nonstationarity of low flows and their timing in the eastern United States. Hydrol. Earth Syst. Sci. 2016, 20, 633–649. [Google Scholar] [CrossRef]
  11. Simeone, C.; McCabe, G.; Hecht, J.; Hammond, J.; Hodgkins, G.; Olson, C.; Wieczorek, M.; Woloch, D. Low-flow period seasonality, trends, and climate linkages across the United States. Hydrol. Sci. J. 2024, 69, 1387–1398. [Google Scholar] [CrossRef]
  12. Assani, A.A. Spatiotemporal variability of fall daily maximum flows in the southern Quebec (Canada) from 1930 to 2018. J. Flood Risk Manag. 2024, 17, e12971. [Google Scholar] [CrossRef]
  13. Brown, R.D. Analysis of snow cover variability and change in Québec, 1948–2005. Hydrol. Process. 2010, 24, 1929–1954. [Google Scholar] [CrossRef]
  14. Guerfi, N.; Assani, A.A.; Mesfioui, M.; Kinnard, C. Comparison of the temporal variability of winter daily extreme temperatures and precipitations in southern Quebec (Canada) using the Lombard and copula methods. Int. J. Climatol. 2015, 35, 4237–4246. [Google Scholar] [CrossRef]
  15. Yagouti, A.; Boulet, G.; Vincent, L.; Vescovi, L.; Mekis, E. Observed changes in daily temperature and precipitation indices for Southern Québec, 1960–2005. Atmos.-Ocean. 2008, 46, 243–256. [Google Scholar] [CrossRef]
  16. Assani, A.A. Comparison of Spatio-Temporal Variability of Daily Maximum Flows in Cold-Season (Winter and Spring) in Southern Quebec (Canada). Hydrology 2023, 10, 44. [Google Scholar] [CrossRef]
  17. Assani, A.A.; Zeroual, A.; Roy, A.; Kinnard, C. Spatio-temporal variability of seasonal daily minimum flows in the southern Quebec: Synthesis on the impacts of climate, agriculture and wetlands. Hydrol. Res. 2022, 53, 1494. [Google Scholar] [CrossRef]
  18. Ruiz, J. Modernization agriculture and agricultural land cover in Quebec (1951–2011). Cah. Géogr. Qué. 2019, 63, 213–230. (In French) [Google Scholar] [CrossRef]
  19. Kinnard, C.; Bzeouich, G.; Assani, A. Impacts of summer and winter conditions on summer river low flows in low elevation, snow-affected catchments. J. Hydrol. 2022, 605, 127393. [Google Scholar] [CrossRef]
  20. Berthot, L.; St-Hilaire, A.; Caissie, D.; El-Jabi, N.; Kirby, J.; Ouellet-Proulx, S. Environmental flow assessment in the context of climate change: A case study in Southern Quebec (Canada). J. Water Clim. Chang. 2021, 12, 3617. [Google Scholar] [CrossRef]
  21. Sneyers, R. On the Statistical Analysis of Series of Observations; Technical Notes, N°143; World Meteorological Organization: Geneva, Switzerland, 1990; 192p. [Google Scholar]
  22. Von Storch, H. Misuses of statistical analysis in climate research. In Analysis of Climate Variability; von Storch, H., Navarra, A., Eds.; Springer: Dordrecht, The Netherlands, 1995; pp. 11–26. [Google Scholar]
  23. Hamed, K.H.; Rao, A.R. A modified Mann-Kendall trend test for autococorrelated data. J. Hydrol. 1998, 204, 182–196. [Google Scholar] [CrossRef]
  24. Dinpashoh, Y.; Mirabbasi, R.; Jhajharia, D.; Abianeh, H.Z.; Mostafaeipour, A. Effect of short-term and long-term persistence on identification of temporal trends. J. Hydrol. Eng. ASCE 2014, 19, 617–625. [Google Scholar] [CrossRef]
  25. Fathian, F.; Dehghan, Z.; Bazrkar, M.H.; Eslamian, S. Trends in hydrological and climatic variables affected by four variations of the Mann-Kendall approach in Urmia Lake basin, Iran. Hydrol. Sci. J. 2016, 61, 892–904. [Google Scholar] [CrossRef]
  26. Kumar, S.; Duffy, C.J. Detecting hydroclimatic change spatio-temporal analysis of time series in Colorado River basin. J. Hydrol. 2009, 374, 1–15. [Google Scholar] [CrossRef]
  27. Yue, S.; Wang, C.Y. Regional streamflow trend detection with consideration of both temporal and spatial correlation. Int. J. Climatol. 2002, 22, 933–946. [Google Scholar] [CrossRef]
  28. Mazouz, R.; Assani, A.A.; Rodríguez, M.A. Application of redundancy analysis to hydroclimatology: A case study of spring heavy floods in southern Québec (Canada). J. Hydrol. 2023, 496, 187–194. [Google Scholar] [CrossRef]
  29. Lavigne, M.-P.; Rousseau, A.N.; Turcotte, R.; Laroche, A.-M.; Fortin, J.-P.; Villeneuve, J.-P. Validation and use of a semidistributed hydrological modeling system to predict short-term effects of clear-cutting on a watershed hydrological regime. Earth Interact. 2004, 8, 1–19. [Google Scholar] [CrossRef]
Figure 1. Location of the stations of the analyzed rivers.
Atmosphere 16 01024 g001
Figure 2. Interannual variability of summer 7-day (Q7) low-flow timing dates in the southeastern hydroclimatic region. Châteaugay River: red; Eaton River: yellow; Nicolet SW River: green; Etchemin River: black; Beaurivage River: blue; Du Sud River: gray.
Atmosphere 16 01024 g002
Figure 3. Interannual variability of summer 7-day (Q7) low-flow timing in the eastern hydroclimatic region. Ouelle River: yellow; Du Loup River: red; Trois-Pistoles River: green; Rimouski River: black; Matane River: gray; Blanche River: blue.
Atmosphere 16 01024 g003
Figure 4. Interannual variability of summer 7-day (Q7) low flow timing in the southwestern hydroclimatic region. Petite Nation River: blue; Du Nord River: red; L’Assomption river: gray; Matawin river: yellow; Vermilon river: black.
Atmosphere 16 01024 g004
Figure 5. Correlation calculated using redundancy analysis between the dates of occurrence of 7-day low flows and the eight climate indices in winter. E, SE, SW = hydrological stations; gray dots represent years. In winter, the flow occurrence dates are not correlated with any climate indices.
Atmosphere 16 01024 g005
Figure 6. Correlation calculated using redundancy analysis between the dates of occurrence of 7-day low flows and the eight climate indices in summer. E, SE, SW = hydrological stations; gray dots represent years.
Atmosphere 16 01024 g006
Figure 7. Correlation calculated using redundancy analysis between the 7-day low-flow magnitude and the eight climate indices in winter. E, SE, SW = hydrological stations; gray dots represent years.
Atmosphere 16 01024 g007
Figure 8. Correlation calculated using redundancy analysis between the 7-day low-flow magnitude and the eight climate indices in summer. E, SE, SW = hydrological stations; gray dots represent years.
Atmosphere 16 01024 g008
Table 1. Analyzed rivers.
RiversCodeIDDrainage Area (km2)Latitude
(N)
Longitude
(W)
Southwestern Hydroclimatic Region
Petite NationSW140406133145°47′75°05′
Du NordSW240110116345°31′74°20′
L’AssomptionSW352219128646°02′73°26′
MatawinSW450119138746°40′73°55′
VermillonSW550144266247°39′72°57′
Southeastern Hydroclimatic Region
ChâteaugaySE130905249245°19′73°45′
EatonSE23023464645°28′71°39′
NicoletSE33010156245°47′71°58′
EtcheminSE423303115246°39′71°39′
BeaurivageSE52340170846°39′71°17′
Du SudSE62310682146°49′70°45′
Eastern Hydroclimatic Region
OuelleE12270479647°22′67°57′
Du LoupE222513104247°36′69°38′
Trois-PistolesE32230193048°05′69°11′
RimouskiE422003161548°24′68°33′
MataneE521601165548°46′67°32′
BlancheE6217022348°47′67°41′
Table 2. Correlation coefficients calculated between climatic, physiographic, and land use/land cover factors and the timing/magnitude of 7-day low flows in southern Quebec during the period 1950–2023.
WinterSummer
FactorsTimingMagnitudeFactorsTimingMagnitude
Physiographic factors
Drainage density (km/km2)−0.0588−0.5629 **Drainage density (km/km2)−0.2770−0.0057
Mean Slope (°)0.5652 **0.1471Mean Slope (°)0.39920.3092
Forest surface area (%)0.5291 **−0.0882Forest surface area (%)0.32040.1508
Agricultural surface area (%)−0.5229 **−0.3329Agricultural surface area (%)−0.5930 **−0.0211
Wetlands surface area (%)0.23800.6653 **Wetlands surface area (%)−0.1700−0.0243
Climatic factors
Winter total rainfall (mm)−0.5595 **0.3477Summer total rainfall (mm)0.38750.0429
Winter total snowfall (cm)0.2889−0.3947Summer daily maximum temperature (°C)−0.1700−0.0243
Winter total precipitation (mm)0.0885−0.2406
Winter daily maximum temperature (°C)−0.4906 *0.4628 *
March daily maximum temperature (°C)−0.24920.6579 **
** = statistically significant values at the 5% level; * = statistically significant values at the 10%; red = positive correlation; blue = negative correlation.
Table 3. Results of three Mann–Kendall (MK) tests applied to time series of 7-day low-flow timing during the period 1950–2023.
RiversWinterSummer
MKSTPLTPMKSTPLTP
Zp-ValueZp-ValueZp-ValueZp-ValueZp-ValueZp-Value
Southeastern Hydroclimatologic Region
Châteaugay−0.1170.9070.0430.966−0.9000.9342.194 **0.0282.119 **0.0341.675 *0.094
Eaton1.872 *0.0612.523 **0.0243.028 **0.0032.316 **0.0212.329 **0.0202.053 **0.040
Nicolet SW2.101 **0.0362.329 **0.0202.580 **0.0101.5270.1271.6240.1040.9800.327
Etchemin0.9480.3431.1190.2630.6450.5193.188 **0.0013.291 **0.0012.533 **0.011
Beaurivage0.3360.7370.3860.7000.3080.7581.0920.2751.0910.2751.0590.290
Du Sud0.9480.3430.9190.3580.7430.4582.185 **0.0292.124 **0.0342.153 **0.031
Eastern Hydrologic Region
Ouelle0.6260.5320.7000.4840.7460.4551.3490.1771.3950.1630.9620.336
Du Loup−0.9340.350−0.6520.514−0.6740.504−0.4670.641−0.3190.750−0.3820.708
Trois-Pistoles1.5220.1281.5190.1291.6370.1021.1030.2691.6330.1021.5940.111
Rimouski1.0740.2831.0420.2971.1470.2520.8780.3800.7570.4490.9620.336
Matane1.1860.2361.0410.2971.1930.255−0.4160.678−0.3000.764−0.4760.642
Blanche1.970 *0.0491.816 *0.0701.660 *0.0972.082 **0.0372.272 **0.0232.461 **0.038
Southwestern Hydrologic Region
Du Nord−0.8360.403−0.6340.527−1.0390.3040.3410.7370.1190.9050.4560.648
Petite Nation0.2900.7720.5290.5970.3030.762−0.8090.418−0.5240.600−0.5540.584
L’Assomption0.3320.7400.3190.7500.3320.7401.6210.1052.081 **0.0371.3290.184
Matawin0.1490.8810.2480.8040.0620.9511.816 *0.0691.900 *0.0572.856 **0.004
Vermillon−1.3340.182−1.4540.146−1.2560.2121.2750.2021.805 *0.0710.6440.519
STP = short-term persistence; LTP = long-term persistence; ** = statistically significant values at the 5% level; * = statistically significant values at the 10%; red = positive trend.
Disclaimer/Publisher’s Note: The statements, opinions and data contained in all publications are solely those of the individual author(s) and contributor(s) and not of MDPI and/or the editor(s). MDPI and/or the editor(s) disclaim responsibility for any injury to people or property resulting from any ideas, methods, instructions or products referred to in the content.