Article

Evaluation of the Reanalysis and Satellite Surface Solar Radiation Datasets Using Ground-Based Observations over India

1
Department of Atmospheric and Space Sciences, Savitribai Phule Pune University (SPPU), Pune 411007, India
2
Department of Physics, Fergusson College (Autonomous), Pune 411004, India
3
Department of Atmospheric Science, Environmental Science and Physics, University of the Incarnate Word, San Antonio, TX 78209, USA
4
Indian Institute of Tropical Meteorology (IITM), Pune 411008, India
5
India Meteorological Department, Ministry of Earth Sciences, Pune 411005, India
*
Authors to whom correspondence should be addressed.
Atmosphere 2025, 16(8), 957; https://doi.org/10.3390/atmos16080957
Submission received: 7 May 2025 / Revised: 8 July 2025 / Accepted: 9 August 2025 / Published: 11 August 2025
(This article belongs to the Section Climatology)

Abstract

Surface solar radiation (SSR) is a critical component of the Earth’s energy balance and plays a pivotal role in climate modelling, hydrological processes, and solar energy planning. In data-scarce regions like India, where dense ground-based radiation networks are limited, reanalysis and satellite-derived SSR datasets are often utilized to fill observational gaps. However, these datasets are subject to systematic biases, particularly under diverse sky and seasonal conditions. This study presents a comprehensive evaluation of four widely used SSR datasets: ERA5, IMDAA, MERRA2, and CERES, against high-quality in situ observations from 27 India Meteorological Department (IMD) stations, for the period 1985–2020. The assessment incorporates multi-scale temporal analysis (daily/monthly), spatial validation, and sky-condition stratification via the clearness index (Kt). The results indicate that CERES exhibits the best overall performance with the lowest RMSE (16.30 W/m2), minimal bias (–2.5%), and strong correlation (r = 0.97; p = 0.01), particularly under partly cloudy conditions. ERA5, with a finer spatial resolution, also performs robustly (RMSE = 20.80 W/m2; MBE = –0.8%; r = 0.94; p = 0.01), showing consistent agreement with observed seasonal cycles, though slightly underestimating SSR during monsoonal cloud cover. MERRA2 shows moderate overestimation (+4.4%) with region-specific bias variability, while IMDAA demonstrates persistent overestimation (+10.2%) across all conditions, highlighting limited sensitivity to atmospheric transparency. Importantly, this study reconciles apparent contradictions between monthly and sky condition-based bias analyses, attributing them to aggregation differences. While reanalysis datasets overestimate SSR during the monsoon on average, they tend to underestimate it under heavily overcast conditions. These insights are critical for guiding the selection and application of SSR datasets in solar energy modelling, SPV system design, and climate diagnostics across India’s heterogeneous atmospheric regimes.

1. Introduction

Solar radiation received at the Earth’s surface is a fundamental component of the Earth’s energy budget [1,2,3]. It directly influences atmospheric circulation, land–surface processes, and biosphere activity. The accurate estimation and understanding of solar radiation is thus indispensable for a wide range of disciplines including meteorology, agriculture, hydrology, and renewable energy planning. In developing countries, urgent and growing energy demands make solar energy a transformative solution [4,5,6]. With its abundant availability and scalability, solar power holds immense potential to bridge the energy access gap, especially in remote and underserved regions. It not only offers a sustainable alternative to fossil fuels but also empowers communities by driving economic development and reducing environmental impacts. Projections suggest that nearly 85 percent of global energy generation is projected to stem from renewables by 2050, underscoring the transformative potential of solar energy (https://www.un.org/en/climatechange/raising-ambition/renewable-energy, last accessed on 30 January 2025).
In recent decades, surface solar radiation (SSR) has gained attention due to its significant role in both scientific research and practical applications [2,3,4]. SSR refers to the total downward shortwave radiation that reaches the Earth’s surface. It comprises both direct solar radiation (coming straight from the Sun) and diffuse radiation (scattered by molecules, aerosols, and clouds in the atmosphere). Unlike top-of-atmosphere (TOA) solar radiation, SSR reflects the atmospheric modulation of solar energy, and is therefore the most relevant form of solar radiation for surface-based applications, particularly in energy resource assessments, agriculture, and hydrology. Climate change also affects the frequency and intensity of cloud cover and regional circulation patterns, further modulating SSR at the surface. Studies have shown that shifts in SSR due to climate forcing can influence agricultural productivity, hydrological cycles, and solar energy potential, underscoring the importance of reliable radiation data in climate impact assessments [7]. Climate studies increasingly rely on long-term radiation datasets to analyze multi-decadal trends such as “global dimming” and “brightening,” phenomena attributed primarily to changes in atmospheric aerosol concentrations, cloud properties, and land use patterns [8,9,10,11,12]. Moreover, in the context of climate adaptation and mitigation, reliable SSR estimates are critical for solar energy resource assessments and infrastructure design [13,14,15]. The development of solar photovoltaic (SPV) systems, in particular, relies heavily on accurate estimates of both the spatial and temporal availability of SSR [16,17]. Indeed, beyond photovoltaics, several technologies leverage SSR data to enhance solar energy utilization. These include concentrated solar power (CSP), which relies on accurate SSR to generate thermal energy; solar thermal systems, where SSR is critical for designing water heating and space heating systems; and agrivoltaics and solar greenhouses [18], which use SSR to balance crop lighting with energy production. India, being located within the tropical and subtropical belt, experiences high solar insolation throughout the year, positioning it as one of the most favorable regions globally for harnessing solar energy. Recognizing this potential, solar energy has emerged as a cornerstone of India’s renewable energy policy, with ambitious targets set under the National Solar Mission (https://pib.gov.in/PressReleaseIframePage.aspx?PRID=2094992#, last accessed on 30 January 2025). However, achieving these targets and optimizing the solar infrastructure demands the accurate and high-resolution mapping of SSR. Given the country’s diverse climatic regimes, from the arid deserts of Rajasthan to the humid tropics of the Western Ghats and the cloud-prone north-eastern zone, location-specific representative radiation datasets are crucial. Despite the importance of SSR data, ground-based observations in India are limited in both spatial density and temporal continuity. Although the India Meteorological Department (IMD) maintains a network of solar radiation monitoring stations, their coverage is sparse, particularly in geographically remote or meteorologically complex regions. This limited observational network poses significant challenges in developing consistent, long-term climate datasets based solely on in situ measurements.
To address these limitations, several approaches have been developed to estimate SSR in data-scarce regions. Among these, satellite-based retrievals and atmospheric reanalysis datasets have become prominent due to their broad spatial coverage, long-term data availability, and relatively high temporal resolution. Reanalysis datasets, developed by integrating satellite data and ground-based observations through data assimilation systems, offer a promising alternative. These datasets offer coherent, spatially continuous, and temporally extensive records of key atmospheric variables, including SSR. Global reanalysis products such as European Centre for Medium-Range Weather Forecasts Reanalysis v5 (ERA5), Modern-Era Retrospective analysis for Research and Applications v2 (MERRA-2), and the regional product Indian Monsoon Data Assimilation and Analysis (IMDAA) have seen increasing usage in climate and energy research over India [8,9,15,19].
Nonetheless, reanalysis-derived SSR values are often prone to biases due to model limitations in representing clouds, aerosols, water vapor, and surface albedo [19,20,21,22]. SSR is not directly assimilated in most reanalysis systems but is derived using radiative transfer models embedded within the numerical weather prediction (NWP) frameworks. Consequently, inaccuracies in the simulation of cloud–aerosol interactions or surface properties can lead to systematic errors. Several validation studies have documented such biases across different regions, emphasizing the need for regional validation. For instance, Jiang et al. [23] evaluated the performance of ERA5 across China and reported that while the dataset exhibits strong spatial and temporal consistency, it consistently overestimates total and direct solar radiation by ~10–15 W/m2, while underestimating the diffuse component, particularly under cloudy sky conditions. These discrepancies were largely attributed to limitations in cloud representation within the model’s radiative transfer schemes. Similar issues were observed in Europe by Urraca et al. [19], who evaluated both ERA5 and COSMO-REA6 against high-quality ground-based measurements. Their analysis revealed spatially heterogeneous biases, with ERA5 overestimating global SSR by up to 20 W/m2 in certain regions. Their study also linked these errors to inaccuracies in simulating cloud–aerosol interactions and emphasized that reanalysis models often struggle under variable sky conditions. MERRA-2, which incorporates advanced radiative transfer algorithms and assimilates aerosol optical depth (AOD) from satellite-based observations, is often considered better suited for capturing aerosol–radiation interactions. However, validation efforts by Stamatis et al. [24] described that MERRA-2 still exhibits significant biases. When compared to ground observations from the Global Energy Balance Archive (GEBA) and the Baseline Surface Radiation Network (BSRN), MERRA-2 was found to overestimate SSR by 5–25 W/m2 on average, with errors varying by location and season. Although the dataset performs reasonably well in capturing interdecadal trends, these biases limit its direct applicability without correction. Collectively, these studies underscore the fact that reanalysis datasets, while valuable for their spatiotemporal continuity and coverage, are not universally reliable and must be regionally validated before being used for applications. In addition to reanalysis datasets, satellite-based products such as those from the Clouds and the Earth’s Radiant Energy System (CERES) offer an alternative approach for estimating SSR. However, like reanalysis products, CERES-derived SSR estimates are also subject to uncertainties [25,26]. These stem primarily from challenges in cloud detection, variability in aerosol concentrations, and assumptions related to surface albedo, all of which can introduce significant errors under certain atmospheric conditions.
Despite the growing body of studies in the literature on SSR dataset evaluation, studies focused specifically on the Indian region remain limited. The unique geographical setting of India, encompassing coastal areas, mountainous terrain, urban–industrial belts, and high aerosol load regions, poses complex challenges for modelling SSR. The country’s strong monsoonal variability, persistent cloud cover during significant portions of the year, and elevated anthropogenic and natural aerosol loads introduce substantial spatiotemporal heterogeneity in SSR, which often undermines the reliability of model-based estimates. Although reanalysis products such as ERA5 and MERRA-2 have been extensively evaluated across Europe, North America, and East Asia, their performance over South Asia, particularly India, remains under-investigated. The IMDAA dataset, developed with a special focus on the Indian monsoon system, has yet to undergo thorough validation in terms of its SSR estimates. Similarly, the performance of satellite datasets like CERES in capturing surface radiation fluxes under varying Indian cloud regimes and aerosol conditions is still uncertain. Given these gaps, there is a pressing need to systematically evaluate the performance of multiple reanalysis and satellite datasets over India using high-quality ground-based SSR measurements. Such evaluation will help identify systematic biases, improve our understanding of regional radiative processes, and guide the selection or calibration of datasets for use in solar energy modelling, climate analysis, and hydrological simulations.
The present study addresses this need by conducting a comprehensive evaluation of SSR estimates from four widely used datasets: ERA5, IMDAA, MERRA-2, and CERES satellite observations, against ground-based observations from the IMD’s solar radiation network. The analysis spans daily, monthly, and yearly timescales and incorporates sky condition stratification using clearness index thresholds, as well as regional bias diagnostics to assess spatial consistency and sensitivity across India’s diverse climatic zones. The specific objectives of this study are as follows: (a) to identify systematic biases and evaluate the statistical performance of SSR estimates from reanalysis and satellite-derived datasets across the Indian subcontinent, by comparing them against high-quality IMD station observations; (b) to examine the influence of different sky conditions on SSR estimation, by stratifying performance using the clearness index, thereby assessing each dataset’s sensitivity to atmospheric transparency; (c) to examine spatial heterogeneity in dataset performance, identifying region-specific biases and variations linked to geographical and climatic diversity across India; (d) to identify the dataset(s) most suitable for SSR-based solar energy assessments, high-resolution modelling, based on their accuracy, spatial representativeness, and responsiveness to sky conditions in the Indian context.
This study is unique in its pan-India scope and multi-dataset comparative framework. While the core statistical techniques are well established, the novelty lies in the integrated assessment approach; it is the first to simultaneously benchmark multiple global and regional datasets across India using long-term observational records, provide a national-scale classification of SSR bias characteristics, and link performance to application-specific use cases. By delivering actionable guidance on dataset suitability under varying sky and climate conditions, the results contribute to improved dataset selection, model calibration, and solar infrastructure planning. Given India’s leadership role in global solar energy expansion, the outcomes of this study have direct implications for national energy infrastructure planning, renewable integration strategies, and climate resilience efforts. Additionally, by comparing reanalysis datasets with high-quality IMD station observations, this study contributes to the global efforts of dataset validation and helps strengthen the case for improving data assimilation and cloud–aerosol parameterizations in future reanalysis generations.

2. Materials and Methodology

2.1. Study Region and Climate

This study focuses on the Indian subcontinent, which spans approximately from 7° N to 38° N latitude and from 68° E to 98° E longitude. This region encompasses a wide variety of topographical and climatic zones, including arid deserts, semi-arid plains, tropical and subtropical forests, coastal regions, and high-altitude mountainous terrain. The Indian climate is predominantly influenced by the seasonal monsoon system, which brings intense cloud cover and precipitation between June and September, significantly affecting the magnitude and variability of SSR [IMD Report 2011, https://metnet.imd.gov.in/docs/imdnews/ANNUAL_REPORT2011English.pdf, last accessed on 30 January 2025]. Although there is regional and interannual variation in the exact onset and withdrawal of the monsoon, the June–September window is widely recognized in climatological studies as the core monsoon period, given that it accounts for the majority of annual rainfall and associated reductions in atmospheric transparency. This standardized definition has been adopted in several previous studies [27,28] and enables consistency and comparability in seasonal analyses across datasets and regions. India’s diverse atmospheric conditions, ranging from high aerosol loads in the Indo-Gangetic Plain to frequent orographic clouds in the Western Ghats and Northeast India, make it a complex but ideal setting for evaluating the performance of reanalysis and satellite-based SSR datasets. This spatial heterogeneity presents challenges to accurate SSR modelling and underscores the necessity for region-specific validation of global datasets.

2.2. Ground-Based Observations from IMD Network

To assess the accuracy of reanalysis and satellite-derived SSR estimates, high-quality ground-based observations from the IMD solar radiation monitoring network are used as reference data. IMD operates more than 40 solar radiation observatories strategically distributed across the country. These stations record essential solar radiation parameters, including global solar radiation (represented as SSR in this study) and diffuse solar radiation, using Class I and Class II pyranometers. The pyranometers operate in the spectral range of 285–4000 nm and conform to the guidelines prescribed by the World Meteorological Organization (https://www.weather.gov/media/epz/mesonet/CWOP-WMO8.pdf, last accessed on 20 March 2025). All radiation instruments across the network are regularly calibrated and maintained by the Radiation Laboratory of IMD, Pune, which serves as both the National Radiation Centre for India and the WMO Regional Radiation Centre for Asia. Notably, 14 IMD stations have been recognized by the World Radiation Data Centre (WRDC) and actively contribute to its global database, thereby supporting international efforts in climate monitoring and solar energy research (https://community.wmo.int/en/world-radiation-data-centre, last accessed on 20 March 2025). For more details on the IMD solar radiation network, we refer to https://imdpune.gov.in/library/public/Solar%20Radiant%20Energy%20Over%20India.pdf, last accessed on 20 March 2025, and Sudeepkumar et al. [29].
For the present study, a subset of 27 IMD stations was selected based on the availability, completeness, and temporal continuity of SSR records. The geographical distribution of the stations is shown in Section 3.1, and their primary attributes are provided in Table 1. This subset includes data from both WRDC-recognized stations and other high-quality non-WRDC stations. The selected stations represent a broad geographical spread, encompassing the major climatic zones: arid and semi-arid zones (e.g., Rajasthan, Gujarat); tropical and sub-tropical monsoon zones (e.g., Maharashtra, Kerala); temperate and hilly regions (e.g., Uttarakhand, Himachal Pradesh); high-aerosol-load regions (e.g., Indo-Gangetic Plains: Delhi, Lucknow); coastal regions (e.g., Chennai, Mumbai). All ground-based SSR data provided by IMD have been subjected to quality control procedures following WMO standards at the time of data processing and dissemination. However, to maintain consistency and enable direct comparison with reanalysis and satellite-derived datasets, an additional quality screening was applied in this study. The screening followed the recommended thresholds established by the BSRN (as detailed in Section 2.4), which included the removal of outliers and temporal aggregation of data to daily mean values. The IMD SSR datasets were obtained from the official IMD portal (https://dsp.imdpune.gov.in, last accessed on 30 January 2025).

2.3. Reanalysis and Satellite Datasets

The following four SSR datasets were selected for evaluation due to their global availability, high spatiotemporal resolution, and extensive use in energy and climate research:

2.3.1. ERA5

ERA5 is the fifth-generation atmospheric reanalysis product from the European Centre for Medium-Range Weather Forecasts (ECMWF). ERA5 offers a spatial resolution of 0.25° × 0.25° (~31 km), a higher temporal resolution of hourly data, and an increased number of vertical model levels (137). It employs a 12 h 4D-Var data assimilation scheme within the Integrated Forecast System (IFS Cycle 41r2), incorporating a broader and more diverse set of observational data sources [30,31]. The SSR variable used in this study is the surface solar radiation downward (SSRD) with units in joules per square meter (J/m2). This parameter represents the total incoming shortwave radiation (including direct and diffuse components) reaching the Earth’s surface. These values were converted from J/m2 to watts per square meter (W/m2) by dividing the accumulated energy by the number of seconds in each interval (3600 s for hourly data). The dataset used in this study covers the period from 1980 to 2020 and downloaded via the ECMWF Climate Data Store (CDS) using the official API (https://cds.climate.copernicus.eu/datasets/reanalysis-era5-single-levels?tab=overview, last accessed on 10 January 2025).

2.3.2. MERRA2

MERRA2 is the second generation of NASA’s Modern-Era Reanalysis for Research and Applications, produced by the Global Modelling and Assimilation Office (GMAO). MERRA2 uses the Goddard Earth Observing System Model Version 5 (GEOS-5) atmospheric general circulation model with a 3D-Var data assimilation scheme updated every 6 h. The dataset provides global coverage with a native horizontal resolution of 0.5° latitude × 0.625° longitude and delivers surface radiation products at hourly temporal resolution [32]. For this study, the surface net shortwave flux downward (SWGNT) (which represents the SSR) variable was used, representing the average incoming shortwave radiation at the surface for each hourly interval, expressed in W/m2. The selected analysis period for MERRA2 spans from 1980 to 2020. The MERRA2 data were accessed from the NASA GES DISC portal using the Giovanni interface and OpenDAP services (https://giovanni.gsfc.nasa.gov/giovanni/, last accessed on 10 January 2025).

2.3.3. IMDAA

The IMDAA is a high-resolution regional reanalysis dataset specifically developed to address the limitations of course-resolution global reanalyses in representing regional and mesoscale atmospheric processes over the Indian subcontinent. IMDAA was jointly developed by the National Centre for Medium Range Weather Forecasting (NCMRWF), the IMD, and the UK Met Office, under the framework of the National Monsoon Mission (NMM) of the Ministry of Earth Sciences (MoES), Government of India. Unlike global reanalysis products, which typically operate at spatial resolutions of ~30–100 km, IMDAA leverages a 12 km horizontal resolution (0.12° × 0.12°) regional modelling system based on the Met Office Unified Model (UM) and a four-dimensional variational (4D-Var) data assimilation scheme. The model domain extends beyond the Indian landmass to adequately represent large-scale circulations influencing the Indian monsoon system. The product provides hourly outputs for a range of surface and atmospheric variables [33]. For the present study, the variable of interest is the surface downward shortwave radiation flux (W/m2), which represents the SSR on a horizontal plane. The hourly data were extracted from NCMRWF official portal (https://rds.ncmrwf.gov.in/, last accessed on 10 January 2025). Due to its high spatial and temporal resolution and its focus on capturing Indian monsoon dynamics, IMDAA offers a valuable tool for regional climate analysis and solar energy assessments over India. However, to date, its performance for SSR estimation has not been comprehensively evaluated against observed station data, making this study one of the first efforts to systematically validate the dataset in that context.

2.3.4. CERES

The CERES is a flagship satellite mission developed and maintained by the NASA Langley Research Centre to measure the Earth’s radiation budget and provide global observations of radiative fluxes at the top of the atmosphere, within the atmosphere, and at the surface. It forms part of NASA’s Earth Observing System (EOS), utilizing instruments aboard several satellite platforms including Terra, Aqua, and Suomi NPP. Among its various products, the CERES Synoptic (SYN) Edition 4A (Ed4A) dataset is specifically designed to provide continuous, gridded estimates of surface and TOA fluxes with 1° × 1° (~110 km) spatial resolution and hourly temporal frequency. It integrates high-frequency cloud and radiative transfer model outputs, combining satellite observations from MODIS, geostationary imagers, and radiative transfer calculations to estimate solar radiation at the Earth’s surface [34]. For the present study, we used the surface downward shortwave flux (W/m2) from the CERES SYN1deg Ed4A product, which represents SSR covering the evaluation period 2001–2020 (due to availability). This variable includes both direct and diffuse solar radiation and serves as a satellite-based counterpart to the ground-based SSR measurements. The CERES dataset has been extensively validated at global and regional scales, demonstrating high accuracy in cloud-free conditions and offering robust estimates in data-sparse regions. However, its performance over aerosol-heavy and cloud-dominated environments, such as those frequently observed over the Indian subcontinent, requires further investigation. This study contributes to such efforts by evaluating CERES-derived SSR against high-quality in situ measurements from the IMD network across a diverse range of Indian climates and seasons. The CERES datasets were downloaded from https://ceres.larc.nasa.gov/data/, last accessed on 20 January 2025.

2.4. Methodology

2.4.1. Data Processing and Quality Control

To enable a robust and consistent assessment of datasets, namely ERA5, MERRA2, IMDAA, and CERES satellite products, against in situ observations from IMD, a comprehensive data pre-processing and quality control method was implemented. The steps outlined below ensured temporal and spatial consistency, minimized biases from inconsistent formats or units, and enhanced the overall reliability of the evaluation:
(a)
Temporal harmonization: Although reanalysis and satellite products utilized in this study, along with IMD station records, provide SSR data at sub-daily (e.g., hourly) resolution, all datasets in this study were harmonized to daily mean SSR values, calculated specifically for the daytime period from 06:00 h to 18:00 h local time. This approach was adopted to ensure temporal consistency and to capture the period of effective SSR. Hourly validation was avoided due to challenges associated with misalignment between the temporal intervals of model outputs and observational data, particularly discrepancies in the hourly midpoints across stations, as highlighted by Urraca et al. [35]. Furthermore, accurate validation at hourly resolution would require high-frequency (e.g., one-minute) ground observations, which are generally limited to specialized networks like the BSRN and are not available for most IMD stations. Importantly, as noted in previous studies, the bias remains stable from hourly to daily timescales if there are no missing data, as is typically the case for reanalysis products. However, absolute errors tend to be larger at hourly resolution due to increased temporal variability. Therefore, to ensure consistency and comparability across all datasets and to minimize uncertainties arising from temporal mismatch, all SSR values were aggregated to daily means prior to analysis.
(b)
Spatial collocation: To enable a point-to-point evaluation between gridded reanalysis/satellite products and ground-based IMD observations, spatial collocation was performed through interpolation. All gridded datasets, including ERA5, MERRA2, IMDAA, and CERES, have native spatial resolutions ranging from 0.12° to 1°, which are coarser than the precise geographical locations of IMD stations. Therefore, to match the station-based point observations, the SSR values from each gridded dataset were bilinearly interpolated to the exact latitude–longitude coordinates of each IMD station. Bilinear interpolation was chosen for its ability to balance computational efficiency with spatial accuracy [36,37]. Unlike nearest-neighbor methods, bilinear interpolation considers the values at the four surrounding grid points and estimates the value at the target point based on a weighted average, thereby preserving local spatial gradients. The interpolated SSR values at the precise station locations were then used consistently for all subsequent analyses in this study. By aligning the gridded data to station coordinates, this step ensures that the comparison between modelled and observed SSR is geographically representative and analytically robust. This is particularly important in a geographically diverse region like India, where SSR can vary significantly over short distances due to topography and atmospheric conditions. Accurate spatial collocation is therefore critical for minimizing spatial mismatch errors and for improving the robustness of subsequent statistical evaluations.
(c)
Time period alignment: To ensure consistency and comparability across all datasets, a common analysis period was selected based on the overlap between IMD station records and the temporal coverage of each gridded dataset. For the reanalysis products (ERA5, MERRA2, and IMDAA), the evaluation period was set to 1985–2020, aligning with the availability of long-term IMD ground-based observations. This extended period allows for a comprehensive assessment of multi-decadal variability and trends in SSR. In contrast, the CERES satellite dataset, which became operational in the early 2000s, was available only from 2001 onwards. Therefore, for the validation of CERES-derived SSR estimates, the analysis was restricted to the 2001–2020 period. By aligning the time periods of evaluation with both the availability of observational data and the operational spans of the respective datasets, this approach ensures that all comparisons are made on a consistent temporal basis.
(d)
Quality control: To ensure the reliability and physical plausibility of in situ SSR data from IMD station records, a rigorous quality control method was applied, incorporating established standards from the BSRN (https://epic.awi.de/id/eprint/30083/1/BSRN_recommended_QC_tests_V2.pdf, last accessed on 20 March 2025). This process was important for minimizing errors introduced by instrumentation faults, data recording issues, or physically implausible values. The BSRN quality control protocol provides well-defined thresholds for identifying both physically possible and extremely rare values of SSR. In this study, we adopted both physically possible and extremely rare limits for data screening. A lower threshold of −4 W/m2 was used to define the physically possible minimum, while −2 W/m2 was applied as the lower bound for extremely rare values. The upper limit (Ulimit) was computed using the following Equations (1) and (2), as described by previous studies [19,38]:
For physically possible limits: Ulimit = Sa × 1.5 × μ01.2 + 100 W/m2
For extremely rare limits: Ulimit = Sa × 1.2 × μ01.2 + 50 W/m2
where Sa = STD/AU2; STD is the solar constant (~1361 W/m2) adjusted for Earth–Sun distance; AU is the astronomical unit (relative Earth–Sun distance); and μ0 = cos (SZA), the cosine of the solar zenith angle (SZA). The Python pvlib library was used to compute the necessary astronomical parameters, including the solar SZA, ensuring accuracy in identifying the theoretical SSR limits for each station and time step. Additionally, daytime SSR values of 0 W/m2 occurring when the SZA was less than 90° (i.e., when the sun was above the horizon) were flagged as unrealistic and excluded, as these likely indicate sensor malfunctions or recording errors. Only days with complete coverage of 13 valid hourly measurements (06:00 h to 18:00 h local time) were retained for analysis, ensuring robust daily mean calculations without interpolation or imputation. This quality control procedure ensured that only physically realistic and observationally complete data were used, enhancing the robustness of the dataset comparisons and validation outcomes in this study.
(e)
Unit standardization: SSR values from different sources were originally expressed in different units. All SSR values were converted to a common unit of W/m2, for uniform comparison.

2.4.2. Evaluation Metrics

(a)
To quantitatively evaluate the performance of each reanalysis and satellite dataset relative to ground-based observations from IMD, a suite of widely accepted statistical metrics was employed. These metrics evaluate different aspects of agreement, including bias, error magnitude, and correlation, providing a comprehensive understanding of dataset performance across both temporal and spatial domains. The metrics used in this study include: the mean bias error (MBE), root mean square error (RMSE), mean absolute error (MAE), the Pearson correlation coefficient (r), bias (%), and the p-value associated with the correlation coefficient to assess its statistical significance. These statistical metrics are shown in Equations (3)–(7).
MBE = 1 n   i = 1 n ( X i Y i )
RMSE = 1 n i = 1 n ( X i Y i ) 2
MAE = 1 n   i = 1 n |   X i Y i |
r = i = 1 n X i X ¯   Y i Y ¯ i = 1 n ( X i X ¯ ) 2   i = 1 n ( Y i Y ¯ ) 2
Bias   ( % ) = M B E Y ¯ × 100
where Xi and Yi are the SSR products of reanalysis (or satellite) and in situ observed (by IMD) at time step i, respectively; X ¯ and Y ¯ are their corresponding mean values, respectively; and n is the number of data points.
MBE quantifies the average difference between estimated and observed values, indicating whether a dataset systematically overestimates or underestimates SSR. RMSE measures the overall magnitude of errors, with higher sensitivity to larger deviations, while MAE provides the average absolute difference, offering a more balanced view of error across all observations. The r evaluates the strength and direction of the linear relationship between observed and estimated values, reflecting how well the dataset captures temporal variability. Bias (%) normalizes the MBE against the mean observed value, enabling easier comparison across different stations and regions.
(b)
To further understand how each dataset performs under varying atmospheric conditions, the daily clearness index (Kt) was computed for each observation site. The clearness index is a dimensionless parameter that represents the ratio of SSR to the theoretical maximum at the top of the atmosphere (TOA). It effectively isolates the effects of atmospheric attenuation (such as clouds, aerosols, water vapor) by normalizing SSR against extra-terrestrial irradiance, thereby allowing for direct comparison across different geographical and temporal conditions.
The clearness index is calculated using the following formula:
K t = S D S T D  
where SD is the daily observed SSR (in W/m2) and STD is the solar constant (~1361 W/m2; extraterrestrial daily solar radiation) adjusted for Earth–Sun distance. For the calculation of STD, we refer to the equations as described by Duffie and Beckman [39].
Clearness index values range from 0 (very cloudy or overcast conditions) to 1 (clear sky conditions). In this study, mean Kt values observed across the Indian region ranged from 0.2 to 0.8, capturing a wide range of atmospheric transparency. To assess the sensitivity of each dataset to varying sky conditions, SSR performance was analyzed across different clearness index intervals. Specifically, the Kt values were stratified into three categories: clear sky (Kt ≥ 0.7), partly cloudy (0.4 ≤ Kt < 0.7), and cloudy sky (Kt < 0.4). This classification enabled a targeted evaluation of how well each dataset captures SSR variability under different atmospheric regimes, an important aspect for reliable solar energy resource assessment and climate-related applications.

3. Results

The evaluation of reanalysis and satellite-derived SSR datasets against IMD ground-based observations across India is structured into four key sections. First, the mean SSR climatology is analyzed to compare the general radiation patterns and highlight the differences between IMD station data and gridded datasets. Second, the statistical performance of each dataset is evaluated using standard metrics to quantify accuracy and temporal agreement. Third, the analysis explores the influence of sky conditions by examining dataset behavior across different clearness index (Kt) regimes. Finally, the fourth section presents a comparative summary of dataset-specific strengths and limitations, identifying the most suitable datasets for SSR estimation across varying climatic conditions in India.

3.1. Climatological Comparison of SSR: IMD Observations vs. Reanalysis and Satellite Datasets

Figure 1 compares the annual and monthly mean SSR across India as derived from daily averages for the period 1985–2020. The comparison includes ground-based observations from IMD and four gridded datasets: ERA5, IMDAA, MERRA2, and CERES (2001–2020).
Figure 1a shows annual mean SSR trends, comparing dataset performance in capturing variability. The IMD observations (black dashed line) show considerable year-to-year fluctuations ranging from ~345 to 400 W/m2. A statistically significant declining trend of −0.53 W/m2/year is evident in the IMD series, consistent with previously reported dimming due to increased aerosol loading and cloud cover post-2000 [8,15,29,40]. Among the datasets, ERA5 (blue line) shows the best agreement with IMD in both magnitude and interannual variability, with deviations typically within ±15 W/m2. ERA5 also captures the declining trend with a slope of −0.49 W/m2/year, indicating high temporal agreement.
In contrast, IMDAA (red line) consistently overestimates SSR across the entire time series, often exceeding 425 W/m2. IMDAA shows minimal sensitivity to observed interannual variations and exhibits an almost flat trend (+0.02 W/m2/year), indicating poor representation of aerosol–cloud interactions. MERRA2 (green line) performs moderately better, tracking broad variability but still maintaining a positive offset of around 20–30 W/m2 above IMD and a weak declining trend of −0.12 W/m2/year. Meanwhile, CERES (orange line), available from 2001 onward, underestimates IMD observations by 10–15 W/m2 but aligns well in terms of trend direction, showing a decline of −0.38 W/m2/year over the period 2001–2020. This decline is partially captured by ERA5 and CERES (2001–2020) but is largely absent in MERRA2 and IMDAA, which instead show stable or rising SSR trends.
Figure 1b extends this evaluation to the monthly scale, capturing seasonal dynamics in SSR. All datasets successfully reproduce the expected seasonal cycle: a steady increase from winter to a peak in April–May, followed by a monsoonal dip (June–September) and a mild recovery in October. However, significant differences in magnitude emerge upon closer inspection. ERA5, while tracking IMD well in clear-sky months (February–May), underestimates during the monsoon, likely due to conservative cloud optical properties. IMDAA again shows the strongest overestimation, especially during the pre-monsoon and monsoon months, where values surpass 520 W/m2 and stay elevated even in cloud-dominant months, suggesting an underestimation of atmospheric attenuation effects such as cloud cover and aerosols. MERRA2 captures the overall shape of the seasonal cycle but overestimates during high-insolation months (March–May) by ~30 W/m2 and shows reduced sensitivity to monsoonal suppression. CERES (2001–2020), while consistently underestimating SSR by ~10–20 W/m2 across all months, maintains strong temporal coherence with IMD and accurately captures the seasonal cycle, particularly the monsoonal dip.
Together, these analyses underscore that ERA5 and CERES emerge as the most reliable datasets, both in terms of annual trends and monthly fidelity to IMD observations. In contrast, IMDAA and MERRA2 exhibit consistent overestimation, with IMDAA being the least sensitive to cloud and seasonal variations. The ability of ERA5 and CERES to capture not only seasonal cycles but also longer-term trends underscores their suitability for solar energy applications, climate variability assessments, and model evaluation over India. For users requiring high-fidelity absolute values, such as in SPV yield estimation or radiation forcing studies, CERES and MERRA2 may require mild correction, while IMDAA demands significant bias adjustment across all temporal scales.
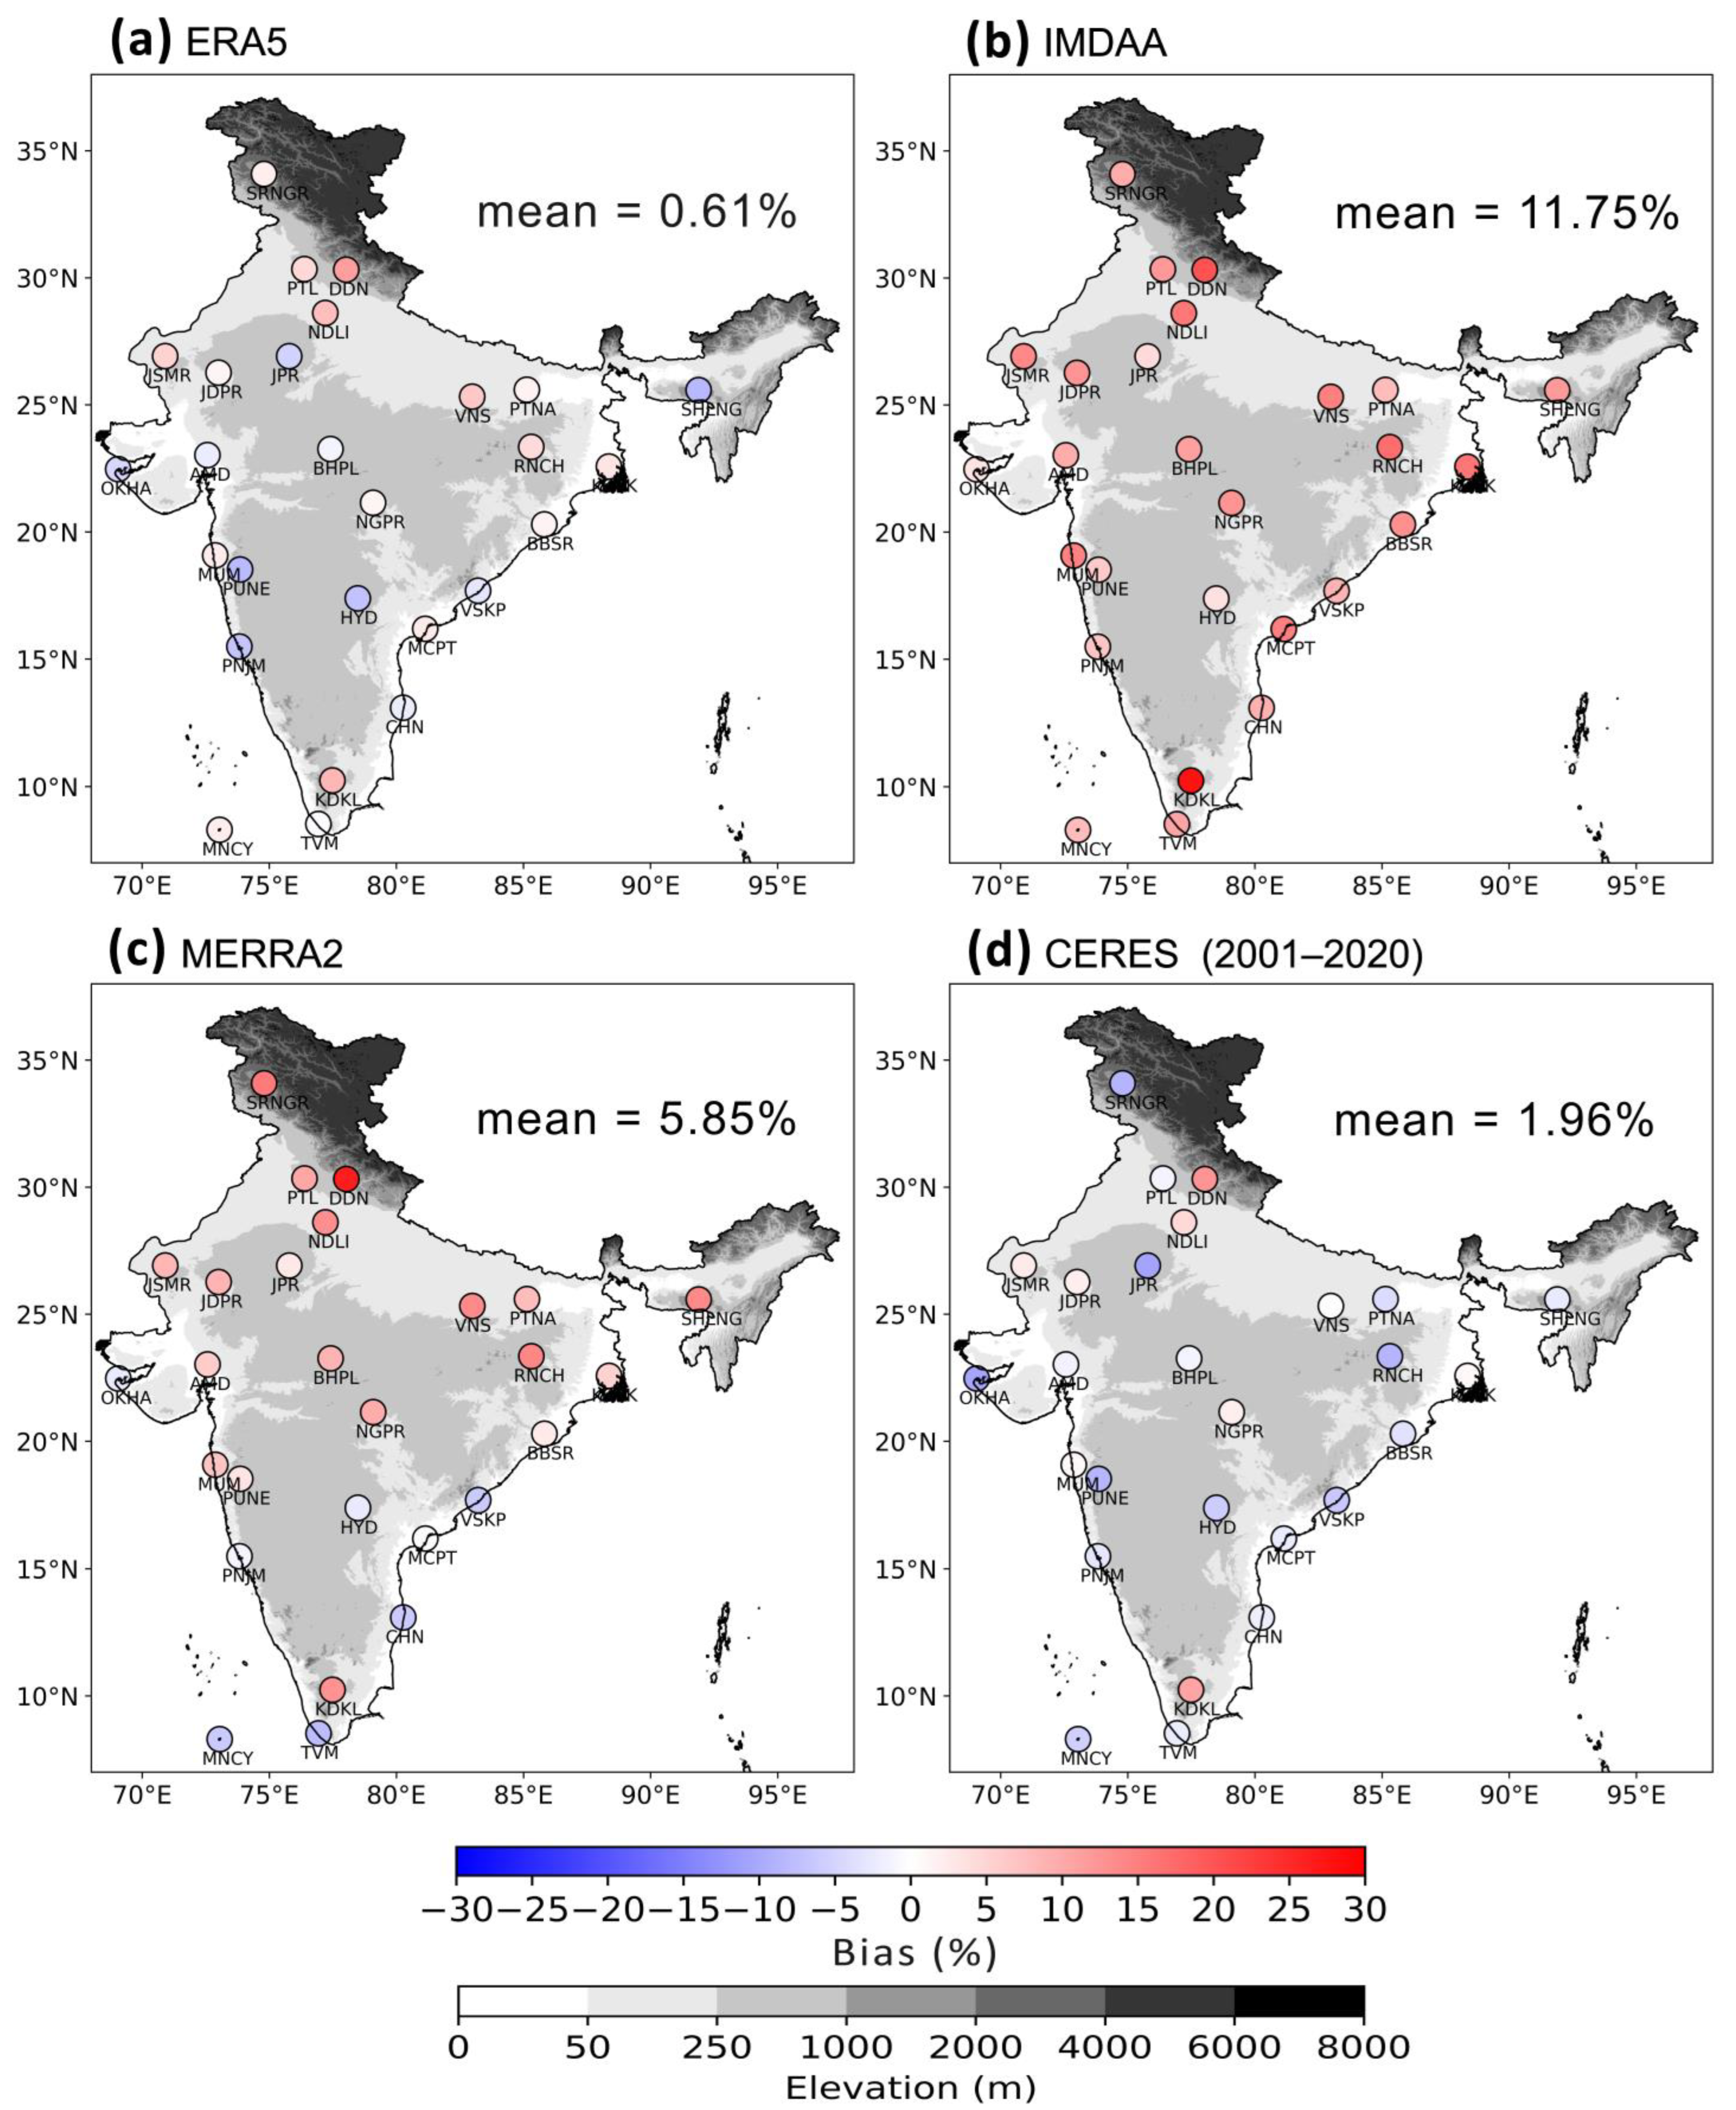
Figure 2 presents the spatial distribution of annual mean percentage bias in SSR, calculated between the IMD station observations and ERA5, IMDAA, and MERRA2, for the period 1985–2020, and CERES, for the period 2001–2020. Each subplot maps the bias at individual IMD stations, revealing dataset-specific tendencies in capturing observed SSR across diverse climatic regions of the country.
Starting with ERA5 (Figure 2a), the dataset has an excellent spatial agreement with IMD observations, with a low mean bias of +0.61%. The majority of stations, especially in central, western, and southern India (e.g., JPR, JDPR, AMD, MUM, PUNE, HYD, TVM) show biases within ±5%. Notable outliers such as NDLI (+7.67%), DDN (+11.28%), and KDKL (+8.46%) exhibit mild overestimation, particularly in regions influenced by complex terrain or variable cloud cover. Coastal and high-elevation sites such as MCPT (2.41%) and MNCY (−6.91%) are reasonably well captured, reinforcing ERA5’s suitability for widespread SSR estimation. The spatial pattern suggests that any residual bias is localized and possibly linked to seasonal cloud parameterization. In contrast, IMDAA (Figure 2b) shows a substantial and widespread positive bias, with a mean of +11.75%, the highest among all datasets. Overestimations exceed +20% at several southern and coastal stations including KDKL (+27.75%), CHN (+20.70%), VSKP (+18.96%), and MNCY (+18.52%). Northern and central sites such as DDN (+20.34%), NDLI (+15.76%), and PTL (+12.11%) also reflect consistently elevated biases. The uniformity and magnitude of overestimation across diverse geographic zones suggest that IMDAA systematically underrepresents atmospheric attenuation mechanisms such as aerosols and cloud optical depth.
MERRA2 (Figure 2c) exhibits a more moderate overestimation, with a mean bias of +5.85%. While several stations show positive deviations (e.g., NDLI: +13.38%, PTL: +10.84%, NGPR: +7.77%), others including MUM: +0.81%, PUNE: +3.16%, and PNJM: −1.82% lie close to observed values. A few coastal sites such as MCPT (−3.05%), VSKP (−2.34%), and TVM (−2.24%) show slight underestimation, indicating region-specific variations. The spatial distribution suggests that while MERRA2 tends to overestimate SSR, its bias is more regionally dependent than IMDAA, offering potential for localized calibration.
CERES (Figure 2d) exhibits the lowest overall bias among the datasets with a mean value of +1.96%, indicating a strong alignment with IMD observations. Many stations show biases within ±5%, including BBSR (+2.35%), JDPR (+3.20%), BHPL (−1.83%), and NGPR (+1.95%). A few stations like SRNGR (−8.71%), NDLI (+4.61%), and KDKL (+8.95%) reveal mild deviations. Importantly, CERES displays greater spatial neutrality, with less regional clustering of bias. The pattern suggests that CERES effectively handles varying sky conditions and elevation-influenced microclimates, making it a robust dataset for climatological SSR analysis across India’s diverse terrain.
Overall, the spatial analysis confirms that ERA5 and CERES offer the best agreement with IMD observations, with minimal regional deviations. MERRA2 shows moderate overestimation with slightly higher errors in the north and northwest, while IMDAA significantly overestimates SSR across all regions, necessitating careful bias correction before application.

3.2. Statistical Performance Evaluation

This section presents a comparative assessment of the statistical performance of ERA5, IMDAA, MERRA2, and CERES (2001–2020) datasets against IMD station observations. Key metrics such as Pearson correlation coefficient (r), root mean square error (RMSE), mean absolute error (MAE), and mean bias error (MBE) are used to evaluate how well each dataset captures daily and monthly SSR across India during the 1985–2020 period.

3.2.1. Daily Mean Evaluation

Figure 3 shows a set of density scatter plots comparing daily mean SSR values from the IMD observations with four gridded datasets, ERA5, IMDAA, MERRA2, and CERES, across India. Each panel depicts not only the alignment between estimated and observed SSR values but also the statistical fidelity of the datasets in reproducing daily fluctuations across diverse Indian climatic zones over thousands of data points. The density of data points is color-coded, with red indicating high-density clusters and blue representing sparser data.
In Figure 3a, ERA5 shows a strong correlation with IMD observations (r = 0.92; p = 0.01), indicating high consistency in capturing daily SSR variability. The RMSE is 28.48 W/m2 (7.5%), and the MAE is 22.33 W/m2 (5.9%), suggesting moderate absolute errors. The MBE of –7.33 W/m2 (–1.9%) indicates a mild underestimation bias, particularly notable in the mid to high SSR ranges. The majority of data points cluster closely along the 1:1 line, reflecting accurate magnitude and distribution, with deviations mostly within the 300–500 W/m2 range. These values are consistent with results reported by Jiang et al. [23] over China, where ERA5 daily solar radiation correlation was 0.91, with an RMSE of 28.5 W/m2 across 105 stations, especially in southern and eastern China. Similarly, Tahir et al. [41] found an RMSE of 47.4 W/m2 and MBE of −11.9 W/m2 for ERA5 in Balochistan, Pakistan, highlighting comparable performance across South Asia.
IMDAA (Figure 3b) performs less favorably. While the correlation is still strong (r = 0.90; p = 0.01), the RMSE jumps to 45.19 W/m2 (12.0%), and MAE to 37.15 W/m2 (9.6%), reflecting significantly higher errors compared to ERA5. The MBE of +34.26 W/m2 (9.2%) indicates a systematic overestimation of SSR. This bias is evident in the scatter plot, where the high-density core lies clearly above the 1:1 reference line. This echoes the findings of Tahir et al. [41] for other reanalysis datasets like Climate Forecast System Reanalysis by National Centres for Environmental Prediction (CFSR), which showed overestimations up to +57 W/m2 in high-irradiance regions. The IMDAA overestimation is most prominent over eastern and north-eastern regions of India, regions with typically high SSR and lower cloud cover, suggesting the dataset may over-transmit radiation under clear-sky regimes.
MERRA2 (Figure 3c), while also positively biased with MBE = +12.06 W/m2 (3.1%), offers a somewhat middle ground between ERA5’s conservative underestimation and IMDAA’s aggressive overestimation. The spread of points is slightly broader, indicating greater variability in daily estimates. This moderate positive bias is consistent with results from Du et al. [42], who found MERRA2 overestimated SSR across 98 stations in China with MBEs ranging from +11.6 to +22.1 W/m2. The overestimation was especially significant in the summer months and in the North China Plain, similar to the Indian Indo-Gangetic Plains in solar climatology. The slightly flattened regression at higher values here also supports Stamatis et al. [24], who observed MERRA2’s degradation under intense solar flux due to cloud parameterization limitations.
CERES (Figure 3d), though based on satellite retrievals rather than data assimilation, demonstrates the most balanced performance. CERES yields the highest correlation (r = 0.94; p = 0.01) and the lowest RMSE of 25.10 W/m2 (6.7%). The scatter cloud is tightly aligned along the 1:1 line, with less spread and modest MBE –11.55 W/m2 (–3.1%), particularly in the mid-range SSR values. These values are remarkably consistent with global findings by Almorox et al. [25] and Zhang et al. [43], who reported CERES RMSEs between 22 and 28 W/m2 and biases typically within ±5 W/m2 across Europe, China, and the U.S. Unlike the reanalysis, CERES avoids excessive extremes in bias, which reinforces its credibility for studies that prioritize trend fidelity over instantaneous accuracy.
Across daily mean evaluation, ERA5 and CERES emerge as the most dependable datasets. ERA5 excels in structural consistency, while CERES offers more accurate magnitude estimates. IMDAA consistently overestimates, especially in high-irradiance regions, while MERRA2, though better, still shows moderate bias under clear-sky conditions.

3.2.2. Monthly Mean Evaluation

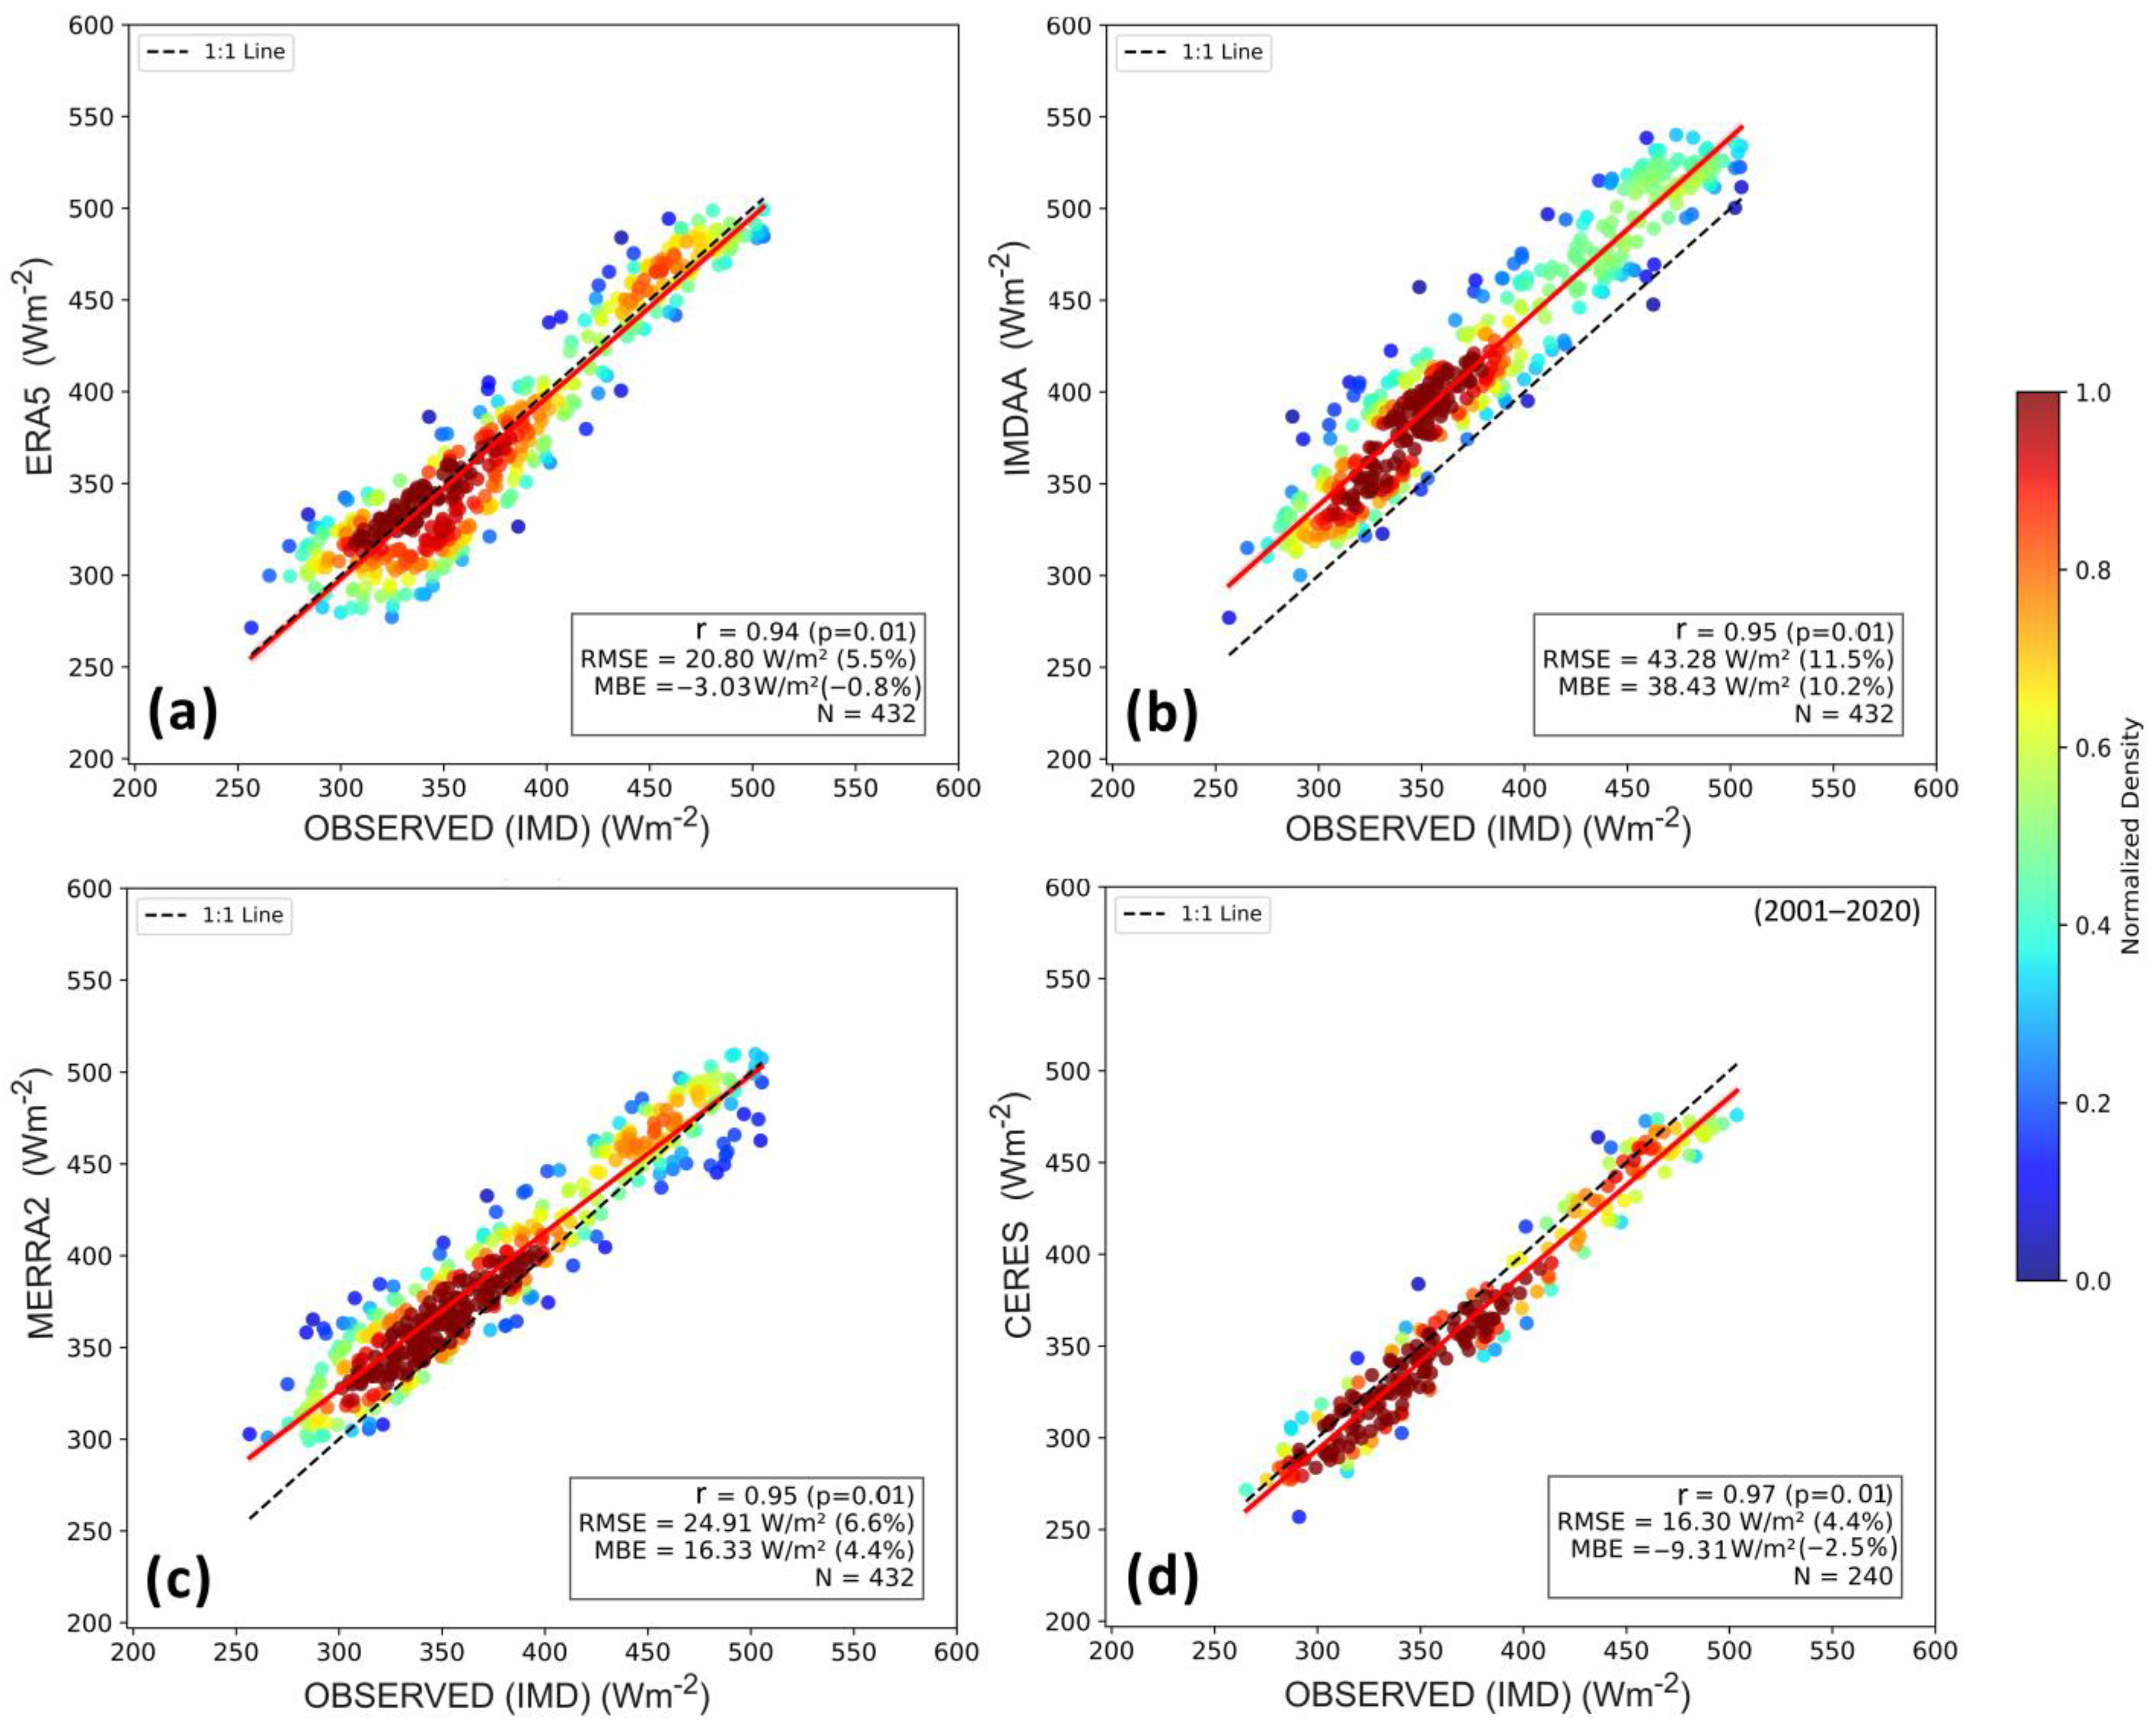
Figure 4 shows monthly mean comparisons between SSR from IMD observations and four gridded datasets, using density scatter plots to characterize agreement across temporal averages. Unlike daily assessments, the monthly mean reduces random fluctuations and highlights systematic tendencies, making this view particularly valuable for climatological analysis and energy planning.
ERA5 (Figure 4a) exhibits a robust linear relationship with IMD observations, with high data density closely aligned along the 1:1 reference line. The correlation (r = 0.94; p = 0.01) reflects strong temporal coherence, and its modest underestimation bias with MBE = −3.03 W/m2 (−0.8%) is likely tied to ERA5’s conservative treatment of shortwave fluxes under high cloudiness regimes. Importantly, the low RMSE (20.80 W/m2 (6.6%)) and narrow vertical scatter indicate that ERA5 not only tracks seasonal changes well but does so with low dispersion. Urraca et al. [19] similarly found a monthly ERA5 bias of +4.05 W/m2 across 294 European stations, with performance degrading slightly in coastal/mountainous areas. Over India, ERA5 maintains tight alignment with IMD data across most climatic zones, especially in central and southern regions. This supports its use for monthly SSR climatology and regional policy modelling.
IMDAA (Figure 4b), despite also achieving high correlation (r = 0.95; p = 0.01), reveals a sharply different bias structure. The positive MBE of +38.43 W/m2 (10.2%) and elevated RMSE of 43.28 W/m2 (11.5%) signify a pronounced and consistent overestimation of SSR. Unlike ERA5, the dense plume of data deviates markedly above the 1:1 line, exposing an inherent optimism in the datasets’ SSR estimates. This suggests that IMDAA may be overly transmissive in its radiative transfer assumptions, potentially due to under-resolved aerosols or simplified cloud optical properties.
MERRA2 (Figure 4c) behaves as a transitional case. It mirrors IMDAA’s inclination toward overestimation, with a mean bias of +16.33 W/m2 (4.4%) yet maintains a lower RMSE of 24.91 W/m2 (6.6%) and tight clustering near the regression line. This indicates a systematic offset rather than random scatter. These results align with Du et al. [42], who reported MERRA2’s monthly bias around +13–18 W/m2 over southern and western China. MERRA2’s structure suggests strength in preserving temporal variation and intra-seasonal trends but highlights the need for regional bias correction. It might serve well in ensemble modelling frameworks where temporal consistency is prioritized over absolute accuracy.
CERES (Figure 4d) again stands out as the best performer. With the highest correlation (r = 0.97; p = 0.01) and the lowest RMSE of 16.30 W/m2 (4.4%), CERES demonstrates exceptional capacity to capture the monthly SSR climatology. Although it slightly underestimates SSR (MBE = –9.31 W/m2 (−2.5%)), the narrow distribution and strong linearity make this underestimation predictable and easily adjustable. Zhang et al. [43] and Kong et al. [44] found similar results over mainland China and the Tibetan Plateau, reporting RMSE < 20 W/m2 and r ≥ 0.95 for monthly SSR.
In summary, monthly evaluations confirm CERES as the most statistically stable and accurate dataset, followed by ERA5, which is slightly conservative but consistent. MERRA2 is useful when corrected for bias, while IMDAA’s overestimation makes it less suited for climatological applications without post-processing. These distinctions are important for selecting appropriate datasets depending on the purpose, whether for high-resolution modelling, solar infrastructure planning, or climatological trend studies over India.

3.3. Sky Condition-Based Analysis

This section evaluates how SSR estimates from four prominent datasets (ERA5, IMDAA, MERRA2, and CERES) respond to different sky conditions. Using the clearness index (Kt) as a proxy for atmospheric transparency, we stratify the analysis into monthly and station-wise perspectives to investigate how well each dataset captures SSR across varying atmospheric transparency levels. This stratified assessment provides insight into each dataset’s sensitivity to cloud cover and its suitability for condition-specific solar energy applications and radiative modelling.

3.3.1. Monthly SSR Bias Stratified by Sky Conditions

Figure 5 explores the monthly variation in mean bias in SSR for each dataset (ERA5, IMDAA, MERRA2, and CERES) stratified into three sky conditions based on clearness index (Kt). Each boxplot reveals how the accuracy of SSR estimates changes under different levels of atmospheric clarity throughout the year.
ERA5 (Figure 5a) shows a systematic negative bias under cloudy and partly cloudy conditions, especially during monsoon months (June–September). The performance improves under clear skies (bias closer to zero), suggesting more reliable estimates in low-cloud, high-transparency environments. The pronounced underestimation during low Kt periods indicates ERA5’s conservative response to dense cloud fields, potentially due to its overestimation of cloud optical thickness. IMDAA (Figure 5b) shows a substantial overestimation under clear skies, with bias reaching beyond +20% during the pre-monsoon and summer months. The persistence of this bias even during cloudy conditions reveals a limited dynamic sensitivity to cloud cover and atmospheric turbidity. MERRA2 (Figure 5c) demonstrates a moderate but consistent overestimation under all sky conditions, with clear skies exhibiting the highest positive bias. Interestingly, during monsoon months, MERRA2 shows slightly improved performance under cloudy skies, though still positively biased. This suggests a less aggressive but uniform overestimation pattern, which could be adjusted through linear bias correction techniques. CERES (Figure 5d) performs best under cloudy and partly cloudy skies, maintaining a tight interquartile range and relatively small bias across all months. Although some underestimation appears under clear sky conditions (especially in winter months), CERES is the most balanced across sky conditions, reinforcing its utility for multi-condition solar radiation analysis.

3.3.2. Station-Wise Bias by Clearness Index

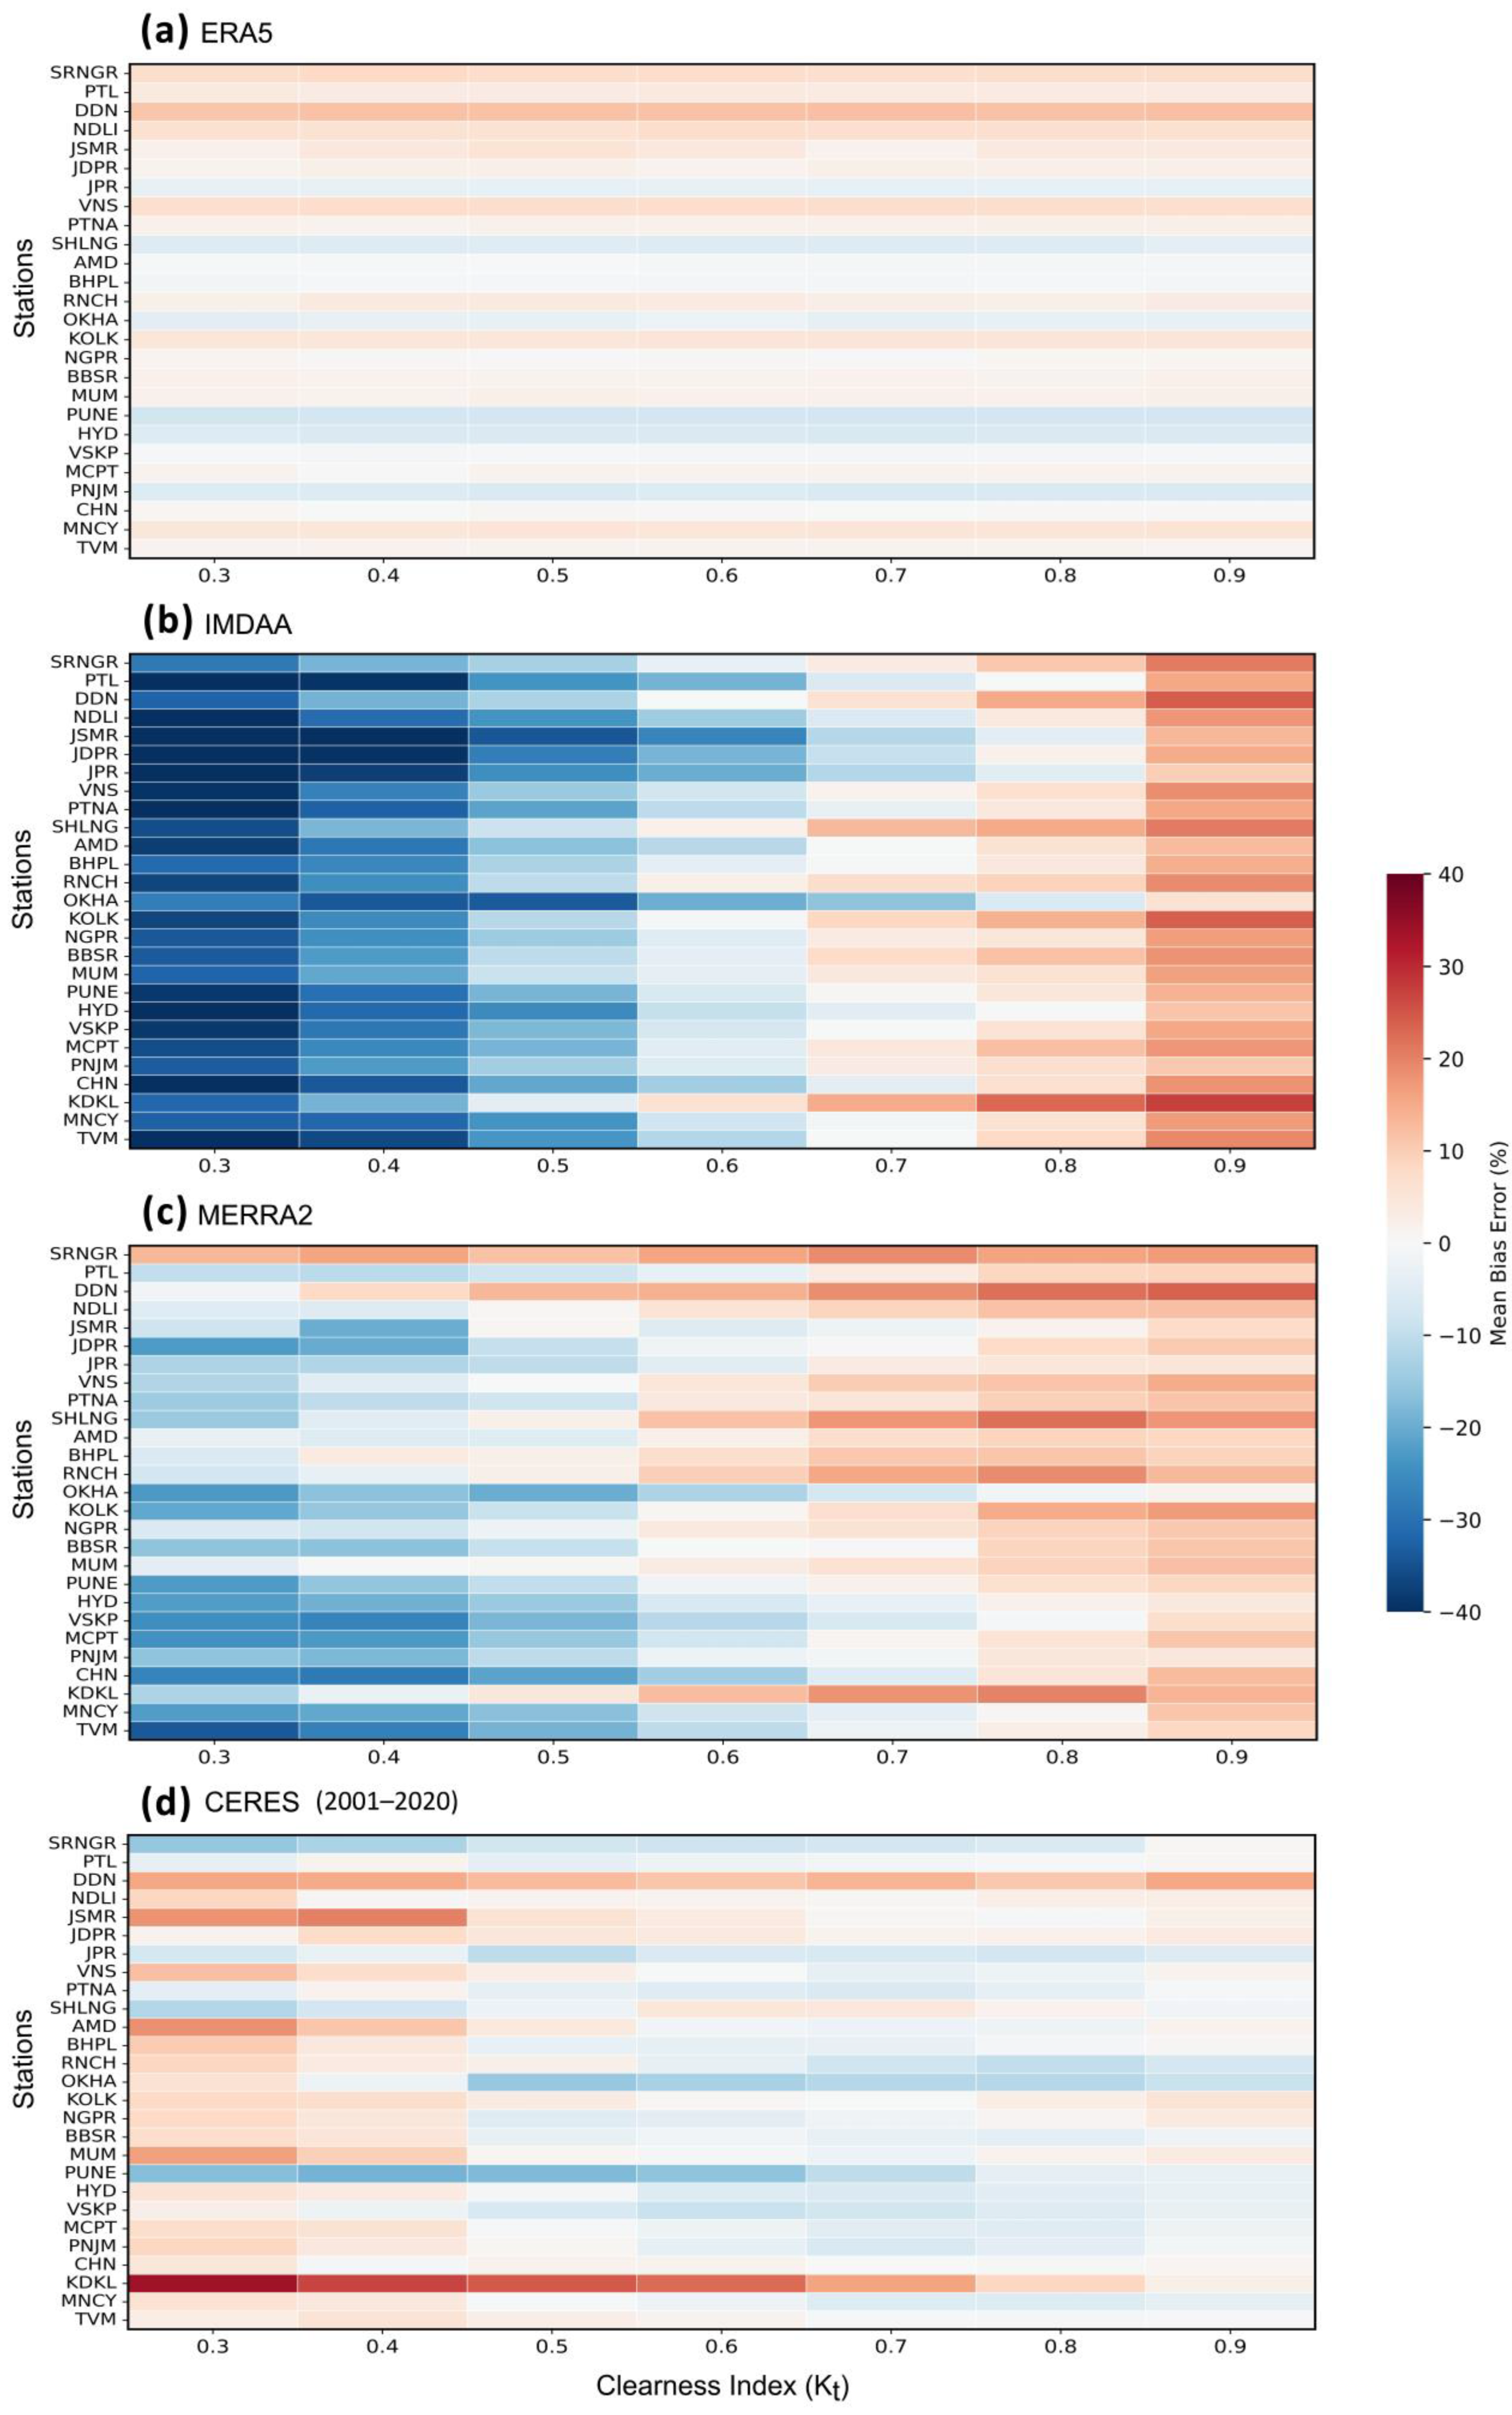
Figure 6 provides a spatially resolved view of daily SSR bias, showing how each dataset performs across the full range of Kt values at individual IMD stations. This station Kt heatmap offers a complementary, localized perspective to the monthly aggregation shown in Figure 5.
ERA5 (Figure 6a) shows a gradual bias shift across the Kt spectrum. Under low Kt (cloudy), SSR is slightly underestimated at most stations, whereas bias approaches zero or becomes mildly positive under high Kt (clear). The smooth color gradient across Kt bands suggests ERA5 has a consistent and predictable response to sky conditions. However, the range of variation across different meteorological stations is more pronounced than the variation across Kt levels, indicating that ERA5’s performance is more sensitive to station-specific characteristics than to changes in sky condition alone. Stations like SHLNG, PUNE, HYD, and PNJM tend to show considerable underestimation under cloudy conditions. In Figure 6b, IMDAA’s heatmap is dominated by warm tones under clear skies (Kt > 0.7) and cool tone under cloudy skies (Kt < 0.4) across all stations, indicating persistent overestimation and underestimation. Under clear skies (Kt > 0.7), biases are consistently above +20% across nearly all locations. The uniformity across stations signals a structural modelling issue, rather than region-specific deficiencies, weakening its responsiveness to localized cloudiness or aerosol variation. MERRA2 (Figure 6c) displays a more heterogeneous bias structure across stations and Kt levels. While some western and northern stations (e.g., AMD, MUM, KDKL) show increased overestimation under clear skies, several eastern and coastal stations reveal better alignment under intermediate Kt levels. This mixed pattern suggests that MERRA2’s bias is more site- and condition-dependent, offering room for tailored corrections. CERES (Figure 6d) again presents the most neutral and balanced response. Most stations show biases within ±10% across the entire Kt range. Slight underestimation is evident under high Kt (clear skies), while low Kt conditions reflect modest negative or near-zero biases. The overall cool-to-neutral tone underscores CERES’s robust radiative representation across atmospheric conditions and geographic diversity. Together, this analysis reveals how the bias behavior of SSR estimates is tightly linked to sky condition and spatial location. Such stratified analyses are critical for applications like solar forecasting, SPV system design, and atmospheric modelling, where performance under diverse meteorological states is essential.
At first observation (Figure 1b), a paradox appears when comparing the monthly mean SSR values and the Kt-based bias assessments. The monthly mean plot, which aggregates data by calendar month without considering for sky conditions, reveals overestimation of SSR during the monsoon period (June to September). In contrast, the Kt-based analyses (Figure 5 and Figure 6), which categorize data solely by atmospheric transparency, shows an underestimation under cloudy skies (i.e., low Kt values). This apparent contradiction stems from differences in the aggregation framework. Monthly grouping mixes clear and cloudy days within each month, and the resulting average bias is influenced heavily by partially clear days where reanalysis datasets tend to overestimate SSR. Conversely, the Kt-based view isolates only those instances of low transparency, exposing the underestimation that occurs specifically under dense cloud cover. Taken together, these insights provide a more nuanced understanding that during monsoon months, reanalysis datasets tend to overestimate SSR on average because they struggle to account for intermittent or broken cloud cover. However, when the atmosphere is strongly overcast, these same models tend to underestimate SSR due to their limited ability to represent deep cloud optical properties and cloud fraction variability. This stratified evaluation of SSR bias by sky condition and spatial location reveals critical differences in dataset performance. ERA5 and CERES display adaptive, sky-aware behavior, performing reliably under variable and cloudy conditions, and are thus more suitable for dynamic atmospheric modelling and solar forecasting. IMDAA, by contrast, exhibits a persistent positive bias across all conditions and regions, limiting its effectiveness in applications sensitive to cloud and aerosol variations. MERRA2 performs moderately, with bias characteristics that vary by region and sky condition, making it a candidate for region-specific correction. Understanding these sky-dependent bias patterns is vital for enhancing solar energy modelling, optimizing PV system design, and improving climate analyses under diverse meteorological regimes. Table 2 provides a concise summary of each dataset’s strengths, limitations, and performance across different atmospheric conditions.

4. Conclusions

The main conclusion of this study are as follows:
Among all datasets, CERES (2001–2020) demonstrated the highest overall performance. At the monthly timescale, it achieved a strong correlation coefficient (r = 0.97), and a modest MBE of −9.31 W/m2 (−2.5%). CERES was particularly robust under cloudy and partly cloudy conditions, maintaining low variability and minimal sky condition sensitivity, making it the most suitable dataset for long-term climatological assessments, solar radiation trend analysis, and renewable energy planning at regional to national scales.
ERA5 emerged as the most balanced reanalysis product. It showed strong agreement with IMD observations at both daily and monthly levels, with a monthly MBE of −3.03 W/m2 (−0.8%). At the daily level, ERA5 had a mild negative bias of −7.33 W/m2 (−1.9%). ERA5 performed best under clear to moderately clear skies, particularly in the dry season (Feb–May), but showed slight underestimation during monsoon months (June–September) due to its conservative cloud optical thickness representation. These features make ERA5 highly suitable for high-resolution solar forecasting, NWP-driven applications, and regional SPV system modelling.
MERRA2 displayed moderate overestimation, with a monthly MBE of +16.33 W/m2 (4.4%), and correlation r = 0.93. The dataset performed reasonably well under partly cloudy conditions, but exhibited notable station-to-station variability, particularly under clear-sky regimes. This site-specific behavior suggests that MERRA2 is best used in ensemble modelling frameworks or applications where temporal coherence is prioritized, with bias correction applied for location-specific tuning.
IMDAA, despite its highest spatial resolution (0.12°), showed the strongest and most persistent overestimation, with a monthly MBE of +38.43 W/m2 (10.2%), and a correlation r = 0.95. The dataset consistently overestimated SSR across all sky conditions and seasons, with the most extreme overestimations occurring under clear skies (Kt ≥ 0.7). This suggests insufficient responsiveness to atmospheric turbidity and cloud variability, likely due to simplified radiative transfer schemes. While IMDAA’s spatial granularity is promising for local-scale or urban energy modelling, it might require significant post-processing and bias correction before use in operational energy planning.
A key insight of this study was the reconciliation of seemingly conflicting findings between monthly mean bias analysis (showing positive bias during monsoon months) and clearness index-based analysis (showing negative bias under cloudy skies). This difference arises from aggregation methods, monthly means mix clear and cloudy conditions, where overestimation during partly clear monsoon days dominates the average, while Kt-binned analysis isolates underestimation under dense cloud cover. Together, these reveal that reanalysis datasets often overestimate average monsoon SSR, but underestimate radiation on overcast days, highlighting their challenges in resolving cloud microphysics and aerosol–cloud–radiation interactions. Based on these insights, the following operational recommendations highlight the most suitable dataset(s) for various solar energy and atmospheric modelling applications. Among the evaluated datasets, CERES is recommended for trend detection and climatological studies due to its lowest RMSE and consistent performance across all sky conditions. ERA5 is identified as the best choice for high-resolution solar forecasting and regional SPV system modelling, attributed to its moderate bias, high temporal fidelity, and native 0.25° resolution. MERRA2, despite moderate overestimation, is well-suited for ensemble modelling frameworks and applications emphasizing temporal coherence; however, it benefits from location-specific bias correction. IMDAA, although featuring the highest spatial resolution (0.12°), demonstrated significant overestimation and limited responsiveness to cloud and aerosol variability. It is, therefore, most appropriate for urban or local-scale SPV modelling, provided that substantial post-processing and bias correction are applied to address its structural radiative biases. These recommendations aim to guide users in selecting the most appropriate dataset based on specific operational, spatial, and temporal needs within India’s solar energy context.
The practical implications of these findings extend across multiple stakeholders in the solar energy ecosystem. Solar project developers can use this evaluation to select the most suitable SSR dataset, such as ERA5 or CERES, for accurate site assessment and long-term yield estimation. Policy planners and grid operators can improve forecasting accuracy and operational reliability by choosing datasets with lower bias and higher temporal fidelity. Designers of Maximum Power Point Tracking (MPPT) systems and solar inverters can utilize SSR variability insights to optimize real-time performance under changing sky conditions. Additionally, researchers and climate modelers can apply the dataset-specific biases identified in this study to improve downscaling, bias correction, and hybrid modelling techniques tailored to Indian atmospheric regimes. By reducing uncertainty and systematic errors in SSR estimation, this study directly supports more efficient and effective solar energy system design, investment planning, and long-term energy transition strategies.
In conclusion, no single dataset is universally optimal across all applications. The choice of SSR dataset must be guided by the intended application, desired spatial and temporal resolution, and sensitivity to sky conditions. While the statistical techniques employed in this study are established, the novelty lies in the depth and scope of the evaluation: it is the first to provide a long-term, pan-India intercomparison of four major SSR datasets using dense IMD station observations, clearness index stratification, and region-specific performance classification. This comprehensive framework not only benchmarks the accuracy of global and regional datasets under diverse Indian atmospheric regimes but also offers actionable recommendations to specific operational contexts. The findings hold significant implications for solar energy modelling, forecasting, and infrastructure planning, and contribute to global efforts to improve radiative transfer schemes and cloud–aerosol parameterizations in reanalysis systems. By bridging critical validation gaps in one of the world’s fastest-growing solar energy markets, this study advances both regional and global solar resource assessment capabilities.

Author Contributions

Conceptualization, A.V.J. and R.L.B.; methodology, A.V.J. and R.L.B.; data curation, A.V.J., K.B. and N.G.; software, A.V.J.; visualization, A.V.J.; formal analysis, K.B., N.G., V.K. and P.R.C.R.; validation, A.V.J. and R.L.B.; writing—original draft preparation, A.V.J.; writing—review and editing, A.V.J., V.K., P.R.C.R., B.L.S. and R.L.B.; resources V.K., P.R.C.R. and B.L.S. All authors have read and agreed to the published version of the manuscript.

Funding

This research received no external funding.

Institutional Review Board Statement

Not applicable.

Informed Consent Statement

Not applicable.

Data Availability Statement

The data that supports the findings of this study are available on their respective websites. Please refer to Section 2 for the sources of the datasets.

Acknowledgments

We are grateful for the support of the Department of Atmospheric and Space Sciences, SPPU–Pune in facilitating this research. We also acknowledge the entire IMD, ERA5, MERRA2, IMDAA, and CERES teams for making valuable datasets available. A significant part of the analysis, including data processing, statistical evaluation, and graphical visualization, was conducted using Python (version 3.12, India). The authors are also grateful to the editor and anonymous reviewers of the journal for their constructive comments that helped us to improve the paper.

Conflicts of Interest

The authors declare that there are no conflicts of interest regarding the publication of this article.

References

  1. Beer, C.; Reichstein, M.; Tomelleri, E.; Ciais, P.; Jung, M.; Carvalhais, N.; Rödenbeck, C.; Arain, M.A.; Baldocchi, D.; Bonan, G.B.; et al. Terrestrial Gross Carbon Dioxide Uptake: Global Distribution and Covariation with Climate. Science 2010, 329, 834–838. [Google Scholar] [CrossRef] [PubMed]
  2. Huang, L.; Kang, J.; Wan, M.; Fang, L.; Zhang, C.; Zeng, Z. Solar Radiation Prediction Using Different Machine Learning Algorithms and Implications for Extreme Climate Events. Front. Earth Sci. 2021, 9, 596860. [Google Scholar] [CrossRef]
  3. Katiyar, A.K.; Pandey, C.K. A Review of Solar Radiation Models—Part I. J. Renew. Energy 2013, 2013, 168048. [Google Scholar] [CrossRef]
  4. Anandh, T.S.; Gopalakrishnan, D.; Mukhopadhyay, P. Analysis of Future Wind and Solar Potential over India Using Climate Models. Curr. Sci. 2022, 122, 1268. [Google Scholar] [CrossRef]
  5. Ang, T.-Z.; Salem, M.; Kamarol, M.; Das, H.S.; Nazari, M.A.; Prabaharan, N. A Comprehensive Study of Renewable Energy Sources: Classifications, Challenges and Suggestions. Energy Strategy Rev. 2022, 43, 100939. [Google Scholar] [CrossRef]
  6. Owusu, P.A.; Asumadu-Sarkodie, S. A Review of Renewable Energy Sources, Sustainability Issues and Climate Change Mitigation. Cogent Eng. 2016, 3, 1167990. [Google Scholar] [CrossRef]
  7. Hou, X.; Wild, M.; Folini, D.; Kazadzis, S.; Wohland, J. Climate change impacts on solar power generation and its spatial variability in Europe based on CMIP6. Earth Syst. Dyn. 2021, 12, 1099–1113. [Google Scholar] [CrossRef]
  8. Jadhav, A.V.; Bhawar, R.L.; Dumka, U.C.; Rahul, P.R.C.; Kumar, P.P. Impacts of Meteorological Conditions on the Plummeting Surface-Reaching Solar Radiation over a Sub-Tropical Station—Pune, India. Energy Sustain. Dev. 2024, 80, 101444. [Google Scholar] [CrossRef]
  9. Jin, H.; Wang, S.; Yan, P.; Qiao, L.; Sun, L.; Zhang, L. Spatial and Temporal Characteristics of Surface Solar Radiation in China and Its Influencing Factors. Front. Environ. Sci. 2022, 10, 916748. [Google Scholar] [CrossRef]
  10. Liang, F.; Xia, X.A. Long-Term Trends in Solar Radiation and the Associated Climatic Factors over China for 1961–2000. Ann. Geophys. 2005, 23, 2425–2432. [Google Scholar] [CrossRef]
  11. Padma Kumari, B.; Londhe, A.L.; Daniel, S.; Jadhav, D.B. Observational Evidence of Solar Dimming: Offsetting Surface Warming over India. Geophys. Res. Lett. 2007, 34, 2007GL031133. [Google Scholar] [CrossRef]
  12. Stanhill, G.; Cohen, S. Global Dimming: A Review of the Evidence for a Widespread and Significant Reduction in Global Radiation with Discussion of Its Probable Causes and Possible Agricultural Consequences. Agric. For. Meteorol. 2001, 107, 255–278. [Google Scholar] [CrossRef]
  13. Bonkaney, A.; Madougou, S.; Adamou, R. Impacts of Cloud Cover and Dust on the Performance of Photovoltaic Module in Niamey. J. Renew. Energy 2017, 2017, 9107502. [Google Scholar] [CrossRef]
  14. Dumka, U.C.; Kosmopoulos, P.G.; Ningombam, S.S.; Masoom, A. Impact of Aerosol and Cloud on the Solar Energy Potential over the Central Gangetic Himalayan Region. Remote Sens. 2021, 13, 3248. [Google Scholar] [CrossRef]
  15. Jadhav, A.V.; Rahul, P.R.C.; Kumar, V.; Dumka, U.C.; Bhawar, R.L. Spatiotemporal Assessment of Surface Solar Dimming in India: Impacts of Multi-Level Clouds and Atmospheric Aerosols. Climate 2024, 12, 48. [Google Scholar] [CrossRef]
  16. Bergin, M.H.; Ghoroi, C.; Dixit, D.; Schauer, J.J.; Shindell, D.T. Large Reductions in Solar Energy Production Due to Dust and Particulate Air Pollution. Environ. Sci. Technol. Lett. 2017, 4, 339–344. [Google Scholar] [CrossRef]
  17. Li, X.; Wagner, F.; Peng, W.; Yang, J.; Mauzerall, D.L. Reduction of Solar Photovoltaic Resources Due to Air Pollution in China. Proc. Natl. Acad. Sci. USA 2017, 114, 11867–11872. [Google Scholar] [CrossRef] [PubMed]
  18. Tan, Y.; Liu, J.; Li, W.; Yin, J.; Chen, H.; Peng, Y.; Tan, J.; Wei, M. Agrivoltaics Development Progresses: From the Perspective of Photovoltaic Impact on Crops, Soil Ecology and Climate. Environ. Res. 2025, 266, 120540. [Google Scholar] [CrossRef]
  19. Urraca, R.; Huld, T.; Gracia-Amillo, A.; Martinez-de-Pison, F.J.; Kaspar, F.; Sanz-Garcia, A. Evaluation of Global Horizontal Irradiance Estimates from ERA5 and COSMO-REA6 Reanalyses Using Ground and Satellite-Based Data. Sol. Energy 2018, 164, 339–354. [Google Scholar] [CrossRef]
  20. Xia, X.A.; Wang, P.C.; Chen, H.B.; Liang, F. Analysis of Downwelling Surface Solar Radiation in China from National Centers for Environmental Prediction Reanalysis, Satellite Estimates, and Surface Observations. J. Geophys. Res. 2006, 111, 2005JD006405. [Google Scholar] [CrossRef]
  21. Zhang, X.; Lu, N.; Jiang, H.; Yao, L. Evaluation of Reanalysis Surface Incident Solar Radiation Data in China. Sci. Rep. 2020, 10, 3494. [Google Scholar] [CrossRef]
  22. Zhang, X.; Liang, S.; Wang, G.; Yao, Y.; Jiang, B.; Cheng, J. Evaluation of the Reanalysis Surface Incident Shortwave Radiation Products from NCEP, ECMWF, GSFC, and JMA Using Satellite and Surface Observations. Remote Sens. 2016, 8, 225. [Google Scholar] [CrossRef]
  23. Jiang, H.; Yang, Y.; Bai, Y.; Wang, H. Evaluation of the Total, Direct, and Diffuse Solar Radiations From the ERA5 Reanalysis Data in China. IEEE Geosci. Remote Sens. Lett. 2020, 17, 47–51. [Google Scholar] [CrossRef]
  24. Stamatis, M.; Hatzianastassiou, N.; Korras-Carraca, M.B.; Matsoukas, C.; Wild, M.; Vardavas, I. Interdecadal Changes of the MERRA-2 Incoming Surface Solar Radiation (SSR) and Evaluation against GEBA & BSRN Stations. Appl. Sci. 2022, 12, 10176. [Google Scholar] [CrossRef]
  25. Almorox, J.; Ovando, G.; Sayago, S.; Bocco, M. Assessment of Surface Solar Irradiance Retrieved by CERES. Int. J. Remote Sens. 2017, 38, 3669–3683. [Google Scholar] [CrossRef]
  26. Lu, L.; Ma, Q. Diurnal Cycle in Surface Incident Solar Radiation Characterized by CERES Satellite Retrieval. Remote Sens. 2023, 15, 3217. [Google Scholar] [CrossRef]
  27. Kripalani, R.H.; Kulkarni, A.; Sabade, S.S.; Khandekar, M.L. Indian Monsoon Variability in a Global Warming Scenario. Nat. Hazards 2003, 29, 189–206. [Google Scholar] [CrossRef]
  28. Roxy, M.K.; Ghosh, S.; Pathak, A.; Athulya, R.; Mujumdar, M.; Murtugudde, R.; Rajeevan, M.; Yamagata, T. A Threefold Rise in Widespread Extreme Rain Events over Central India. Nat. Commun. 2017, 8, 708. [Google Scholar] [CrossRef]
  29. Sudeep Kumar, B.L.; Phukan, R.; Boragapu, R.; Nalage, C.B.; Tathe, A.D.; Hosalikar, K.S. Understanding the Climatology and Long-Term Trends in Solar Radiation Using Ground Based in-Situ Observations in India. Mausam 2024, 75, 349–372. [Google Scholar] [CrossRef]
  30. Hersbach, H.; Bell, B.; Berrisford, P.; Hirahara, S.; Horányi, A.; Muñoz-Sabater, J.; Nicolas, J.; Peubey, C.; Radu, R.; Schepers, D.; et al. The ERA5 Global Reanalysis. Q. J. R. Meteorol. Soc. 2020, 146, 1999–2049. [Google Scholar] [CrossRef]
  31. Poli, P.; Hersbach, H.; Dee, D.P.; Berrisford, P.; Simmons, A.J.; Vitart, F.; Laloyaux, P.; Tan, D.G.H.; Peubey, C.; Thépaut, J.-N.; et al. ERA-20C: An Atmospheric Reanalysis of the Twentieth Century. J. Clim. 2016, 29, 4083–4097. [Google Scholar] [CrossRef]
  32. Gelaro, R.; McCarty, W.; Suárez, M.J.; Todling, R.; Molod, A.; Takacs, L.; Randles, C.A.; Darmenov, A.; Bosilovich, M.G.; Reichle, R.; et al. The Modern-Era Retrospective Analysis for Research and Applications, Version 2 (MERRA-2). J. Clim. 2017, 30, 5419–5454. [Google Scholar] [CrossRef]
  33. Rani, S.I.; Arulalan, T.; George, J.P.; Rajagopal, E.N.; Renshaw, R.; Maycock, A.; Barker, D.M.; Rajeevan, M. IMDAA: High Resolution Satellite-Era Reanalysis for the Indian Monsoon Region. J. Clim. 2021, 34, 5109–5133. [Google Scholar] [CrossRef]
  34. Rutan, D.A.; Kato, S.; Doelling, D.R.; Rose, F.G.; Nguyen, L.T.; Caldwell, T.E.; Loeb, N.G. CERES Synoptic Product: Methodology and Validation of Surface Radiant Flux. J. Atmos. Ocean. Technol. 2015, 32, 1121–1143. [Google Scholar] [CrossRef]
  35. Urraca, R.; Gracia-Amillo, A.M.; Huld, T.; Martinez-de-Pison, F.J.; Trentmann, J.; Lindfors, A.V.; Riihelä, A.; Sanz-Garcia, A. Quality Control of Global Solar Radiation Data with Satellite-Based Products. Sol. Energy 2017, 158, 49–62. [Google Scholar] [CrossRef]
  36. Almazroui, M.; Saeed, S.; Saeed, F.; Islam, M.N.; Ismail, M. Projections of Precipitation and Temperature over the South Asian Countries in CMIP6. Earth Syst. Environ. 2020, 4, 297–320. [Google Scholar] [CrossRef]
  37. Sharmila, S.; Joseph, S.; Sahai, A.K.; Abhilash, S.; Chattopadhyay, R. Future Projection of Indian Summer Monsoon Variability under Climate Change Scenario: An Assessment from CMIP5 Climate Models. Glob. Planet. Change 2015, 124, 62–78. [Google Scholar] [CrossRef]
  38. Riihelä, A.; Kallio, V.; Devraj, S.; Sharma, A.; Lindfors, A. Validation of the SARAH-E Satellite-Based Surface Solar Radiation Estimates over India. Remote Sens. 2018, 10, 392. [Google Scholar] [CrossRef]
  39. Duffie, J.A.; Beckman, W.A. Solar Engineering of Thermal Processes; John Wiley & Sons, Inc.: Hoboken, NJ, USA, 2013. [Google Scholar] [CrossRef]
  40. Padma Kumari, B.; Goswami, B.N. Seminal Role of Clouds on Solar Dimming over the Indian Monsoon Region. Geophys. Res. Lett. 2010, 37, 2009GL042133. [Google Scholar] [CrossRef]
  41. Tahir, Z.U.R.; Azhar, M.; Mumtaz, M.; Asim, M.; Moeenuddin, G.; Sharif, H.; Hassan, S. Evaluation of the Reanalysis Surface Solar Radiation from NCEP, ECMWF, NASA, and JMA Using Surface Observations for Balochistan, Pakistan. J. Renew. Sustain. Energy 2020, 12, 023703. [Google Scholar] [CrossRef]
  42. Du, Y.; Shi, H.; Zhang, J.; Xia, X.; Yao, Z.; Fu, D.; Hu, B.; Huang, C. Evaluation of MERRA-2 Hourly Surface Solar Radiation across China. Sol. Energy 2022, 234, 103–110. [Google Scholar] [CrossRef]
  43. Zhang, K.; Zhao, L.; Tang, W.; Yang, K.; Wang, J. Global and Regional Evaluation of the CERES Edition-4A Surface Solar Radiation and Its Uncertainty Quantification. IEEE J. Sel. Top. Appl. Earth Obs. Remote Sens. 2022, 15, 2971–2985. [Google Scholar] [CrossRef]
  44. Kong, H.; Wang, J.; Cai, L.; Cao, J.; Zhou, M.; Fan, Y. Surface Solar Radiation Resource Evaluation of Xizang Region Based on Station Observation and High-Resolution Satellite Dataset. Remote Sens. 2024, 16, 1405. [Google Scholar] [CrossRef]
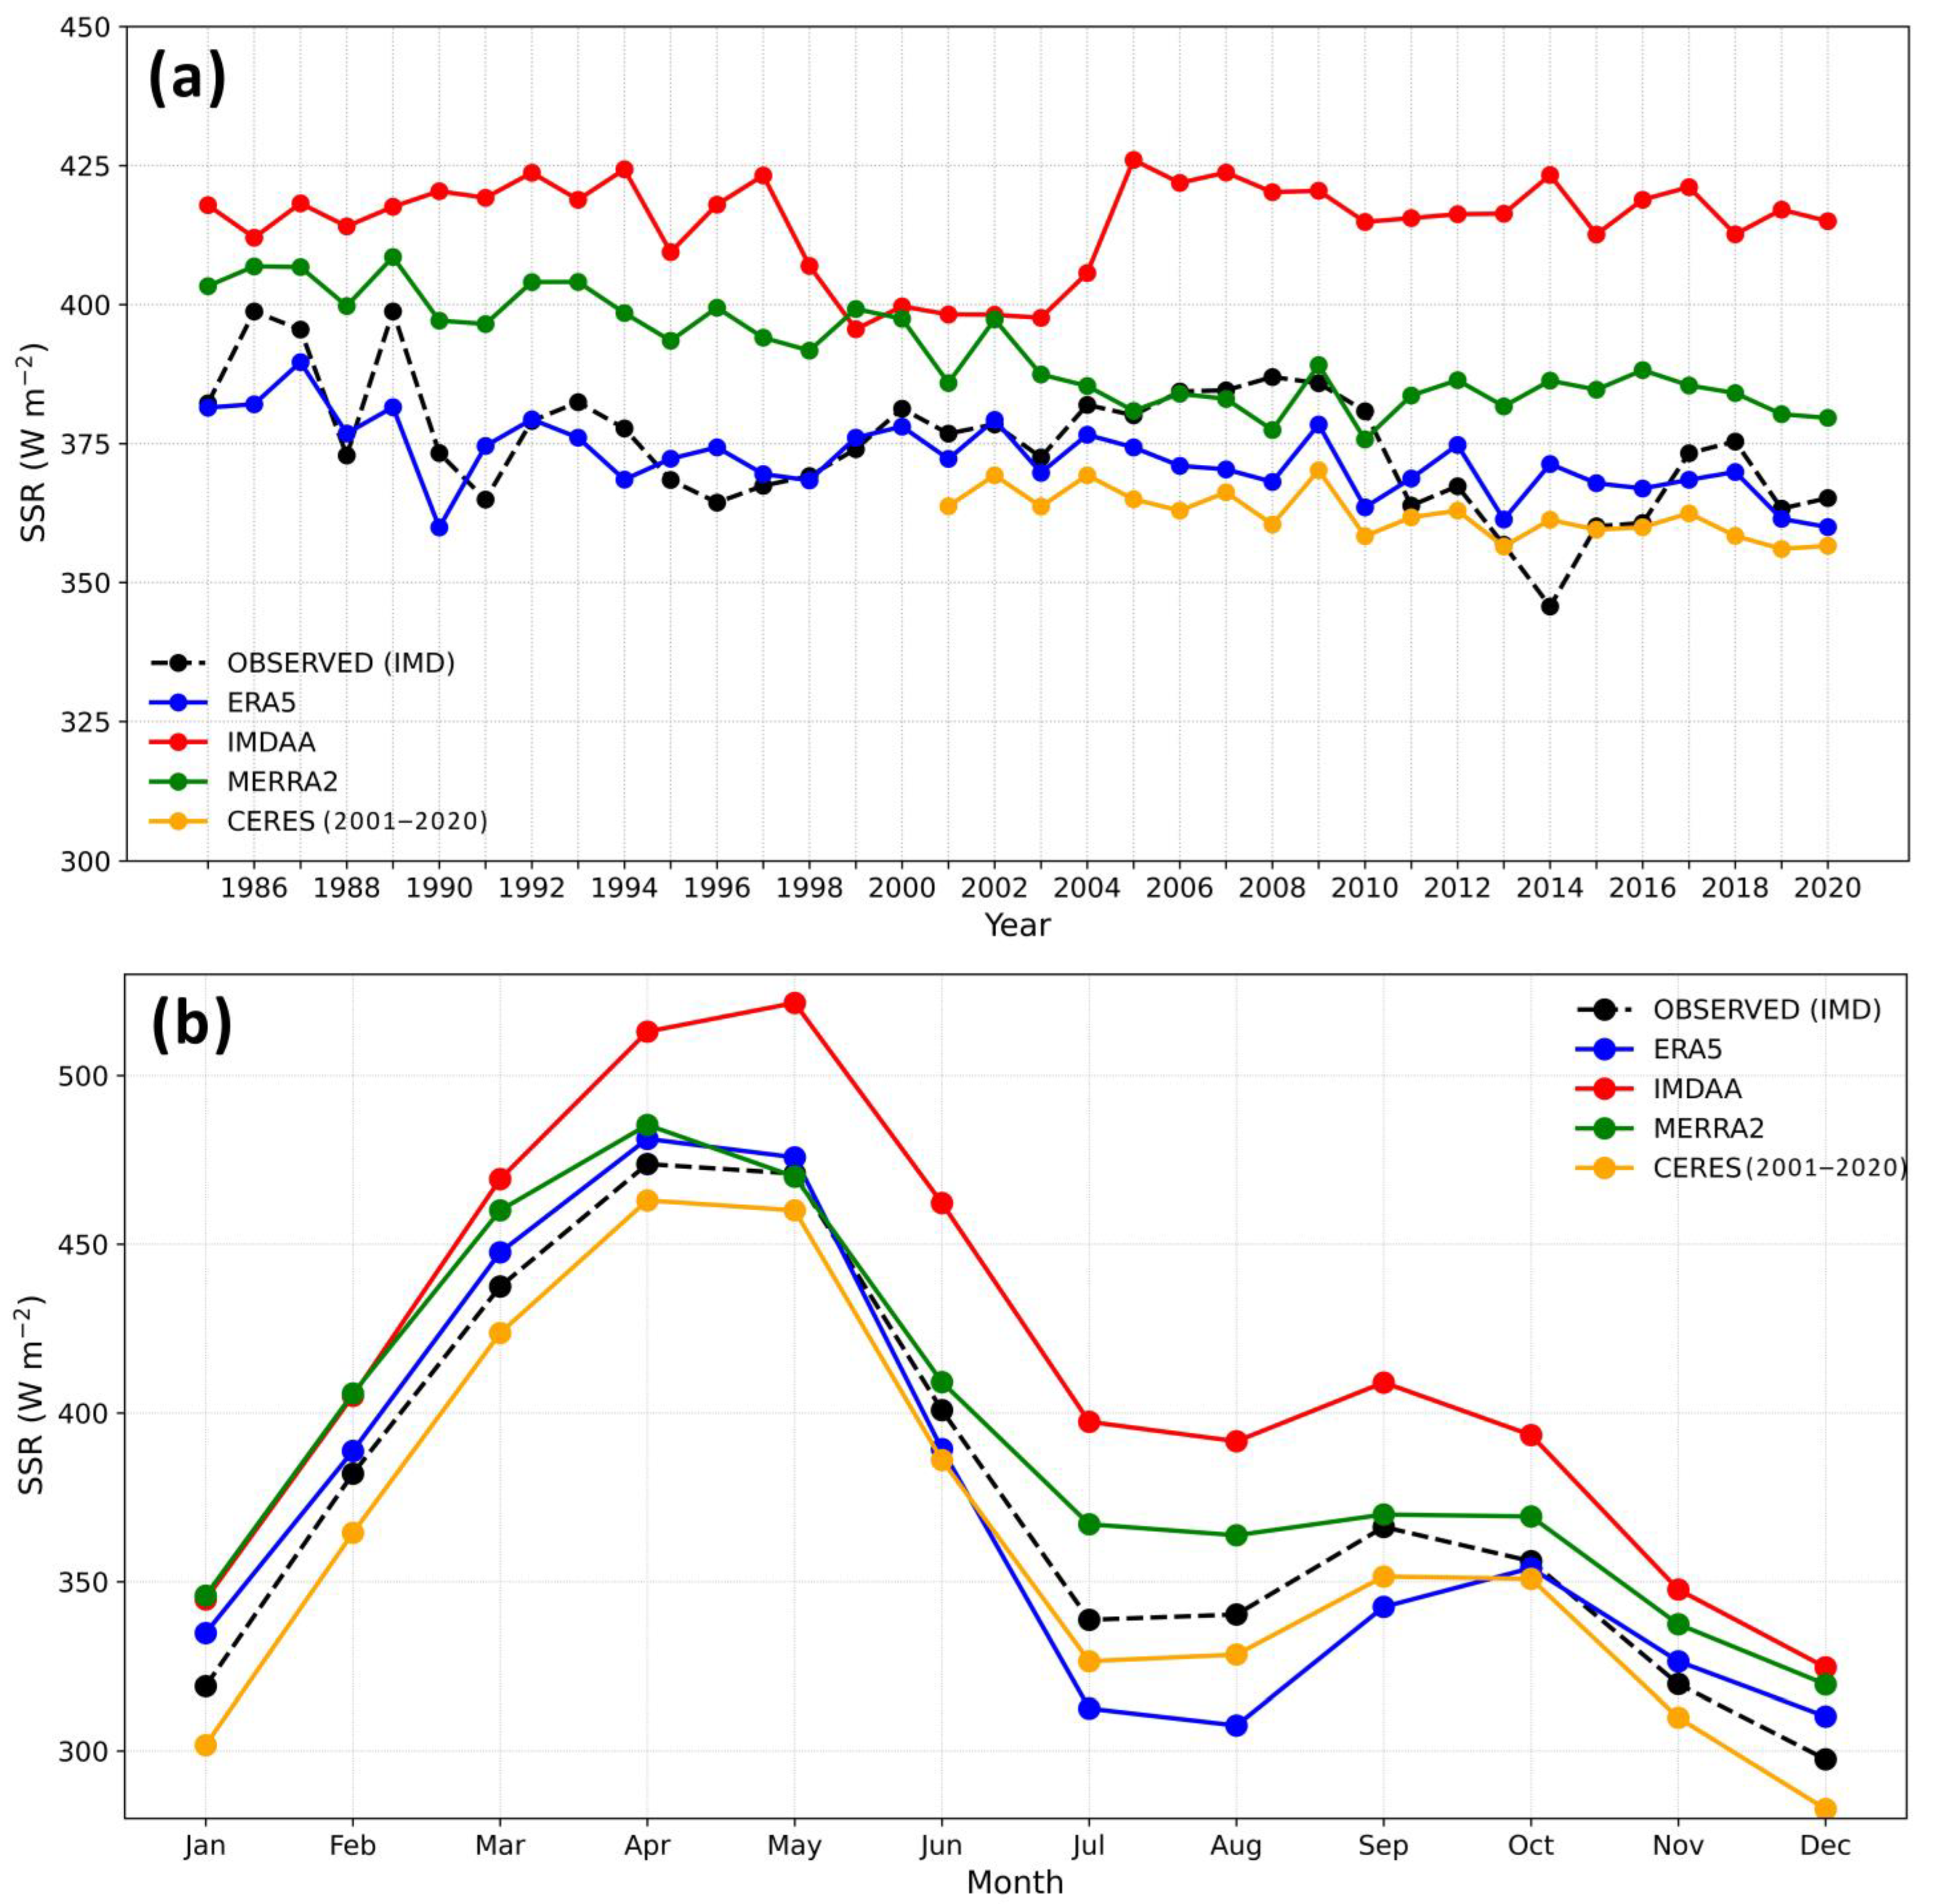
Figure 1. (a) Annual and (b) monthly mean SSR from IMD station observations and four gridded datasets: ERA5, IMDAA, MERRA2, for the period 1985–2020, and CERES for the period 2001–2020 over India.
Atmosphere 16 00957 g001
Figure 2. Spatial distribution of annual mean bias (%) in SSR across India, calculated between the IMD station observations and four gridded datasets (a) ERA5, (b) IMDAA, (c) MERRA2, for the period 1985–2020, and (d) CERES, for the period 2001–2020. Underlaid grey contours show the elevation (in meters) above mean sea level.
Atmosphere 16 00957 g002
Figure 3. Density scatter plot of the daily mean IMD station observations versus (a) ERA5, (b) IMDAA, (c) MERRA2, for the period 2001–2020, and (d) CERES, for the period 2001–2020. The black dashed line indicates perfect association (1-1 line), whereas the red line is the actual best fit line between the observed and gridded datasets. The error metrics in the figure are described in Section 2.4.2.
Atmosphere 16 00957 g003
Figure 4. Density scatter plot of the monthly mean IMD station observations versus (a) ERA5, (b) IMDAA, (c) MERRA2, for the period 1985–2020, and (d) CERES, for the period 2001–2020. The black dashed line indicates perfect association (1-1 line), whereas the red line is the actual best fit line between the observed and gridded datasets. The error metrics in the figure are described in Section 2.4.2.
Atmosphere 16 00957 g004
Figure 5. Monthly mean bias (%) of SSR for (a) ERA5, (b) IMDAA, (c) MERRA2, for the period 1985–2020, and (d) CERES (2001–2020) datasets, stratified by sky conditions.
Atmosphere 16 00957 g005
Figure 6. Mean bias error (MBE) for daily mean SSR at individual IMD stations for (a) ERA5, (b) IMDAA, (c) MERRA2, for the period 1985–2020, and (d) CERES (2001–2020) datasets, categorized by different levels of clearness index (Kt).
Atmosphere 16 00957 g006
Table 1. List of IMD solar radiation monitoring stations considered in this study.
Sr. No.Station IDStation NameAbbreviationsLat (°N)Lon (°E)~Elevation
(m)
142027SrinagarSRNGR34.0874.801585
242101PatialaPTL30.3476.39250
342111DehradunDDN30.3278.03640
442182New DelhiNDLI28.6177.21216
542328JaisalmerJSMR26.9270.91225
642339JodhpurJDPR26.2673.01231
742348JaipurJPR26.9175.79431
842483VaranasiVNS25.3282.9981
942492PatnaPTNA25.5985.1453
1042516ShillongSHLNG25.5891.891520
1142647AhmedabadAMD23.0272.5753
1242667BhopalBHPL23.2677.41500
1342701RanchiRNCH23.3485.31651
1442730OkhaOKHA22.4769.0605
1542809KolkataKOLK22.5788.3609
1642867NagpurNGPR21.1579.09310
1742971BhubaneswarBBSR20.3085.8245
1843003MumbaiMUM19.0872.8814
1943063PunePUNE18.5273.86560
2043128HyderabadHYD17.3978.49542
2143149VisakhapatnamVSKP17.6983.2245
2243185MachilipatnamMCPT16.1981.1414
2343192PanjimPNJM15.4973.8307
2443279ChennaiCHN13.0880.2706
2543339KodaikanalKDKL10.2477.492133
2643369MinicoyMNCY8.3073.0502
2743371ThiruvananthapuramTVM8.5276.9410
Table 2. Summary of dataset strengths, limitations, and condition-based performance.
Overall RankingPerforms Well inPerforms Poorly inBias TendencySky Condition Strength
CERES
(2001–2020)
All seasons; partly cloudy (Kt = 0.4–0.7)Slight underestimation in clear sky (Kt ≥ 0.7)Mild underestimation (–2.5%)Very stable across Kt and months
ERA5Winter, pre-monsoon (Feb–May); clear skyMonsoon season; cloudy sky (Kt < 0.4)Slight underestimation (–1.9%)Good in clear/partly cloudy skies
MERRA2Partly cloudy sky; post-monsoon (Oct–Nov)Clear sky; high bias variability at some stationsModerate overestimation (+4.4%)Mixed; station-specific variability
IMDAANone distinctlyClear sky and cloudy sky across all monthsStrong overestimation (+10.2%)Weak response to sky condition changes
Disclaimer/Publisher’s Note: The statements, opinions and data contained in all publications are solely those of the individual author(s) and contributor(s) and not of MDPI and/or the editor(s). MDPI and/or the editor(s) disclaim responsibility for any injury to people or property resulting from any ideas, methods, instructions or products referred to in the content.