Article

Applicability Assessment of ERA5 Surface Wind Speed Data Across Different Landforms in China

1
China Power Engineering Consulting Group International Engineering Co., Ltd., Beijing 100013, China
2
Plateau Atmosphere and Environment Key Laboratory of Sichuan Province, School of Atmospheric Sciences, Chengdu University of Information Technology, Chengdu 610225, China
*
Author to whom correspondence should be addressed.
Atmosphere 2025, 16(8), 956; https://doi.org/10.3390/atmos16080956 (registering DOI)
Submission received: 31 May 2025 / Revised: 19 July 2025 / Accepted: 20 July 2025 / Published: 11 August 2025
(This article belongs to the Section Atmospheric Techniques, Instruments, and Modeling)

Abstract

Accurate surface wind speed data are vital for atmospheric science, climatology, and energy applications. European Centre for Medium-Range Weather Forecasts Reanalysis v.5 (ERA5), as one of the most widely used global reanalysis datasets, has insufficient assessment of its applicability across diverse landform types. Using the gridded observational dataset over China (CN05.1) and the Global Basic Landform Units dataset, this study evaluated the surface wind speed data from ERA5 over various altitudinal zones and undulating terrains in China via root-mean-square differences (RMSD) and mean absolute percentage error (MAPE) against CN05.1 observations. Results reveal significant regional variations, with ERA5 effectively capturing the spatial distribution of mean wind speeds but systematically underestimating magnitudes, particularly in plateau and mountainous regions. ERA5 reanalysis fails to reproduce the observed altitudinal increase in surface wind speed. Elevation-dependent biases are prominent, with RMSD and MAPE increasing from low-altitude to high-altitude areas. Terrain complexity exacerbates errors, showing maximum deviations in high-relief mountains and minimum deviations in hilly regions. These biases evolve seasonally, peaking in spring and reaching minima in winter. In summary, discrepancies between observations and ERA5 vary with altitude, topographic relief, and season. The most significant deviations occur for spring surface winds in high-altitude, high-relief mountains, with mean RMSD reaching 3.3 m/s and MAPE 553%. The findings highlight the limitations of ERA5 reanalysis data in scientific and operational contexts over complex terrains.

1. Introduction

Surface wind speed is a critical parameter in atmospheric dynamics, climate studies, and renewable energy applications [1,2,3]. Changes in surface wind speed have profound impacts on regional evapotranspiration [1,4], hydrological conditions [5], air pollution [2,6,7,8], strong dust storm events [9], as well as wind energy production [3,10,11,12]. Consequently, it is important to represent the variation in surface wind speed accurately.
Changes in surface wind speed are driven by multi-scale physical processes, including atmospheric circulation anomalies [13,14,15,16,17,18], land use and cover change [19,20,21,22], aerosol-induced pollution effects [23,24,25], and instrumentation biases [26,27,28]. Crucially, the magnitude and spatial heterogeneity of these changes exhibit strong modulation by landform characteristics, particularly in topographically complex regions [29,30,31,32,33,34]. In complex terrain, synoptic winds undergo significant modifications through topographic interactions and surface-forced local circulations. Terrain elevation variation (characterized by the Laplacian of elevation) and slope (represented by mean square slope) are the two dominant factors governing surface wind speed variability in complex terrain [35]. Therefore, accurate representation of wind fields is particularly challenging over regions with complex topography, where local terrain effects significantly modify atmospheric flow patterns [36,37].
The ERA5 is the latest generation of global reanalysis dataset produced by the European Centre for Medium-Range Weather Forecasts (ECMWF). Compared to its predecessor ERA-Interim, ERA5 provides significantly enhanced spatial and temporal resolution, delivering hourly estimates of atmospheric, terrestrial, and oceanic climate variables. Furthermore, it features improved representations of tropospheric and stratospheric processes [38,39,40,41]. This dataset has become a widely adopted resource for regional and global climate change research as well as wind energy studies [42,43,44,45,46,47,48,49]. However, despite its global coverage and advanced data assimilation system, ERA5’s performance across diverse topographic regimes—particularly in complex terrains like China—remains insufficiently validated against high-altitude measurements [50,51,52]. The vast territory of China encompasses extreme elevation gradients from the Tibetan Plateau (>4000 m) to coastal plains, creating substantial challenges for reanalysis products [53,54]. Previous evaluations have identified systematic biases in ERA5 wind speeds, but these studies have typically focused on either limited geographic regions or failed to account for topographic complexity [55,56,57,58,59]. Notably, the interaction between elevation-dependent errors and terrain-induced wind modifications remains poorly quantified, despite its importance for climate change research and wind resource assessment.
This study presents a comprehensive evaluation of ERA5 surface wind speed data across the full topographic spectrum of China, addressing three key knowledge gaps: What are the simulation biases of wind speed over different terrains and landforms in ERA5 reanalysis data? How do these biases evolve seasonally? What is the quantitative impact of terrain complexity on reanalysis accuracy? By linking error patterns to topographic and seasonal drivers, this work not only advances the physical understanding of reanalysis limitations but also provides actionable guidelines for data users across climate science, renewable energy, and operational meteorology.

2. Data and Methods

2.1. Datasets

2.1.1. CN05.1 Gridded Observational Dataset

This study employs surface elevation data and the monthly mean 10 m wind speed observational datasets from CN05.1 [60], a high-resolution (0.25° × 0.25°) gridded product spanning 1961–2018. The dataset is derived from quality-controlled daily averages of fixed-time observation data at 2416 meteorological stations across China [61]. An anomaly-based interpolation scheme was utilized in the CN05.1 dataset to convert station data to grid format, consistent with the methodology employed in the Climatic Research Unit (CRU) dataset [62]. This two-stage procedure involves: (1) constructing a baseline climatological field through thin-plate smoothing spline interpolation, followed by (2) interpolating daily station anomalies to the grid using angular distance weighting. The final product is generated by superimposing the daily anomaly field onto the climatological background [63]. Spline functions used for spatial interpolation can incorporate covariate sub-models, such as considering how physical quantities vary with elevation. The CN05 dataset utilizes longitude and latitude as independent variables in thin-plate splines, with elevation as a covariate, to interpolate climatic fields [60]. Spline interpolation demonstrates robustness when handling sparse or irregularly distributed data points [62]. For anomaly fields, the angular distance weighting method is employed, where grid-point values are derived from station observations weighted by both angular separation and distance from the grid point [60]. Previous comparative studies of interpolation methods have demonstrated that these two approaches yield optimally gridded results [62]. Additionally, the Parameter-Elevation Regressions on Independent Slopes Model (PRISM) was applied during interpolation to perform terrain correction [60]. The dataset is available from https://ccrc.iap.ac.cn/resource/ (accessed on 21 September 2024). CN05.1 is considered the optimal gridded dataset for characterizing wind speed over mainland China under multifactorial constraints, with a Root Mean Square Error of approximately 0.595 m/s when validated against in-situ observations [64]. It has been extensively employed to validate surface wind speed estimates across China [51,65,66], including regions with complex topography such as the Tibetan Plateau [67,68], and demonstrates spatial distributions and temporal variations consistent with independent wind observations [66].

2.1.2. Global Landform Data

Global basic landform units datasets provided by Yangtze River Delta Science Data Center, National Earth System Science Data Sharing Infrastructure, National Science and Technology Infrastructure of China are used in this study. The data were developed through further processing of publicly available FABDEM (Forest and Buildings removed Copernicus DEM), AW3D30 (ALOS World 3D-30m), and REMA (Reference Elevation Model of Antarctica-32m) datasets by researchers from the School of Geographical Science at Nanjing Normal University and the Institute of Geographic Sciences and Natural Resources Research, Chinese Academy of Sciences [69]. The dataset employs a novel terrain relief index proposed by the research team, coupled with innovative slope-cost distance analysis methods, to achieve classification of fundamental geomorphological types. The dataset is available from http://geodata.nnu.edu.cn (accessed on 20 January 2025), with a horizonal resolution of 30 m. This dataset has been extensively utilized in geomorphological studies, environmental assessments, ecological evaluations, and geographic process analyses, demonstrating robust application performance [70,71,72,73].

2.1.3. ERA5 Reanalysis Dataset

ERA5 is the fifth-generation reanalysis developed at the ECMWF. The product delivers hourly outputs for multiple atmospheric, oceanographic, and land surface parameters [38]. The ERA5 reanalysis system provides complete global coverage through a 137-layer vertical structure extending from the surface to 0.01 hPa (approximately 80 km in altitude). While the native spectral resolution of the model operates at 0.28125° (~31 km), the operational data products are systematically interpolated to a standardized 0.25° × 0.25° latitude–longitude grid [74]. This latest generation demonstrates significant improvements in horizontal and vertical resolution, along with a refined time step, compared to its predecessors ERA-40 [75] and ERA-Interim [76].

2.2. Methods

Surface wind speed at each grid point is computed as the magnitude of the horizontal wind vector:
U w s p = u 2 + v 2  
where u and v represent the eastward and northward components, respectively. The nearest-neighbor interpolation method is used to extract physical variable values across different landforms from both observational and reanalysis data.
Root-mean-square differences (RMSD) between ERA5 reanalysis and CN05.1 observational data are quantified across major landform types during 1961–2018 to assess the consistency of ERA5 with in situ measurements. RMSD is computed as:
R M S D = i = 1 n ( X o b s , i X E R A 5 , i ) 2 n
To assess the accuracy of ERA5 reanalysis, we also compute the mean absolute percentage error (MAPE) between the reanalysis data and observations. This metric, widely adopted for evaluating model performance, quantifies the average percentage deviation through the following ratio [77,78,79]:
M A P E = 1 N i = 1 n X o b s , i X E R A 5 , i X o b s , i · 100 %
N in Equations (2) and (3) denotes the sample size, and X o b s , i and X E R A 5 , i represent the i-th observational and reanalysis values, respectively. MAPE is typically employed to quantify deviation from observations, while RMSD serves as a measure of result dispersion [80]. The smaller the RMSD and MAPE values, the higher the accuracy of the ERA5 reanalysis data.
Meanwhile, linear regression analysis and Spearman rank-order correlation were employed to quantify the relationship between two physical variables.

3. Results

3.1. Spatial Heterogeneity of Wind Speed Biases

Figure 1 presents a comparison between the spatial distribution of ERA5 surface wind speed climatology and observations over China. Surface wind speed averaged across China exhibits significant regional variations. On average, observational data show that regions including the western Tibetan Plateau, northern Inner Mongolia, northern Xinjiang and Gansu, and parts of the three northeastern provinces exhibit relatively higher wind speeds, whereas areas such as eastern Sichuan, Chongqing, Guizhou, and Hunan demonstrate lower wind speeds (Figure 1a). The ERA5 reanalysis data effectively captures the spatial distribution characteristics of average surface wind speed across China (Figure 1b), with a spatial correlation coefficient of 0.491 (p < 0.01). However, the ERA5 data tend to underestimate the average surface wind speed in most parts of China compared to observational data (Figure 1c), particularly in the western Tibetan Plateau, northern Inner Mongolia and Gansu, western parts of the three northeastern provinces, and western Sichuan, where the discrepancies between ERA5-derived surface wind speeds and observational data are more pronounced, with larger RMSD (Figure 1d). Thus, ERA5 systematically underestimates surface wind speed across China, especially in high-elevation regions with complex topography, such as Xizang, Qinghai, and western Sichuan (Figure 1c,e).

3.2. Elevation-Dependent Error Patterns

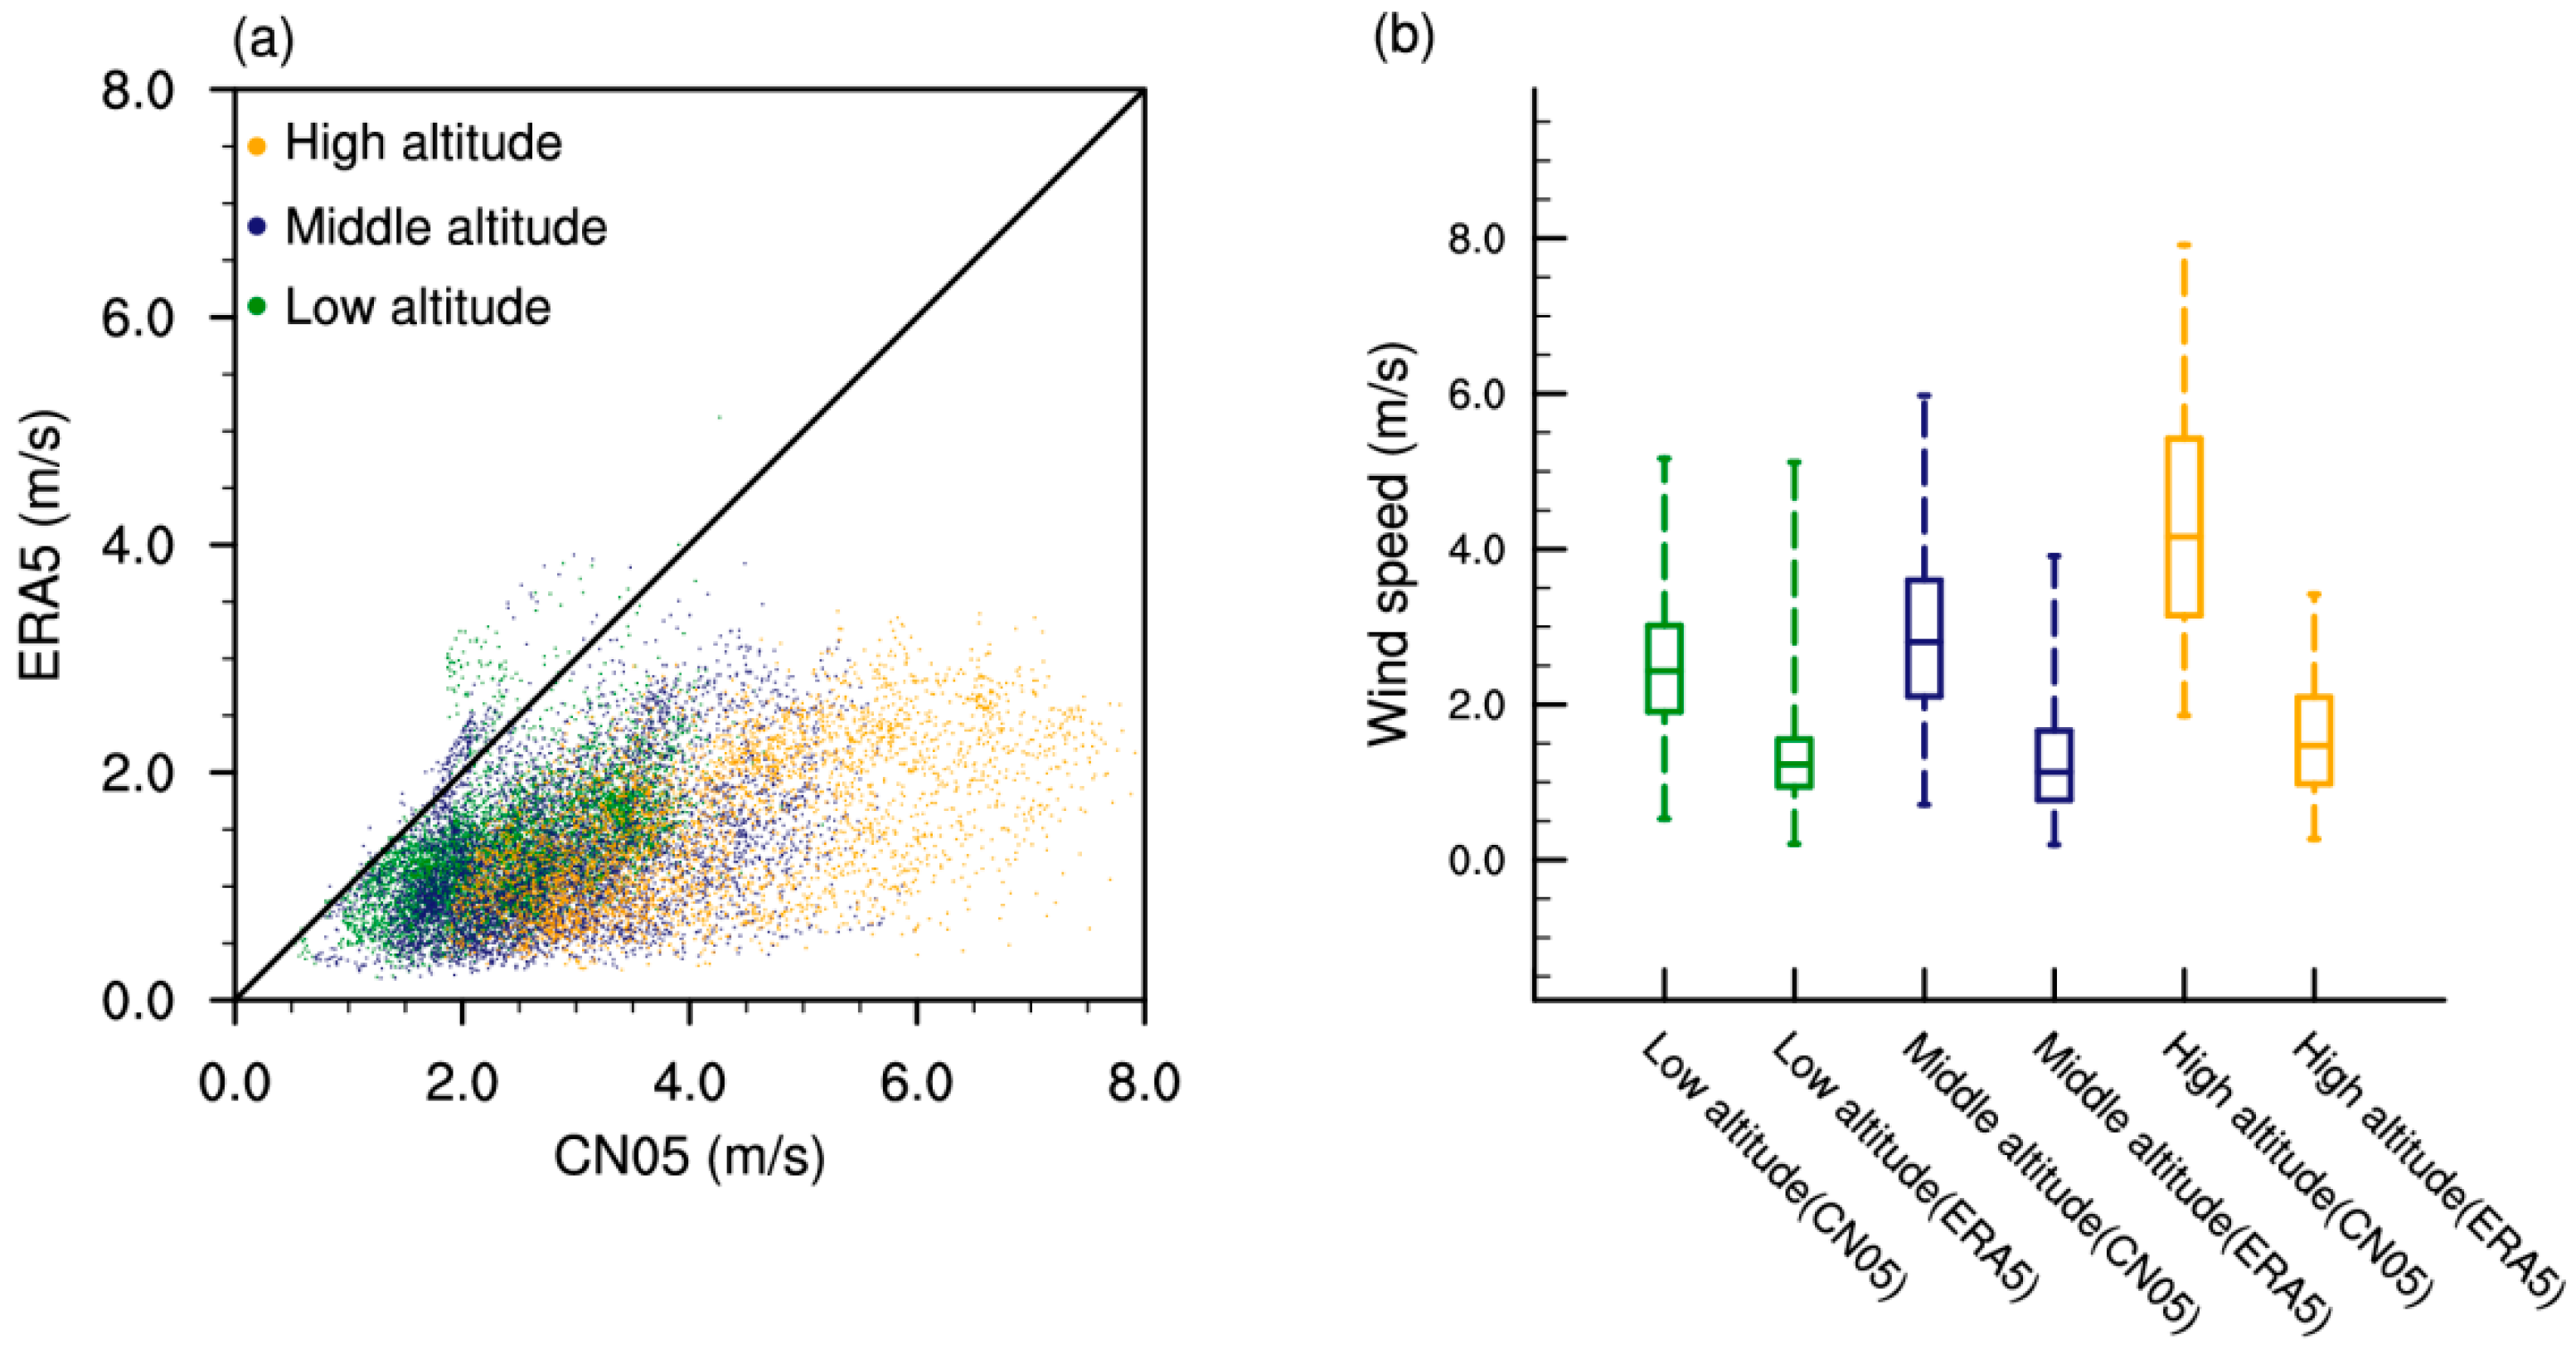
To evaluate the performance of ERA5 surface wind speed data across different terrains in China, we classified regions into three categories based on elevation: low-altitude areas (elevation < 1000 m), mid-altitude areas (elevation ≥ 1000 m but <3500 m), and high-altitude areas (elevation ≥ 3500 m). Surface wind speed differences between observations and ERA5 reanalysis data covering the period of 1961–2018 across elevation zones were analyzed here, including their seasonality. To examine terrain-related variations, Figure 2 presents a scatterplot of mean wind speeds for each elevation zone, where individual grid cells are represented by colored dots according to their elevation classification. The ERA5 reanalysis data generally underestimate observed wind speeds across all elevation zones, with deviations from the diagonal line becoming more pronounced at higher altitudes (Figure 2a). In the observations, higher wind speeds are typically observed in high-altitude regions compared to low-altitude areas (Figure 2b). Observed wind speeds in low-altitude regions have a median value (p50) of approximately 2.4 m/s, while the median wind speeds in the middle- and high-altitude regions are about 2.8 m/s and 4.2 m/s, respectively (Figure 2b). ERA5 reanalysis data systematically underestimate observed wind speeds and fail to reproduce their elevation-dependent pattern, with median wind speeds of 1.2 m/s (low-altitude), 1.1 m/s (middle-altitude), and 1.5 m/s (high-altitude regions), respectively (Figure 2b).
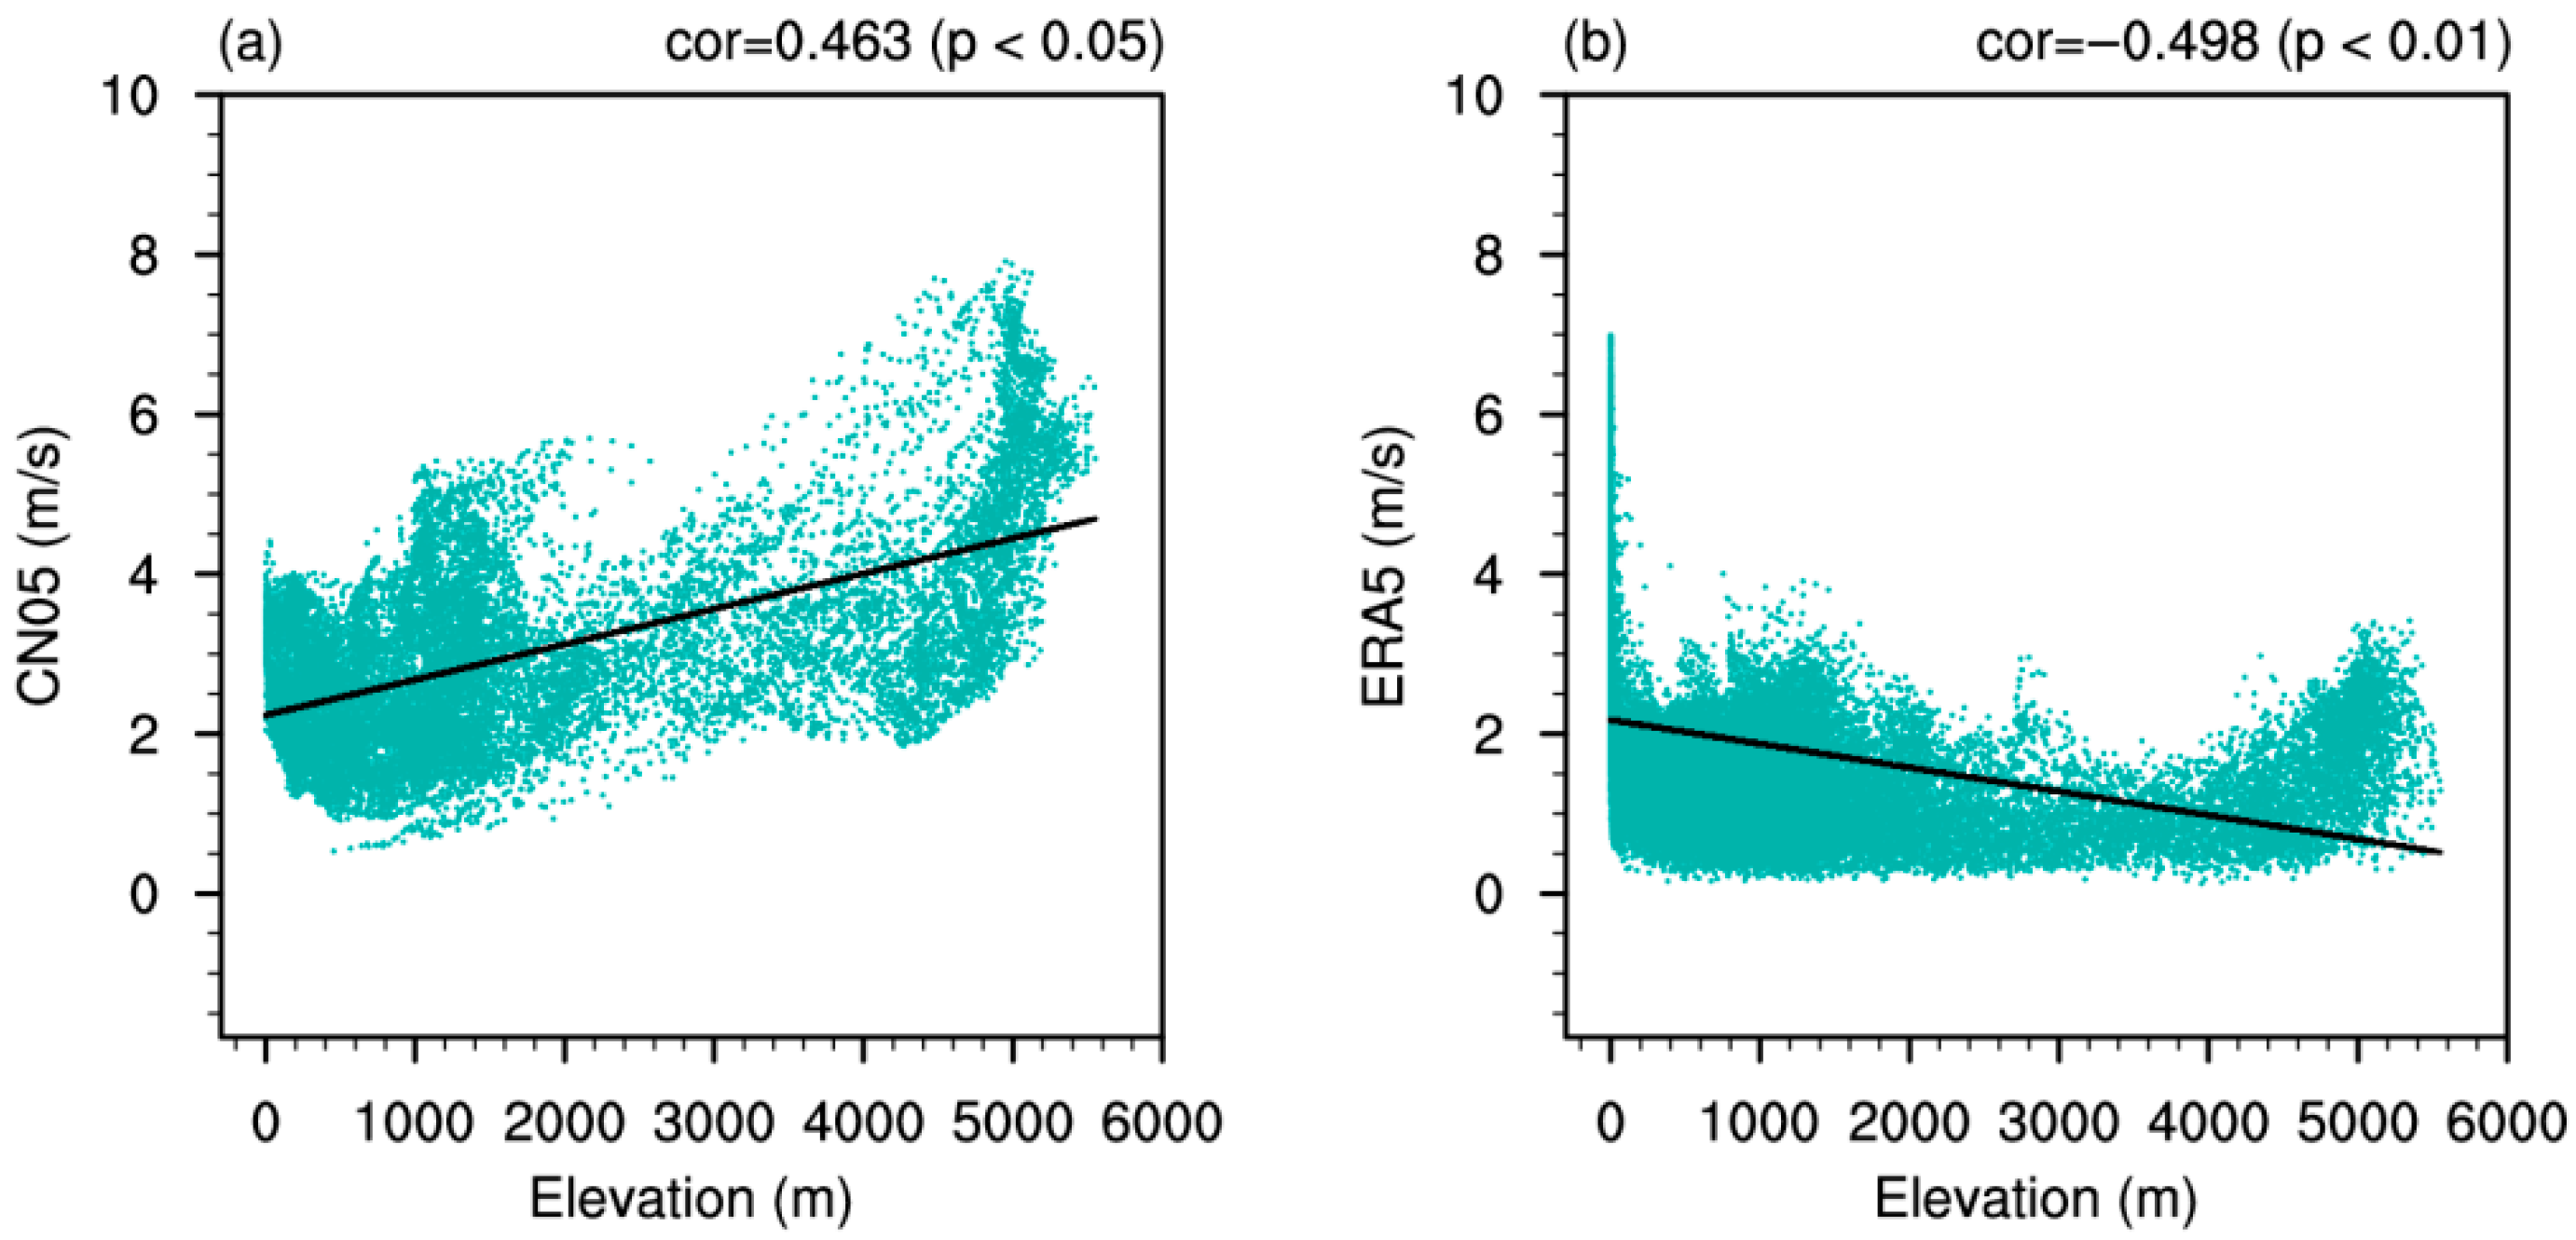
To further investigate the geographical characteristics and underlying deviations of the observed spatial pattern, we plotted mean surface wind speed against elevation for each grid cell (Figure 3). The results clearly demonstrate a positive elevation–wind speed relationship in observations, with a statistically significant correlation coefficient of 0.463 (p < 0.05) between mean wind speed and altitude across China (Figure 3a). However, ERA5 reanalysis shows a statistically significant negative dependence of wind speed on elevation (R = −0.498, p < 0.01; Figure 3b), revealing a fundamental limitation in mountainous region representation.
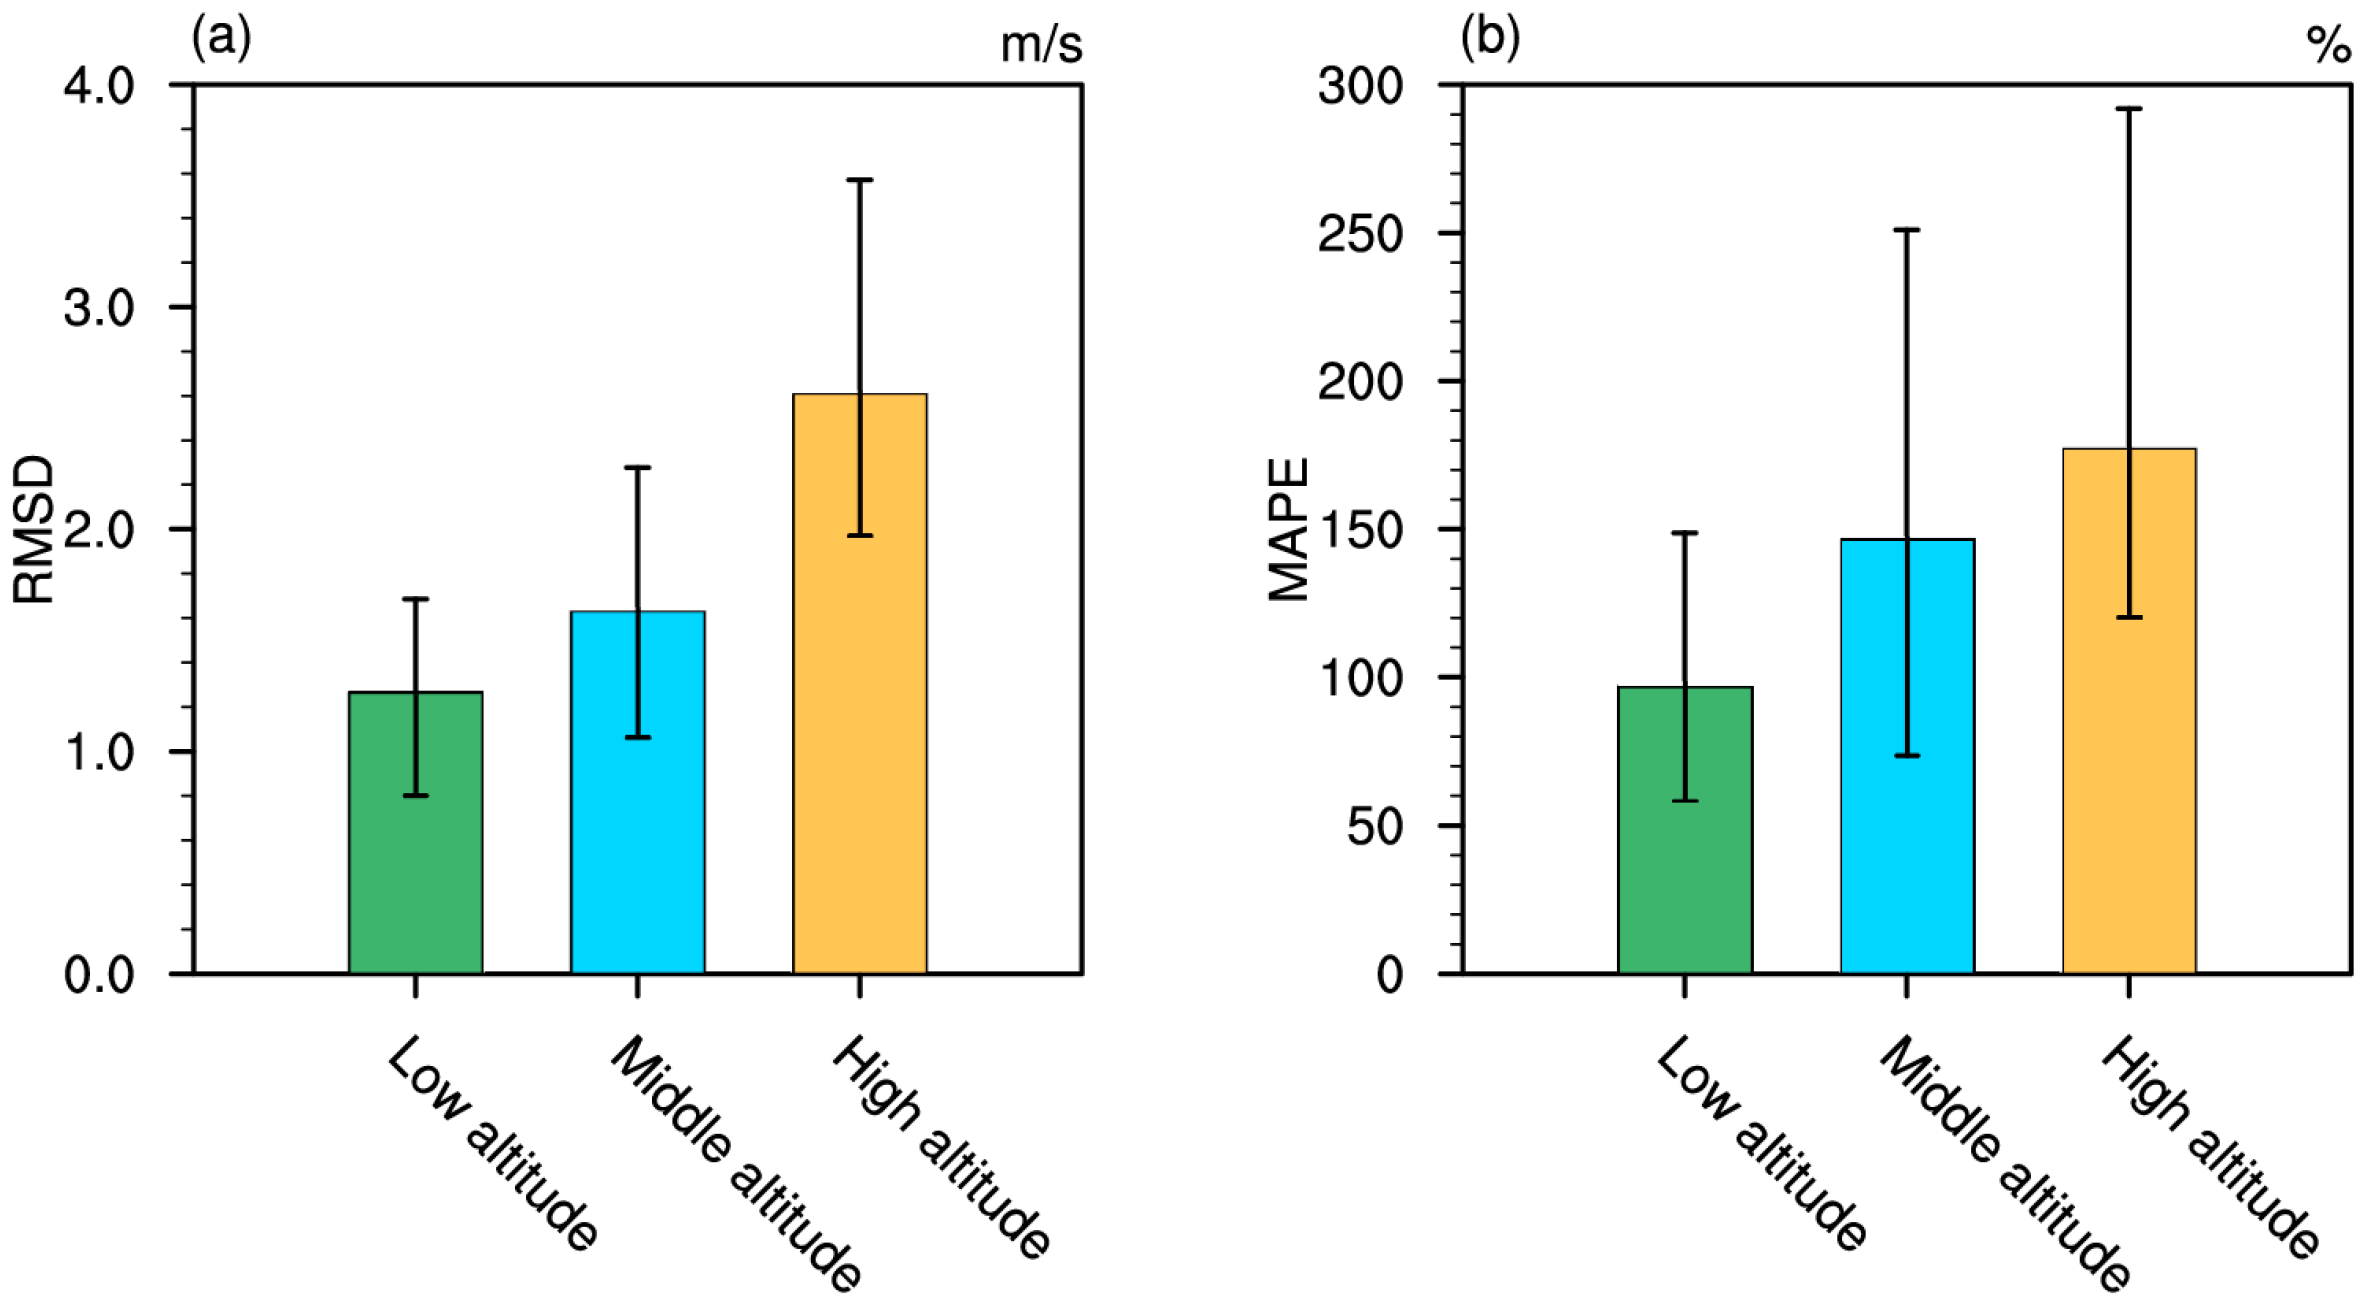
The failure of ERA5 reanalysis to capture the altitudinal variation of wind speed may indicate greater biases in high-elevation regions. Figure 4 analyzes the RMSD and MAPE between observational data and ERA5 reanalysis across three elevation zones over the period of 1961–2018. On average, RMSD exhibits a pronounced altitudinal gradient, with median values increasing from 1.3 m/s in low-elevation areas (<1000 m) to 2.6 m/s in high-altitude regions (≥3500 m) (Figure 4a). Similarly, MAPE increases with altitude, showing median values of 97% at low elevations, 147% at middle elevations (1000–3500 m), and 177% in high-altitude zones (Figure 4b).
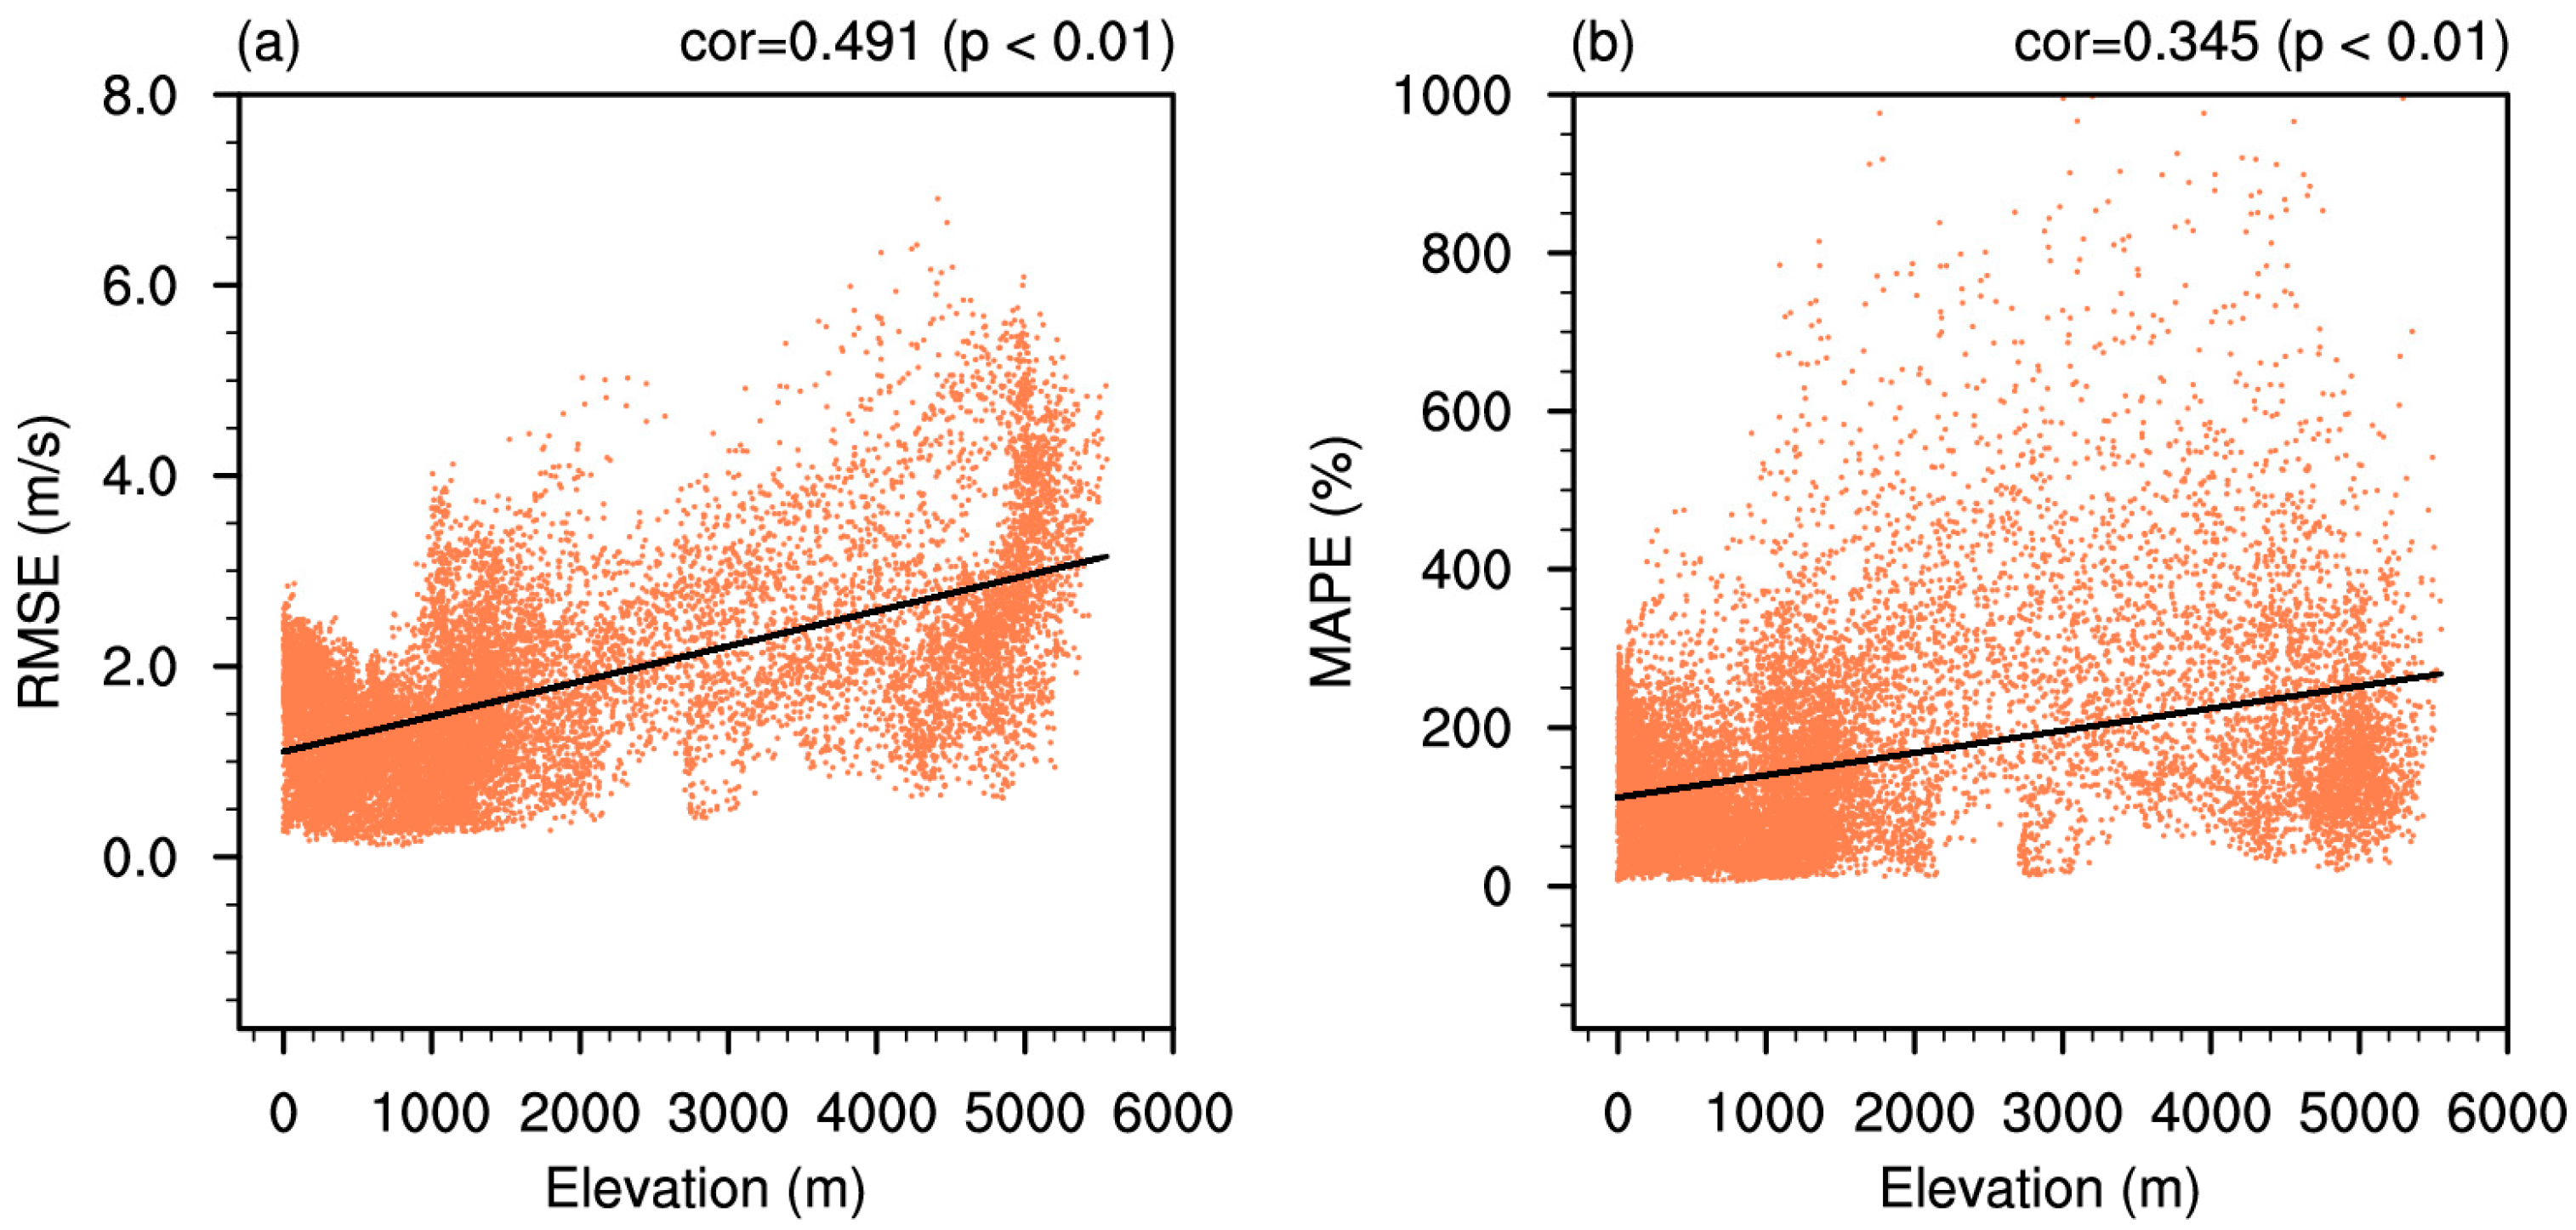
The relationships between RMSD/MAPE and altitude across China were analyzed to quantify the elevation-dependent deviations between ERA5 reanalysis and CN05.1 observations over the period of 1961–2018 (Figure 5). In general, the higher the altitude, the larger the RMSD (Figure 5a) and MAPE (Figure 5b) values between observed data and ERA5 analysis data across China. The correlation coefficients between altitude and RMSD/MAPE are 0.491 (p < 0.01) and 0.345 (p < 0.01), respectively. These elevation-dependent increases in both RMSD and MAPE indicate that ERA5 reanalysis demonstrates greater deviations from CN05.1 observations in topographically complex high-terrain environments.
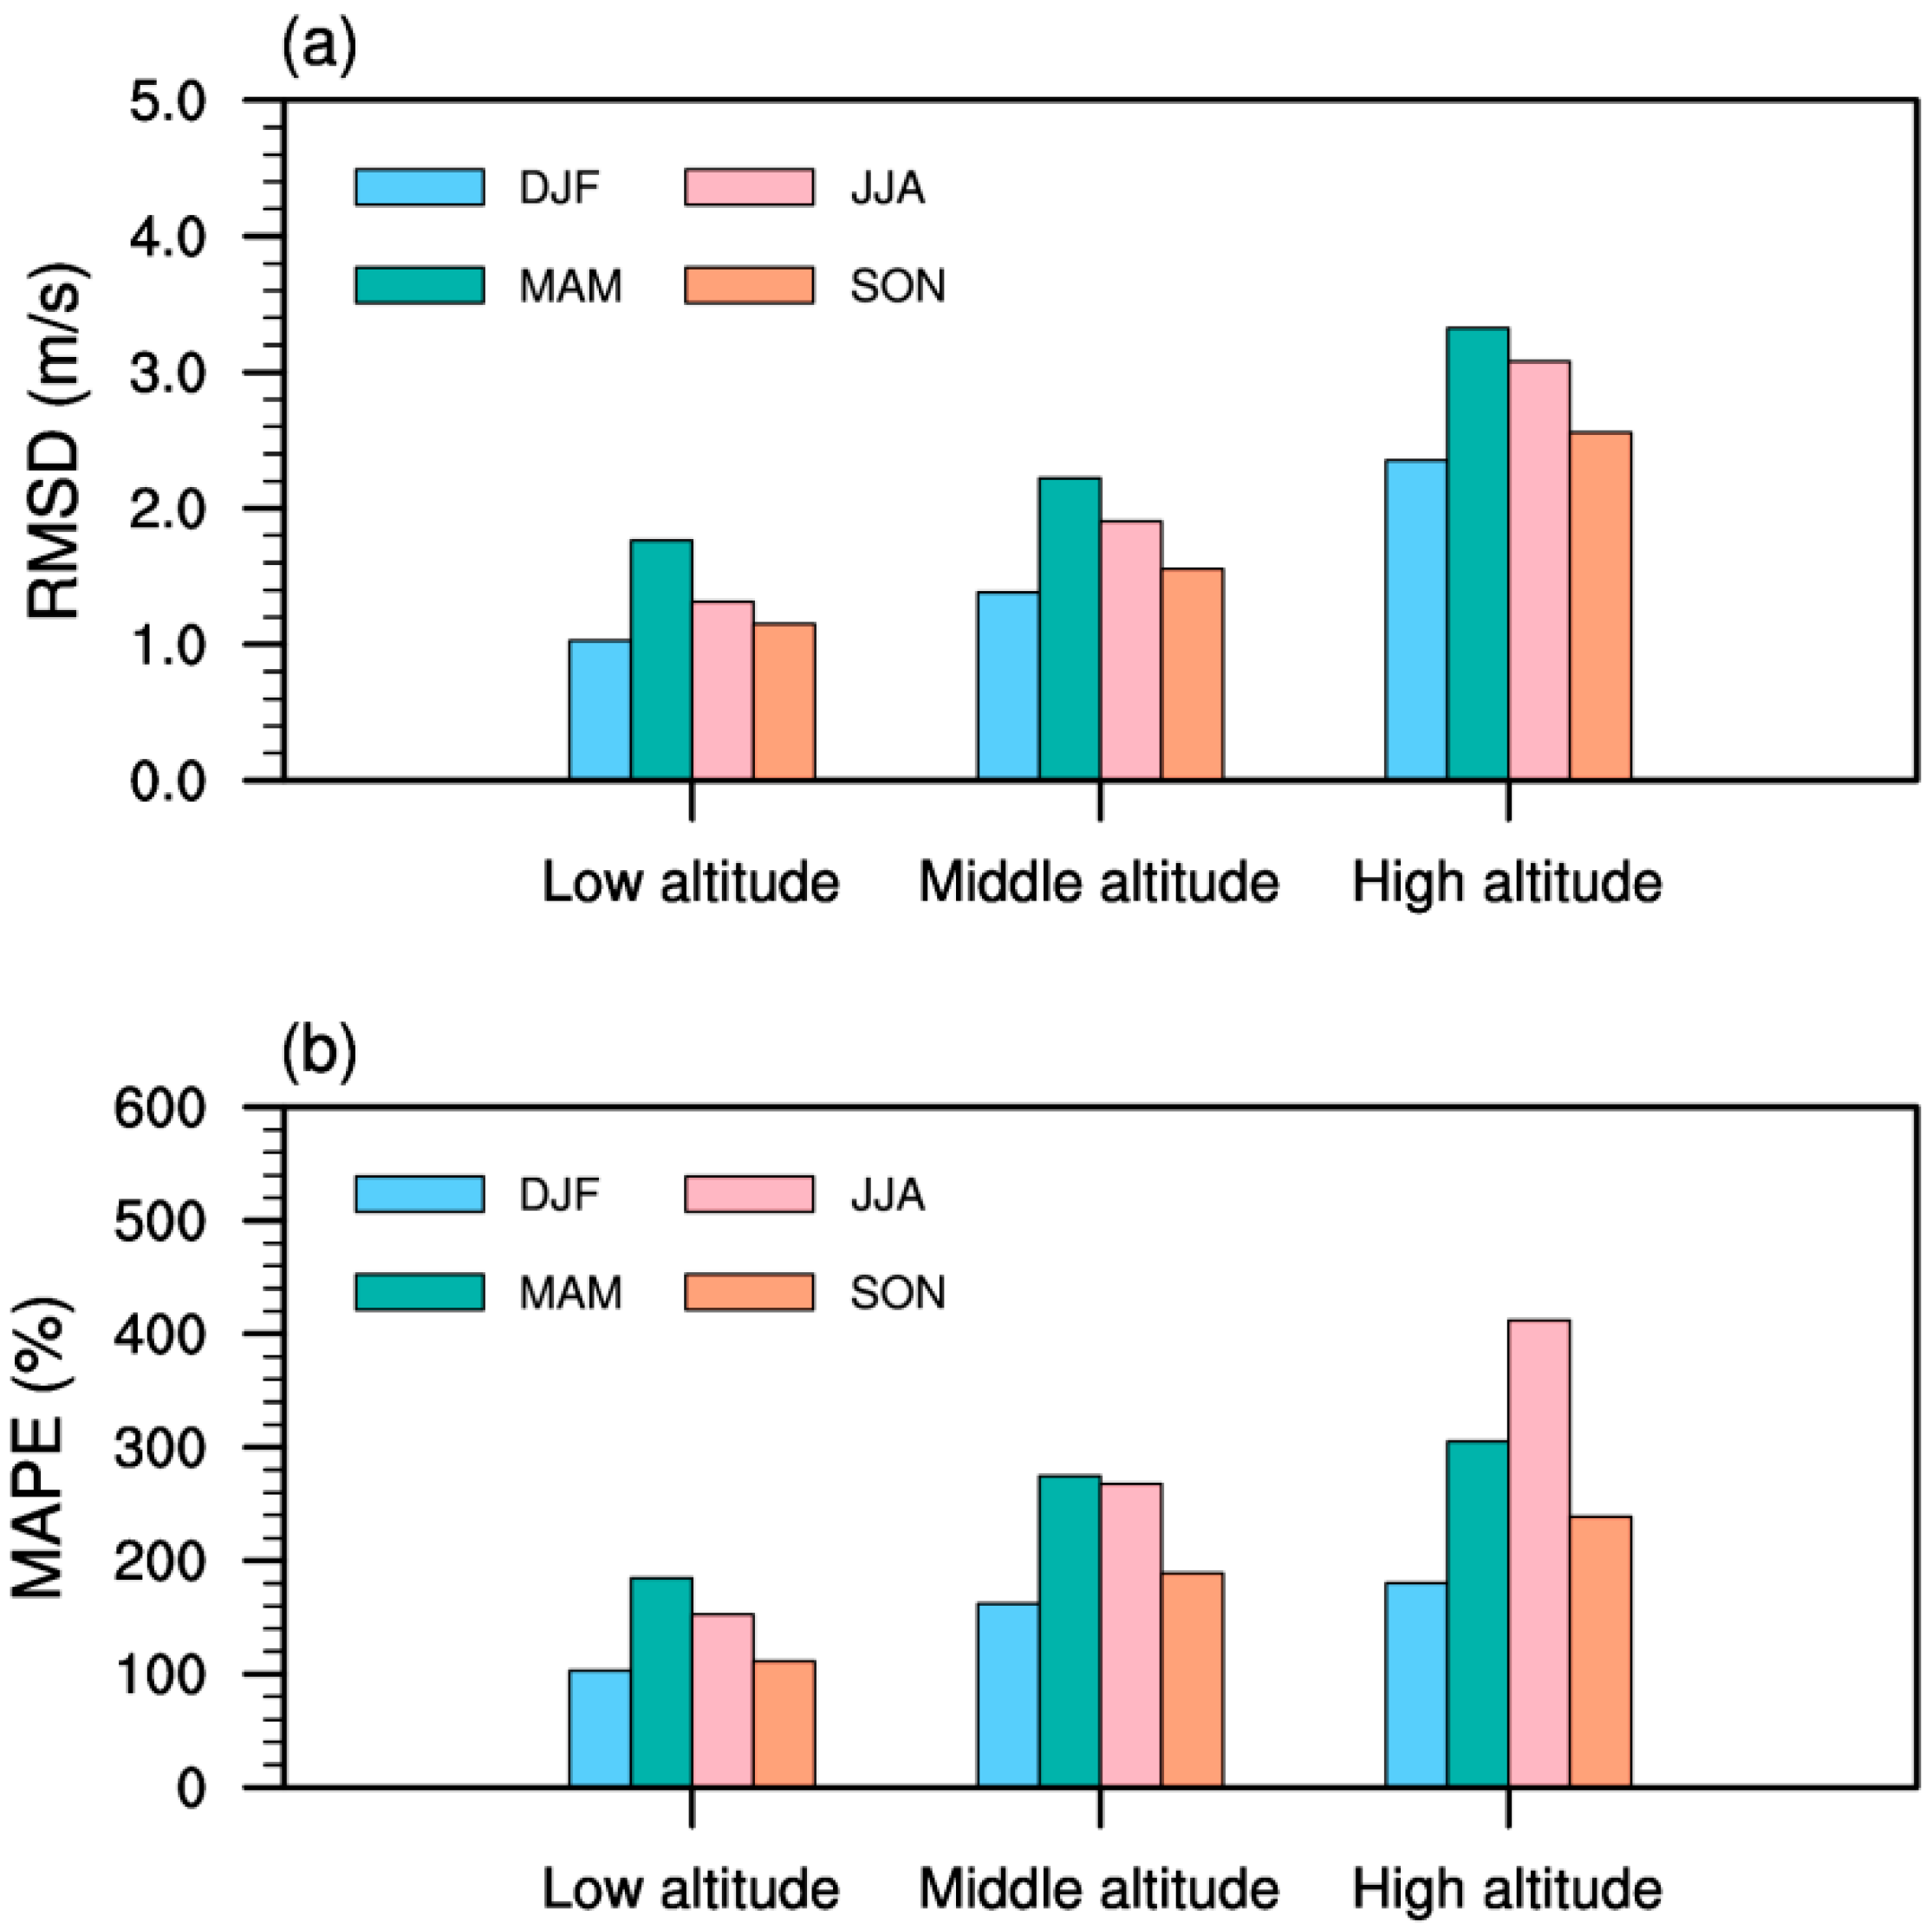
Seasonal surface wind speeds in ERA5 exhibit consistent elevation-dependent biases, with larger deviations in spring/summer and smaller deviations in autumn/winter across all elevation zones (Figure 6). The maximum RMSD occurs in high-altitude regions during spring (mean: 3.3 m/s), while the minimum appears in low-altitude regions during winter (mean: 1.0 m/s) (Figure 6a). For MAPE, peak values occur in high-altitude regions during summer (mean: 412%), contrasting with winter minima in low-altitude regions (mean: 103%) (Figure 6b). This seasonal discrepancy between RMSD (spring peak) and MAPE (summer peak) may stem from differences in mean wind speed magnitudes between seasons. In summary, ERA5 demonstrates relatively accurate characterization of surface wind speeds in low-altitude regions, particularly during autumn and winter, but shows significant deficiencies in high-altitude areas, especially in spring and summer.

3.3. Terrain-Induced Variability Analysis

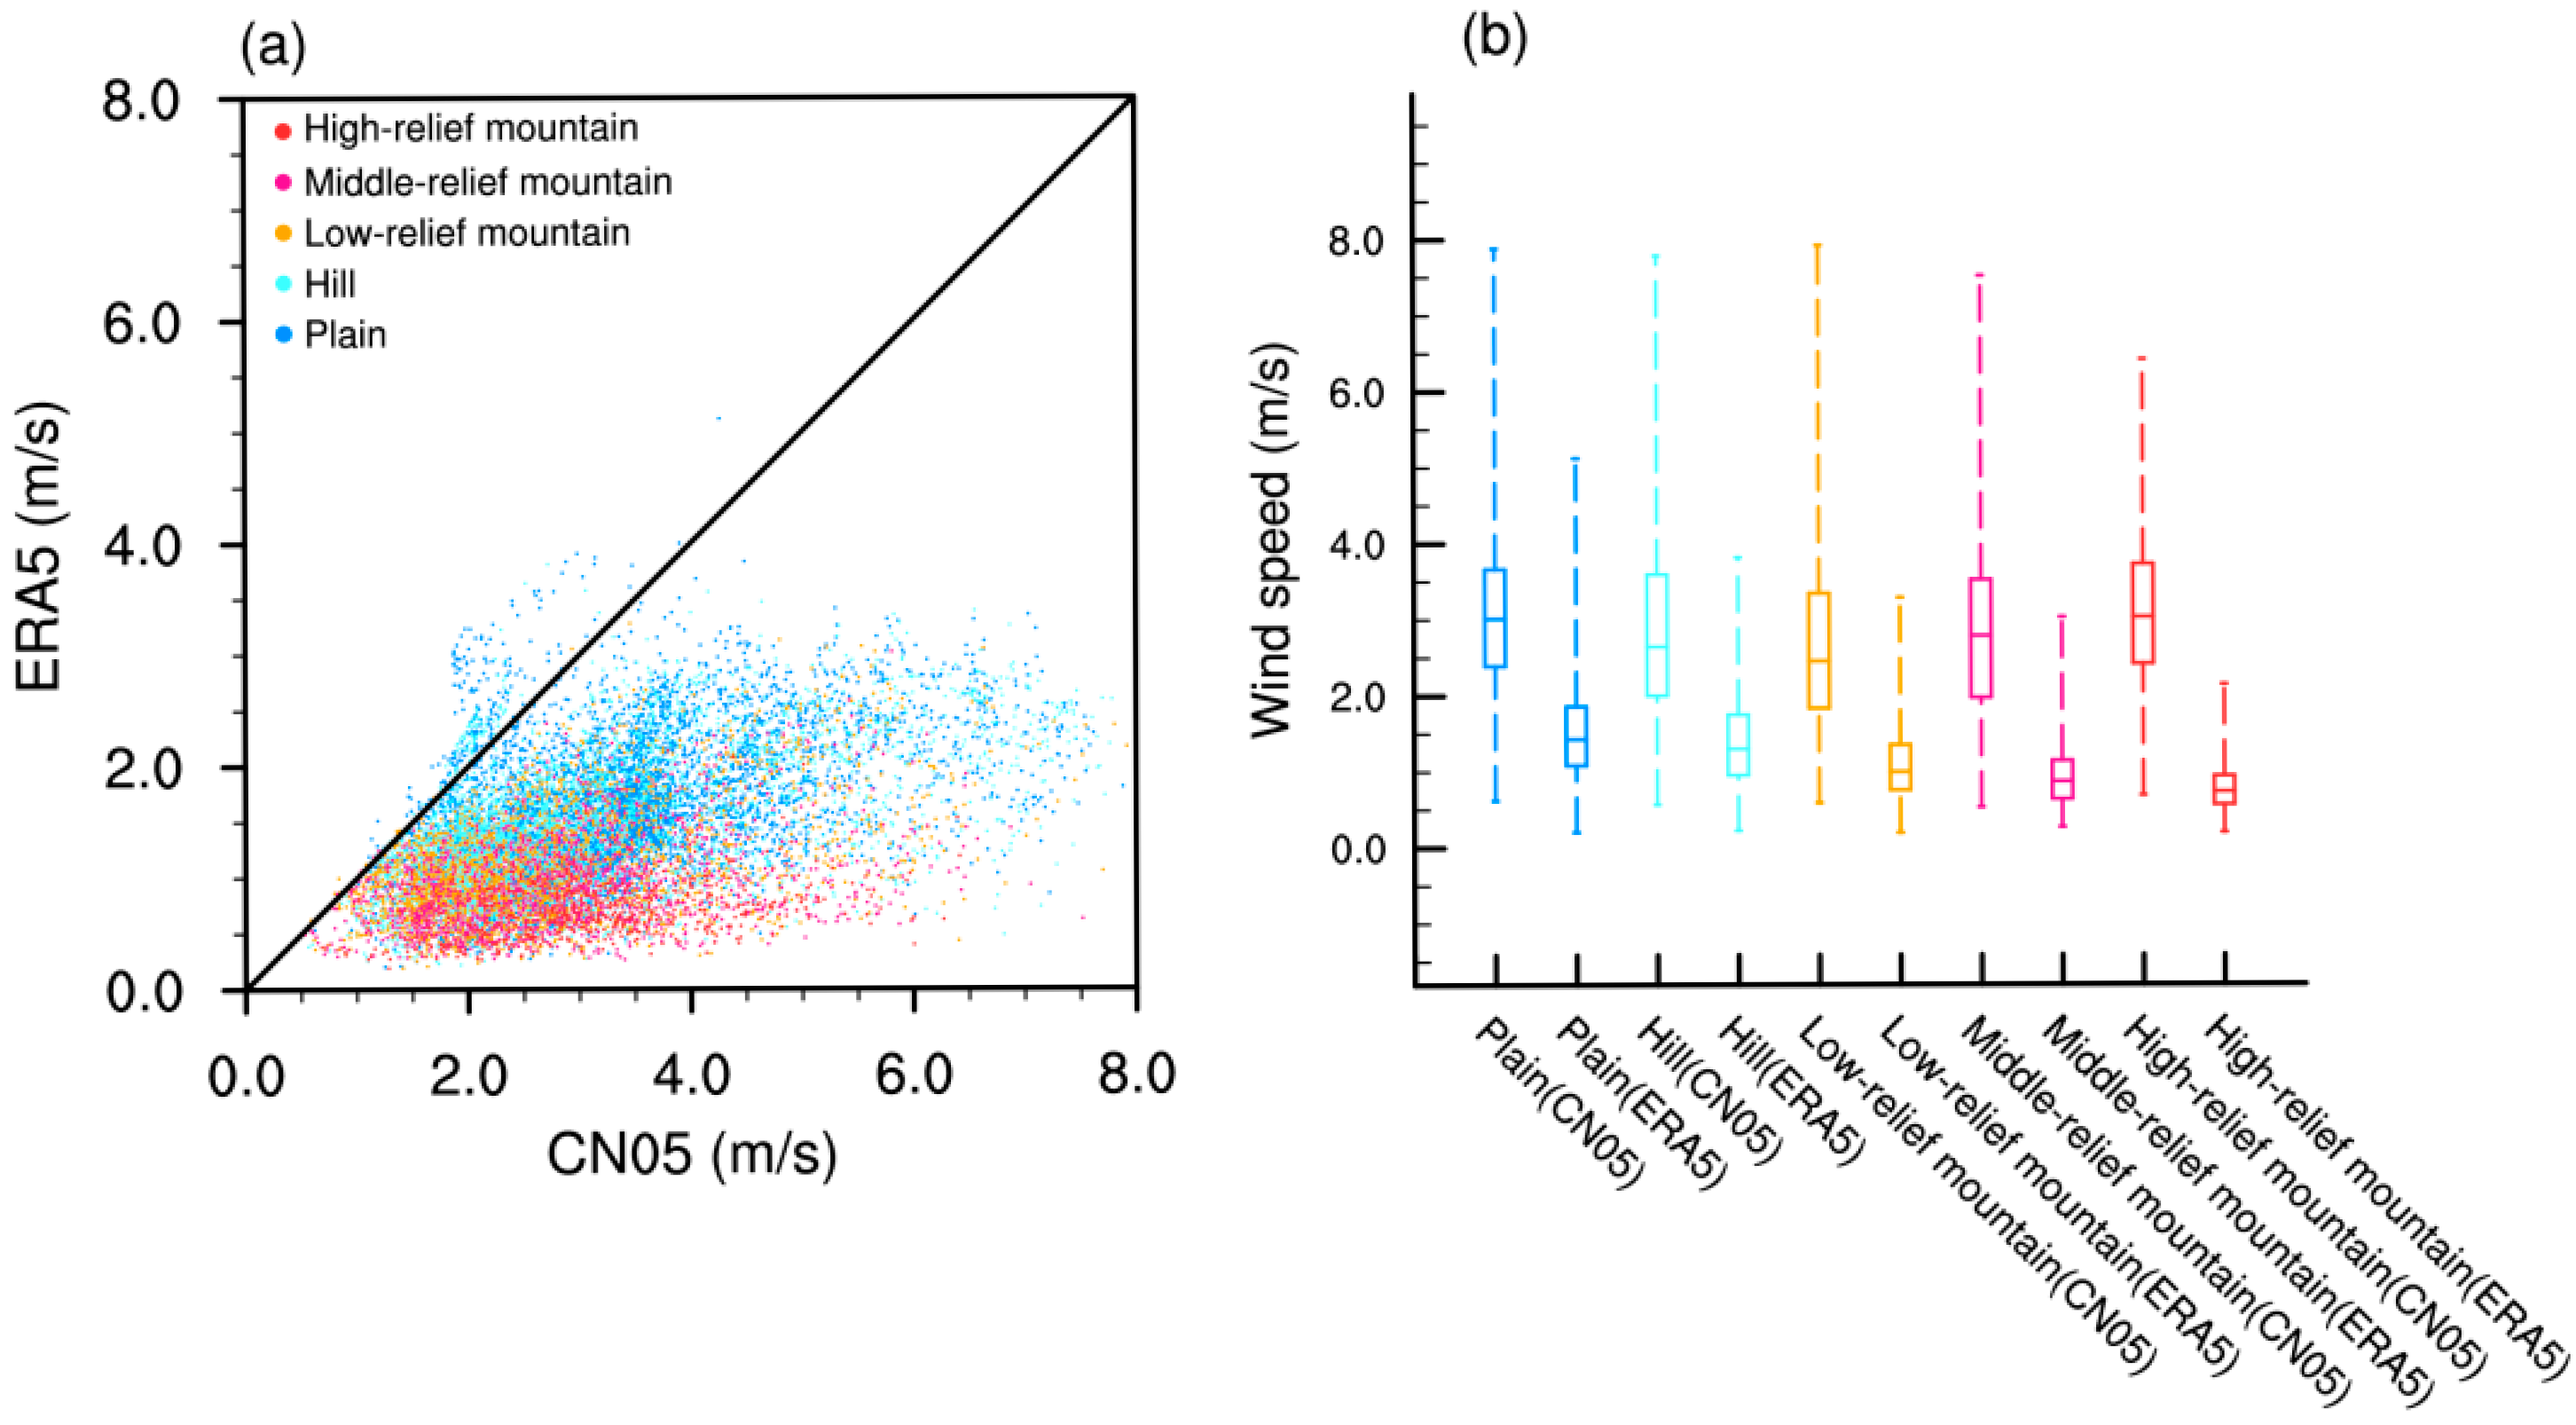
Furthermore, we evaluated the applicability of ERA5 surface wind speed data across five relief-based terrain classes: plains, hills, low-relief mountains, medium-relief mountains, and high-relief mountains, to assess terrain-induced variability in bias metrics. The ERA5 reanalysis data demonstrate significantly larger wind speed errors in topographically complex mountainous areas compared to relatively flat plains and hills, as evidenced by their stronger deviations from the diagonal line (Figure 7a).
On average, observational data show that plains generally exhibit higher mean wind speeds than hilly areas, with median values of 3.0 m/s (plains) versus 2.6 m/s (hills). ERA5 reanalysis data successfully capture the characteristic pattern of higher wind speeds in plains relative to hills, albeit with systematic underestimation. Median wind speeds are 1.4 m/s (plains) versus 1.3 m/s (hills) in the reanalysis data (Figure 7b). Regarding mountainous areas with varying relief, observational data demonstrate that greater topographic relief correlates with stronger surface wind speeds, with median values increasing from 2.5 m/s (low-relief) to 3.0 m/s (high-relief). In contrast to observations, the ERA5 reanalysis shows lower wind speeds in high-relief mountains compared to low-relief mountainous areas, with median values of 0.7 m/s versus 1.0 m/s, respectively (Figure 7b). Therefore, ERA5 systematically fails to accurately capture the variations of surface wind speed across diverse undulating terrains.
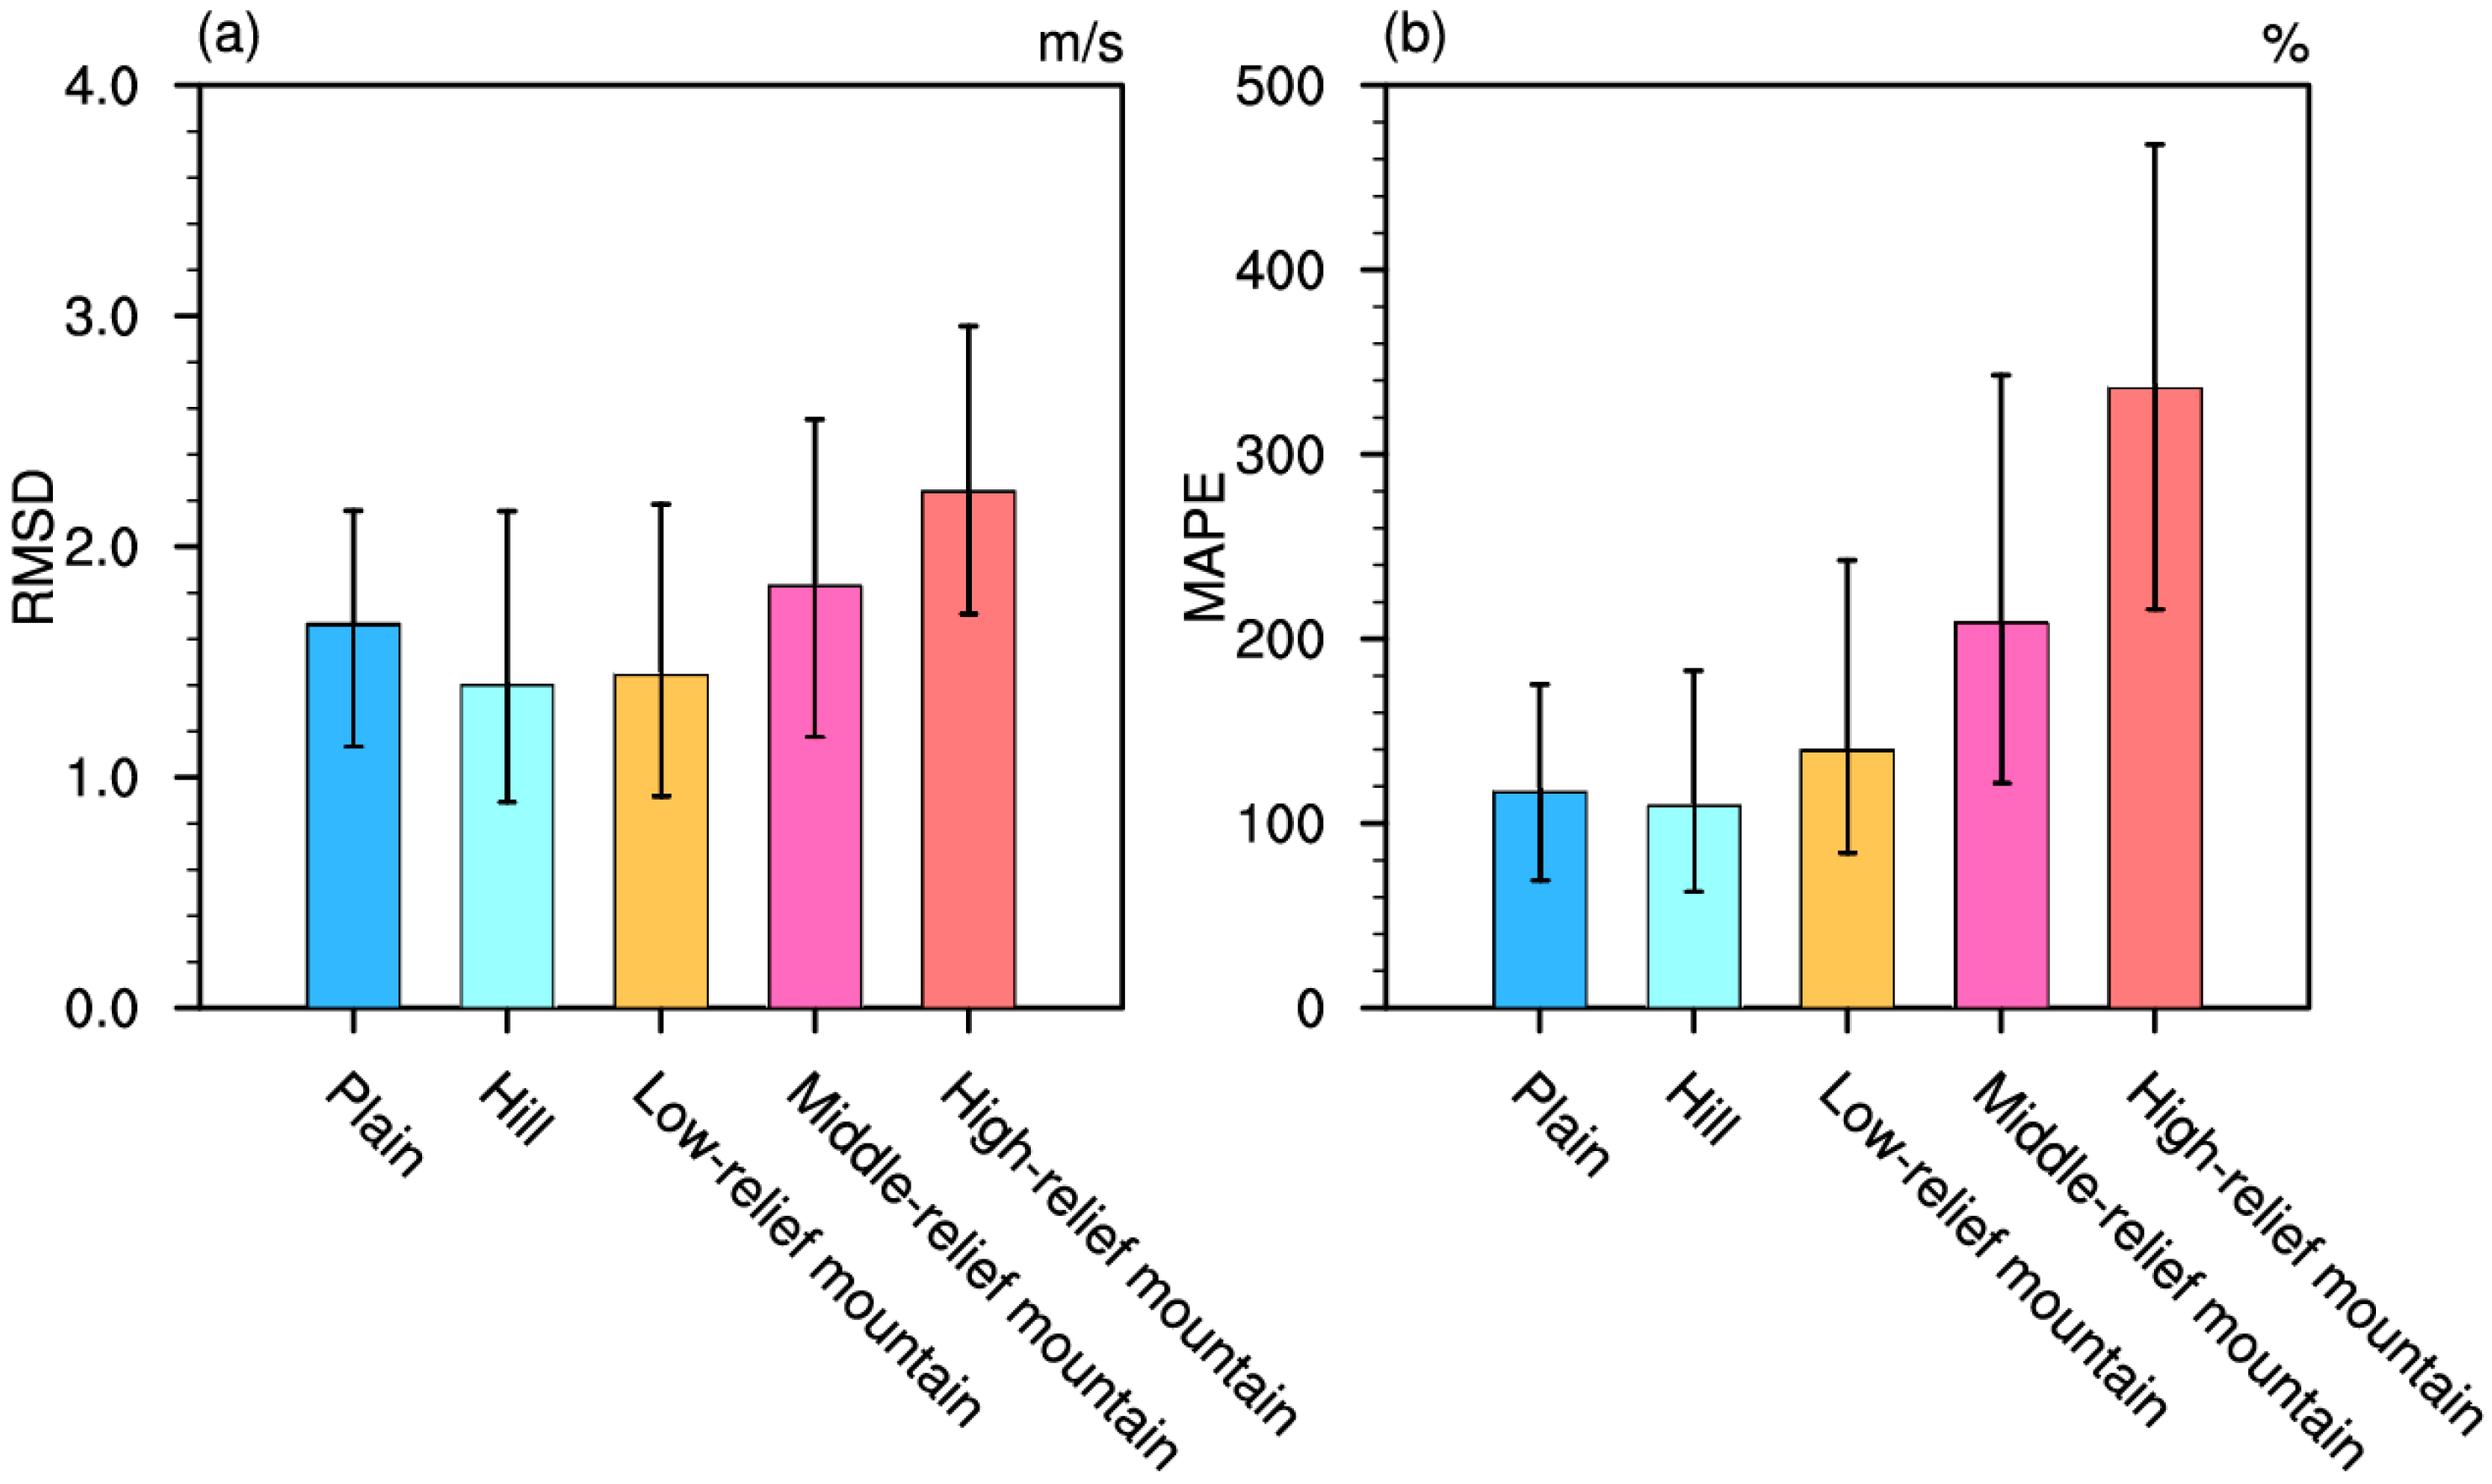
Accordingly, ERA5 exhibits larger errors in plain areas than in hilly areas. The median RMSD and MAPE in plains are 1.7 m/s and 117%, respectively, both exceeding those in hilly regions (median RMSD: 1.4 m/s; median MAPE: 110%). Both RMSD and MAPE between observations and ERA5 data peak in high-relief mountainous areas (median RMSD: 2.2 m/s; median MAPE: 336%), significantly exceeding values in low-relief regions (median RMSD: 1.4 m/s; median MAPE: 140%) (Figure 8). This pronounced contrast underscores the limitations of ERA5 in simulating wind dynamics over steep terrain. These maximal RMSD (Figure 8a) and MAPE (Figure 8b) values over high-relief terrain may indicate that ERA5 systematically underestimates orographic wind enhancement and poorly represents slope-induced accelerations [81,82,83].
Regarding seasonal wind speeds, ERA5 exhibits relatively small biases over plains, hills, and low-relief mountains, but shows larger deviations in medium- and high-relief mountainous areas. The most significant biases occur in high-relief mountains during spring (mean RMSD: 2.9 m/s, Figure 9a; mean MAPE: 553%, Figure 9b), whereas the smallest deviations are found in hilly regions during winter (mean RMSD: 1.3 m/s, Figure 9a; mean MAPE: 106%, Figure 9b). Consequently, ERA5 exhibits significant deficiencies in representing wind fields across complex topography, particularly during spring and summer seasons.

4. Conclusions

Evaluating the applicability of ERA5 reanalysis data across complex terrains in China is of great significance for atmospheric science, climatology, and energy applications. While ERA5 successfully reproduces the macro-scale spatial distribution of surface winds, systematic underestimations prevail, particularly in plateau and mountainous regions. ERA5 exhibits smaller biases in low- and mid-altitude regions but significantly larger biases in high-altitude areas, with error metrics demonstrating strong elevation dependence. Hence, ERA5 fails to accurately represent elevation-driven variations in surface wind speed. Regarding terrain complexity, ERA5 shows minor biases in plains and hilly areas (with hills displaying the smallest errors), whereas substantial errors occur in high-relief mountains compared to low-relief mountains. Among all undulating terrains, high-relief mountains exhibit the maximum bias, while hills show the minimum, revealing limitations in orographic flow representation.
Collectively, ERA5 surface wind speed data remain applicable for analyzing climatological spatial distributions across China—particularly over low-to-moderate elevation plains, hills, and low-relief mountains. However, they exhibit significant deficiencies in capturing wind fields within complex topography, especially in high-altitude zones and high-relief mountains, where the RMSD exceeds 2 m/s for both regions. These deficiencies are seasonally amplified, peaking most prominently during spring and summer.
These findings establish a critical benchmark for reanalysis applications in complex terrain and provide actionable insights for improving next-generation climate models. The demonstrated elevation- and relief-dependent errors underscore the necessity of terrain-aware utilization of ERA5 products in scientific and operational contexts.

5. Discussion

5.1. Reasons for ERA5’s Failure to Capture Orographic Effects

ERA5 tends to underestimate surface wind speed in regions with complex topography, which agrees with previous studies [52,84]. The fundamental reasons mainly stem from inadequately resolved topographic features and the parameterization of orographic drag within the model [85]. Due to inherent spatial discretization in atmospheric models, surface properties such as orography undergo inevitable smoothing [86]. This topographic approximation introduces significant inaccuracies in mountainous regions, where subgrid heterogeneity—driven by unresolved valleys and ridges—dominates local flow dynamics. Such unresolved terrain features systematically bias wind simulations across complex terrains through distortions in momentum transport and thermal forcing [86].
Meanwhile, ERA products such as ERA-Interim and ERA5 exclude near-surface wind observations over land during data assimilation, as these cannot be effectively utilized. Instead, wind profiles from radiosondes, aircraft, satellites, and other sources provide vertical input data over land surfaces [38,76]. It might also affect wind accuracy in ERA5.
To achieve precise wind speed assessments, reanalysis data can be integrated into computational fluid dynamics models for downscaling complex flows generated by local terrain features [87,88]. Meanwhile, significant improvements are particularly evident in mountainous regions when station elevation differences are incorporated into parameterization schemes [89].

5.2. Limitations and Outlook

While this study quantifies elevation- and terrain-dependent biases in ERA5 surface winds over China, several limitations warrant attention. First, to facilitate direct comparison against ERA5 reanalysis data, the gridded observational product CN05.1 is utilized throughout this work. As documented in prior studies [60,90], CN05.1 demonstrates robust agreement with in situ observations across eastern China, where station density is high. While interpolation uncertainty exists in western regions due to sparser observational coverage, CN05.1 remains the optimal gridded dataset for characterizing wind speed over mainland China, with an RMSD of 0.595 m/s [64]. CN05.1 continues to serve as the most widely used benchmark for climate model validation in China owing to its homogenized quality control, temporal coverage, and peer-reviewed methodology. Although this study leverages the spatially homogeneous CN05.1 dataset for systematic evaluation, high-elevation field measurements remain indispensable for resolving fine-scale processes in topographically complex regions. Future work should prioritize acquiring in-situ observations across western China’s mountainous terrain (e.g., the Tibetan Plateau) to advance our understanding of orographic wind mechanisms—particularly where gridded products exhibit higher uncertainty due to sparse station coverage. Such targeted validation would elucidate interactions between synoptic-scale circulations and local topography, ultimately refining model representations of boundary-layer dynamics.
Second, it is important to acknowledge a key limitation inherent in our comparative methodology: the temporal resolution of the datasets employed. Both the ERA5 reanalysis and the CN05.1 observational dataset used in this evaluation were analyzed at a monthly-mean resolution. Given the significant sub-monthly variability in surface wind speeds—particularly in complex terrains like plateaus and mountains where local thermal circulations, downslope/valley winds, and synoptic events occur frequently—this monthly resolution inherently smooths over critical high-frequency fluctuations. Consequently, while our analysis robustly characterizes systematic mean-state biases, it cannot resolve transient discrepancies. Future work will therefore prioritize acquiring high-temporal-resolution observations to evaluate ERA5’s performance in capturing diurnal cycles and extreme events, thereby capturing the full spectrum of wind variability over complex terrains. This may offer deeper insights into the physical mechanisms driving the biases identified in this study.
Third, while this study provides robust diagnostics for wind simulation biases in China, the generalizability of these findings beyond this region requires critical scrutiny. Caution is warranted when extrapolating these findings globally, as orographic responses are highly sensitive to regional factors including surface heterogeneity and land-ocean configuration—particularly given China’s unique terrain encompassing the world’s highest plateau and vast marginal seas. Nevertheless, the methodological framework established here could offer transferable value for evaluating reanalysis products in other orographically complex regions.

Author Contributions

Conceptualization, L.Z.; Methodology, L.Z.; Software, P.Z.; Validation, X.C.; Formal Analysis, P.Z.; Resources, P.Z.; Data Curation, X.C.; Writing—Original Draft Preparation, P.Z.; Writing—Review and Editing, L.Z.; Visualization, X.C.; Supervision, L.Z.; Funding Acquisition, P.Z. and L.Z. All authors have read and agreed to the published version of the manuscript.

Funding

This work was supported by National Key R&D Plan “Inter-governmental International Science & Technology Innovation Cooperation” Key Specialized Program (2023YFE0112700), and the National Natural Science Foundation of China (42075019).

Institutional Review Board Statement

Not applicable.

Informed Consent Statement

Not applicable.

Data Availability Statement

In the present analysis, all datasets used are publicly available. The gridded observational data (CN05.1) can be accessed via https://ccrc.iap.ac.cn/resource (accessed on 21 September 2024). Global basic landform classification data are available at http://geodata.nnu.edu.cn (accessed on 20 January 2025). ERA5 reanalysis data are distributed through https://climate.copernicus.eu/ (accessed on 25 January 2025).

Acknowledgments

We acknowledge the Climate Change Research Center, Chinese Academy of Sciences for providing the gridded observational dataset (available at: https://ccrc.iap.ac.cn/resource/ (accessed on 21 September 2024)). We also thank the Yangtze River Delta Science Data Center, National Earth System Science Data Center (part of the National Science and Technology Infrastructure of China) for sharing the global basic landform classification data (accessible via: http://geodata.nnu.edu.cn/ (accessed on 20 January 2025)).

Conflicts of Interest

Authors Peng Zuo and Xiangdong Chen were employed by the company China Power Engineering Consulting Group International Engineering Co., Ltd. The remaining authors declare that the research was conducted in the absence of any commercial or financial relationships that could be construed as a potential conflict of interest.

References

  1. McVicar, T.R.; Roderick, M.L.; Donohue, R.J.; Li, L.T.; Van Niel, T.G.; Thomas, A.; Grieser, J.; Jhajharia, D.; Himri, Y.; Mahowald, N.M.; et al. Global review and synthesis of trends in observed terrestrial near-surface wind speeds: Implications for evaporation. J. Hydrol. 2012, 416–417, 182–205. [Google Scholar] [CrossRef]
  2. Han, Z.; Zhou, B.; Xu, Y.; Wu, J.; Shi, Y. Projected changes in haze pollution potential in China: An ensemble of regional climate model simulations. Atmos. Chem. Phys. 2017, 17, 10109–10123. [Google Scholar] [CrossRef]
  3. Zeng, Z.; Ziegler, A.D.; Searchinger, T.; Yang, L.; Chen, A.; Ju, K.; Piao, S.; Li, L.Z.X.; Ciais, P.; Chen, D.; et al. A reversal in global terrestrial stilling and its implications for wind energy production. Nat. Clim. Change 2019, 9, 979–985. [Google Scholar] [CrossRef]
  4. McMahon, R.A.; Peel, A.M.; Lowe, L.; Srikanthan, R.; McVicar, T.R. Estimating actual, potential, reference crop and pan evaporation using standard meteorological data: A pragmatic synthesis. Hydrol. Earth Syst. Sci. 2013, 17, 1331–1363. [Google Scholar] [CrossRef]
  5. Liu, X.; Zhang, X.J.; Tang, Q.; Zhang, X.Z. Effects of surface wind speed decline on modeled hydrological conditions in China. Hydrol. Earth Syst. Sci. 2014, 18, 2803–2813. [Google Scholar] [CrossRef]
  6. Zhang, Y.; Gao, L.N.; Cao, L.J.; Yan, Z.; Wu, Y. Decreasing atmospheric visibility associated with weakening winds from 1980 to 2017 over China. Atmos. Environ. 2020, 222, 117314. [Google Scholar] [CrossRef]
  7. Cai, W.; Li, K.; Liao, H.; Wang, H.; Wu, L. Weather conditions conducive to Beijing severe haze more frequent under climate change. Nat. Clim. Change 2017, 7, 257–262. [Google Scholar] [CrossRef]
  8. Valjarević, A. Long-term remote sensing-based methods for monitoring air pollution and cloud cover in the Balkan countries. Environ. Sci. Pollut. Res. 2024, 31, 27155–27171. [Google Scholar] [CrossRef] [PubMed]
  9. Wang, R.; Liu, B.; Li, H.; Zou, X.; Wang, J.; Liu, W.; Cheng, H.; Kang, L.; Zhang, C. Variation of strong dust storm events in northern China during 1978−2007. Atmos. Res. 2017, 183, 166–172. [Google Scholar] [CrossRef]
  10. Pryor, S.C.; Barthelmie, R.J. A global assessment of extreme wind speeds for wind energy applications. Nat. Energy 2021, 6, 268–276. [Google Scholar] [CrossRef]
  11. Ding, Y.; Li, X.; Li, Q. Advances of surface wind speed changes over China under global warming. J. Appl. Meteorol. Sci. 2020, 31, 1–12. (In Chinese) [Google Scholar] [CrossRef]
  12. Tian, Q.; Huang, G.; Hu, K.; Niyogi, D. Observed and global climate model based changes in wind power potential over the Northern Hemisphere during 1979–2016. Energy 2019, 167, 1224–1235. [Google Scholar] [CrossRef]
  13. Wu, J.; Zha, J.; Zhao, D.; Yang, Q. Changes in terrestrial near-surface wind speed and their possible causes: An overview. Clim. Dynam. 2018, 51, 2039–2078. [Google Scholar] [CrossRef]
  14. Ding, J.; Cuo, L.; Zhang, Y.; Zhang, C. Varied spatiotemporal changes in wind speed over the Tibetan Plateau and its surroundings in the past decades. Int. J. Climatol. 2021, 41, 5956–5976. [Google Scholar] [CrossRef]
  15. Zha, J.L.; Shen, C.; Wu, J.; Zhao, D.M.; Fan, W.X.; Jiang, H.P.; Azorin-molina, C.; Chen, D. Effects of Northern Hemisphere annular mode on terrestrial near-surface wind speed over eastern China from 1979 to 2017. Adv. Clim. Change Res. 2022, 13, 875–883. [Google Scholar] [CrossRef]
  16. Shang, L.; Li, Z.; Xie, S.; Huang, L.; Meng, L.; Li, X.; Zhong, K. Dynamic Variations in Wind Speed Intensity Across China and Their Association with Atmospheric Circulation Patterns. Asia-Pac. J. Atmos. Sci. 2024, 60, 773–784. [Google Scholar] [CrossRef]
  17. Azorin-Molina, C.; Menendez, M.; McVicar, T.R.; Acevedo, A.; Vicente-Serrano, S.M.; Cuevas, E.; Minola, L.; Chen, D. Wind speed variability over the Canary Islands, 1948–2014: Focusing on trend differences at the land–ocean interface and below–above the trade-wind inversion layer. Clim. Dyn. 2018, 50, 4061–4081. [Google Scholar] [CrossRef]
  18. Zhang, G.F.; Azorin-Molina, C.; Chen, D.; McVicar, T.R.; Guijarro, J.A.; Deng, K.Q.; Minola, L.; Lee, J.; Son, S.W.; Ma, H.; et al. Variability and trends of near-surface wind speed over the Tibetan Plateau: The role played by the westerly and Asian monsoon. Adv. Clim. Change Res. 2024, 15, 525–536. [Google Scholar] [CrossRef]
  19. Zhang, G.; Azorin-Molina, C.; Wang, X.; Chen, D.; McVicar, T.R.; Guijarro, J.A.; Chappell, A.; Deng, K.; Minola, L.; Kong, F.; et al. Rapid urbanization induced daily maximum wind speed decline in metropolitan areas: A case study in the Yangtze River Delta (China). Urban Clim. 2022, 43, 101147. [Google Scholar] [CrossRef]
  20. Li, Y.; Chen, Y.; Li, Z. Effects of land use and cover change on surface wind speed in China. J. Arid Land 2019, 11, 345–356. [Google Scholar] [CrossRef]
  21. Wu, J.; Zha, J.; Zhao, D. Evaluating the effects of land use and cover change on the decrease of surface wind speed over China in recent 30 years using a statistical downscaling method. Clim. Dyn. 2017, 48, 131–149. [Google Scholar] [CrossRef]
  22. Zha, J.; Wu, J.; Zhao, D. Changes of probabilities in different wind grades induced by land use and cover change in Eastern China Plain during 1980–2011. Atmos. Sci. Lett. 2016, 17, 264–269. [Google Scholar] [CrossRef]
  23. Miao, H.; Xu, H.; Yang, K.; Tang, H.; Deng, J.; Xu, M.; Ning, G.; Huang, G. The reversal of surface wind speed trend in Northeast China: Impact from aerosol emissions. Clim. Dyn. 2025, 63, 43. [Google Scholar] [CrossRef]
  24. Ren, L.; Yang, Y.; Wang, H.; Wang, P.; Yue, X.; Liao, H. Co-Benefits of Mitigating Aerosol Pollution to Future Solar and Wind Energy in China Toward Carbon Neutrality. Geophys. Res. Lett. 2024, 51, e2024GL109296. [Google Scholar] [CrossRef]
  25. Jacobson, M.Z.; Kaufman, Y.J. Wind reduction by aerosol particles. Geophys. Res. Lett. 2006, 33, L24814. [Google Scholar] [CrossRef]
  26. Azorin-Molina, C.; Pirooz, A.A.S.; Bedoya-Valestt, S.; Utrabo-Carazo, E.; Andres-Martin, M.; Shen, C.; Minola, L.; Guijarro, J.A.; Aguilar, E.; Brunet, M.; et al. Biases in wind speed measurements due to anemometer changes. Atmos. Res. 2023, 289, 106771. [Google Scholar] [CrossRef]
  27. Azorin-Molina, C.; Asin, J.; McVicar, T.R.; Minola, L.; Lopez-Moreno, J.I.; Vicente-Serrano, S.M.; Chen, D. Evaluating anemometer drift: A statistical approach to correct biases in wind speed measurement. Atmos. Res. 2018, 203, 175–188. [Google Scholar] [CrossRef]
  28. Zhang, Z.; Wang, K. Stilling and recovery of the surface wind speed based on observation, reanalysis, and geostrophic wind theory over China from 1960 to 2017. J. Clim. 2020, 33, 3989–4008. [Google Scholar] [CrossRef]
  29. Zhao, X.; Wu, Y.; Su, J.; Gou, J. Surface wind speed changes and their potential impact on wind energy resources across China during 1961-2021. GeoHealth 2023, 7, e2023GH000861. [Google Scholar] [CrossRef] [PubMed]
  30. Yao, T.; Xue, Y.; Chen, D.; Chen, F.; Thompson, L.; Cui, P.; Koike, T.; Lau, W.K.M.; Lettenmaier, D.; Mosbrugger, V.; et al. Recent Third Pole’s Rapid Warming Accompanies Cryospheric Melt and Water Cycle Intensification and Interactions between Monsoon and Environment: Multidisciplinary Approach with Observations, Modeling, and Analysis. Bull. Am. Meteorol. Soc. 2019, 100, 423–444. [Google Scholar] [CrossRef]
  31. Chen, X.L.; Skerlak, B.; Rotach, M.W.; Añel, J.A.; Su, Z.; Ma, Y.; Li, M. Reasons for the extremely high-ranging planetary boundary layer over the western Tibetan Plateau in winter. J. Atmos. Sci. 2016, 73, 2021–2038. [Google Scholar] [CrossRef]
  32. Xue, Y.; Ma, Y.; Li, Q. Land–Climate Interaction Over the Tibetan Plateau. In Oxford Research Encyclopedia of Climate Science; Oxford University Press: Oxford, UK, 2017. [Google Scholar] [CrossRef]
  33. Yang, B.; Qian, Y.; Berg, L.K.; Ma, P.-L.; Wharton, S.; Bulaevskaya, V.; Yan, H.; Hou, Z.; Shaw, W.J. Sensitivity of Turbine-Height Wind Speeds to Parameters in Planetary Boundary-Layer and Surface-Layer Schemes in the Weather Research and Forecasting Model. Boundary-Layer Meteorol. 2017, 162, 117–142. [Google Scholar] [CrossRef]
  34. Bao, X.; Lou, W.; Gu, Y.; Liao, S.; Lu, Z.; Cai, W. Judgment criteria for significant wind speed-up regions in natural complex terrain. J. Wind Eng. Ind. Aerodyn. 2024, 249, 105724. [Google Scholar] [CrossRef]
  35. Helbig, N.; Mott, R.; van Herwijnen, A.; Winstral, A.; Jonas, T. Parameterizing surface wind speed over complex topography. J. Geophys. Res. Atmos. 2017, 122, 651–667. [Google Scholar] [CrossRef]
  36. Serafin, S.; Adler, B.; Cuxart, J.; De Wekker, S.F.J.; Gohm, A.; Grisogono, B.; Kalthoff, N.; Kirshbaum, D.J.; Rotach, M.W.; Schmidli, J.; et al. Exchange Processes in the Atmospheric Boundary Layer Over Mountainous Terrain. Atmosphere 2018, 9, 102. [Google Scholar] [CrossRef]
  37. Daly, C.; Conklin, D.R.; Unsworth, M.H. Local atmospheric decoupling in complex topography alters climate change impacts. Int. J. Climatol. 2009, 30, 1857–1864. [Google Scholar] [CrossRef]
  38. Hersbach, H.; Bell, B.; Berrisford, P.; Hirahara, S.; Horányi, A.; Muñoz-Sabater, J.; Nicolas, J.; Peubey, C.; Radu, R.; Scheperset, D.; et al. The ERA5 global reanalysis. Q. J. R. Meteorol. Soc. 2020, 146, 1999–2049. [Google Scholar] [CrossRef]
  39. Hennermann, K.; Berrisford, P. What Are the Changes from ERA-Interim to ERA5? 2023. Available online: https://confluence.ecmwf.int/pages/viewpage.action?pageId=74764925 (accessed on 30 June 2025).
  40. Hoffmann, L.; Günther, G.; Li, D.; Stein, O.; Wu, X.; Griessbach, S.; Heng, Y.; Konopka, P.; Müller, R.; Vogel, B.; et al. From ERA-Interim to ERA5: The considerable impact of ECMWF’s next-generation reanalysis on Lagrangian transport simulations. Atmos. Chem. Phys. 2019, 19, 3097–3124. [Google Scholar] [CrossRef]
  41. Hoffmann, L.; Spang, R. An assessment of tropopause characteristics of the ERA5 and ERA-Interim meteorological reanalyses. Atmos. Chem. Phys. 2022, 22, 4019–4046. [Google Scholar] [CrossRef]
  42. Fang, W.; Yang, C.; Liu, D.; Huang, Q.; Ming, B.; Cheng, L.; Wang, L.; Feng, G.; Shang, J. Assessment of Wind and Solar Power Potential and Their Temporal Complementarity in China’s Northwestern Provinces: Insights from ERA5 Reanalysis. Energies 2023, 16, 7109. [Google Scholar] [CrossRef]
  43. Zhao, X.; Huang, G.; Lu, C.; Li, Y.; Ren, J. Ensemble Bayesian modelaveraging projections of wind-speed extremes for wind energy applications over China under climate change. J. Geophys. Res. Atmos. 2024, 129, e2023JD038806. [Google Scholar] [CrossRef]
  44. Soares, P.M.; Lima, D.C.; Nogueira, M. Global offshore wind energy resources using the new ERA-5 reanalysis. Environ. Res. Lett. 2020, 15, 1040a2. [Google Scholar] [CrossRef]
  45. Ulazia, A.; Nafarrate, A.; Ibarra-Berastegi, G.; Sáenz, J.; Carreno-Madinabeitia, S. The Consequences of Air Density Variations over Northeastern Scotland for Offshore Wind Energy Potential. Energies 2019, 12, 2635. [Google Scholar] [CrossRef]
  46. Tavares, L.F.D.; Shadman, M.; Assad, L.P.D.; Silva, C.; Landau, L.; Estefen, S.F. Assessment of the offshore wind technical potential for the Brazilian Southeast and South regions. Energy 2020, 196, 117097. [Google Scholar] [CrossRef]
  47. Soukissian, T.H.; Karathanasi, F.E.; Zaragkas, D.K. Exploiting offshore wind and solar resources in the Mediterranean using ERA5 reanalysis data. Energy Convers. Manag. 2021, 237, 114092. [Google Scholar] [CrossRef]
  48. Nefabas, K.L.; Söder, L.; Mamo, M.; Olauson, J. Modeling of Ethiopian Wind Power Production Using ERA5 Reanalysis Data. Energies 2021, 14, 2573. [Google Scholar] [CrossRef]
  49. Ruiz, S.A.G.; Barriga, J.E.C.; Martínez, J.A. Wind power assessment in the Caribbean region of Colombia, using ten-minute wind observations and ERA5 data. Renew. Energy 2021, 172, 158–176. [Google Scholar] [CrossRef]
  50. Fan, W.; Liu, Y.; Chappell, A.; Dong, L.; Xu, R.; Ekström, M.; Fu, T.; Zeng, Z. Evaluation of Global Reanalysis Land Surface Wind Speed Trends to Support Wind Energy Development Using In Situ Observations. J. Appl. Meteor. Climatol. 2021, 60, 33–50. [Google Scholar] [CrossRef]
  51. Yu, J.; Zhou, T.; Jiang, Z.; Zou, L. Evaluation of Near-Surface Wind Speed Changes during 1979 to 2011 over China Based on Five Reanalysis Datasets. Atmosphere 2019, 10, 804. [Google Scholar] [CrossRef]
  52. Gualtieri, G. Analysing the uncertainties of reanalysis data used for wind resource assessment: A critical review. Renew. Sustain. Energy Rev. 2022, 167, 112741. [Google Scholar] [CrossRef]
  53. Minola, L.; Zhang, G.; Ou, T.; Kukulies, J.; Curio, J.; Guijarro, J.A.; Deng, K.; Azorin-Molina, C.; Shen, C.; Pezzoli, A.; et al. Climatology of near-surface wind speed from observational, reanalysis and high-resolution regional climate model data over the Tibetan Plateau. Clim. Dyn. 2024, 62, 933–953. [Google Scholar] [CrossRef]
  54. Wu, L.; Su, H.; Zeng, X.; Posselt, D.J.; Wong, S.; Chen, S.; Stoffelen, A. Uncertainty of Atmospheric Winds in Three Widely Used Global Reanalysis Datasets. J. Appl. Meteor. Climatol. 2024, 63, 165–180. [Google Scholar] [CrossRef]
  55. Wu, J.; Shi, Y. Changes in surface wind speed and its different grades over China during 1961–2020 based on a high-resolution dataset. Int. J. Climatol. 2021, 42, 3954–3967. [Google Scholar] [CrossRef]
  56. Liu, H.; Dong, L.; Yan, R.; Zhang, X.; Guo, C.; Liang, S.; Tu, J.; Feng, X.; Wang, X. Evaluation of near-surface wind speed climatology and long-term trend over China’s mainland region based on ERA5 reanalysis. Clim. Environ. Res. 2021, 26, 299–311. Available online: http://www.iapjournals.ac.cn/qhhj/articl (accessed on 2 May 2025). (In Chinese).
  57. Molina, M.O.; Gutiérrez, C.; Sánchez, E. Comparison of ERA5 surface wind speed climatologies over Europe with observations from the HadISD dataset. Int. J. Climatol. 2021, 41, 4864–4878. [Google Scholar] [CrossRef]
  58. Gualtieri, G. Reliability of ERA5 Reanalysis Data for Wind Resource Assessment: A Comparison against Tall Towers. Energies 2021, 14, 4169. [Google Scholar] [CrossRef]
  59. Brune, S.; Keller, J.D.; Wahl, S. Evaluation of wind speed estimates in reanalyses for wind energy applications. Adv. Sci. Res. 2021, 18, 115–126. [Google Scholar] [CrossRef]
  60. Wu, J.; Gao, X.J. A gridded daily observation dataset over China region and comparison with the other datasets. Chin. J. Geophys. 2013, 56, 1102–1111. (In Chinese) [Google Scholar] [CrossRef]
  61. Wu, J.; Gao, X.; Giorgi, F.; Chen, D. Changes of effective temperature and cold/hot days in late decades over China based on a high resolution gridded observation dataset. Int. J. Climatol. 2017, 37 (Suppl. 1), 788–800. [Google Scholar] [CrossRef]
  62. New, M.; Lister, D.; Hulme, M.; Makin, I. A highresolution data set of surface climate over global land areas. Clim. Res. 2002, 21, 1–25. [Google Scholar] [CrossRef]
  63. Shi, Y.; Yu, M.; Erfanian, A.; Wang, G. Modeling the dynamic vegetation–climate system over China using a coupled regional model. J. Clim. 2018, 31, 6027–6049. [Google Scholar] [CrossRef]
  64. Li, X.; Chen, Y.; Li, K.; Gao, S.; Cui, Y. The optimal wind speed product selection for wind energy assessment under multi-factor constraints. Clean. Eng. Technol. 2025, 24, 100883. [Google Scholar] [CrossRef]
  65. Chen, Z.; Li, W.; Guo, J.; Bao, Z.; Pan, Z.; Hou, B. Projection of wind energy potential over Northern China using a regional climate model. Sustainability 2020, 12, 3979. [Google Scholar] [CrossRef]
  66. Wu, J.; Shi, Y.; Xu, Y. Evaluation and projection of surface wind speed over China based on CMIP6 GCMs. J. Geophys. Res. Atmos. 2020, 125, e2020JD033611. [Google Scholar] [CrossRef]
  67. Chen, S.; Liu, W.; Ye, T. Dataset of trend-preserving bias-corrected daily temperature, precipitation and wind from NEX-GDDP and CMIP5 over the Qinghai-Tibet Plateau. Data Brief 2020, 31, 105733. [Google Scholar] [CrossRef] [PubMed]
  68. Jiang, J.; Yu, Y.; Zhou, Y.; Qian, S.; Deng, H.; Tao, J.; Hua, W. Influence of Model Resolution on Wind Energy Simulations over Tibetan Plateau Using CMIP6 HighResMIP. Atmosphere 2024, 15, 1323. [Google Scholar] [CrossRef]
  69. Tang, G.; Yang, X.; Zhou, C.; Li, F.; Xiong, L. Nanjing Normal University. 2023. Global Basic Landform Units Datasets (2023), Version 1. Yangtze River Delta Science Data Center, National Earth System Science Data Sharing Infrastructure, National Science & Technology Infrastructure of China. Available online: https://www.geodata.cn/data/datadetails.html?dataguid=28050973505297 (accessed on 20 January 2025).
  70. Xiong, L.; Li, S.; Tang, G.; Strobl, J. Geomorphometry and terrain analysis: Data, methods, platforms and applications. Earth-Sci. Rev. 2022, 233, 104191. [Google Scholar] [CrossRef]
  71. Xiong, L.; Tang, G.; Yang, X.; Li, F. Geomorphology-oriented digital terrain analysis: Progress and perspectives. J. Geogr. Sci. 2021, 31, 456–476. [Google Scholar] [CrossRef]
  72. Li, S.; Xiong, L.; Tang, G.; Strobl, J. Deep learning-based approach for landform classification from integrated data sources of digital elevation model and imagery. Geomorphology 2020, 354, 107045. [Google Scholar] [CrossRef]
  73. Li, M.; Yang, X.; Na, J.; Liu, K.; Jia, Y.; Xiong, L. Regional topographic classification in the North Shaanxi Loess Plateau based on catchment boundary profiles. Prog. Phys. Geogr. Earth Environ. 2017, 41, 302–324. [Google Scholar] [CrossRef]
  74. Hersbach, H.; Bell, B.; Berrisford, P.; Biavati, G.; Horányi, A.; Muñoz Sabater, J.; Nicolas, J.; Peubey, C.; Radu, R.; Rozum, I.; et al. ERA5 Hourly Data on Single Levels from 1979 to Present. In Copernicus Climate Change Service (C3S) Climate Data Store (CDS). Available online: https://oneclimate.acdguide.cloud.edu.au/records/4nkjk-0r931 (accessed on 14 June 2018).
  75. Uppala, S.M.; Kållberg, P.; Simmons, A.; Andrae, U.; Bechtold, V.D.C.; Fiorino, M.; Gibson, J.; Haseler, J.; Hernandez, A.; Kelly, G.; et al. The ERA-40 re-analysis. Q. J. R. Meteorol. Soc. 2005, 131, 2961–3012. [Google Scholar] [CrossRef]
  76. Dee, D.P.; Uppala, S.M.; Simmons, A.J.; Berrisford, P.; Poli, P.; Kobayashi, S.; Andrae, U.; Balmaseda, M.A.; Balsamo, G.; Bauer, P.; et al. The ERA-Interim reanalysis: Configuration and performance of the data assimilation system. Q. J. R. Meteorol. Soc. 2011, 137, 553–597. [Google Scholar] [CrossRef]
  77. Piotrowski, P.; Rutyna, I.; Baczyński, D.; Kopyt, M. Evaluation Metrics for Wind Power Forecasts: A Comprehensive Review and Statistical Analysis of Errors. Energies 2022, 15, 9657. [Google Scholar] [CrossRef]
  78. Hu, H.; Wang, L.; Lv, S.X. Forecasting energy consumption and wind power generation using deep echo state network. Renew. Energy 2020, 154, 598–613. [Google Scholar] [CrossRef]
  79. Bhatt, G.A.; Gandhi, P.R. Statistical and ANN based prediction of wind power with uncertainty. In Proceedings of the 3rd International Conference on Trends in Electronics and Informatics (ICOEI), Tirunelveli, India, 23–25 April 2019; pp. 622–627. [Google Scholar] [CrossRef]
  80. Li, L.L.; Zhao, X.; Tseng, M.L.; Tan, R.R. Short-term wind power forecasting based on support vector machine with improved dragonfly algorithm. J. Clean. Prod. 2020, 242, 118447. [Google Scholar] [CrossRef]
  81. Safaei Pirooz, A.A.; Flay, R.G.J. Comparison of Speed-Up Over Hills Derived from Wind-Tunnel Experiments, Wind-Loading Standards, and Numerical Modelling. Boundary-Layer Meteorol. 2018, 168, 213–246. [Google Scholar] [CrossRef]
  82. Song, J.L.; Li, J.W.; Flay, R.G.J. Field measurements and wind tunnel investigation of wind characteristics at a bridge site in a Y-shaped valley. J. Wind Eng. Ind. Aerodyn. 2020, 202, 104199. [Google Scholar] [CrossRef]
  83. Lystad, T.M.; Fenerci, A.; Øiseth, O. Evaluation of mast measurements and wind tunnel terrain models to describe spatially variable wind field characteristics for long-span bridge design. J. Wind Eng. Ind. Aerodyn. 2018, 179, 558–573. [Google Scholar] [CrossRef]
  84. Jourdier, B. Evaluation of ERA5, MERRA-2, COSMO-REA6, NEWA and AROME to simulate wind power production over France. Adv. Sci. Res. 2020, 17, 63–77. [Google Scholar] [CrossRef]
  85. Sandu, I.; Zadra, A.; Wedi, N. Impact of Orographic Drag on Forecast Skill. n.d. Available online: https://www.ecmwf.int/en/newsletter/150/meteorology/impact-orographic-drag-forecast-skill (accessed on 1 July 2025).
  86. Jiménez, P.A.; Dudhia, J. Improving the representation of resolved and unresolved topographic effects on surface wind in the WRF model. J. Appl. Meteorol. Climatol. 2012, 51, 300–316. [Google Scholar] [CrossRef]
  87. Kim, H.-G.; Kim, J.-Y.; Kang, Y.-H. Comparative Evaluation of the Third-Generation Reanalysis Data for Wind Resource Assessment of the Southwestern Offshore in South Korea. Atmosphere 2018, 9, 73. [Google Scholar] [CrossRef]
  88. Waewsak, J.; Chancham, C.; Chiwamongkhonkarn, S.; Gagnon, Y. Wind Resource Assessment of the Southernmost Region of Thailand Using Atmospheric and Computational Fluid Dynamics Wind Flow Modeling. Energies 2019, 12, 1899. [Google Scholar] [CrossRef]
  89. Minola, L.; Zhang, F.; Azorin-Molina, C.; Safaei Pirooz, A.A.; Flay, R.G.J.; Hersbach, H.; Chen, D. Near-surface mean and gust wind speeds in ERA5 across Sweden: Towards an improved gust parametrization. Clim. Dyn. 2020, 55, 887–907. [Google Scholar] [CrossRef]
  90. Xu, Y.; Gao, X.J.; Shen, Y.; Xu, C.H.; Shi, Y.; Giorgi, F. A daily temperature dataset over China and its application in validating a RCM simulation. Adv. Atmos. Sci. 2009, 26, 763–772. [Google Scholar] [CrossRef]
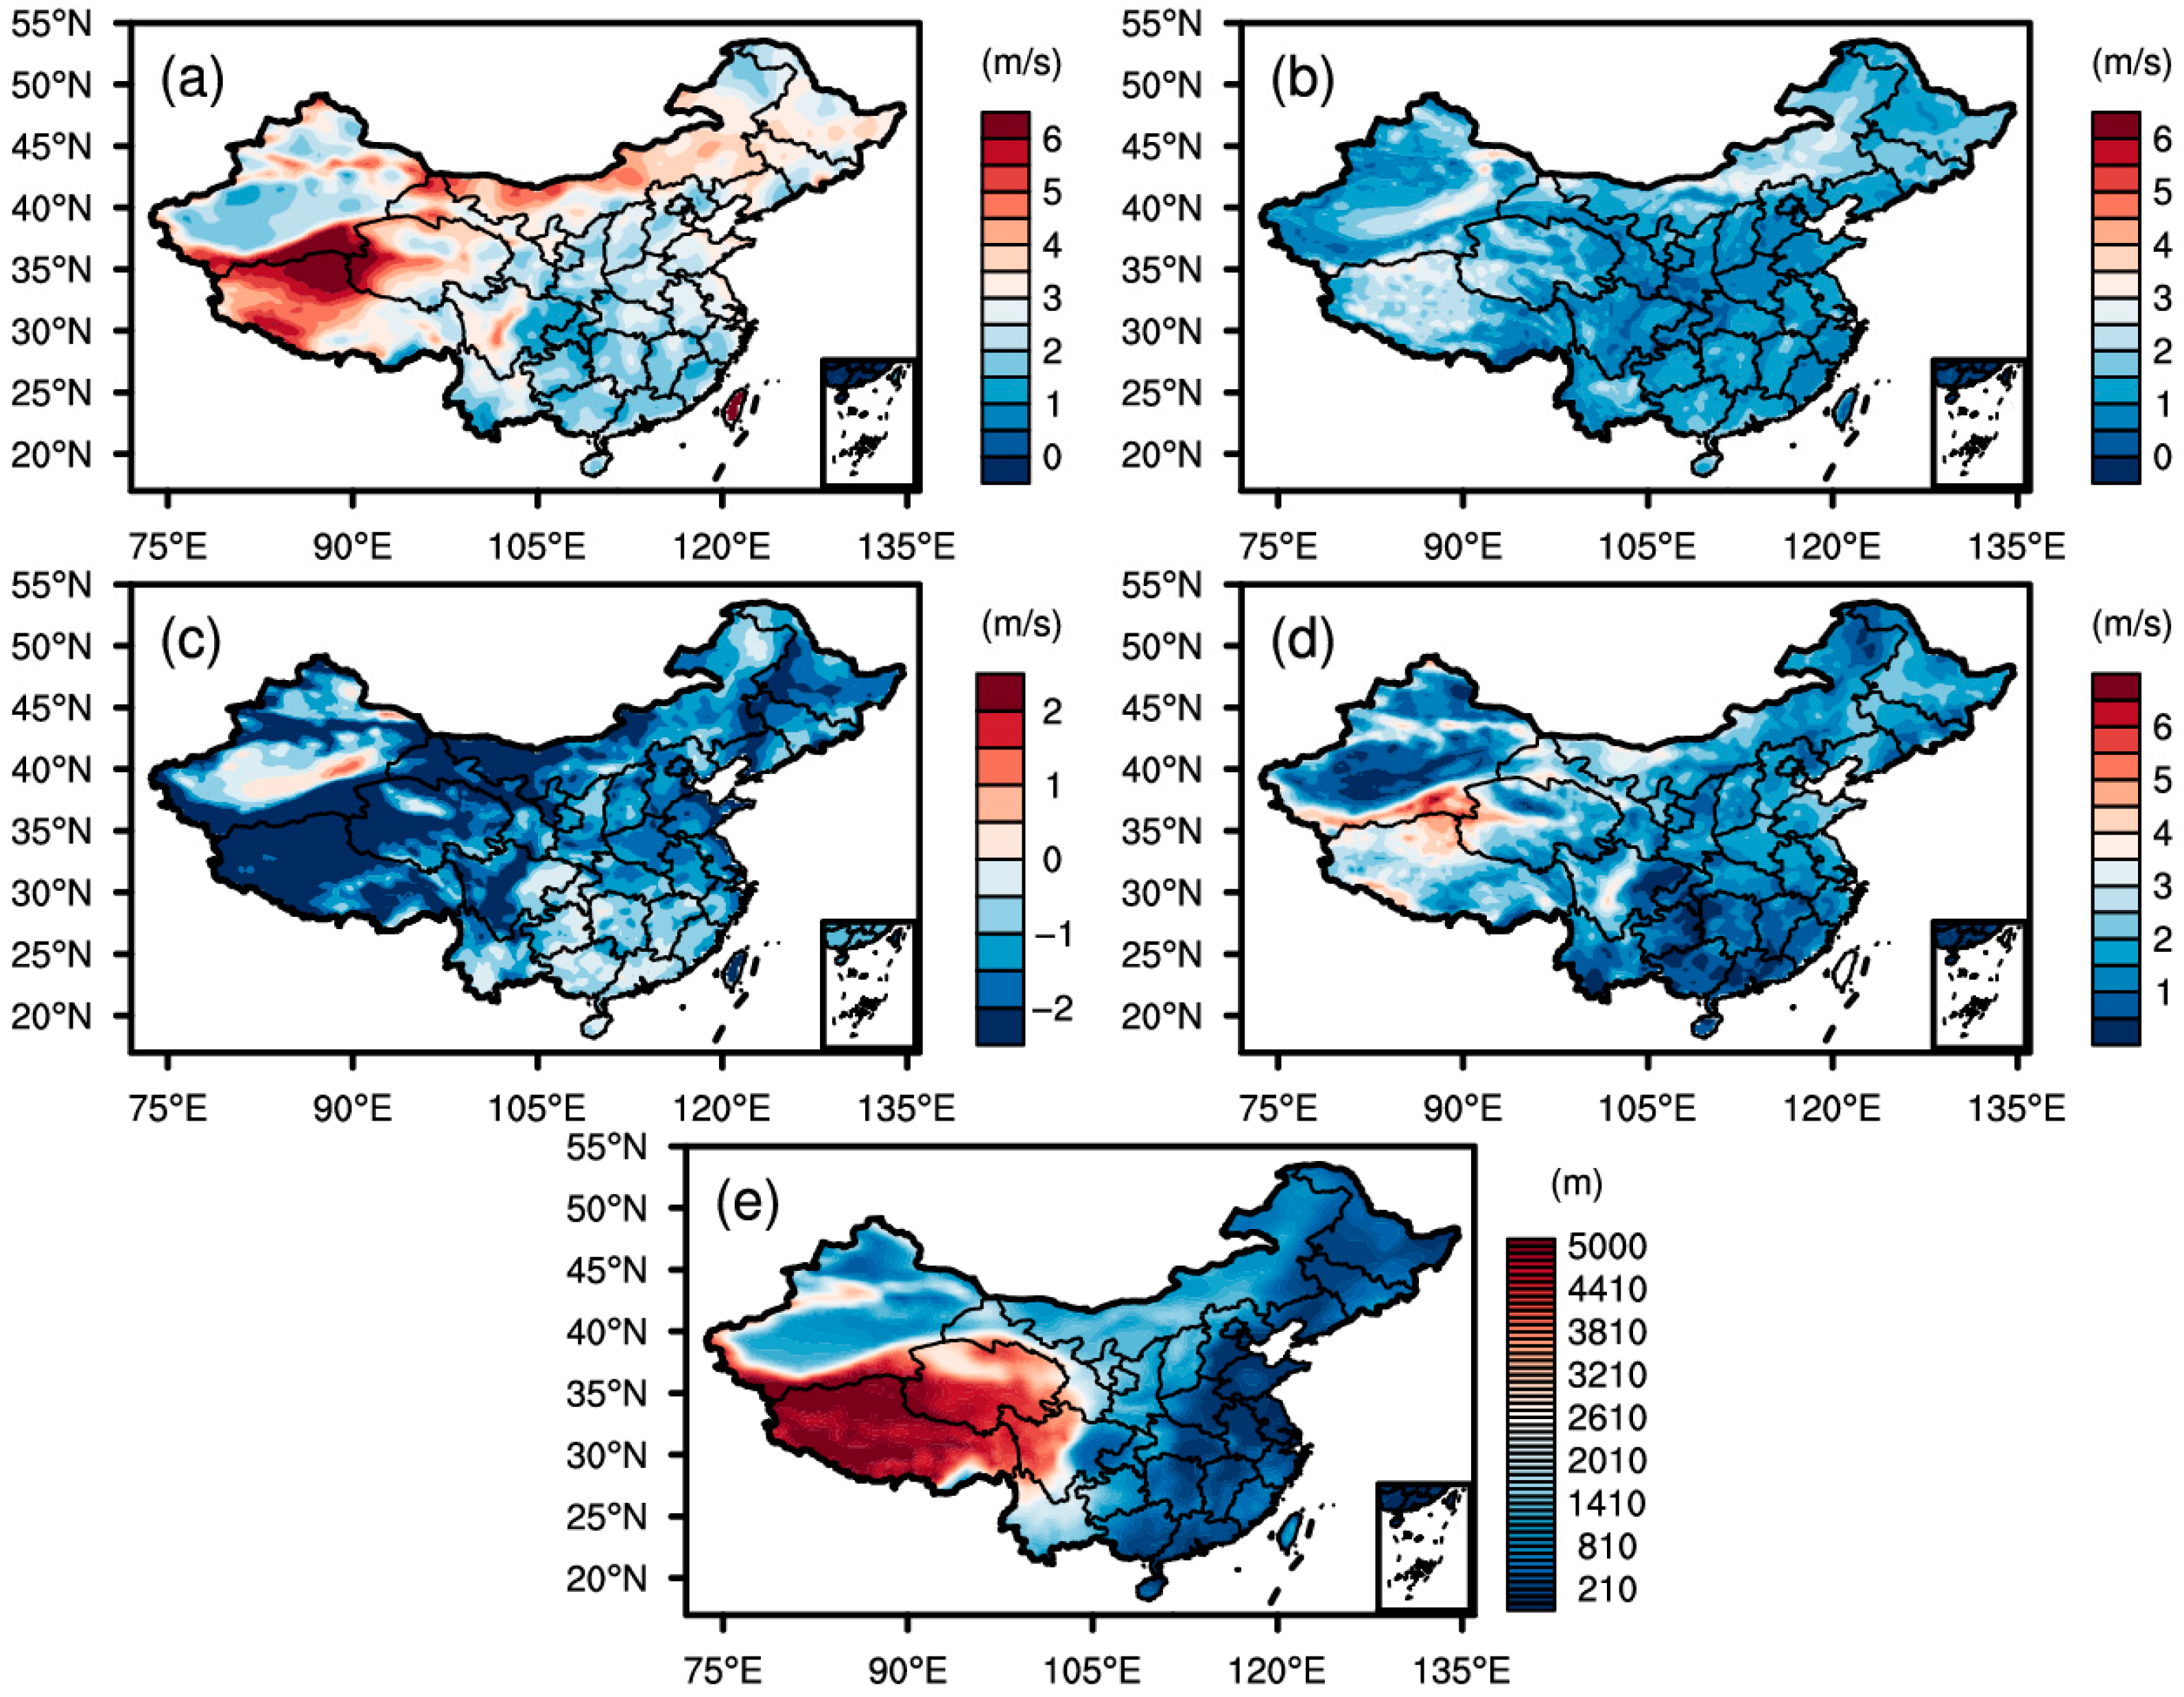
Figure 1. Maps of mean 10 m annual wind speed (1961–2018) for (a) observations, (b) ERA5 reanalysis, (c) differences between ERA5 and observations, (d) the root-mean-square differences (RMSD) of CN05.1 and ERA5 data, and (e) altitude.
Atmosphere 16 00956 g001
Figure 2. (a) Comparison of 1961–2018 mean 10 m wind speed between CN05.1 observations and ERA5 reanalysis for three elevation zones: low (<1000 m), middle (1000–3500 m), and high (≥3500 m). (b) Mean 10 m wind speed from CN05.1 observations and ERA5 reanalysis, averaged across three elevation zones. Boxplots show the 25th and 75th percentiles (box limits), median (central line), and full data range (whiskers: minimum to maximum values).
Atmosphere 16 00956 g002
Figure 3. Scatter plots of 1961–2018 mean surface wind speed versus elevation across China: (a) observational data and (b) ERA5 reanalysis data.
Atmosphere 16 00956 g003
Figure 4. (a) Median RMSD and (b) mean absolute percentage error (MAPE) between CN05.1 and ERA5 data covering the period of 1961–2018 across three elevation zones: low (<1000 m), middle (1000–3500 m), and high (≥3500 m). Error bars indicate the interquartile range (25th–75th percentiles).
Atmosphere 16 00956 g004
Figure 5. Elevation-dependent deviations between CN05.1 observations and ERA5 reanalysis over the period of 1961–2018 across China: (a) RMSD; (b) MAPE.
Atmosphere 16 00956 g005
Figure 6. Seasonal (a) RMSD and (b) MAPE between CN05.1 observations and ERA5 reanalysis data, stratified by three elevation zones: low (<1000 m), mid-altitude (1000–3500 m), and high (≥3500 m). Seasons: DJF (December–January–February), MAM (March–April–May), JJA (June–July–August), SON (September–October–November).
Atmosphere 16 00956 g006
Figure 7. (a) Comparison of mean 10-m wind speed between CN05.1 observations and ERA5 reanalysis for five relief-based terrain classes: plains, hills, and mountains with low, medium, and high relief. (b) Mean 10 m wind speed from CN05.1 observations and ERA5 reanalysis, averaged across five relief-based terrain classes. Boxplots show the 25th and 75th percentiles (box limits), median (central line), and full data range (whiskers: minimum to maximum values).
Atmosphere 16 00956 g007
Figure 8. (a) RMSD and (b) MAPE between CN05.1 and ERA5 data over the period of 1961–2018 across five relief-based terrain classes: plains, hills, low-relief mountains, medium-relief mountains, and high-relief mountains. Error bars indicate the interquartile range (25th–75th percentiles).
Atmosphere 16 00956 g008
Figure 9. Seasonal (a) RMSD and (b) MAPE between CN05.1 observations and ERA5 reanalysis data, stratified by five relief-based terrain classes: plains, hills, and low-, medium-, and high-relief mountains.
Atmosphere 16 00956 g009
Disclaimer/Publisher’s Note: The statements, opinions and data contained in all publications are solely those of the individual author(s) and contributor(s) and not of MDPI and/or the editor(s). MDPI and/or the editor(s) disclaim responsibility for any injury to people or property resulting from any ideas, methods, instructions or products referred to in the content.