


Evaluating Air Pollution in South African Priority Areas: A Qualitative Comparison of Satellite and In-Situ Data

 ,
, 
Abstract
1. Introduction
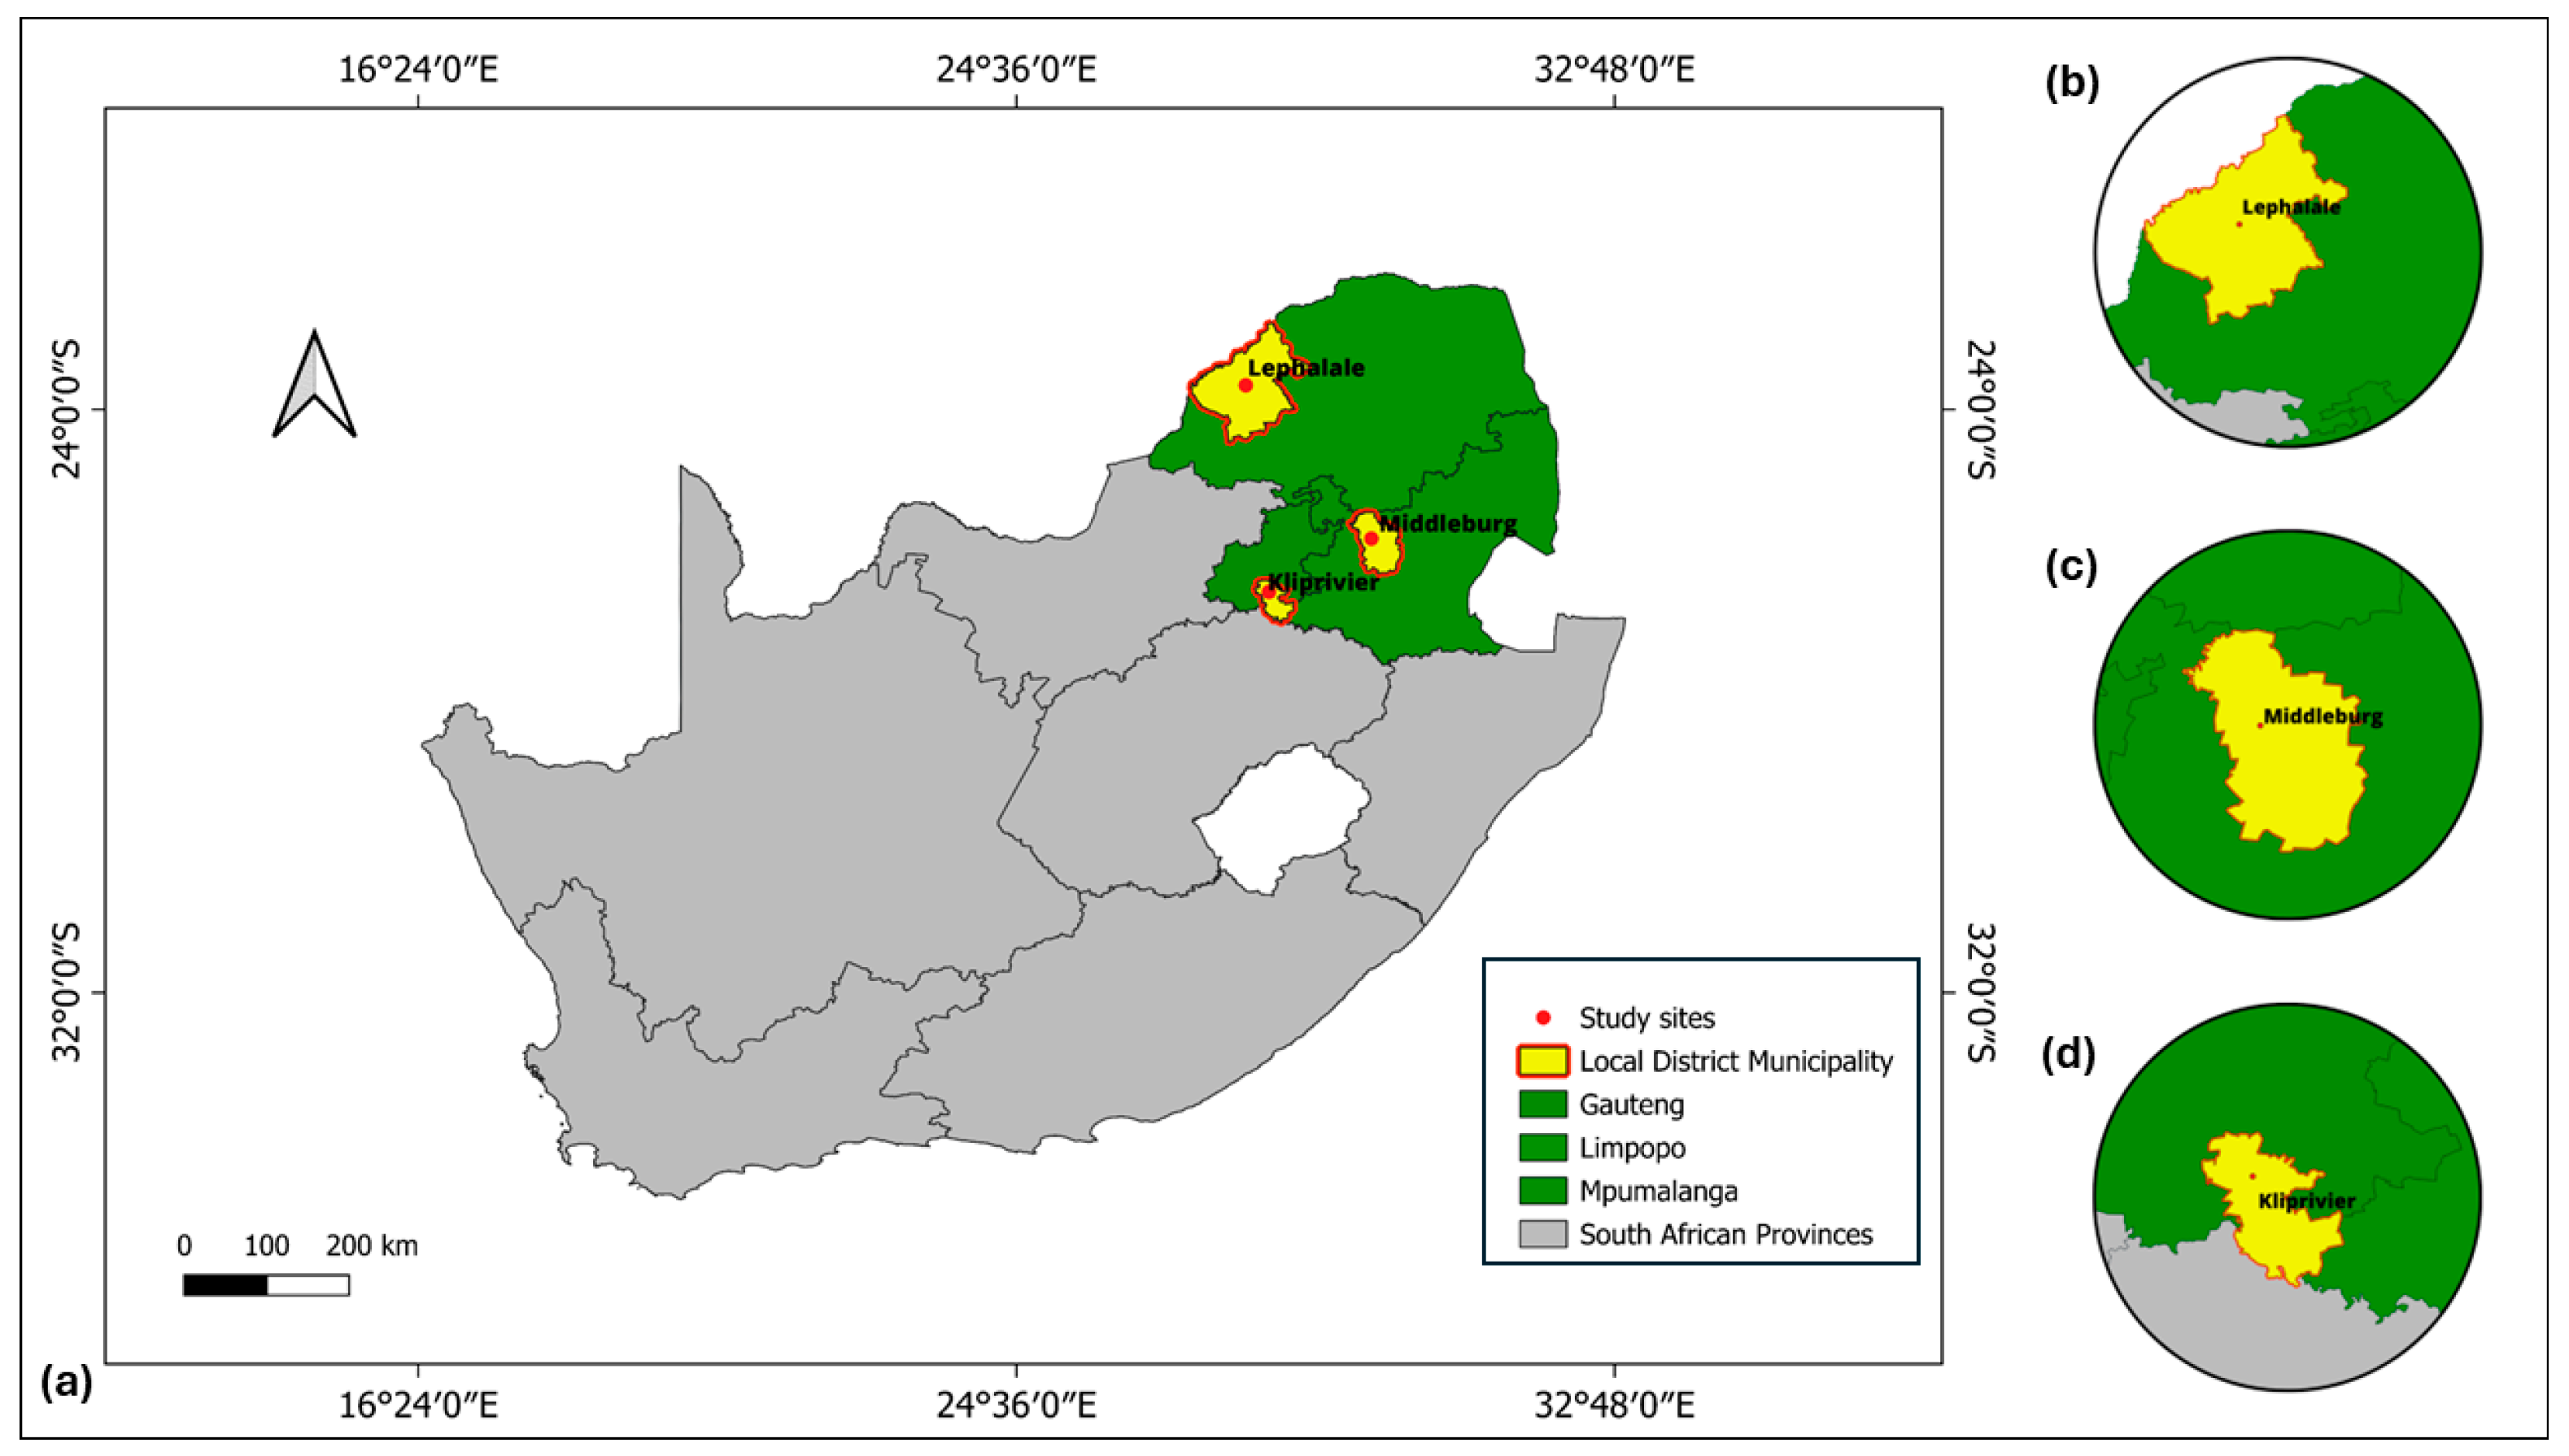
2. Study Area
3. Data and Methods
3.1. SAAQIS
3.2. TROPOMI
3.3. Calculation of the Concentration
4. Results and Discussion
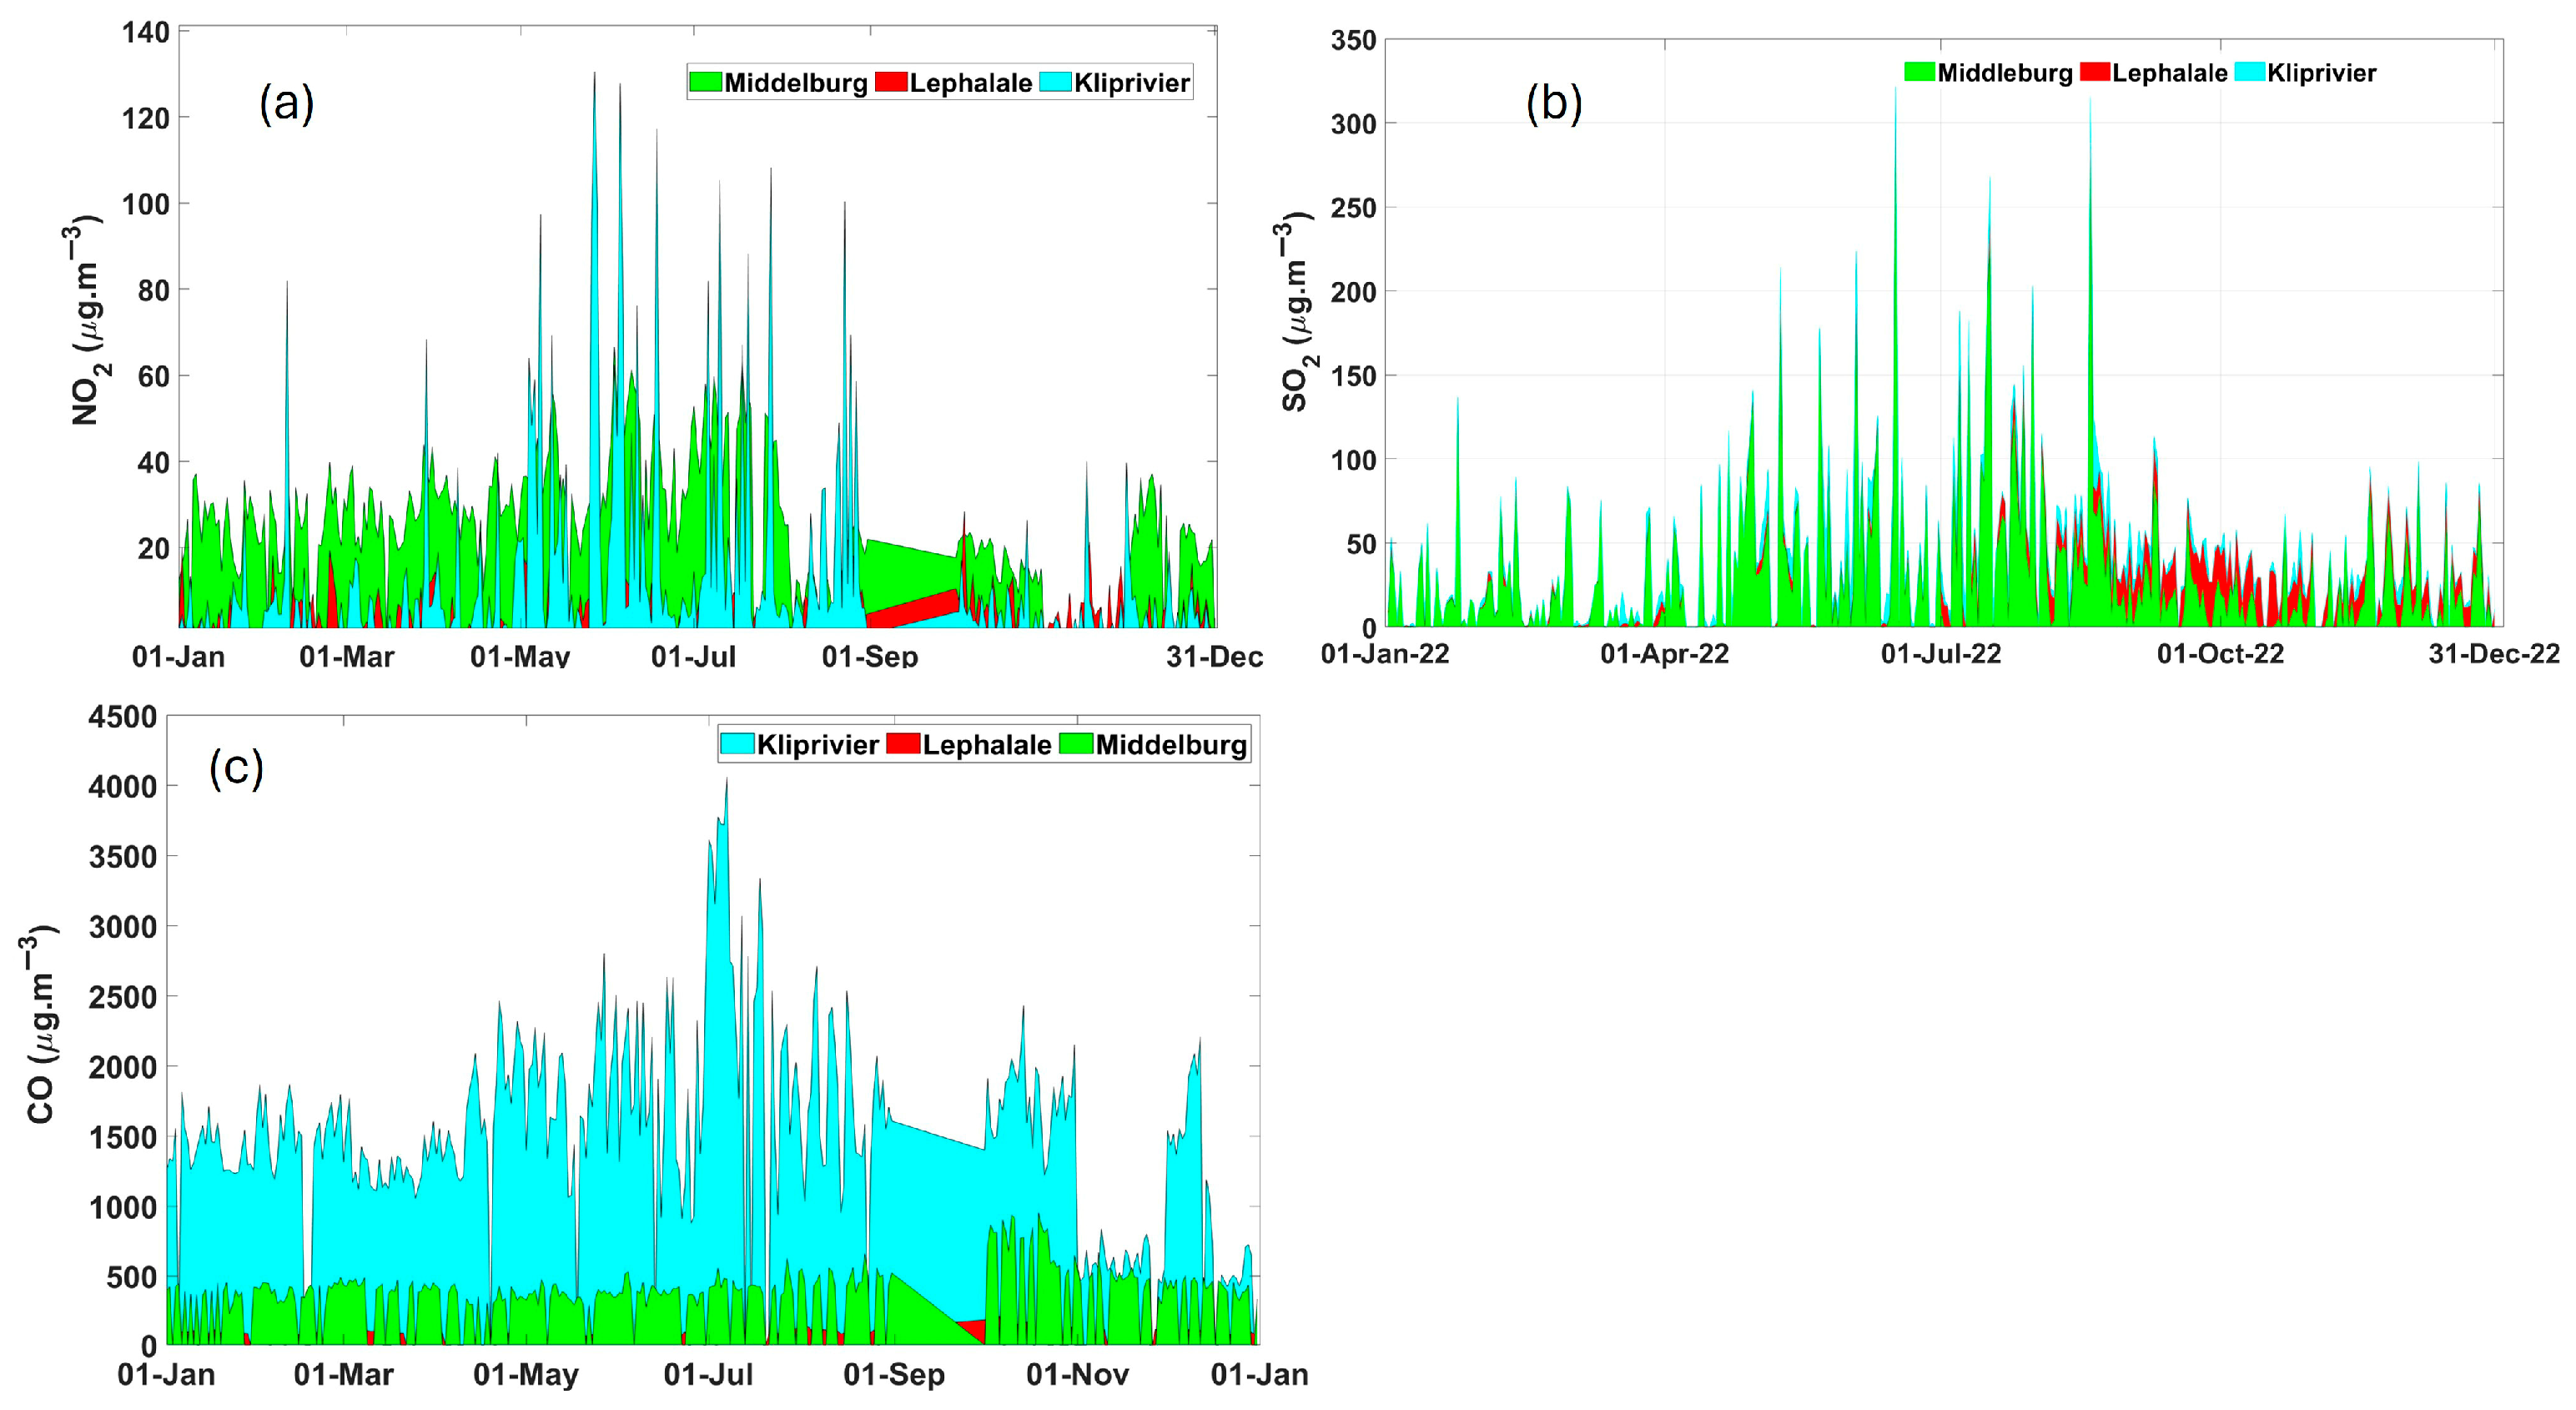
4.1. Pollutant Type and Area Comparison
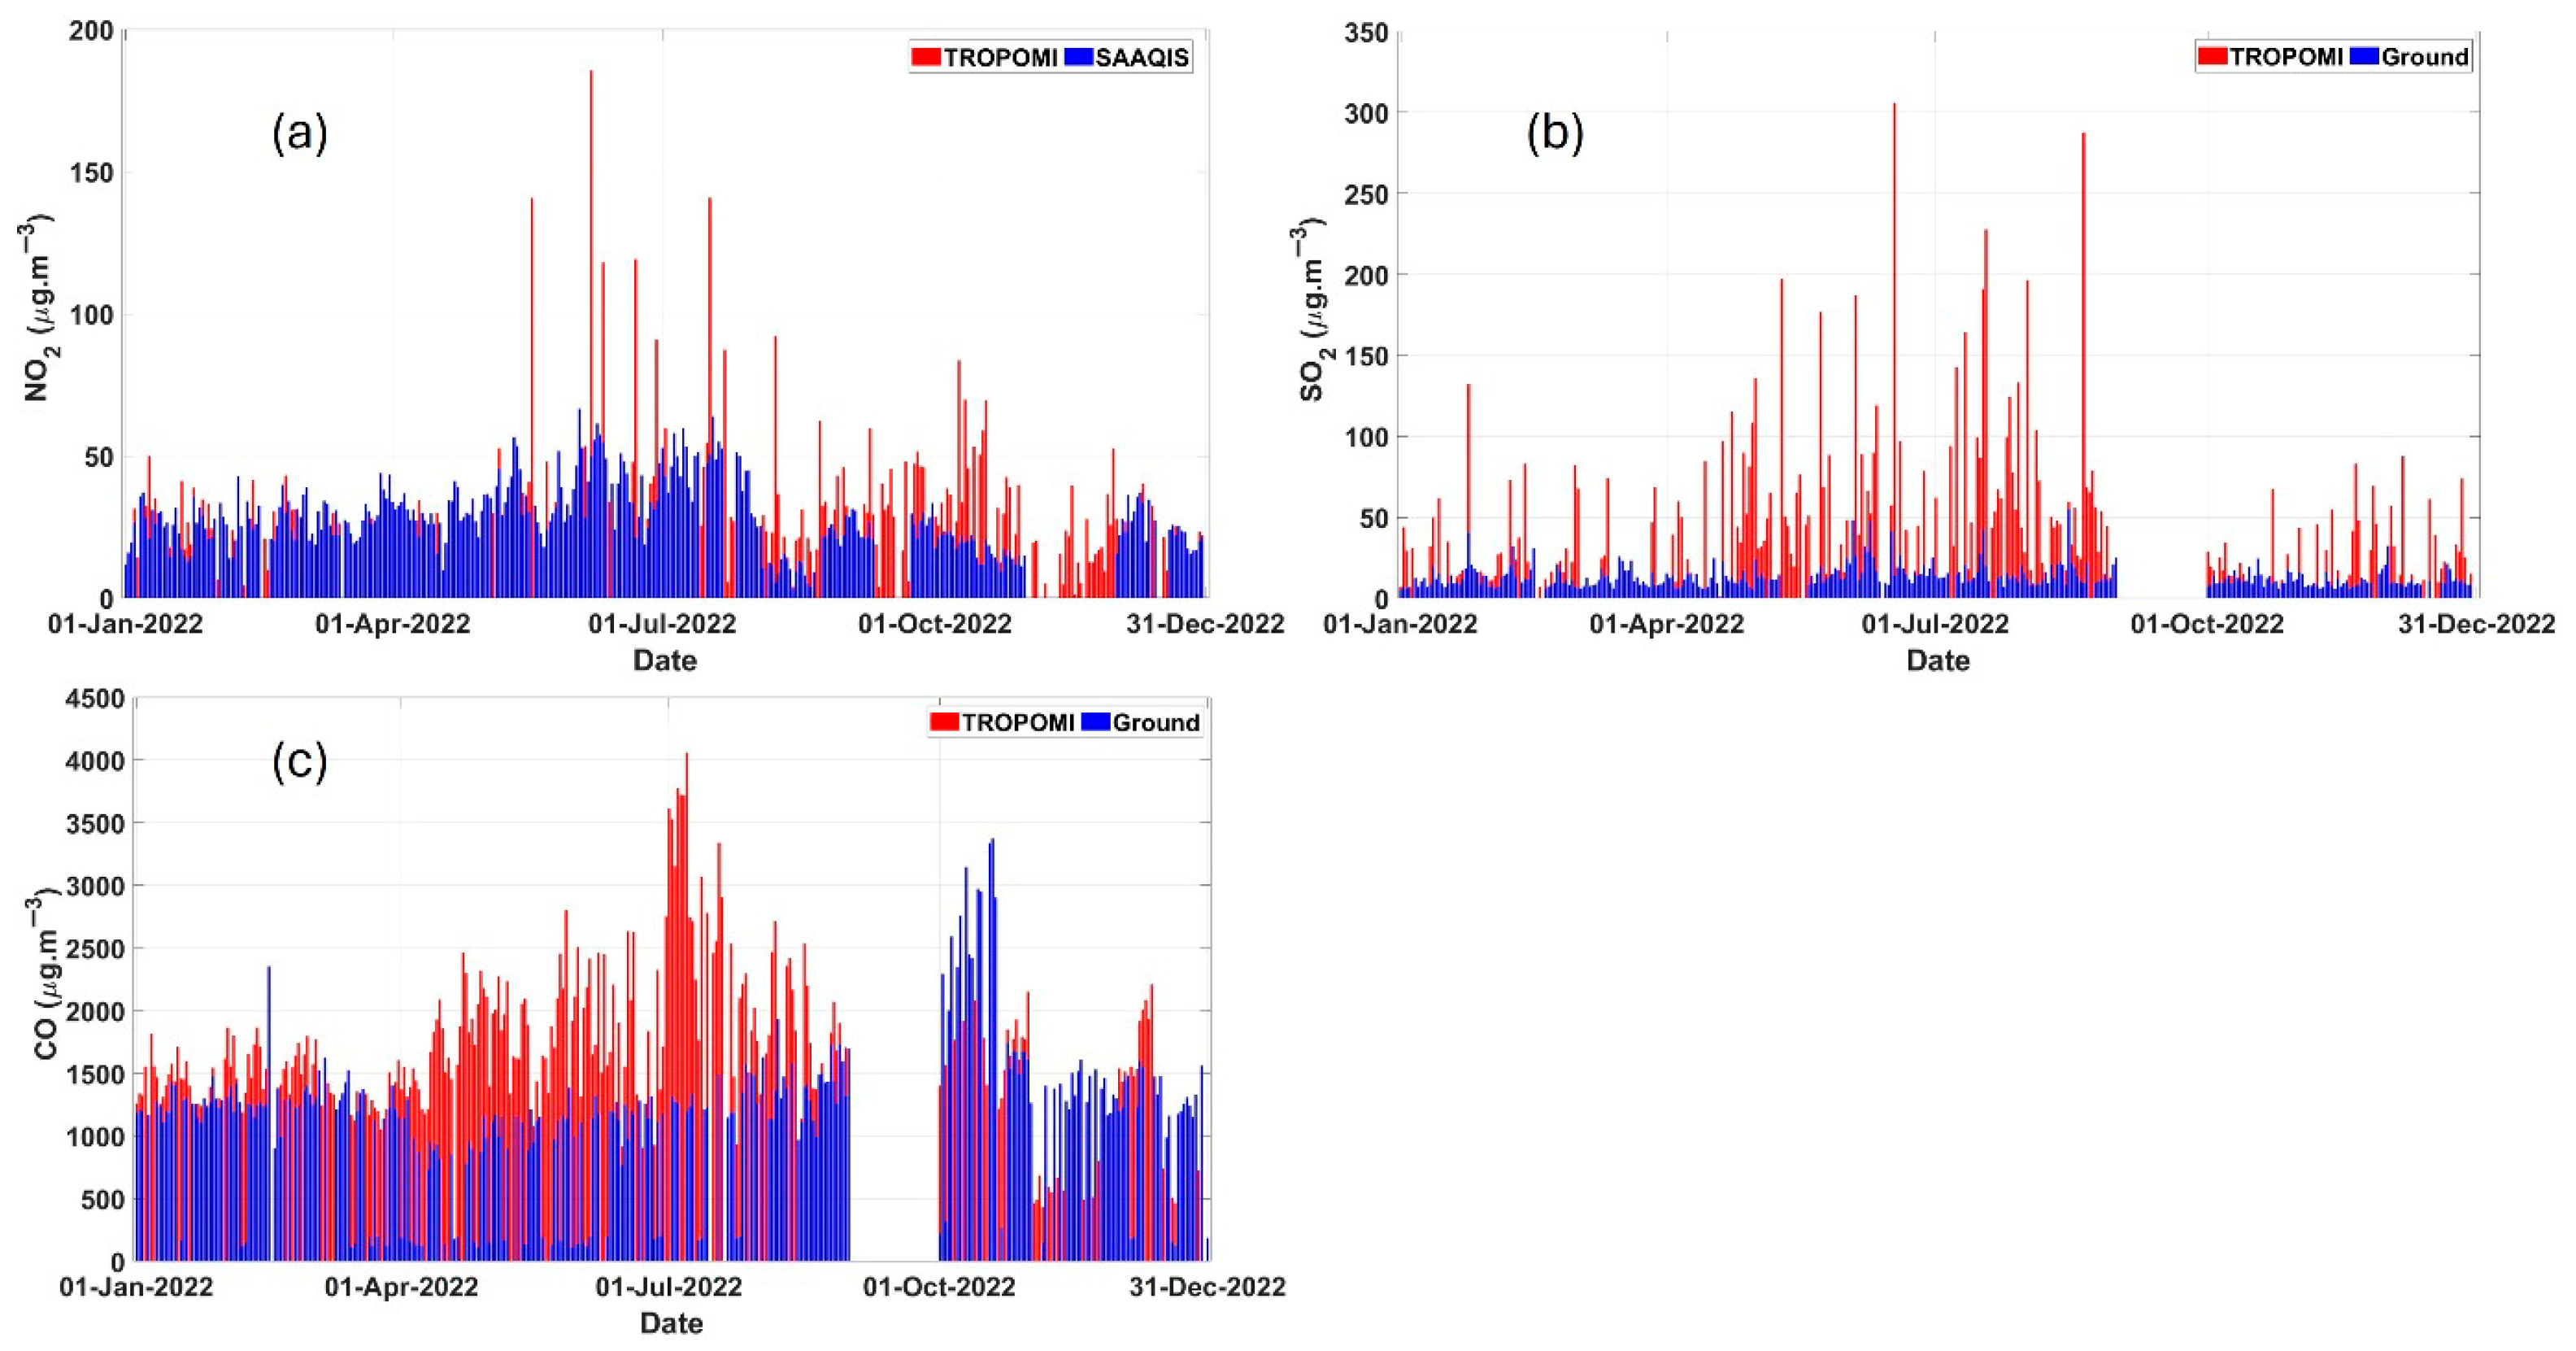
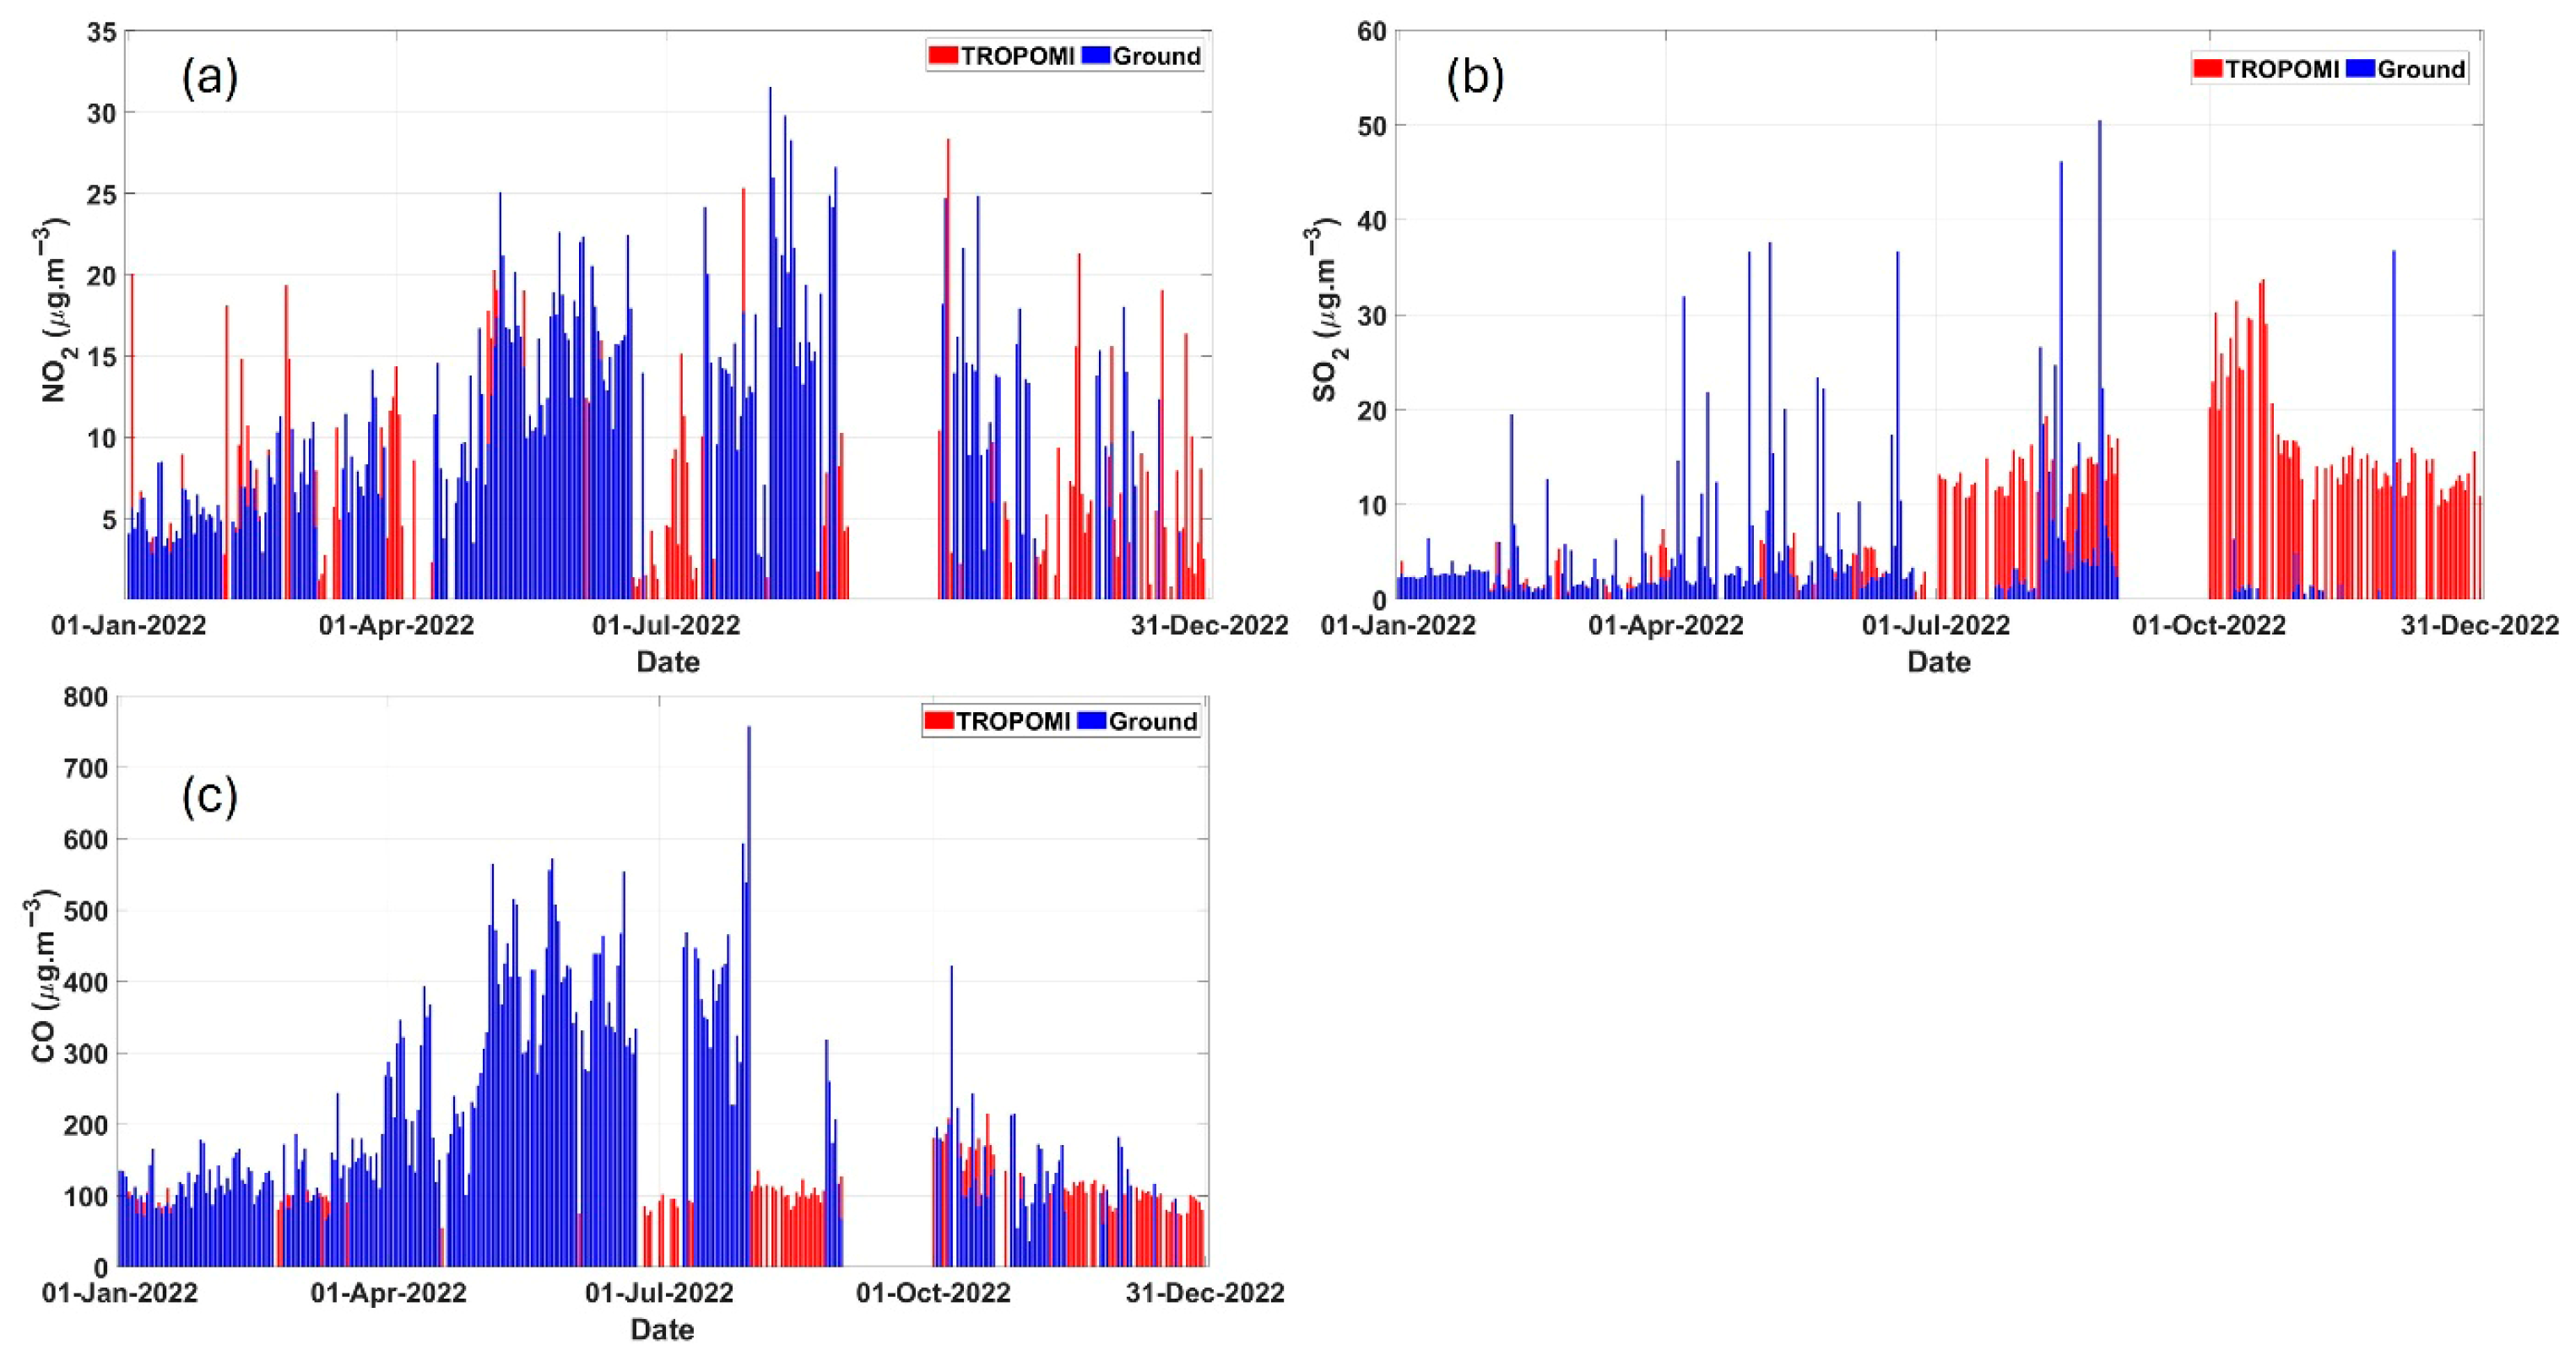
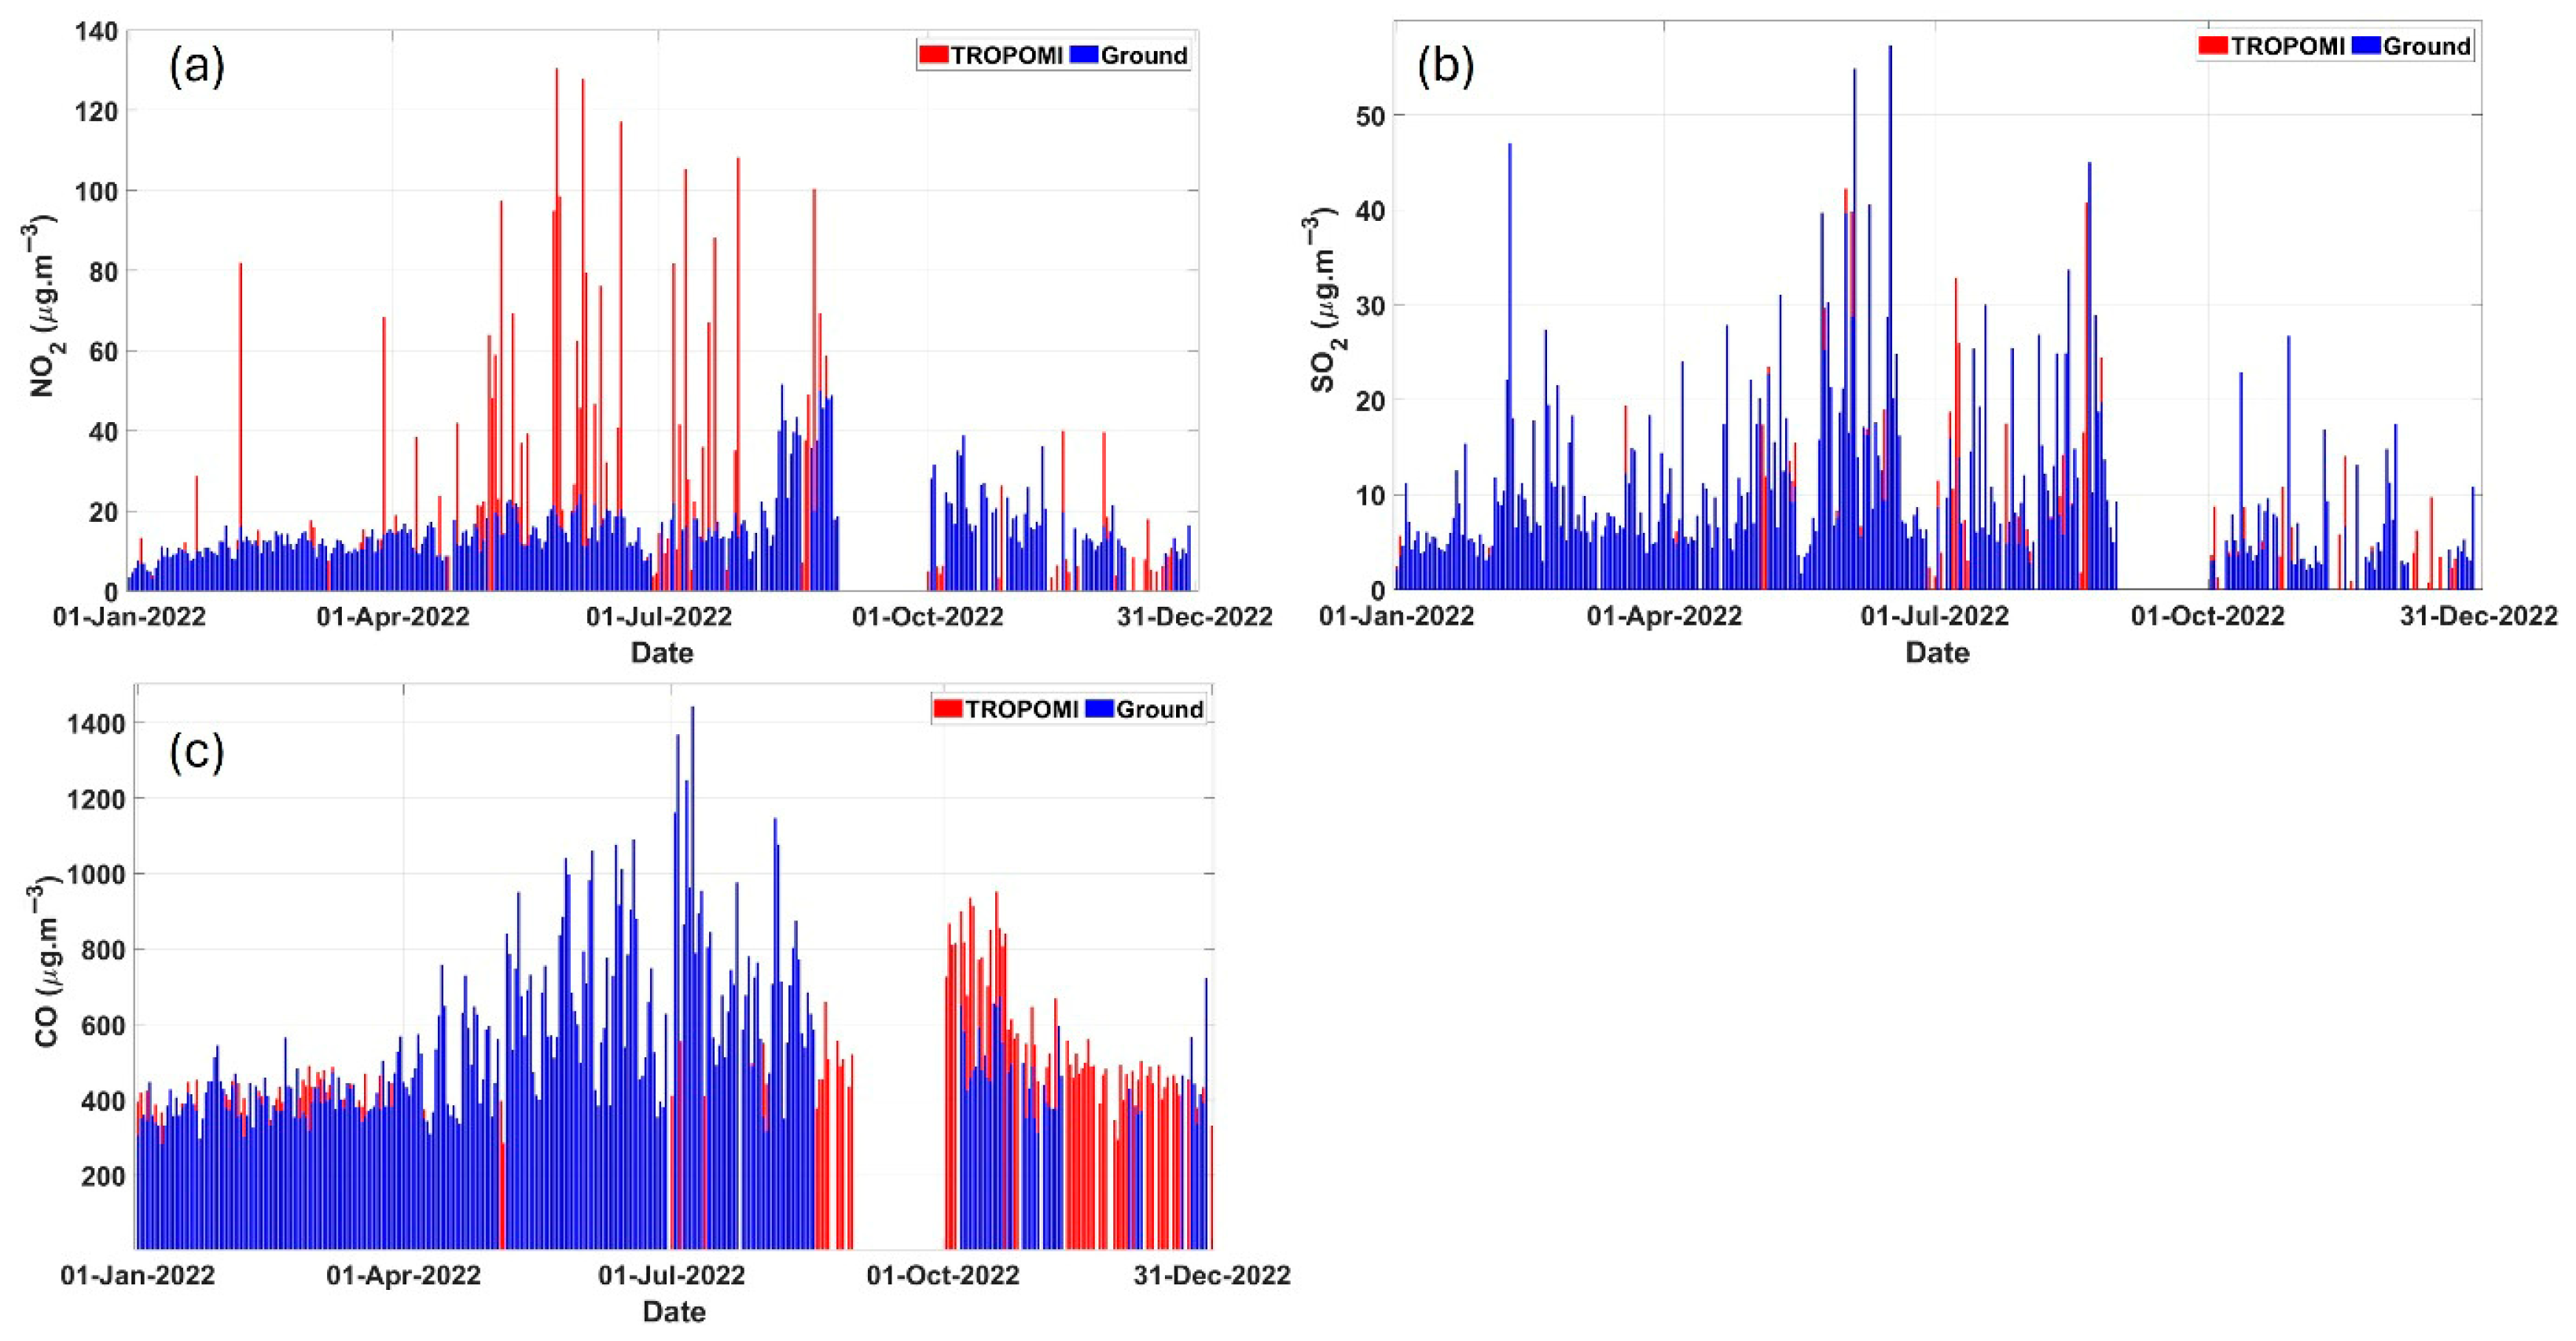
4.2. Satellite (TROPOMI) Versus Ground-Based (SAAQIS) Measurements
5. Summary and Conclusions
Author Contributions
Funding
Institutional Review Board Statement
Informed Consent Statement
Data Availability Statement
Acknowledgments
Conflicts of Interest
References
- Jadem, A.M.; Jasem, I.M.; Al-Ramahi, F.K.M. Monitoring pollution and the trend of air quality in brick factories in the Nahrawan Region and its impact on Baghdad, using remote sensing data. Ibn Al-Haitham J. Pure Appl. Sci. 2023, 36, 51–62. [Google Scholar] [CrossRef]
- Zhang, S.; Zhang, M.A.; Qiao, Y.; Li, X.; Li, S. Does improvement of environmental information transparency boost firms’ green innovation? Evidence from the air quality monitoring and disclosure program in China. J. Clean. Prod. 2022, 357, 131921. [Google Scholar] [CrossRef]
- Xu, M.; Han, K.; Hu, W.; Ji, W. Fine-gained air quality inference based on low-quality sensing data using self-supervised learning. arXiv 2024, arXiv:2408.09526. [Google Scholar]
- Liu, F.; Wang, M.; Zheng, M. Effects of COVID-19 lockdown on global air quality and health. Sci. Total Environ. 2021, 755, 142533. [Google Scholar] [CrossRef] [PubMed]
- Ohimain, E.I.; Izah, S.C.; Abah, S.O. Air quality impacts of smallholder oil palm processing in Nigeria. J. Environ. Prot. 2013, 4, 83. [Google Scholar] [CrossRef]
- Yanti, J.; Tampubolon, T.; Liu, C.Y.; Alonge, T.A.; Qaiyimah, D.; Abidin, M.R.; Mannan, A.; Saputra, R.R. Measuring the spatio-temporal distribution of sulfur dioxide (SO2) with Copernicus Sentinel-5P near real time in Medan City. J. Geogr. 2024, 16, 101–110. [Google Scholar] [CrossRef]
- Kusuma, W.L.; Chih-Da, W.; Yu-Ting, Z.; Hapsari, H.H.; Muhamad, J.L. PM2.5 pollutants in Asia: A comparison of metropolis cities in Indonesia and Taiwan. Int. J. Environ. Res. Public Health 2019, 16, 4924. [Google Scholar] [CrossRef] [PubMed]
- Malings, C. Integrating low-cost sensor systems and networks to enhance air quality applications. In Proceedings of the India Clean Air Summit (ICAS) 2024, Bangalore, India, 26–30 August 2024. [Google Scholar]
- Filonchyk, M.; Yan, H.; Li, X. Temporal and spatial variation of particulate matter and its correlation with other criteria of air pollutants in Lanzhou, China, in spring-summer periods. Atmos. Pollut. Res. 2018, 9, 1100–1110. [Google Scholar] [CrossRef]
- Kazemi Garajeh, M.; Laneve, G.; Rezaei, H.; Sadeghnejad, M.; Mohamadzadeh, N.; Salmani, B. Monitoring trends of CO, NO2, SO2, and O3 pollutants using time-series Sentinel-5 images based on Google Earth Engine. Pollutants 2023, 3, 255–279. [Google Scholar] [CrossRef]
- Schaefer, M.; Salari, H.E.; Köckler, H.; Thinh, N.X. Assessing local heat stress and air quality with the use of remote sensing and pedestrian perception in urban microclimate simulations. Sci. Total Environ. 2021, 794, 148709. [Google Scholar] [CrossRef] [PubMed]
- Frazenburg, C.; Sepadi, M.M.; Chitakira, M. Investigating the disproportionate impacts of air pollution on vulnerable populations in South Africa: A systematic review. Atmosphere 2025, 16, 49. [Google Scholar] [CrossRef]
- AbdelSattar, A. Monitoring air pollution using satellite data. In Proceedings of the International Conference on Industrial Engineering and Operations Management, Riyadh, Saudi Arabia, 26–28 November 2019; pp. 772–780. [Google Scholar]
- Levelt, P.F.; Joiner, J.; Tamminen, J.; Veefkind, J.P.; Bhartia, P.K.; Stein Zweers, D.C.; Duncan, B.N.; Streets, D.G.; Eskes, H.; van der A, R.; et al. The Ozone Monitoring Instrument: Overview of 14 years in space. Atmos. Chem. Phys. 2018, 18, 5699–5745. [Google Scholar] [CrossRef]
- Veefkind, J.P.; Aben, I.; McMullan, K.; Förster, H.; De Vries, J.; Otter, G.; Claas, J.; Eskes, H.J.; De Haan, J.F.; Kleipool, Q.; et al. TROPOMI on the ESA Sentinel-5 Precursor: A GMES mission for global observations of the atmospheric composition. Remote Sens. Environ. 2012, 120, 70–83. [Google Scholar] [CrossRef]
- Hassaan, M.A.; Abdallah, S.M.; Shalaby, E.S.A.; Ibrahim, A.A. Assessing vulnerability of densely populated areas to air pollution using Sentinel-5P imageries: A case study of the Nile Delta, Egypt. Sci. Rep. 2023, 13, 17406. [Google Scholar] [CrossRef] [PubMed]
- Sameh, S.; Zarzoura, F.; El-Mewafi, M. Spatio-temporal analysis mapping of air quality monitoring in Cairo using Sentinel-5 satellite data and Google Earth Engine. Mansoura Eng. J. 2023, 49, 3. [Google Scholar] [CrossRef]
- Shikwambana, L.; Kganyago, M.; Mbatha, N.; Mhangara, P. First-time calculation of the spatial distribution of concentration and air quality index over South Africa using TROPOMI data. J. Air Waste Manag. Assoc. 2024, 74, 556–568. [Google Scholar] [CrossRef] [PubMed]
- Kai-Sikhakhane, R.; Scholes, M.; Piketh, S.J.; van Geffen, J.; Garland, R.M.; Havenga, H.; Scholes, R. Assessing nitrogen dioxide in the Highveld troposphere: Pandora insights and TROPOMI Sentinel-5P evaluation. Atmosphere 2024, 15, 1187. [Google Scholar] [CrossRef]
- Keli, Z.; Mhangara, P.; Shikwambana, L. Monitoring the trends in emissions from coal-fired power stations in Lephalale (Limpopo) during the 2010–2022 period using remotely sensed data. Clean Air J. 2024, 34, 1–10. [Google Scholar] [CrossRef]
- Shikwambana, L.; Mhangara, P.; Mbatha, N. Trend analysis and first-time observations of sulphur dioxide and nitrogen dioxide in South Africa using TROPOMI/Sentinel-5P data. Int. J. Appl. Earth Obs. Geoinf. 2020, 91, 102130. [Google Scholar]
- Muyemeki, L.; Burger, R.; Piketh, S.J. Evaluating the potential of remote sensing imagery in mapping ground-level fine particulate matter (PM2.5) for the Vaal Triangle Priority Area. Clean Air J. 2020, 30, 1–7. [Google Scholar] [CrossRef]
- Sibiya, S.S.; Mhangara, P.; Shikwambana, L. Seasonal and trend variation of methane concentration over two provinces of South Africa using Sentinel-5P data. Environ. Monit. Assess. 2024, 196, 713. [Google Scholar] [CrossRef] [PubMed]
- Abbas, S.J.; Iqbal, A.; Hussain, M.M.; Anwar, A. Mapping the global spatial dynamics: Renewable energy’s impact on air pollution spillovers in high-contaminant regions. Environ. Dev. Sustain. 2024, 1–26. [Google Scholar] [CrossRef]
- Wang, Y.; Duan, X.; Liang, T.; Wang, L.; Wang, L. Analysis of spatio-temporal distribution characteristics and socioeconomic drivers of urban air quality in China. Chemosphere 2022, 291, 132799. [Google Scholar] [CrossRef] [PubMed]
- Lambey, V.; Prasad, A.D. A review on air quality measurement using an unmanned aerial vehicle. Water Air Soil Pollut. 2021, 232, 109. [Google Scholar] [CrossRef]
- Jońca, J.; Pawnuk, M.; Bezyk, Y.; Arsen, A.; Sówka, I. Drone-assisted monitoring of atmospheric pollution—A comprehensive review. Sustainability 2022, 14, 11516. [Google Scholar] [CrossRef]
- Sekonya, K.G. Development of a 6 MV Tandem Accelerator Mass Spectrometry Facility and Its Applications. Ph.D. Thesis, University of the Witwatersrand, Johannesburg, South Africa, 2019. [Google Scholar]
- Maswanganyi, C.; Tshilongo, J.; Mkhohlakali, A.; Martin, L. Evaluation of ambient NO2 and SO2 concentrations at Lephalale, Polokwane, and Steelpoort area in the Limpopo Province of South Africa. Open J. Air Pollut. 2024, 13, 111–126. [Google Scholar] [CrossRef]
- Banda, V.D.; Dzwairo, R.B.; Singh, S.K.; Kanyerere, T. Trend analysis of selected hydro-meteorological variables for the Rietspruit sub-basin, South Africa. J. Water Clim. Change 2021, 12, 3099–3123. [Google Scholar] [CrossRef]
- Magagula, M.; Atangana, E.; Oberholster, P. Assessment of the impact of coal mining on water resources in Middelburg, Mpumalanga Province, South Africa: Using different water quality indices. Hydrology 2024, 11, 113. [Google Scholar] [CrossRef]
- Gwaze, P.; Mashele, S.H. South African Air Quality Information System (SAAQIS) mobile application tool: Bringing real-time state of air quality to South Africans. Clean Air J. 2018, 28, 3–4. [Google Scholar] [CrossRef]
- Douros, J.; Eskes, H.; Van Geffen, J.; Boersma, K.F.; Compernolle, S.; Pinardi, G.; Blechschmidt, A.M.; Peuch, V.H.; Colette, A.; Veefkind, P. Comparing Sentinel-5P TROPOMI NO2 column observations with the CAMS regional air quality ensemble. Geosci. Model Dev. 2023, 16, 509–534. [Google Scholar] [CrossRef]
- Corradino, C.; Jouve, P.; La Spina, A.; Del Negro, C. Monitoring Earth’s atmosphere with Sentinel-5 TROPOMI and Artificial Intelligence: Quantifying volcanic SO2 emissions. Remote Sens. Environ. 2024, 315, 2. [Google Scholar] [CrossRef]
- Marey, H.S.; Hashisho, Z.; Fu, L. Satellite Remote Sensing of Air Quality in the Oil Sands Region; Oil Sands Research and Information Network: Edmonton, AB, Canada, 2014. [Google Scholar]
- Anema, J. Mapping of Air Quality Products from VIIRS and TROPOMI. Master’s Thesis, Delft University of Technology (TU Delft) and Royal Netherlands Meteorological Institute (KNMI), Delft, The Netherlands, 2019. [Google Scholar]
- Zara, M.; Boersma, K.F.; De Smedt, I.; Richter, A.; Peters, E.; Van Geffen, J.H.G.M.; Beirle, S.; Wagner, T.; Van Roozendael, M.; Marchenko, S.; et al. Improved slant column density retrieval of nitrogen dioxide and formaldehyde for OMI and GOME-2A from QA4ECV: Intercomparison, uncertainty characterisation, and trends. Atmos. Meas. Tech. 2018, 11, 4033–4034. [Google Scholar] [CrossRef]
- Hedelt, P.; Efremenko, D.S.; Loyola, D.G.; Spurr, R.; Clarisse, L. Sulfur Dioxide Layer Height Retrieval from Sentinel-5 Precursor/TROPOMI Using FP_ILM. Atmos. Meas. Tech. 2019, 12, 5503–5517. [Google Scholar] [CrossRef]
- Savenets, M. Air pollution in Ukraine: A view from the Sentinel-5P satellite. J. Hung. Meteorol. Serv. 2021, 125, 271–290. [Google Scholar] [CrossRef]
- Feig, G.; Garland, R.M.; Naidoo, S.; Maluleke, A.; Van der Merwe, M. Assessment of changes in concentrations of selected criteria pollutants in the Vaal and Highveld Priority Areas. Clean Air J. 2019, 29. [Google Scholar] [CrossRef]
- Government Gazette No. 28899, 9 June 2006. Available online: https://static.pmg.org.za/gazettes/060609enviro-air.pdf (accessed on 23 April 2025).
- Sangeetha, S.K.; Sivakumar, V.; Josipovic, M.; Gebreslasie, M.; Wright, C.Y. SO2 seasonal variation and assessment of Ozone Monitoring Instrument (OMI) measurements at Sharpeville (27.86°E; 26.68°S) a South African ground-based station. Int. J. Remote Sens. 2017, 38, 6680–6696. [Google Scholar] [CrossRef]
- Scorgie, Y.; Kneen, M.; Burger, L. Air pollution in the vaal Triangle—Quantifying source contributions and identifying cost-effective solutions. Clean Air J. 2003, 13, 5–18. [Google Scholar] [CrossRef]
- Ngoasheng, M.; Beukes, J.P.; van Zyl, P.G.; Swartz, J.-S.; Loate, V.; Krisjan, P.; Mpambani, S.; Kulmala, M.; Vakkari, V.; Laakso, L. Assessing SO2, NO2 and O3 in rural areas of the North West Province. Clean Air J. 2021, 31, 1–14. [Google Scholar] [CrossRef]
- Altieri, K.E.; Burger, J.; Language, B.; Piketh, S.J. A case study in the wintertime Vaal Triangle Air-Shed Priority Area on the utility of the nitrogen stable isotopic composition of aerosol nitrate to identify NOx sources. Clean Air J. 2022, 32, 1–8. [Google Scholar] [CrossRef]
- van Graan, J.; Potgieter, W.; Lloyd, S. Air pollution in the Vaal Triangle—Plans for the future. Clean Air J. 1993, 8. [Google Scholar] [CrossRef]
- Thomas, R.G. An Air Quality Baseline Assessment for the Vaal Airshed in South Africa, MSc Dissertation. 2008. Available online: http://hdl.handle.net/2263/28444 (accessed on 23 April 2023).
- DFFE. He Waterberg-Bojanala Priority Area Air Quality Management Plan: Baseline Characterisation. 2015. Available online: https://saaqis.environment.gov.za/Pagesfiles/Annexure%20A1%20-%20Waterberg%20Bojanala%20Priority%20Area%20AQMP%20Baseline%20assessment_24-04-2015.pdf (accessed on 23 April 2025).
- Wernecke, B.; Langerman, K.E.; Garland, R.M.; Feig, G. Ambient air pollution on the Highveld: An airshed at a watershed moment? Clean Air J. 2022, 32, 1–3. [Google Scholar] [CrossRef]
- Lourens, A.S.; Beukes, J.P.; van Zyl, P.G.; Fourie, G.D.; Burger, J.W.; Pienaar, J.J.; Read, C.E.; Jordaan, J.H. Spatial and temporal assessment of gaseous pollutants in the Highveld of South Africa. S. Afr. J. Sci. 2011, 107, 1–8. [Google Scholar] [CrossRef]
- Otto, J.; Brown, C.; Buontempo, C.; Doblas-Reyes, F.; Jacob, D.; Juckes, M.; Keup-Thiel, E.; Kurnik, B.; Schulz, J.; Taylor, A.; et al. Uncertainty: Lessons learned for climate services. Bull. Am. Meteorol. Soc. 2016, 97, ES265–ES269. [Google Scholar] [CrossRef]
- Wright, C.Y.; Benyon, M.; Mahlangeni, N.; Kapwata, T.; Laban, T.; Garland, R.M. Data gaps will leave scientists ‘in the dark’: How load shedding is obscuring our understanding of air quality. S. Afr. J. Sci. 2023, 119, 1–5. [Google Scholar] [CrossRef] [PubMed]

Disclaimer/Publisher’s Note: The statements, opinions and data contained in all publications are solely those of the individual author(s) and contributor(s) and not of MDPI and/or the editor(s). MDPI and/or the editor(s) disclaim responsibility for any injury to people or property resulting from any ideas, methods, instructions or products referred to in the content. |
© 2025 by the authors. Licensee MDPI, Basel, Switzerland. This article is an open access article distributed under the terms and conditions of the Creative Commons Attribution (CC BY) license (https://creativecommons.org/licenses/by/4.0/).
Share and Cite
Ngcoliso, N.; Shikwambana, L.; Mbulawa, Z.; Molefe, M.; Kganyago, M. Evaluating Air Pollution in South African Priority Areas: A Qualitative Comparison of Satellite and In-Situ Data. Atmosphere 2025, 16, 871. https://doi.org/10.3390/atmos16070871
Ngcoliso N, Shikwambana L, Mbulawa Z, Molefe M, Kganyago M. Evaluating Air Pollution in South African Priority Areas: A Qualitative Comparison of Satellite and In-Situ Data. Atmosphere. 2025; 16(7):871. https://doi.org/10.3390/atmos16070871
Chicago/Turabian StyleNgcoliso, Nasiphi, Lerato Shikwambana, Zintle Mbulawa, Moleboheng Molefe, and Mahlatse Kganyago. 2025. "Evaluating Air Pollution in South African Priority Areas: A Qualitative Comparison of Satellite and In-Situ Data" Atmosphere 16, no. 7: 871. https://doi.org/10.3390/atmos16070871
APA StyleNgcoliso, N., Shikwambana, L., Mbulawa, Z., Molefe, M., & Kganyago, M. (2025). Evaluating Air Pollution in South African Priority Areas: A Qualitative Comparison of Satellite and In-Situ Data. Atmosphere, 16(7), 871. https://doi.org/10.3390/atmos16070871