Abstract
The impacts of the solar eclipse that occurred on 8 April 2024 over the United States on various atmospheric parameters are investigated. We analyzed surface and vertical profiles of temperature and humidity to understand how this eclipse affected the atmosphere from the ground to the stratosphere. Our findings show a significant response throughout the atmospheric range. The eclipse caused a decrease in shortwave radiation, leading to cooler Earth surfaces and a subsequent drop in surface temperature. This cooling effect also resulted in high relative humidity and lower wind speeds at the surface. Furthermore, GPS radio occultation data from COSMIC-2 revealed a decrease in tropospheric temperature and increase in stratospheric temperature during the eclipse. We also observed a reduction in both the temperature and height of the tropopause. The uniqueness of the present investigations lies in delineating the solar eclipse’s effects on the land and ocean. Our analysis indicates that land regions experienced a more pronounced temperature change compared to ocean regions.
1. Introduction
A solar eclipse is a rare natural phenomenon where the Moon masks the Sun for a short period of time. This creates abrupt and short-duration disturbance in radiation which affects the thermal balance of the whole atmosphere. Since the 1950s, scientists have increasingly employed radio–physical, rocket, and satellite techniques to investigate the physical and chemical changes triggered by this event. Due to solar eclipses, there is sudden and dramatic reduction in solar radiation. This rapid change allows the investigation of the influence of solar radiation on various meteorological and photochemical reactions in the atmosphere.
Despite extensive research, understanding how solar eclipses affect atmospheric dynamics, chemistry, and radiation remains an active area of investigation [1,2,3]. Previous studies have documented changes in surface temperature, solar irradiance, and ozone levels during eclipses [4,5,6]. Surface temperature has received particular attention recently [7,8,9]. However, the magnitude and nature of these changes vary significantly between eclipses. Researchers have also reported changes in atmospheric circulation, eclipse-triggered gravity waves, thermal structure variations, and ozone fluctuations [10,11,12,13,14,15,16,17] and have specifically explored changes in the upper troposphere, lower stratosphere, and tropopause.
In this study, the impact of the solar eclipse that occurred on 8 April 2024 on water vapor in the lower troposphere and temperature across various atmospheric layers (surface to upper stratosphere) is investigated. We utilize data from the COSMIC-2/FORMOSAT-7 mission to analyze the eclipse’s effects as it traversed North America, passing over Mexico, the United States, and Canada (Figure 1) with a span of 14,800 km in 3 h 15 min. The following sections detail the data and methodology (Section 2), present the results (Section 3), and conclude with a summary and key findings (Section 4).
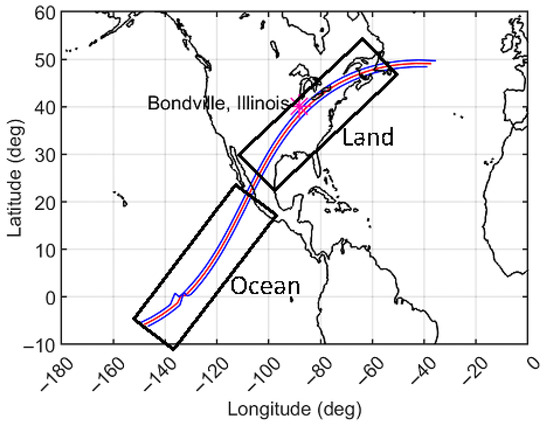
Figure 1.
The solar eclipse path observed on 8 April 2024. The red line indicates the central line of the solar eclipse while the blue lines indicate the northern and southern limits of the solar eclipse. The boxes represents the chosen grids for the analysis.
2. Data Description and Methodology
The Constellation Observing System for Meteorology, Ionosphere, and Climate-2 (COSMIC-2)/FORMOSAT-7 mission is a collaborative effort between the United States and Taiwan, launched in June 2019 [18]. It succeeds the earlier COSMIC-1/FORMOSAT-3 mission, providing crucial atmospheric data for weather forecasting, ionospheric research, and climate studies. COSMIC-2/FORMOSAT-7 utilizes six microsatellites orbiting Earth at an altitude of approximately 520 km with an inclination of 24 degrees. These satellites employ a technique called radio occultation (RO) to probe the atmosphere. The six satellites collectively gather over 4000 occultation measurements daily, primarily focused on the tropics and subtropics. COSMIC-2/FORMOSAT-7 data boasts high vertical resolution, enabling the analysis of atmospheric conditions across various altitudes. This satellite signal penetrates into the lower troposphere, due to its high signal-to-noise ratio (SNR). For this specific study, dry and wet atmospheric profiles retrieved from COSMIC-2/FORMOSAT-7 were obtained from the University Corporation for Atmospheric Research (UCAR) COSMIC Data Analysis and Archive Center (CDAAC) website (https://www.cosmic.ucar.edu/what-we-do/cosmic-2/data (accessed on 14 July 2025)). The data utilized spans the period of 7–9 April 2024. We selected COSMIC 2/FORMOSAT-7 data with respect to the solar eclipse path time with a ±3 h time period for both relative humidity and temperature.
The whole analysis in this paper dived into ocean (Box-1) and land regions (Box-2), as shown in Figure 1. Further, we used surface meteorological parameters (Net Radiation (NR), surface temperature, relative humidity, and wind speed) obtained from SURFRAD (Surface Radiation Budget) Network (https://gml.noaa.gov/grad/surfrad/overview.html (accessed on 14 July 2025)) during the month of April 2024 over Bondville, Illinois, USA (88.37° W, 40.05° N), to study the solar eclipse’s impacts on surface meteorological variables.
3. Results and Discussion
3.1. Surface Observation
Figure 2a–d illustrates how surface parameters over Bondville, IL, USA (latitude: 40.05° N; longitude: 88.37° W), varied on the day of the solar eclipse (8 April 2024) compared to the average for the entire month (excluding 8 April). NR began to decrease at ~18:00 GMT (12:00 LT), reaching a minimum around 19:00 GMT (13 LT). It then recovered to its usual pattern by 20:30 GMT (14.30 LT) as the eclipse ended. This significant decrease in NR demonstrates the eclipse’s impact on radiation. During the total eclipse, NR dropped from ~600 W/m2 to zero. The small fluctuations before the eclipse suggest patchy clouds. However, NR did not fully return to pre-eclipse levels due to the combined effect of the eclipse and the natural decrease in the Sun’s elevation angle as the day progressed. Overall, we observed an average reduction of 98% in incoming solar radiation during the eclipse. This decrease directly correlated with the percentage of obscuration by the Moon.
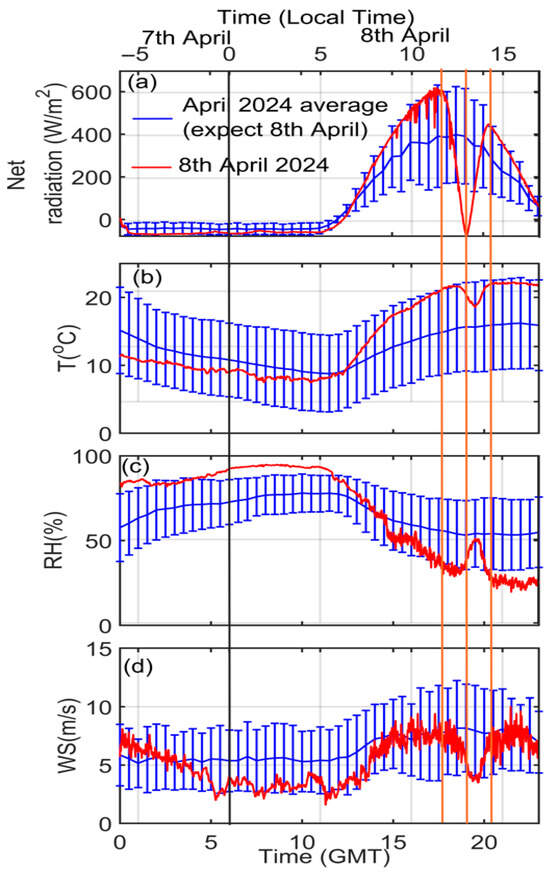
Figure 2.
Diurnal monthly mean time series of Net Radiation (a), surface temperature (b), relative humidity (c), and wind speed (d) observed over April 2024 (blue line) and on 8 April 2024 (solar eclipse day, red line) over Bondville, IL, USA. This data was obtained from the SURFRAD (Surface Radiation Budget) Network (https://gml.noaa.gov/grad/surfrad/overview.html (accessed on 14 July 2025)). The vertical black line differentiates 7 April and 8 April 2024. The orange vertical lines show the beginning of the solar eclipse, total solar eclipse, and end of the solar eclipse over Bondville, IL, USA.
The diurnal cycle of temperature for the eclipse day (8 April 2024) along monthly standard error lines is shown in Figure 2b. On this day, a few minutes after the NR maximum, the temperature was around ~21.9 °C. The temperature decreased by ~3.4 °C as the solar eclipse proceeded from partial to total around 19:00 GMT. This decrease was even more significant because the eclipse coincided with the natural evening cooling period. It is important to remember that the April average (excluding the eclipse day) shows a typical pattern of lower temperatures in the mornings and high temperatures in the afternoons. Unlike the immediate drop in NR during the eclipse, the temperature decrease lagged behind by about 50 min. This delay was due to the thermal inertia of the Earth’s surface, which takes time to lose heat. The relative humidity increased by 23% during totality of the solar eclipse (Figure 2c). After the end of solar eclipse, the relative humidity decreased to 30% following the diurnal cycle. However, with the commencement of the eclipse and the absence of solar forcing, air temperature declined and relative humidity steadily increased. Wind speed also showed a decrease, dropping from 8 m/s to 3.5 m/s following the eclipse (Figure 2d). The decline in wind speed and subsequent absence of solar forcing during the progression of the solar eclipse from partial to total resulted in decrease in wind speed.
3.2. Solar Eclipse’s Impact on Vertical Profiles of Temperature
To analyze the impact of the solar eclipse on temperature, we selected profiles from two grid boxes representing land and ocean regions along the eclipse path, as presented in Figure 3.
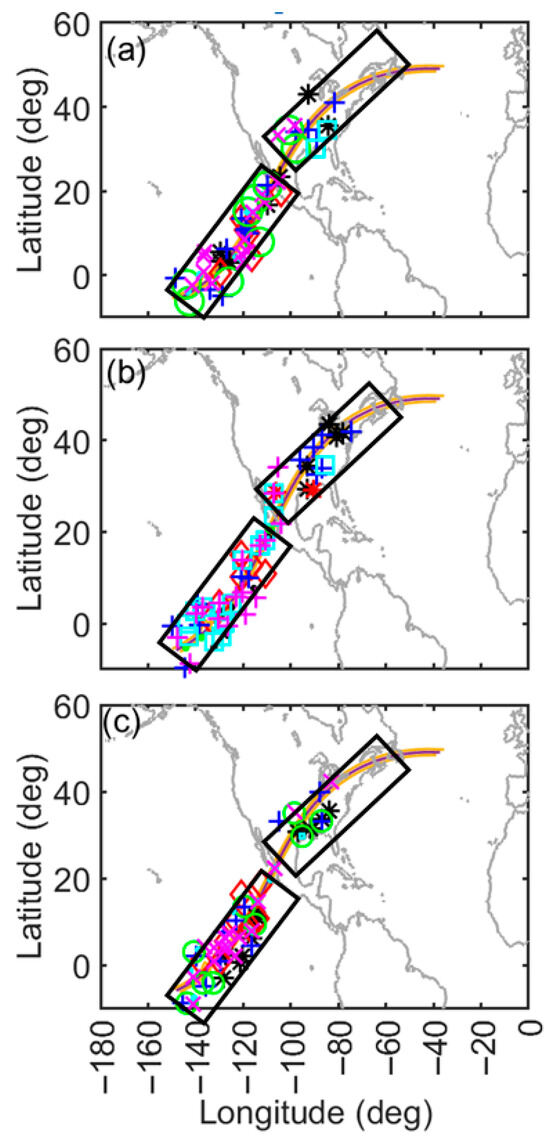
Figure 3.
Spatial distribution of COSMIC2 GPS RO profiles on (a) 7 April 2024, (b) 8 April 2024, and (c) 9 April 2024 along with solar eclipse path. Black symbol denotes −3:2 h before eclipse, red symbol denotes −2:1 h before eclipse, blue symbol denotes 1–0 h before eclipse, green symbol denotes 0–1 h after eclipse, cyan symbol denotes 1:2 h after eclipse, magenta symbol denotes 2–3 h after eclipse.
The colored symbols in boxes indicate data points categorized by their timing relative to the eclipse (within ±3 h before, during, and after the eclipse on different days). Figure 4 shows the temperature profiles for the ocean and land regions before, during, and after the eclipse (within 3 h).

Figure 4.
Vertical profiles of temperature during 7–9 April 2024 (a–f) and their differences between 8th April and 7th April (g,h) and 9th April and 7th April (i,j) for two different grids (as shown in Figure 1) with ±3 hour time window with respect to eclipse path time from COSMIC2 GPSRO observations.
In general, minimal temperature (10–40 km altitude range) variation was observed over the ocean region, while the land region exhibited significant changes. However, these variations were much more pronounced on the eclipse day over the land region. Following the eclipse, a clear difference was observed in upper tropospheric and stratospheric temperatures (Figure 4d). Upper tropospheric temperatures decreased by about ~5 °C, while stratospheric temperatures increased by ~4 °C. Interestingly, this decrease in upper tropospheric temperature persisted even 3 h after the eclipse. To further analyze the eclipse’s impact, we compared temperature differences between different days (Figure 4g–j). The difference between 8 and 9 April (during and after the eclipse) showed a predominant decrease in temperature between 10 and 16 km (upper troposphere) and a complete increase between 16 and 45 km (tropopause and stratosphere). It is important to note that the temperature profiles presented here are averages for a large region spanning from the equator to mid-latitudes. A significant temperature drop of ~7 °C was observed around the tropopause immediately after the eclipse. These observations highlight the eclipse’s influence on temperature profiles. For comparison, the difference between 7 and 9 April (no eclipse) showed no such features, supporting the conclusion of an eclipse effect. Our findings align with previous research by Wang and Liu [19] who reported a temperature increase of 7 °C in the lower stratosphere (17 km) and cooling in the troposphere during an eclipse. This cooling can be attributed to the sudden decrease in solar radiation, while the warming in the stratosphere might be due to eclipse-induced downward air movement, which adiabatically heats the region [20].
3.3. Solar Eclipse’s Impact on Tropopause
Further, we estimated the lapse rate tropopause (LRT) height and temperature 3 h before and after the solar eclipse with respect to different latitude grids during 7–9 April 2024, as shown in Figure 5. A decrease in tropopause altitude and temperature was clearly evident after the solar eclipse, particularly in tropical regions. The decrease in tropopause altitude was ~4–5 km while that in temperature was ~3–4 K. The tropopause altitude started decreasing from 0 to 5° latitude while temperature decreased from 5 to 10° latitude. Previous studies also showed a decrease in tropopause height and temperature after the solar eclipse [21]. The changes in tropopause temperature and altitude are associated with the exchange of air mass from the troposphere to stratosphere. The decrease in tropopause height was due to the adiabatic compression of the lower stratospheric atmosphere due to the solar eclipse.
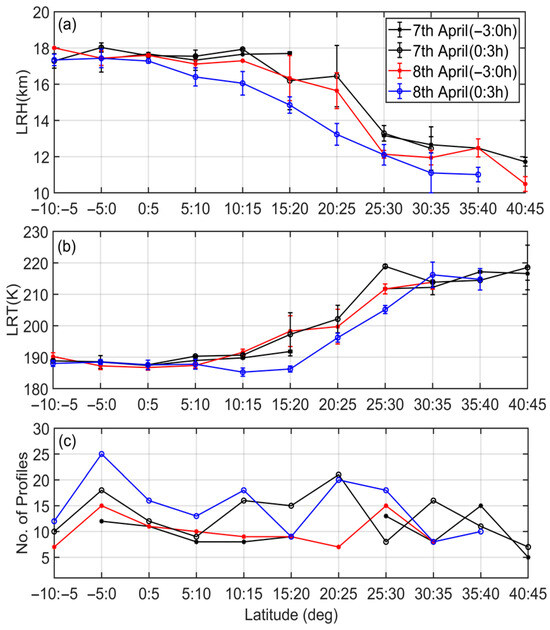
Figure 5.
Lapse rate tropopause temperature (a) and altitude (b) variability ±3 h before and after the solar eclipse during 7–8 April 2024 along with a number of profiles obtained for each latitude grid (c).
3.4. Solar Eclipse’s Impact on Vertical Profiles of Relative Humidity
Figure 6 displays vertical profiles of relative humidity for both the ocean and land regions during 7–9 April 2024 and their difference between 8th and 7th April and 9th and 7th April with a ±3 h’ time period with respect to the solar eclipse path to highlight the changes associated with the eclipse. The increase in relative humidity was evident after the eclipse in both regions (land and ocean) compared to that on the days before and after the eclipse. The increase in relative humidity after the eclipse was large in the lower troposphere over the ocean while in the mid-troposphere the maximum increase was observed over the land region. The increase in relative humidity over the ocean was more than 40% in the altitude range of 1–5 km. The observed increase in humidity following the eclipse was likely a consequence of the temperature drop.
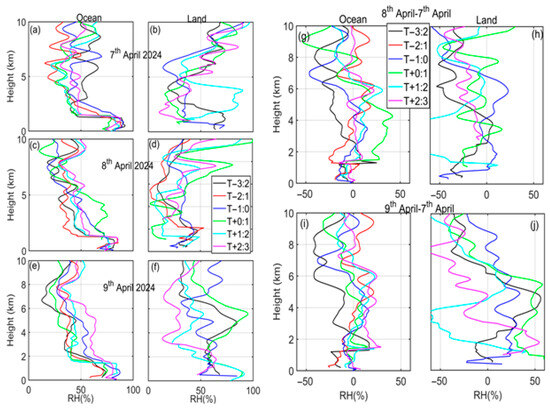
Figure 6.
Vertical profiles of relative humidity during 7–9 April 2024 (a–f) and their difference between 8th April and 7th April (g,h) and 9th April and 7th April (i,j) for two different grids (as shown in Figure 1) with ±3 hour time window with respect to eclipse path time from COSMIC2 GPSRO observations.
4. Discussion
This work presents the impact of the solar eclipse on surface meteorological parameters, water vapor (lower troposphere), and temperature in the lower and upper troposphere and lower stratosphere region. Our observations showed clear evidence of the atmosphere’s response to the solar eclipse, impacting layers from the surface to the stratosphere. This solar eclipse traveled a distance of 14,800 km (9200 miles) in 3 h 15 min, starting from Mexico (starting time 11:05 MST) and traveling through the USA and Canada. The eclipse caused a significant decrease in radiation, weakening the heating of the Earth’s surface. This reduction allowed radiative cooling processes to become more dominant, leading to a noticeable drop in surface temperature. The decrease in temperature led to an increase in relative humidity. Additionally, wind speeds were suppressed during the peak of the eclipse, likely due to the cooling and stabilization of the atmospheric boundary layer closest to the ground. The upper troposphere exhibited cooling while the stratosphere showed a warming impact. The cooling in the upper troposphere was primarily driven by thermal processes, as less solar energy reached the surface. In contrast, the warming in the stratosphere is thought to have been dynamically controlled.
5. Summary and Conclusions
This study analyzes the response of the atmosphere (from the surface to the stratosphere) during the solar eclipse that crossed the United States on 8 April 2024. The effect of the solar eclipse over land and ocean regions is brought out by utilizing a combination of surface and satellite observations. The key findings are summarized below.
- A significant decrease in NR directly proportional to the eclipse’s obscuration percentage was noticed. The reduction in temperature by ~3.4 °C was delayed by ~50 min compared to that in NR. Additionally, the eclipse led to increased relative humidity and decreased wind speed compared to those on other days. This phenomenon is attributed to the Moon blocking sunlight, lowering surface temperature, and allowing for high relative humidity.
- The upper troposphere experienced a temperature decrease, with the most significant cooling (~5 °C) occurring near the tropopause. Conversely, the stratosphere exhibited a warming trend of approximately ~4 °C within the attitude range of 17–45 km. This contrasting behavior might be linked to the compression of the atmosphere due to eclipse-induced thermal perturbations [21].
- A decrease in tropopause altitude and temperature was observed after the eclipse. The tropopause height and temperature decreased by ~4–5km (3–4 K) after the solar eclipse.
- Land regions experienced a more pronounced temperature response to the eclipse compared to ocean regions. However, both land and ocean areas experienced changes in relative humidity.
Author Contributions
Methodology, G.B.; Software, G.B.; Formal analysis, G.B.; Resources, K.P.; Writing—original draft, G.B.; Writing—review & editing, M.V.R.; Visualization, K.P.; Supervision, J.H.J.; Funding acquisition, J.H.J.; and super vision. All authors have read and agreed to the published version of the manuscript.
Funding
This work was supported by the National Atmospheric Research Laboratory.
Institutional Review Board Statement
Not applicable.
Informed Consent Statement
Not applicable.
Data Availability Statement
The data is publicly available from the COSMIC2/FORMOSAT-7 Data Analysis and Archive Center (CDAAC) and Surface Radiation Budget (SURFRAD) Network used in the present study.
Acknowledgments
The author J.H.J. acknowledges the support from the Jet Propulsion Laboratory, California Institute of Technology, under contract with NASA.
Conflicts of Interest
The authors declare no conflicts of interest.
References
- Founda, D.; Melas, D.; Lykoudis, S.; Lisaridis, I.; Gerasopoulos, E.; Kouvarakis, G.; Petrakis, M.; Zerefos, C. The effect of the total solar eclipse of 29 March 2006 on meteorological variables in Greece. Atmos. Chem. Phys. 2007, 7, 5543–5553. [Google Scholar] [CrossRef]
- Gerasopoulos, E.; Zerefos, C.S.; Tsagouri, I.; Founda, D.; Amiridis, V.; Bais, A.F.; Belehaki, A.; Christou, N.; Economou, G.; Kanakidou, M.; et al. The total solar eclipse of March 2006: Overview. Atmos. Chem. Phys. 2008, 8, 5205–5220. [Google Scholar] [CrossRef]
- Das, S.S.; Kishore Kumar, K.; Subrahmanyam, K.V.; Venkat Ratnam, M.; Suneeth, K.V.; Sunilkumar, S.V.; Sinha, P.R.; Ghosh, A.K.; Das, S.K.; Sonwabne, S.; et al. Impact of annular solareclipse on the trace gases and dynamics ofthe lower and middle atmosphere: Resultsinferred from an integrated campaign “Suryagrahan-2019”. Earth SpaceSci. 2023, 10, e2023EA003044. [Google Scholar] [CrossRef]
- Anderson, J. Meteorological changes during a solar eclipse. Weather 1999, 54, 207–215. [Google Scholar] [CrossRef]
- Szałowski, K. The effect of the solar eclipse on the air temperature near the ground. J. Atmos. Sol. Terr. Phys. 2002, 64, 1589–1600. [Google Scholar] [CrossRef]
- Babu, S.R.; Pani, S.K.; Ou-Yang, C.F.; Lin, N.H. Impact of 21 June 2020 annular solar eclipse on meteorological parameters, O3 and CO at a high mountain site in Taiwan. Aerosol Air Qual. Res. 2022, 22, 220248. [Google Scholar] [CrossRef]
- Ratnam, M.V.; Kumar, M.S.; Basha, G.; Anandan, V.K.; Jayaraman, A. Effect of the annular solar eclipse of 15 January 2010 on the lower atmospheric boundary layer over a tropical rural station. J. Atmos. Sol. Terr. Phys. 2010, 72, 1393–1400. [Google Scholar] [CrossRef]
- Eugster, W.; Emmel, C.; Wolf, S.; Buchmann, N.; McFadden, J.P.; Whiteman, C.D. Effects of vernal equinox solar eclipse on temperature and wind direction in Switzerland. Atmos. Chem. Phys. 2017, 17, 14887–14904. [Google Scholar] [CrossRef]
- Hanna, E. Meteorological effects of the 20 March 2015 solar eclipse over the United Kingdom. Weather 2018, 73, 71–80. [Google Scholar] [CrossRef]
- Girach, I.A.; Nair, P.R.; David, L.M.; Hegde, P.; Mishra, M.K.; Kumar, G.M.; Das, S.M.; Ojha, N.; Naja, M. The changes in near-surface ozone and precursors at two nearby tropical sites during annular solar eclipse of 15 January 2010. J. Geophys. Res. 2012, 117, D01303. [Google Scholar] [CrossRef]
- Kumar, K.K.; Subrahmanyam, K.V.; John, S.R. New insights into the stratospheric and mesosphere-lower thermospheric ozone response to the abrupt changes in solar forcing. Ann. Geophys. 2011, 29, 1093–1099. [Google Scholar] [CrossRef][Green Version]
- Kumar, V.; Prasad, S.B.; Reddy, K.K.; Dhaka, S.K.; Choudhary, R.K.; Reddy, M.V.; Ho, S.P. Temperature perturbations in the troposphere and lower stratosphere over a semi-arid region during the 2010 solar eclipse. Pure Appl. Geophys. 2022, 179, 2487–2499. [Google Scholar] [CrossRef]
- Ramkumar, G.; Subrahmanyam, K.V.; Kumar, K.K.; Das, S.S.; Swain, D.; Sunilkumar, S.V.; Namboodiri, K.V.S.; Uma, K.N.; Babu, V.S.; John, S.R.; et al. First observational study during a solar eclipse event on variations in the horizontal winds simultaneously in the troposphere-stratosphere-mesosphere-lower-thermosphere region over the equatorial station Thumba (8.5°N, 77°E). Earth Planets Space 2013, 65, 781–790. [Google Scholar] [CrossRef][Green Version]
- Ratnam, M.V.; Basha, G.; Roja Raman, M.; Mehta, S.K.; Krishna Murthy, B.V.; Jayaraman, A. Unusual enhancement in temperature and ozone vertical distribution in the lower stratosphere observed over Gadanki, India, following the 15 January 2010 annular eclipse. Geophys. Res. Lett. 2011, 38, L02803. [Google Scholar] [CrossRef]
- Ratnam, M.V.; Talukdar, S.; Prasad, P.; Raj, S.A.; Raman, M.R.; Kumar, S.S.; Kiran, V.R.; Jain, C.D.; Basha, G. Extended fumigation effect on surface and boundary layer aerosol concentrations observed during solar eclipse. Atmos. Pollut. Res. 2021, 12, 446–454. [Google Scholar] [CrossRef]
- Subrahmanyam, K.V.; Ramkumar, G.; Kumar, K.K.; Swain, D.; Sunil Kumar, S.V.; Das, S.S.; Choudhary, R.K.; Namboodiri, K.V.S.; Uma, K.N.; Veena, S.B.; et al. Temperature perturbations in the troposphere-stratosphere over Thumba (8.5°N, 76.9°E) during the solar eclipse 2009/2010. Ann. Geophys. 2011, 29, 275–282. [Google Scholar] [CrossRef][Green Version]
- Ho, S.P.; Pedatella, N.; Foelsche, U.; Healy, S.; Weiss, J.P.; Ullman, R. Using radio occultation data for atmospheric numerical weather prediction, climate sciences, and ionospheric studies and initial results from COSMIC-2, commercial RO data, and recent RO missions. Bull. Am. Meteorol. Soc. 2022, 103, E2506–E2512. [Google Scholar] [CrossRef]
- Anthes, R.; Schreiner, W. Six new satellites watch the atmosphere over Earth’s equator. Eos 2019, 100. [Google Scholar] [CrossRef]
- Wang, K.Y.; Liu, C.H. Profiles of temperature responses to the 22 July 2009 total solar eclipse from FORMOSAT-3/COSMIC constellation. Geophys. Res. Lett. 2010, 37, L01804. [Google Scholar] [CrossRef]
- Subrahmanyam, K.V.; Kumar, K.K.; Ramkumar, G. Delayed effects of annular solar eclipse of 15 January 2010 on the tropospheric and lower stratospheric winds along the eclipse path. Atmos. Res. 2013, 122, 1–7. [Google Scholar] [CrossRef]
- Prasad, S.S.; Kumar, V.; Reddy, K.K.; Dhaka, S.K.; Malik, S.; Reddy, M.V.; Krishna, U.M. Perturbations in Earth’s Atmosphere over An Indian Region during the Total Solar Eclipse on 22 July 2009. J. Meteorol. Res. 2019, 33, 784–796. [Google Scholar] [CrossRef]
Disclaimer/Publisher’s Note: The statements, opinions and data contained in all publications are solely those of the individual author(s) and contributor(s) and not of MDPI and/or the editor(s). MDPI and/or the editor(s) disclaim responsibility for any injury to people or property resulting from any ideas, methods, instructions or products referred to in the content. |
© 2025 by the authors. Licensee MDPI, Basel, Switzerland. This article is an open access article distributed under the terms and conditions of the Creative Commons Attribution (CC BY) license (https://creativecommons.org/licenses/by/4.0/).