Article

Discovery of Large Methane Emissions Using a Complementary Method Based on Multispectral and Hyperspectral Data

1
Beijing Institute of Space Mechanics and Electricity, China Academy of Space Technology, Beijing 100094, China
2
Key Laboratory of Advanced Technologies of Materials, Ministry of Education, School of Materials Science and Engineering, Southwest Jiaotong University, Chengdu 610031, China
*
Author to whom correspondence should be addressed.
Atmosphere 2025, 16(5), 532; https://doi.org/10.3390/atmos16050532
Submission received: 19 March 2025 / Revised: 25 April 2025 / Accepted: 28 April 2025 / Published: 30 April 2025
(This article belongs to the Special Issue Study of Air Pollution Based on Remote Sensing (2nd Edition))

Abstract

:
As global atmospheric methane concentrations surge at an unprecedented rate, the identification of methane super-emitters with significant mitigation potential has become imperative. In this study, we utilize remote sensing satellite data with varying spatiotemporal coverage and resolutions to detect and quantify methane emissions. We exploit the synergistic potential of Sentinel-2, EnMAP, and GF5-02-AHSI for methane plume detection. Employing a matched filtering algorithm based on EnMAP and AHSI, we detect and extract methane plumes within emission hotspots in China and the United States, and estimate the emission flux rates of individual methane point sources using the IME model. We present methane plumes from industries such as oil and gas (O&G) and coal mining, with emission rates ranging from 1 to 40 tons per h, as observed by EnMAP and GF5-02-AHSI. For selected methane emission hotspots in China and the United States, we conduct long-term monitoring and analysis using Sentinel-2. Our findings reveal that the synergy between Sentinel-2, EnMAP, and GF5-02-AHSI enables the precise identification of methane plumes, as well as the quantification and monitoring of their corresponding sources. This methodology is readily applicable to other satellite instruments with coarse SWIR spectral bands, such as Landsat-7 and Landsat-8. The high-frequency satellite-based detection of anomalous methane point sources can facilitate timely corrective actions, contributing to the reduction in global methane emissions. This study underscores the potential of spaceborne multispectral imaging instruments, combining fine pixel resolution with rapid revisit rates, to advance the global high-frequency monitoring of large methane point sources.

1. Introduction

Methane (CH4) is a significant greenhouse gas, second only to carbon dioxide (CO2), accounting for over 20% of the total global greenhouse gas emissions [1,2]. The Sixth Assessment Report of the Intergovernmental Panel on Climate Change (IPCC) indicates that methane’s contribution to global warming has reached 25% [3], with a global warming potential over 20 and 100 years that is 84 and 28 times that of CO2, respectively. Moreover, methane has a relatively short residence time in the atmosphere (9 ± 1 years). Thus, reducing methane emissions is considered one of the effective ways to combat global climate change on a decadal scale. Over the past decade, atmospheric methane concentrations have increased rapidly, nearing three times pre-industrial levels [4]. This surge is primarily due to human activities, such as the extraction of fossil fuels like coal, oil, and natural gas [5,6].
Studies on methane emissions from facilities have shown that a small number of extremely strong point sources account for a significant portion of total emissions due to equipment malfunctions or abnormal operating conditions [7,8]. Rapidly identifying, repairing, and regularly monitoring these top emitters presents an opportunity to mitigate climate change effectively.
Satellite remote sensing provides an important technical means for systematically monitoring methane point source emissions in the global oil and gas production sector. The shortwave infrared range (1600–2500 nm) detected by hyperspectral imaging spectrometers under clear-sky conditions can be used for the inversion of the atmospheric methane column concentration. For example, instruments such as the Scanning Imaging Absorption Spectrometer for Atmospheric Cartography (SCIAMACHY) [9] and the Greenhouse Gases Observing Satellite (GOSAT) [10] have already achieved the inversion of the methane column concentration at global and regional scales. However, these satellite sensors have a relatively coarse spatial resolution, which leads to a lower estimation accuracy in monitoring methane point source emissions [11]. Methane point source emission monitoring requires high spatial resolution hyperspectral imaging data. Relevant application cases have demonstrated the potential of such data in methane plume remote sensing inversion. For example, Thompson et al. [12] used Hyperion hyperspectral data to monitor methane leakage emissions from the Aliso Canyon in California, USA. The Visible Shortwave Infrared Hyperspectral Imager (AHSI) onboard China’s Gaofen-5 (GF5) and Ziyuan-1 02D (ZY1-02D) satellites has also been successfully applied to methane point source emission monitoring in the Permian Basin region of the USA [13,14]. The GHGSat satellite from Canada [15] is specifically designed to monitor methane point sources with a spatial resolution of 25 m over a 12 × 12 km2 area (detection accuracy of 1–15%). In addition, multispectral satellites such as Landsat-8 [16], Sentinel-2A/2B [17], and WorldView-3 [18] have recently been proven to be capable of mapping super methane emission sources occurring on bright and homogeneous surfaces. However, due to their relatively coarse spectral resolution, multispectral imagers still have a much higher detection limit for methane point sources compared to hyperspectral imagers.
Satellite observations of methane in the atmosphere using shortwave infrared (SWIR) solar backscattering hold unique potential for both global and point source monitoring, provided that they are combined with a fine spatial resolution and frequent revisit rates. The Sentinel-2 twin satellites are equipped with multi-band instruments capable of observing in the methane-sensitive SWIR bands, and their 20 m resolution methane data can pinpoint the locations of significant leaks (>1 t/h) [17]. However, the relatively coarse spatial resolution of these satellite sensors results in a lower accuracy for monitoring methane point sources [19,20,21].
China’s GaoFen-5 satellite (GF5-02), equipped with the Advanced Hyperspectral Imager (AHSI), is specifically designed to detect methane point sources within a confined area (60 × 60 km2) using a fine pixel resolution (30 m) and relatively high accuracy (3–18 percent) [22]. It aims to detect methane plumes with a spectral resolution of 10 nm and a pixel resolution of 30 m, offering a significant advantage in detecting methane point source emissions due to its high signal-to-noise ratio (approximately 500 in shortwave Infrared, SWIR) [23,24,25]. The Environmental Mapping and Analysis Program (EnMAP) mission, initiated in April 2022 (DLR/GFZ, Potsdam, Germany), also features similar spatial and spectral characteristics (30 m resolution, 30 km swath, and about 8 nm spectral sampling at 2300 nm). Despite a similar spectral resolution and sampling, research on EnMAP’s capability to map methane has been relatively limited due to its more recent launch [26]. Frequent revisits require a satellite constellation system due to spatial coverage and mission scheduling constraints. The Sentinel-2, with its twin-satellite configuration, achieves global coverage every five days and a revisit rate of every two to three days in mid-latitude regions [27]. Therefore, in this study, we leverage the combined capabilities of Sentinel-2 and EnMAP/GF5-02-AHSI for methane plume detection. We apply a match filter algorithm based on EnMAP/AHSI to identify and quantify abnormal point source emissions in methane hotspots in Shanxi, China, and the Permian Basin, USA. In addition, we conduct the high-frequency monitoring of methane emissions from two facilities, the Sanyuan Nan Yao Coal Mine in Changzhi, Shanxi, China, and the EOG Shale Gas Well in Eddy County, New Mexico, using the MBMP (multi-band multi-pass) method. Our findings suggest that the emissions from these methane plumes are not related to seasonal changes, offering a unique perspective on the variability and intermittency of large point source methane emissions. This work demonstrates how satellite-based multispectral imaging instruments can facilitate the global high-frequency mapping of large methane point sources by combining a fine pixel resolution with rapid revisit rates.

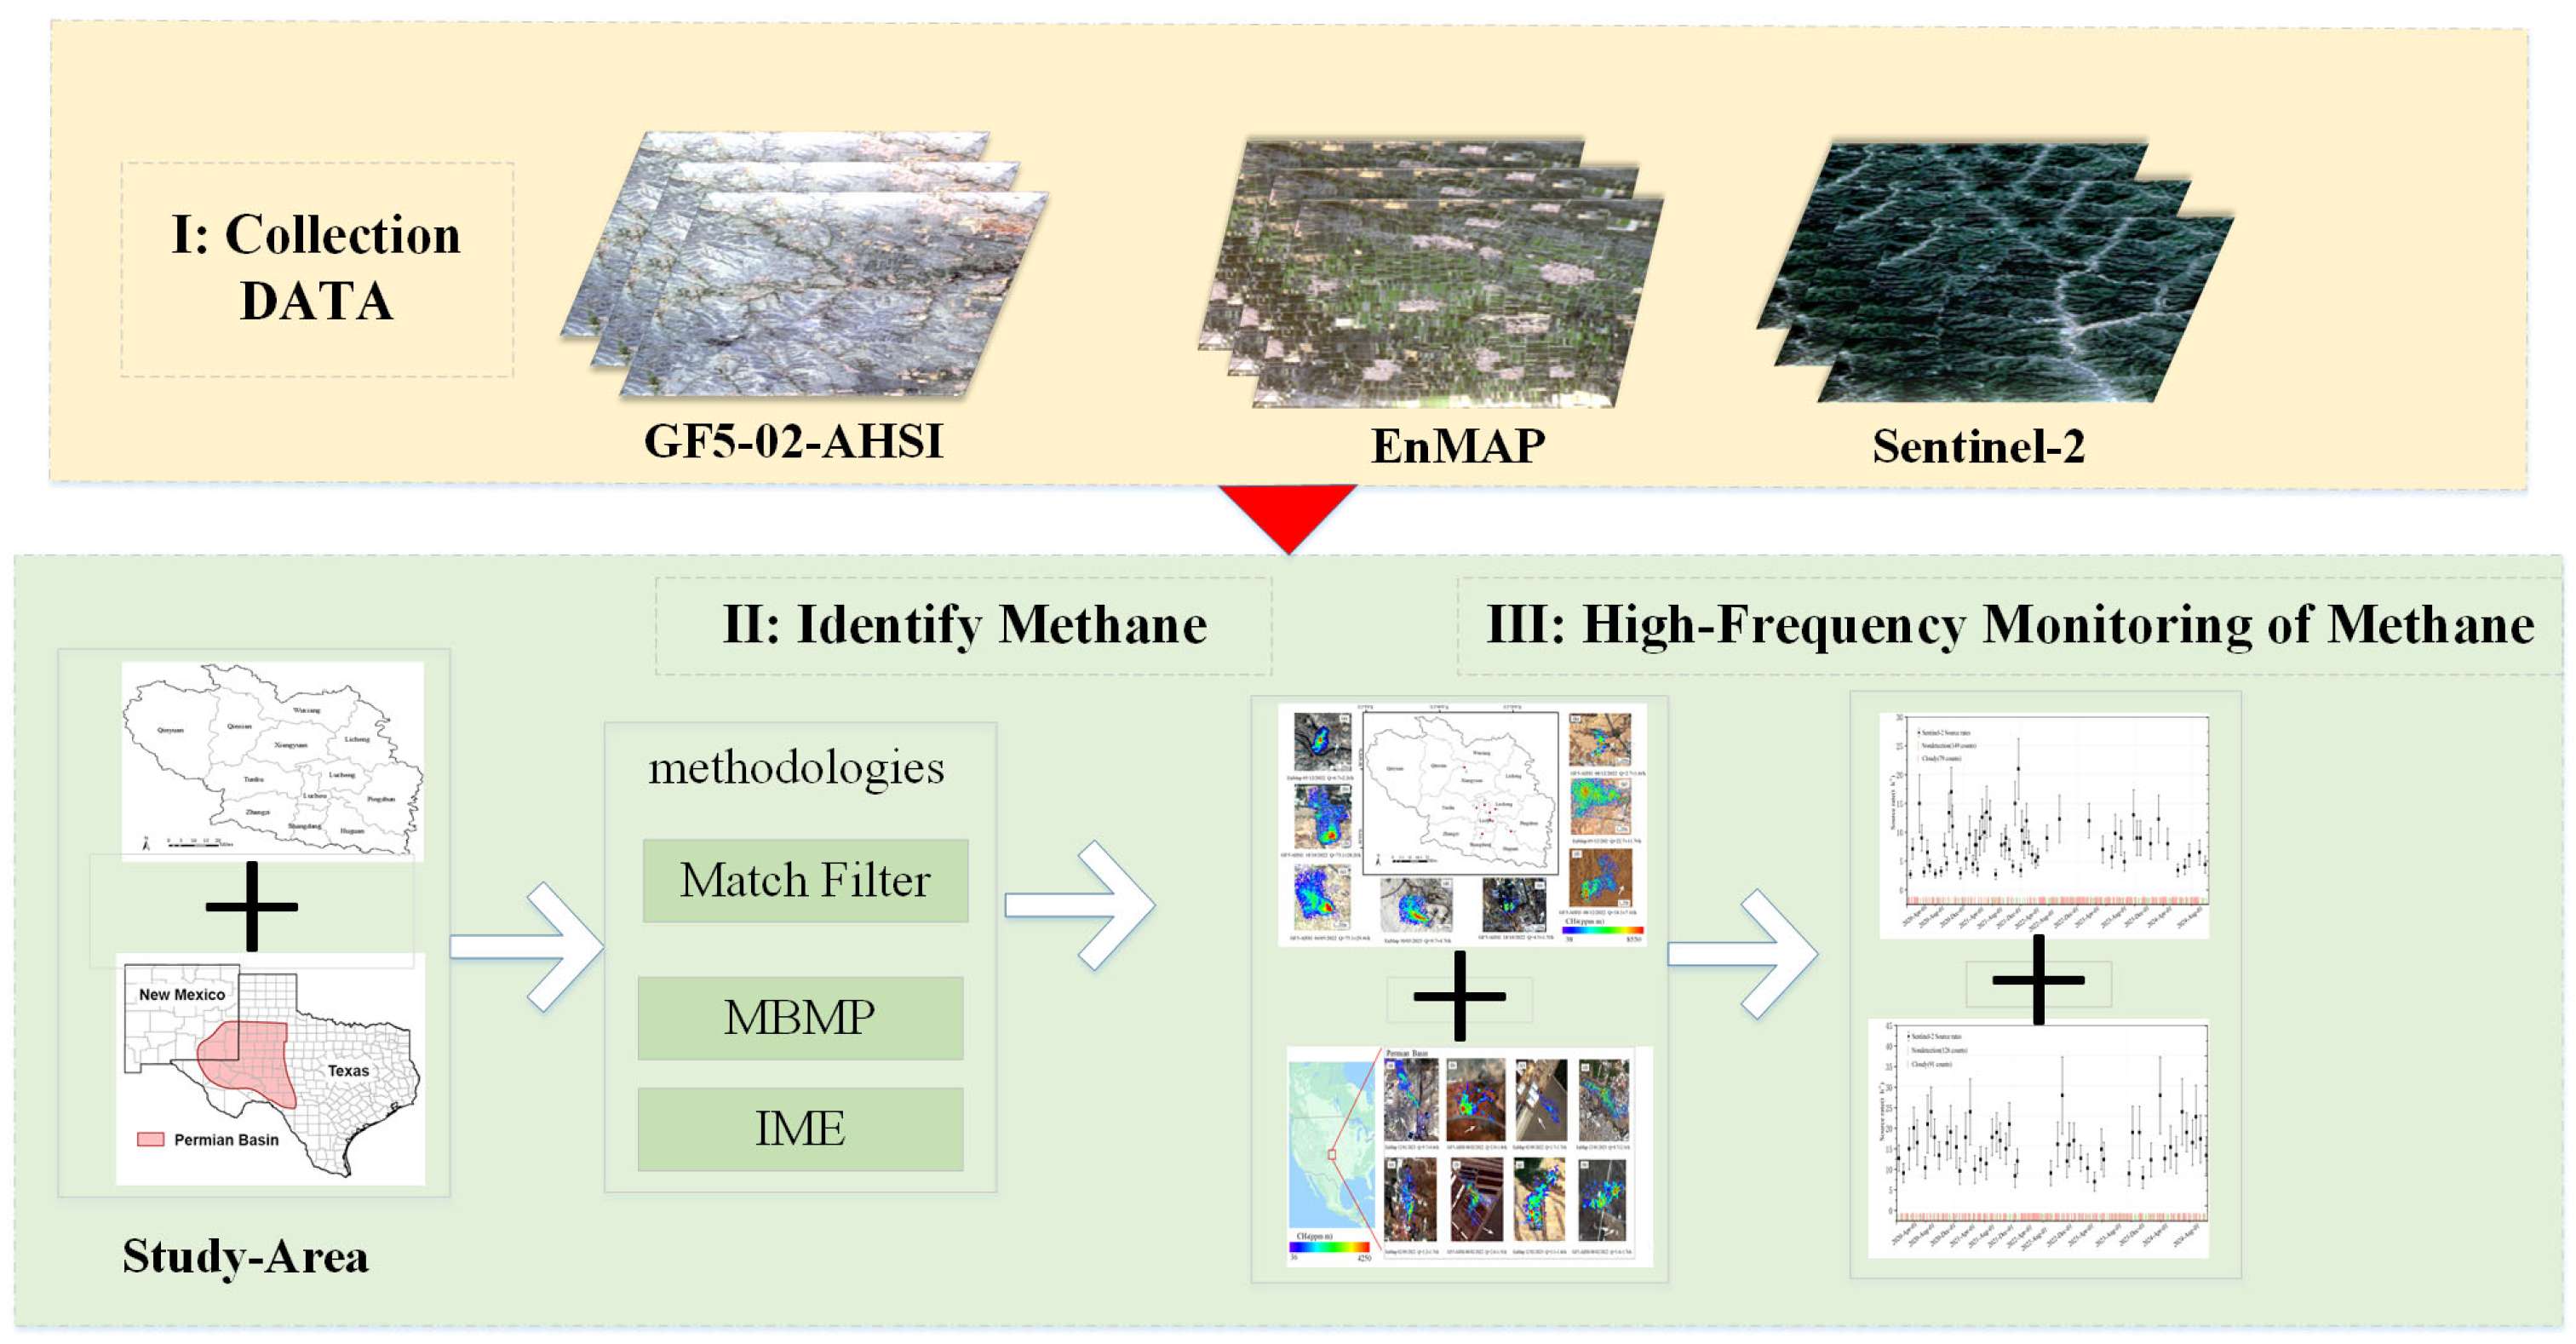
2. Research Framework

The research framework employed in this study is shown in Figure 1. This paper is based on multi-source satellite data (Sentinel-2, EnMAP, and GF5-02-AHSI), proposing a tiered monitoring approach by combining high-frequency observations and high-resolution spectral data to detect and quantify methane super-emitters. This study first employs a matched filtering algorithm to identify methane plumes from high-resolution data and estimates emission flux rates using the Integrated Methane Enhancement (IME) model. Subsequently, it leverages the high revisit frequency of Sentinel-2 to conduct the long-term monitoring of selected hotspot regions, analyzing the spatiotemporal characteristics of methane emissions. Ultimately, the research demonstrates the potential of satellite remote sensing technology in methane emission monitoring and provides a scientific basis for global methane mitigation efforts.

3. Data Source and Methods

3.1. Data Source

The GF-5B satellite is the second satellite of the Gaofen-5 series and was launched on 7 September 2021. It has accumulated over 2 years’ worth of global observational data to date. Equipped with the Advanced Hyperspectral Imager (AHSI), it can capture spectral information spanning from 400 to 2500 nm, with a spatial resolution of 30 m over a 60 km swath, encompassing 330 spectral channels with spectral resolutions of 5 and 10 nm in the visible to near-infrared (VNIR) and shortwave infrared (SWIR) spectroscopy, respectively [23,24]. Its relatively high signal-to-noise ratio (around 500 in the SWIR) presents notable advantages in detecting methane point source emissions [25]. The retrieval of the enhancement of a column-averaged dry-air mole fraction of CH4 (ΔXCH4) relies primarily on the strong CH4 absorption features near 2300 nm, while the 2100 to 2450 nm spectral window of the GF5-02-AHSI demonstrates higher sensitivity to XCH4 variations, thereby possessing enhanced capabilities for precise methane concentration inversion.
The EnMAP payload, jointly developed by the German Aerospace Center (Deutsches Zentrum für Luft- und Raumfahrt, DLR) and Kayser-Threde GmbH, was launched in April 2022. It features a 30 km swath (Field of View, FOV = 2.63°), 30 m spatial resolution, and includes 242 spectral bands, with a range from 420 to 2450 nm [26]. The visible to near-infrared (VNIR) bands cover the range of 420 to 1000 nm, while the shortwave infrared (SWIR) bands span from 900 to 2450 nm. Utilizing the absorption characteristics in the SWIR region, EnMAP is capable of retrieving atmospheric methane concentrations, enabling the monitoring of areas with high methane levels globally. Researchers have employed EnMAP data to identify significant methane emissions from oil and gas infrastructure [25].
Sentinel-2 is a European Earth observation mission designed to provide operational data products for environmental risk management, land cover classification, land change detection, and terrestrial mapping [27]. It comprises two satellites positioned 180° out of phase in the same sun-synchronous orbit, with an Equator-crossing time of 10:30 (local solar time) at the descending node. Sentinel-2A was launched in June 2015, and Sentinel-2B in March 2017. Each satellite carries a multi-band instrument that continuously sweeps the Earth’s surface in 13 spectral bands from the visible to the shortwave infrared (SWIR) at a 10–60 m pixel resolution over a 290 km cross-track swath. The twin satellite configuration enables full global coverage every five days. We use the Sentinel-2 Level-1C top-of-atmosphere reflectance data of the SWIR-1 (~1560–1660 nm) and SWIR-2 (~2090–2290 nm) bands to retrieve methane column enhancements [28].
The Sentinel-2 data are openly available on the European Space Agency’s Copernicus Open Access Hub and with fixed geographic coordinates in the UTM/WGS84 projection. We present retrievals for two locations observed between January 2020 and June 2024. The first location is a coal mine facility in Changzhi, Shanxi, China: the Sanyuan Nan Yao Coal Mine (36°14′53″ N, 112°59′18″ E). The second is a device EOG Shale Gas Well in Eddy County, New Mexico (104°56′34″ W, 32°40′18″ N). Varon et al. [29] conducted a study on it using the GHGSat-D demonstration satellite instrument. Sentinel-2 acquired 271 cloud-free observations at the Changzhi facility in Shanxi over a 4-year period, and 293 cloud-free observations at the EOG Shale Gas Well in Eddy County over a 4-year period.
The fundamental principle behind retrieving the column-averaged dry-air mole fraction of methane (XCH4) using Sentinel-2 is based on the absorption of solar radiation by methane present in the atmosphere, which is primarily centered around wavelengths of 1600 and 2300 nm, corresponding to Sentinel-2’s bands 11 and 12. Figure 2 illustrates the methane spectral transmittance based on the high-resolution HITRAN2020 Sentinel-2B [30,31]. The MultiSpectral Instruments (MSIs) on Sentinel-2A and Sentinel-2B have slightly different positions and widths for the spectral transmittance windows. Band 11 encompasses a set of weaker methane absorption lines near 1650 nm, the molecular absorption database, and the spectral response functions of Sentinel-2A, while band 12 contains stronger absorption lines within the range of 2200–2300 nm. The average methane transmittance for band 12 is 2 to 3 times lower than that of band 11.
Multispectral sensors (such as Sentinel-2) operate based on imaging spectrometry techniques. They split the incident full-spectrum or broad-band light signals into several narrow-band beams and then image each of them onto the corresponding detectors. These detectors are typically arrays of pixels, with each pixel corresponding to a specific spectral band [17]. When the light signal strikes the surface of an object, the object reflects or emits light in specific bands, which is captured by the sensor and converted into electrical signals. Through data processing and image analysis, the characteristic information of the target substance in different spectral bands can be extracted. Hyperspectral sensors (such as GF5-02-AHSI and EnMAP) work on a principle similar to that of multispectral sensors but can obtain more and narrower spectral band information. Taking EnMAP as an example, its sensor, with its finer spectral resolution, can capture the subtle spectral characteristics of objects in different bands, thereby providing richer information about the objects. For instance, in methane emission detection, hyperspectral sensors can more accurately identify and quantify methane emissions by utilizing the absorption characteristics of methane in specific bands.
To identify methane emission hotspots in China and the United States and monitor them frequently, this study initially employs a match filter algorithm applied to EnMAP/AHSI data for the detection of these areas. Subsequently, for the identified hotspots, we utilize the Google Earth Engine (GEE) platform [33] to process Sentinel-2 Level 1C (L1C) data, specifically selecting the top-of-atmosphere reflectance in bands 11 and 12 for individual plumes. The data are filtered based on a quality assurance (QA) threshold greater than 0.5 to conduct remote sensing identification and the quantification of abnormal point source emissions within these methane hotspot regions.

3.2. Methods

3.2.1. MBMP (Multi-Band Multi-Pass)

We use the MBMP method to retrieve methane column enhancements from the Sentinel-2 SWIR band measurements [34,35,36]. A clear-sky reference image is chosen for each location, with the MBMP image given by:
MBMP = c R 12 R 11 R 11 c R 12 R 11 R 11
where R 11 and R 12 are the raw Sentinel-2 band 11 and 12 observations for the current image, R 11 and R 12 are the raw Sentinel-2 band 11 and 12 observations for the reference image, and c( c ) is calculated by the least-squares regression of R 11 against R 12 ( R 11 against R 12 ) for all pixels. These images are used to manually identify and label the extent of the methane plumes for each time step.

3.2.2. Match Filter

The match filter algorithm identifies and estimates the methane content by matching preset methane spectral characteristics with similar features found in actual observational data. The core concept of this algorithm is that each input spectral radiance value can be represented as the background radiance of an area without methane enhancement, and as the radiative disturbance caused by changes in methane concentration [32]. The specific calculation is as follows:
α = x μ T β 1 t t T β 1 t
In the formula, α represents the column methane concentration in milligrams per square meter (mg·m−2); x is the observed radiance value; μ is the mean background radiance; β is the covariance of the radiance values within the dataset, and the target spectrum that determines the spectral features to which the match filter is sensitive; T denotes the transpose of a matrix, which is a matrix operation; t is the radiative disturbance in the target spectrum, and this disturbance is dependent on the methane absorption spectrum s and the mean background radiance μ . The calculation is as follows:
t s ( μ ) = μ × s
In the equation, the unit of the methane absorption spectrum s is obtained through atmospheric radiative transfer simulations in MODTRAN5.2.1 (MODerate resolution atmospheric TRANsmission) [37], and t s ( μ ) denotes the background radiance value when the absorption spectrum is s. This allows for the estimation of methane concentration. × represents multiplication in mathematics. The absorption characteristics of methane in the shortwave infrared range within the atmosphere can be simulated using MODTRAN’s atmospheric radiative transfer model. The match filter algorithm has been successfully applied for the retrieval of methane point source column concentrations from both airborne and satellite-based hyperspectral data [38].

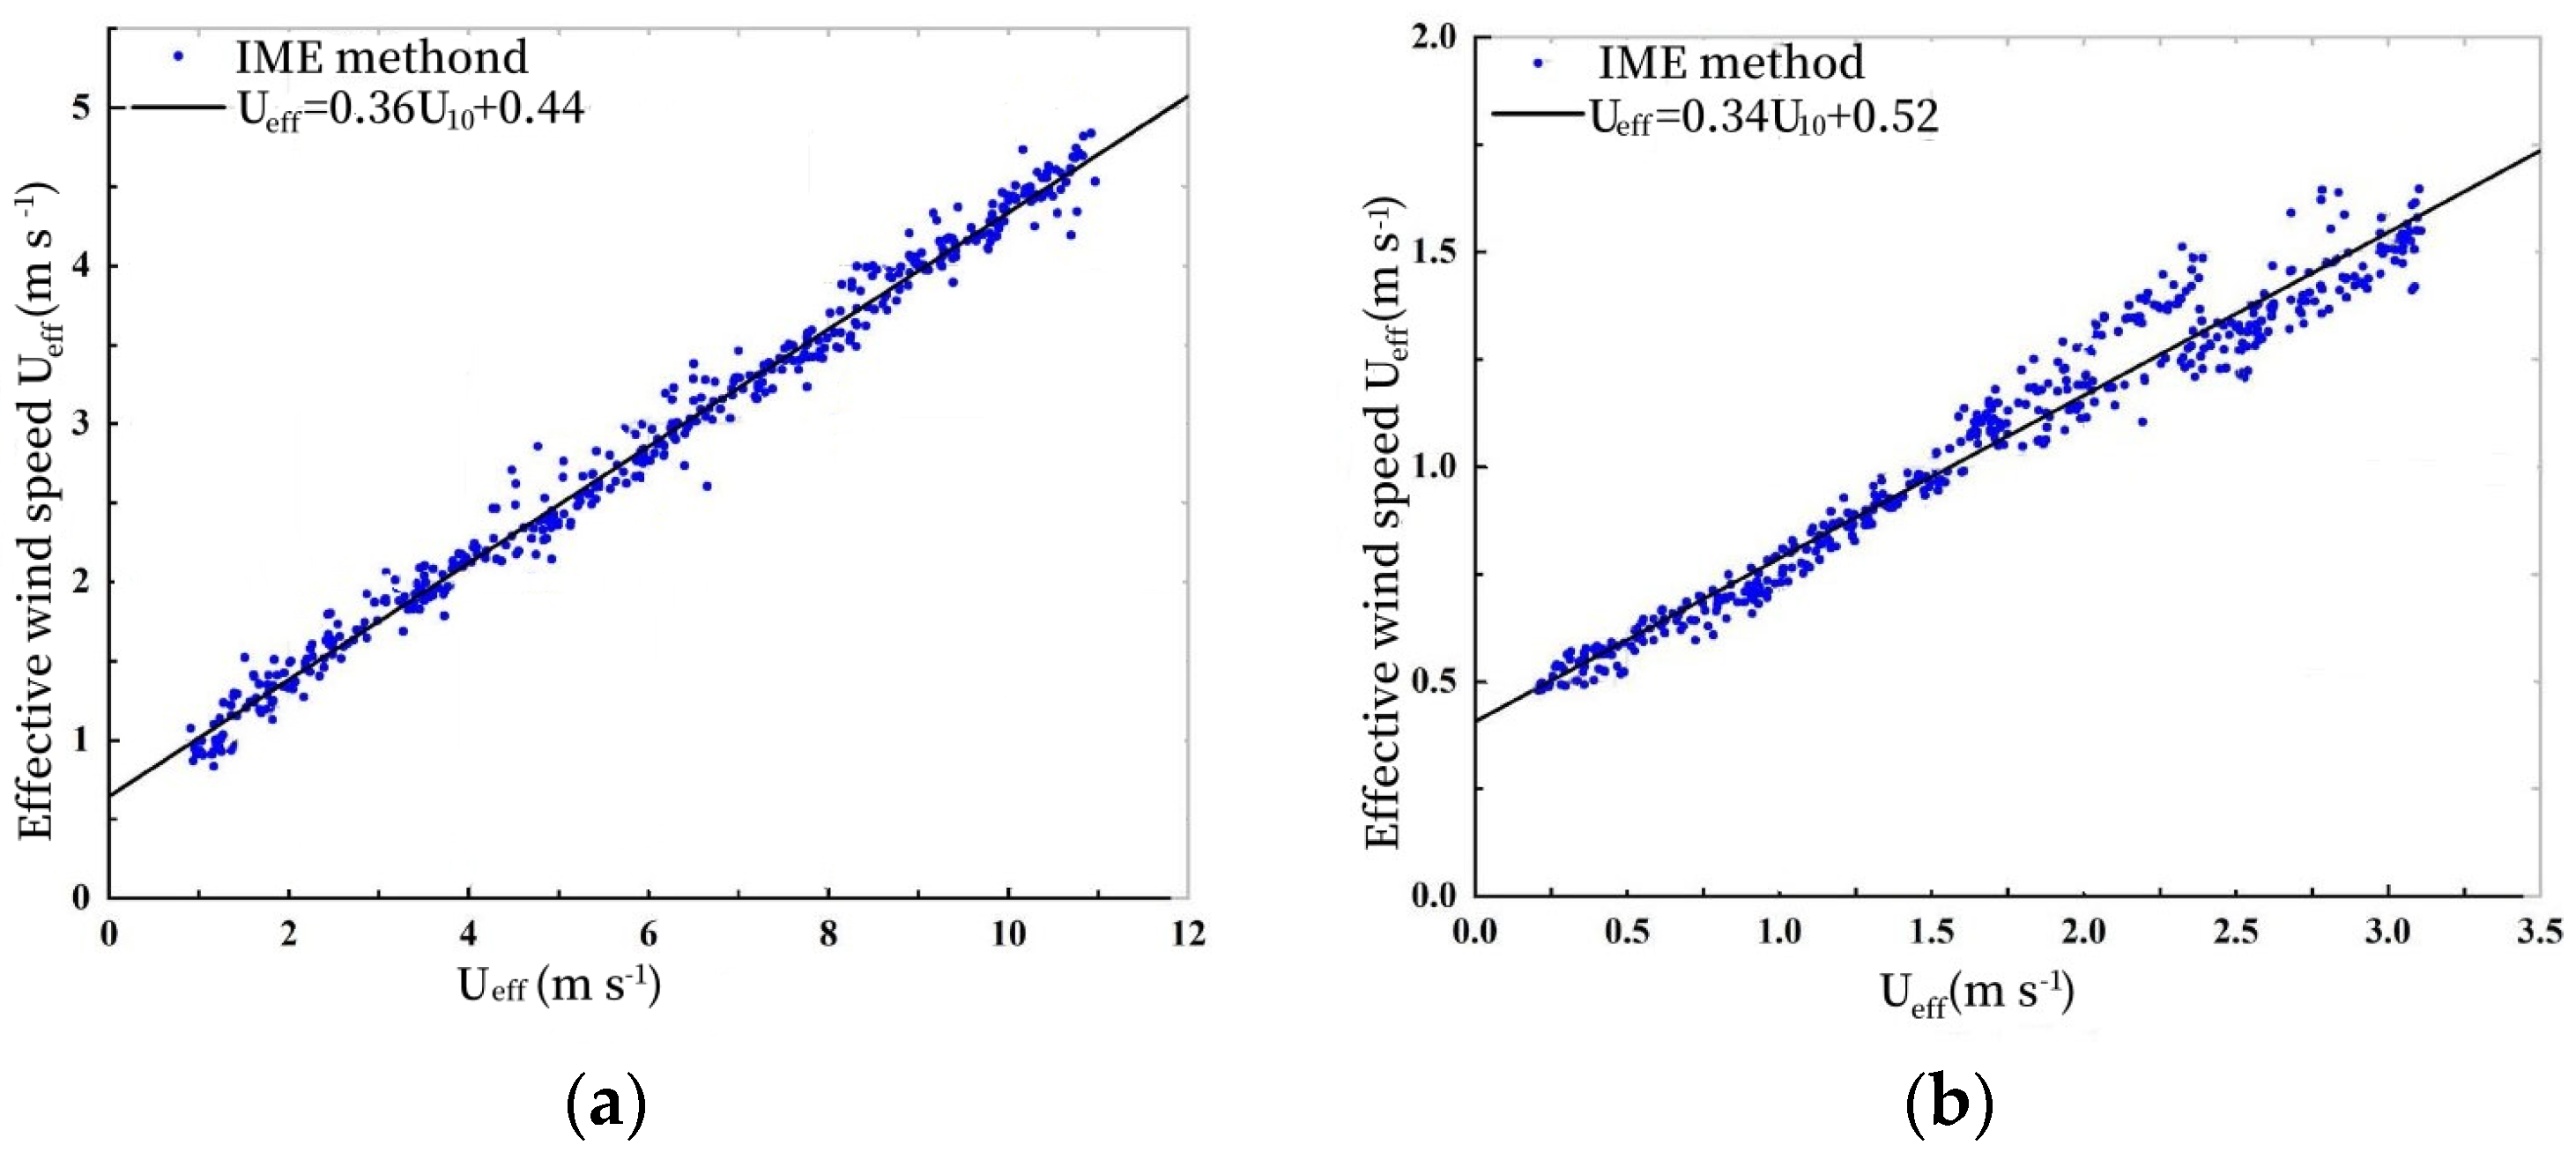
3.2.3. Integrated Methane Enhancement (IME) Method

We calculated the emission flux rate of methane point sources using the Integrated Methane Enhancement (IME) method. Since the instantaneous methane plume from a single point source is relatively small, many sources do not conform to Gaussian behavior, leading to significant errors in flux rate inversion using Gaussian plume modeling. The IME method links the total plume mass to the point source emission rate [39], and this approach depends on the effective wind speed and the characteristic size of the plume, resulting in lower errors. The methane emission flux rate Q (kg/h) is computed based on the IME model and the methane concentration enhancement within the plume. The specific calculation process is as follows:
I M E = k i = 1 n p α ^ ( i )
In the formula, IME stands for the total mass of the methane plume; k is calculated by considering Avogadro’s law (1 mol CH4 = 0.01604 kg), the spatial resolution of the GF5-02-AHSI data (30 m), and an assumed atmospheric layer thickness (8 km); np denotes the total number of pixels within the plume; and α(i) represents the ΔXCH4 value of the i-th pixel. Based on the research by Varon et al. [29], we relate the total methane emission (IME) to the emission rate Q.
Q = I M E × U e f f L
In the formula, L represents the length scale of the methane plume, which is the square root of the plume’s area, and U e f f is the effective wind speed, derived from the measurable 10 m wind speed U 10 :
U e f f   = a × U 10 + b
The relationship between U e f f and U 10 is established based on a set of mesoscale meteorological models (Weather Research and Forecasting model, WRF) coupled with large eddy simulations [40], with data sourced from the Global Forecast System-Fifth Generation (GEOS-FP) dataset [41]. Large-scale background wind speed is provided, where a and b are empirical coefficients determined by combining the simulation results from the WRF model and the EOS-FP dataset. The WRF model is a mesoscale meteorological model used to simulate meteorological conditions in specific regions. Using the U 10 data provided by EOS-FP as input, the WRF model is run to generate high-resolution wind field data. The relationship between U e f f and U 10 is determined through statistical methods (such as regression analysis) to establish the coefficients a and b in the formula, thus obtaining the linear relationship between U e f f and U 10 . The existing relationship is utilized to directly calculate U e f f using the average relationship shown in Figure 3, unless new coefficients need to be calibrated for new regions or new meteorological conditions. The relationship between the 10 m wind speed and the effective wind speed in Changzhi, Shanxi, China, and the Permian Basin in the United States is specifically shown in Figure 3.

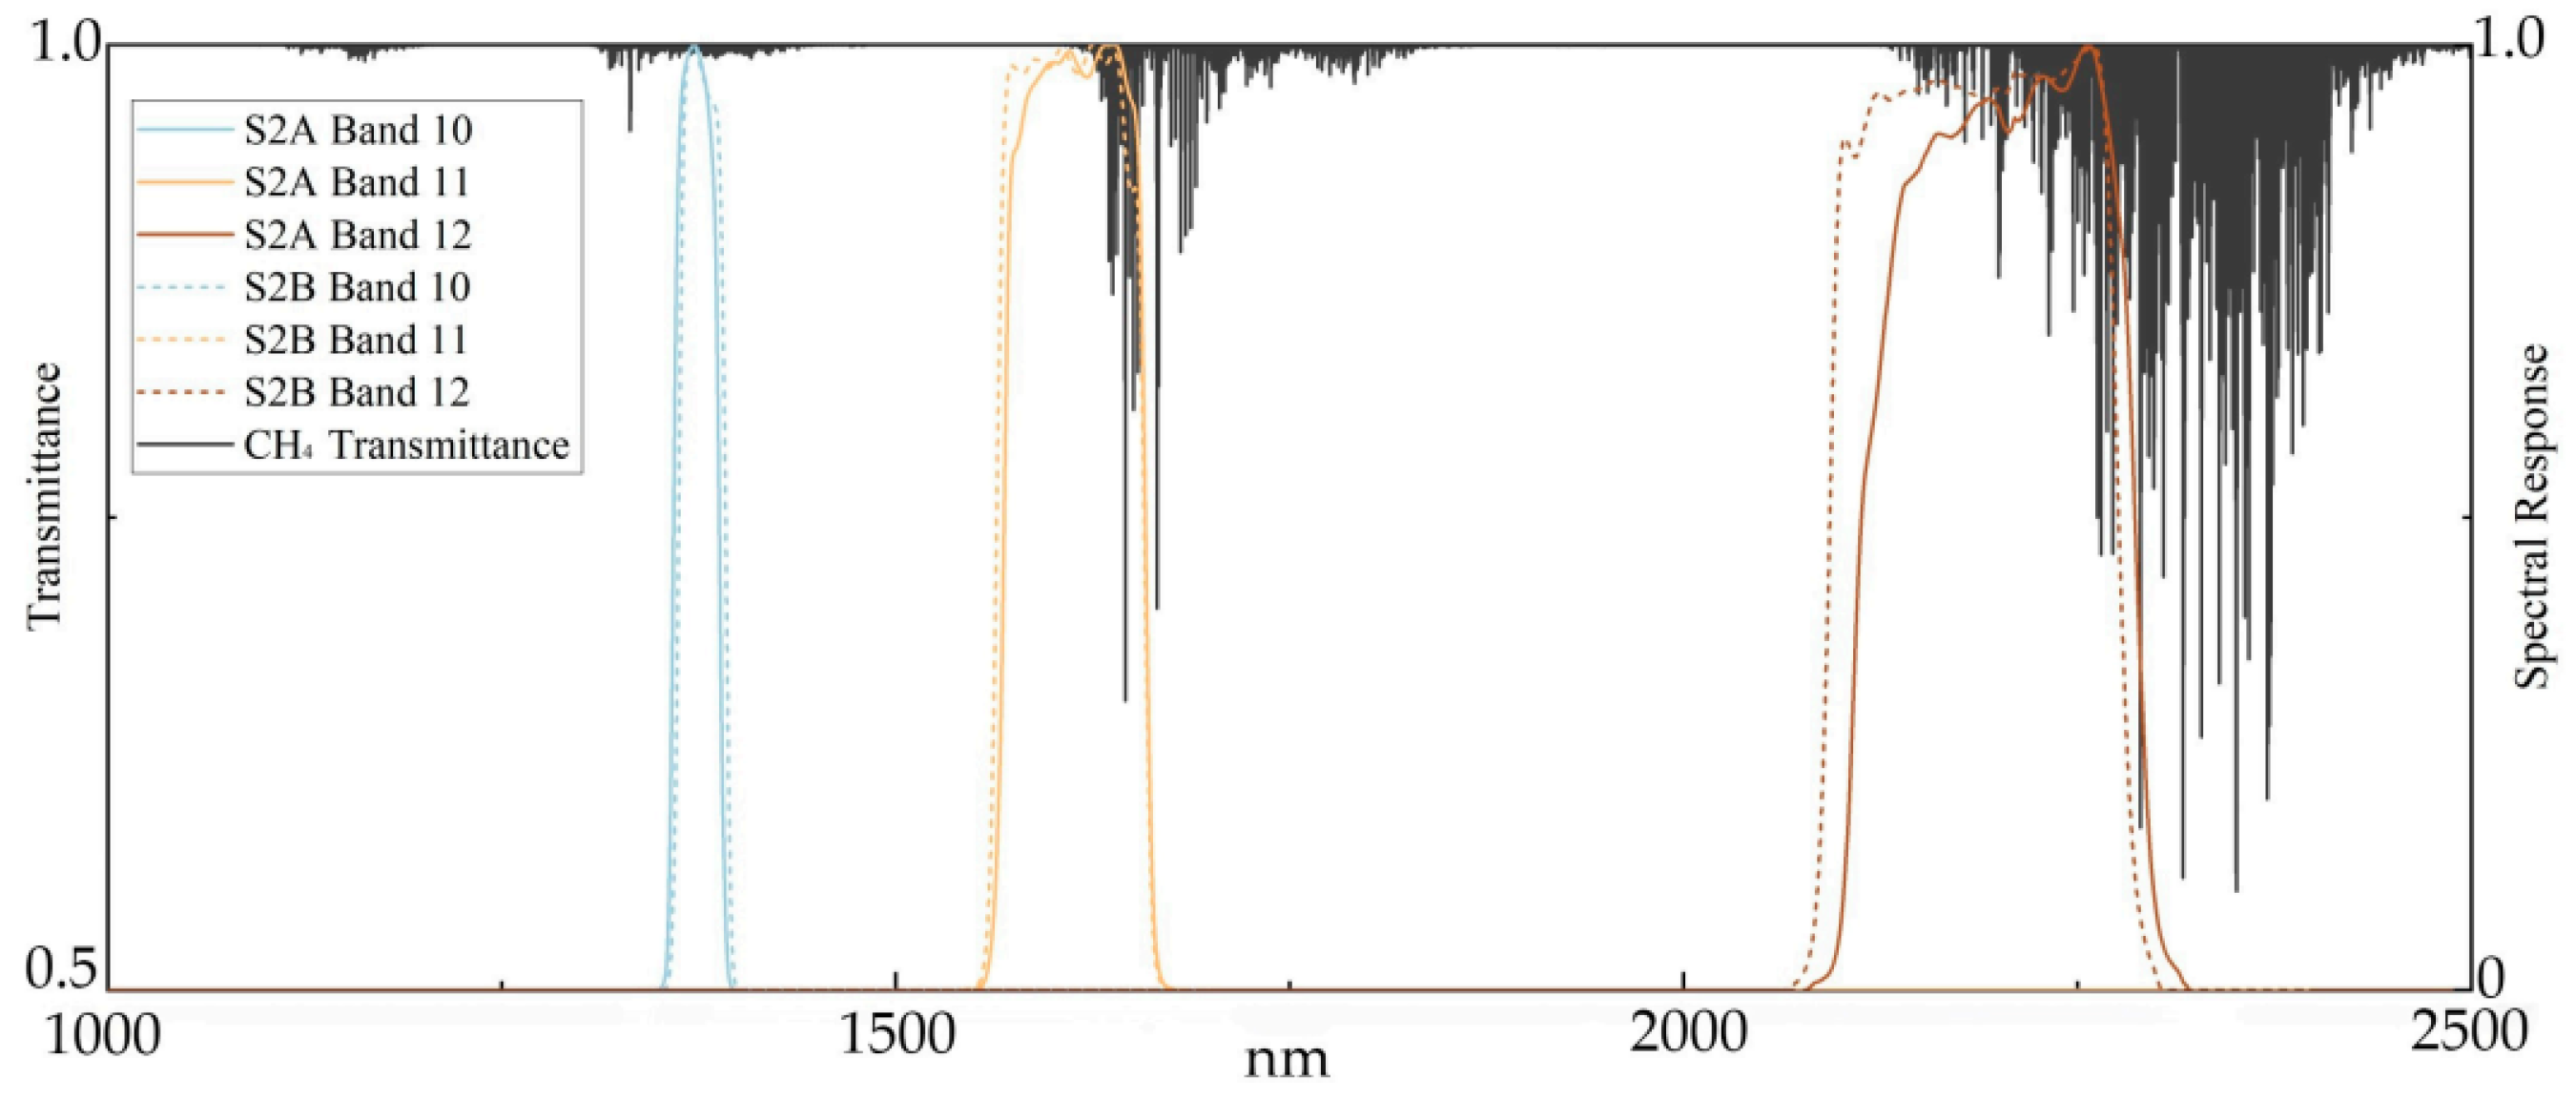
3.2.4. Calibration Information of Spectral Data

The conversion from raw data (such as Digital Numbers, DNs) to methane concentration in [ppm] mainly involves four steps. First is the radiometric calibration: converting DN values to radiance. Next is the atmospheric correction: removing atmospheric effects from the remote sensing data to obtain the surface reflectance. The third step is spectral analysis: analyzing the changes in reflectance in specific bands to invert the methane column concentration. Finally, there is the unit conversion: converting the inverted methane column concentration to the volume mixing ratio (ppm).

The Conversion from DN Values to Radiance

DN values are the raw digital signals recorded by the sensor, usually being dimensionless integers. Radiance is the radiant power per unit area per unit solid angle, typically measured in units of W/m2/sr. The conversion formula is as shown in Equation (7):
  L = G × D N + B
In the formula, L represents the radiance, G represents the gain, and B represents the bias. These parameters are typically obtained through laboratory calibration and in-orbit calibration.

Atmospheric Correction

Atmospheric correction is the process of removing the atmospheric effects from remote sensing data to obtain the surface reflectance or atmospheric constituent concentrations. This step is usually performed using an atmospheric radiative transfer model, such as MODTRAN. The formula for calculating reflectance is as shown in Equation (8):
ρ = L L p a t h E s u n × cos θ
In the equation, ρ represents the surface reflectance, L p a t h represents the atmospheric path radiance, E s u n represents the solar irradiance, and θ represents the solar zenith angle.

Spectral Analysis

Methane has strong absorption features in certain specific spectral bands (1600 nm and 2300 nm). By analyzing the changes in reflectance in these bands, the methane concentration can be inverted. The inversion formula is as follows:
X C H 4 = S T C S T S
In the formula, S represents the preset methane spectral signature, and C represents the observed spectrum.

Unit Conversion

Methane concentration is typically expressed as a volume mixing ratio (ppm), which represents the number of methane molecules per million air molecules. The unit conversion is as follows:
C H 4   c o n c e n t r a t i o n   p p m = X C H 4 a i r   c o l u m n   d e n s i t y
Here, X C H 4   is the inverted methane column concentration, and air column density refers to the density of the air column. From this, a methane plume map in units of ppm can be obtained.

4. Results

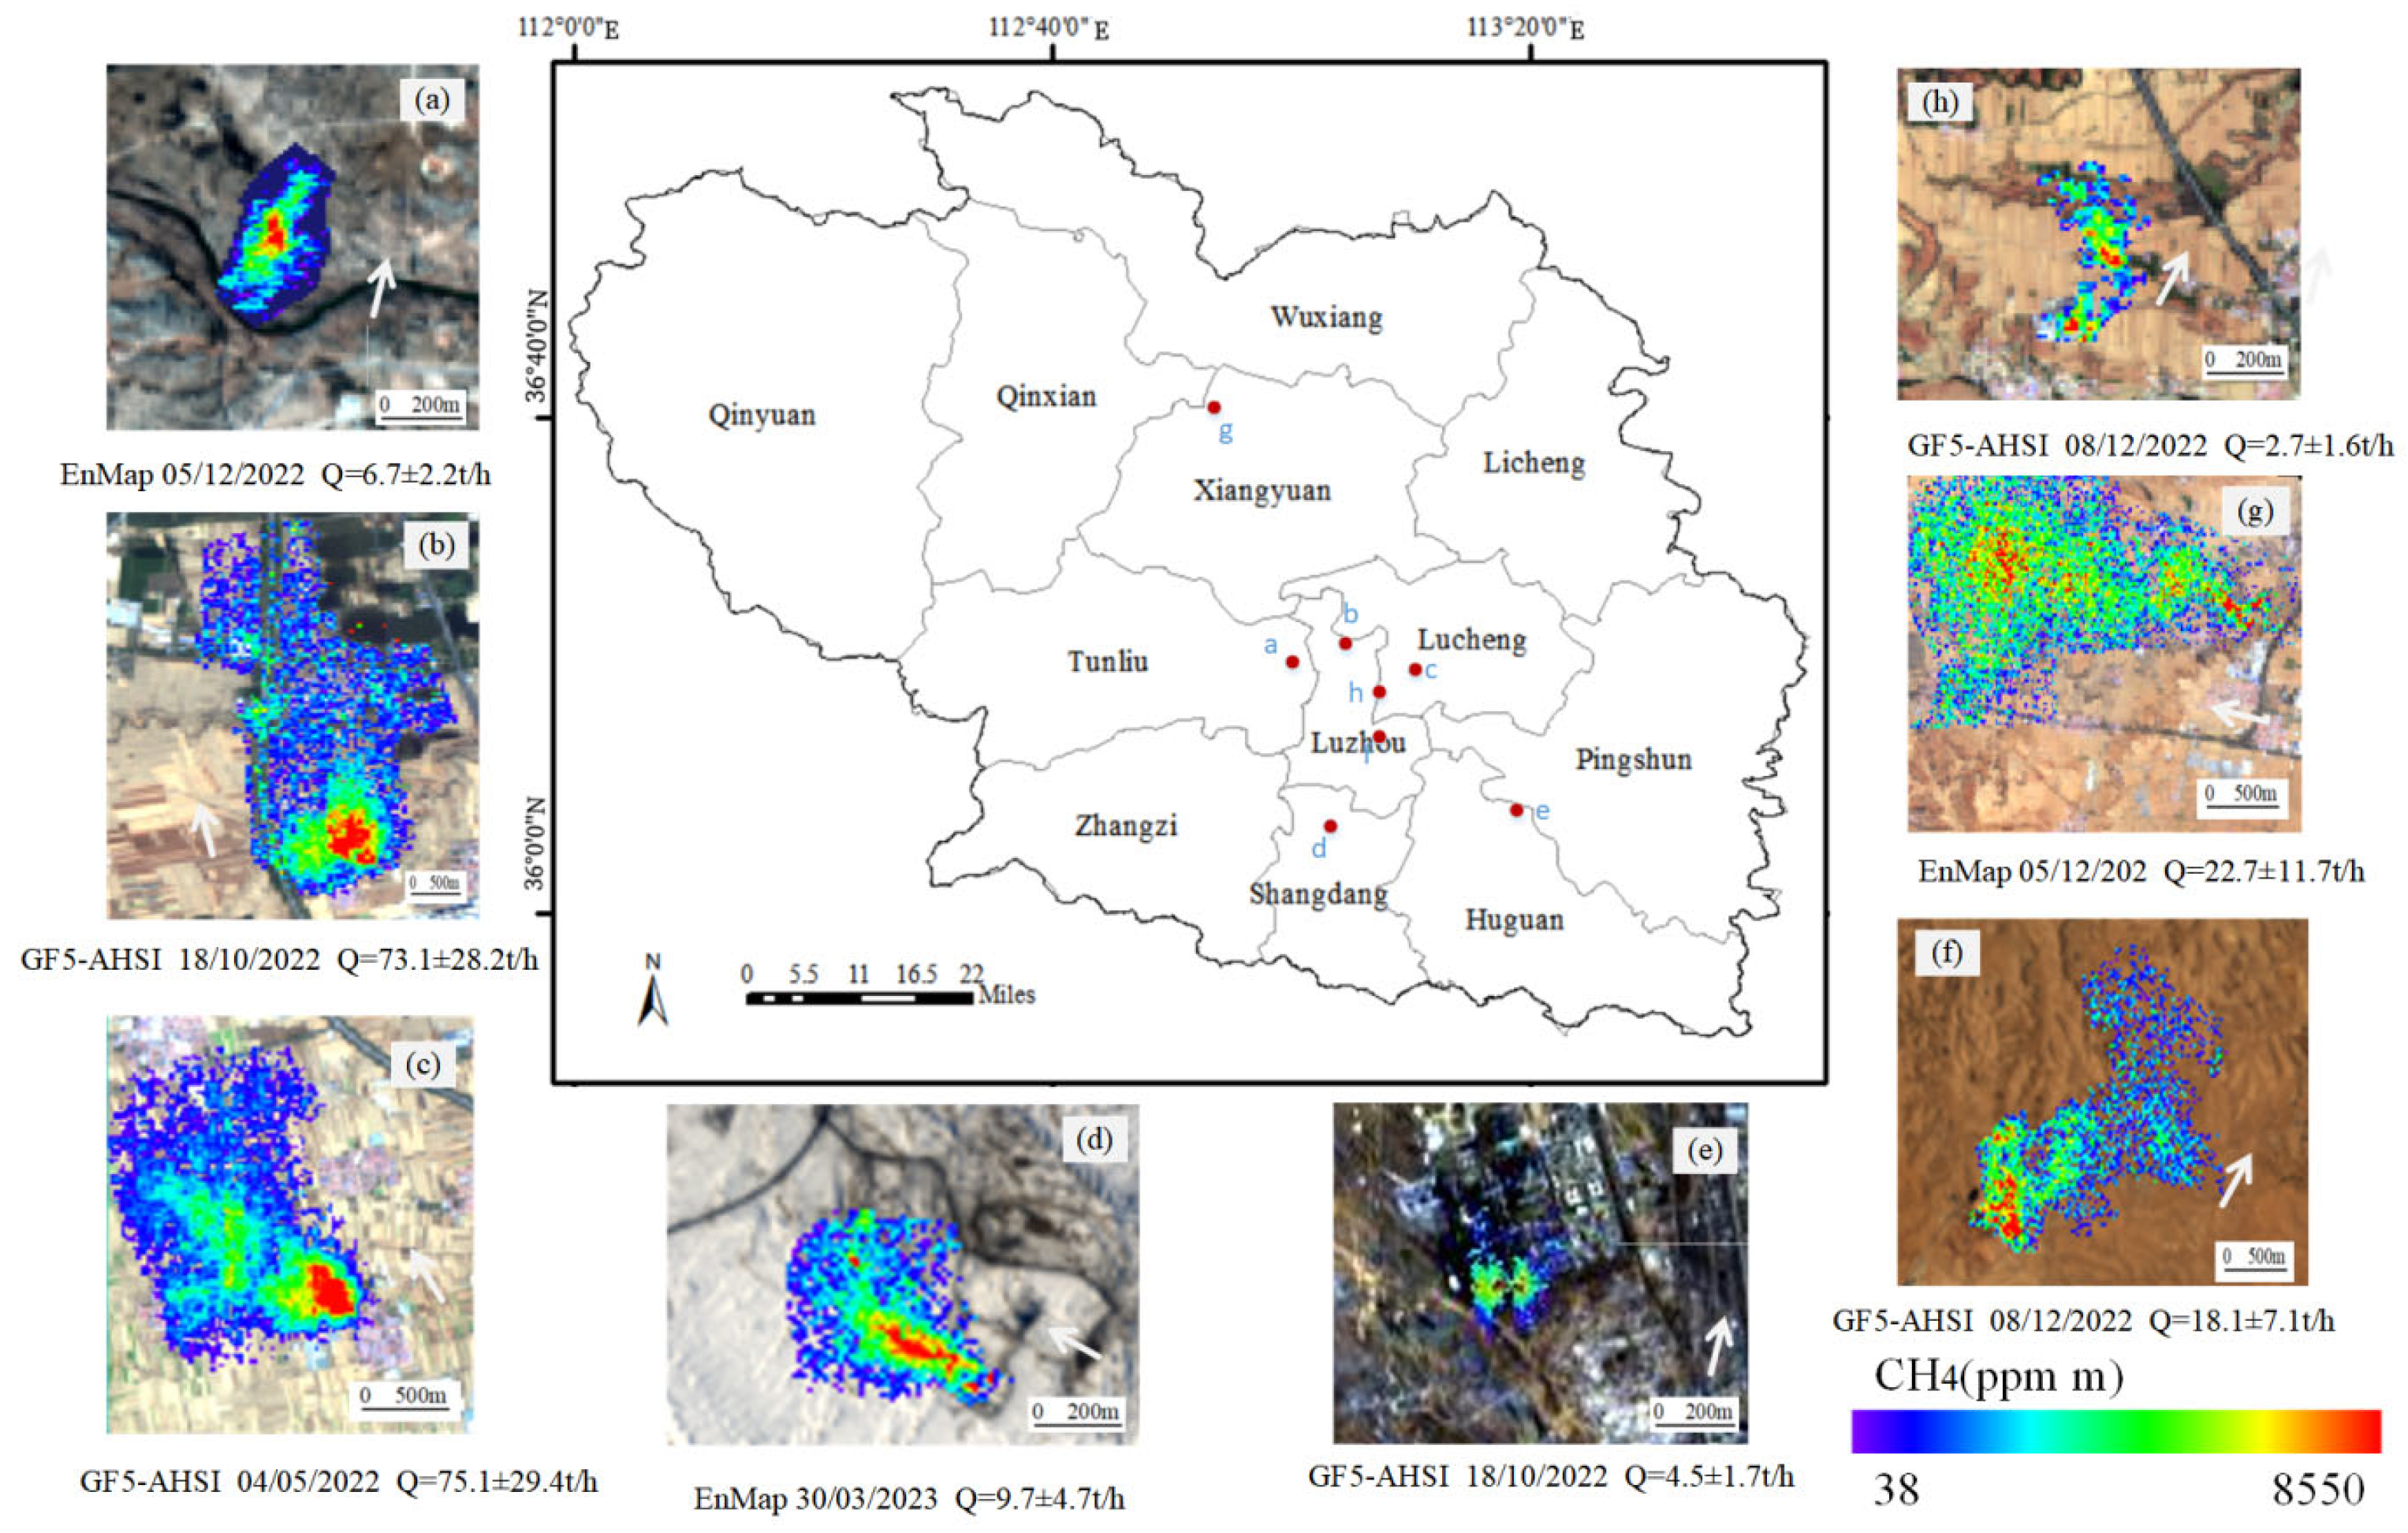
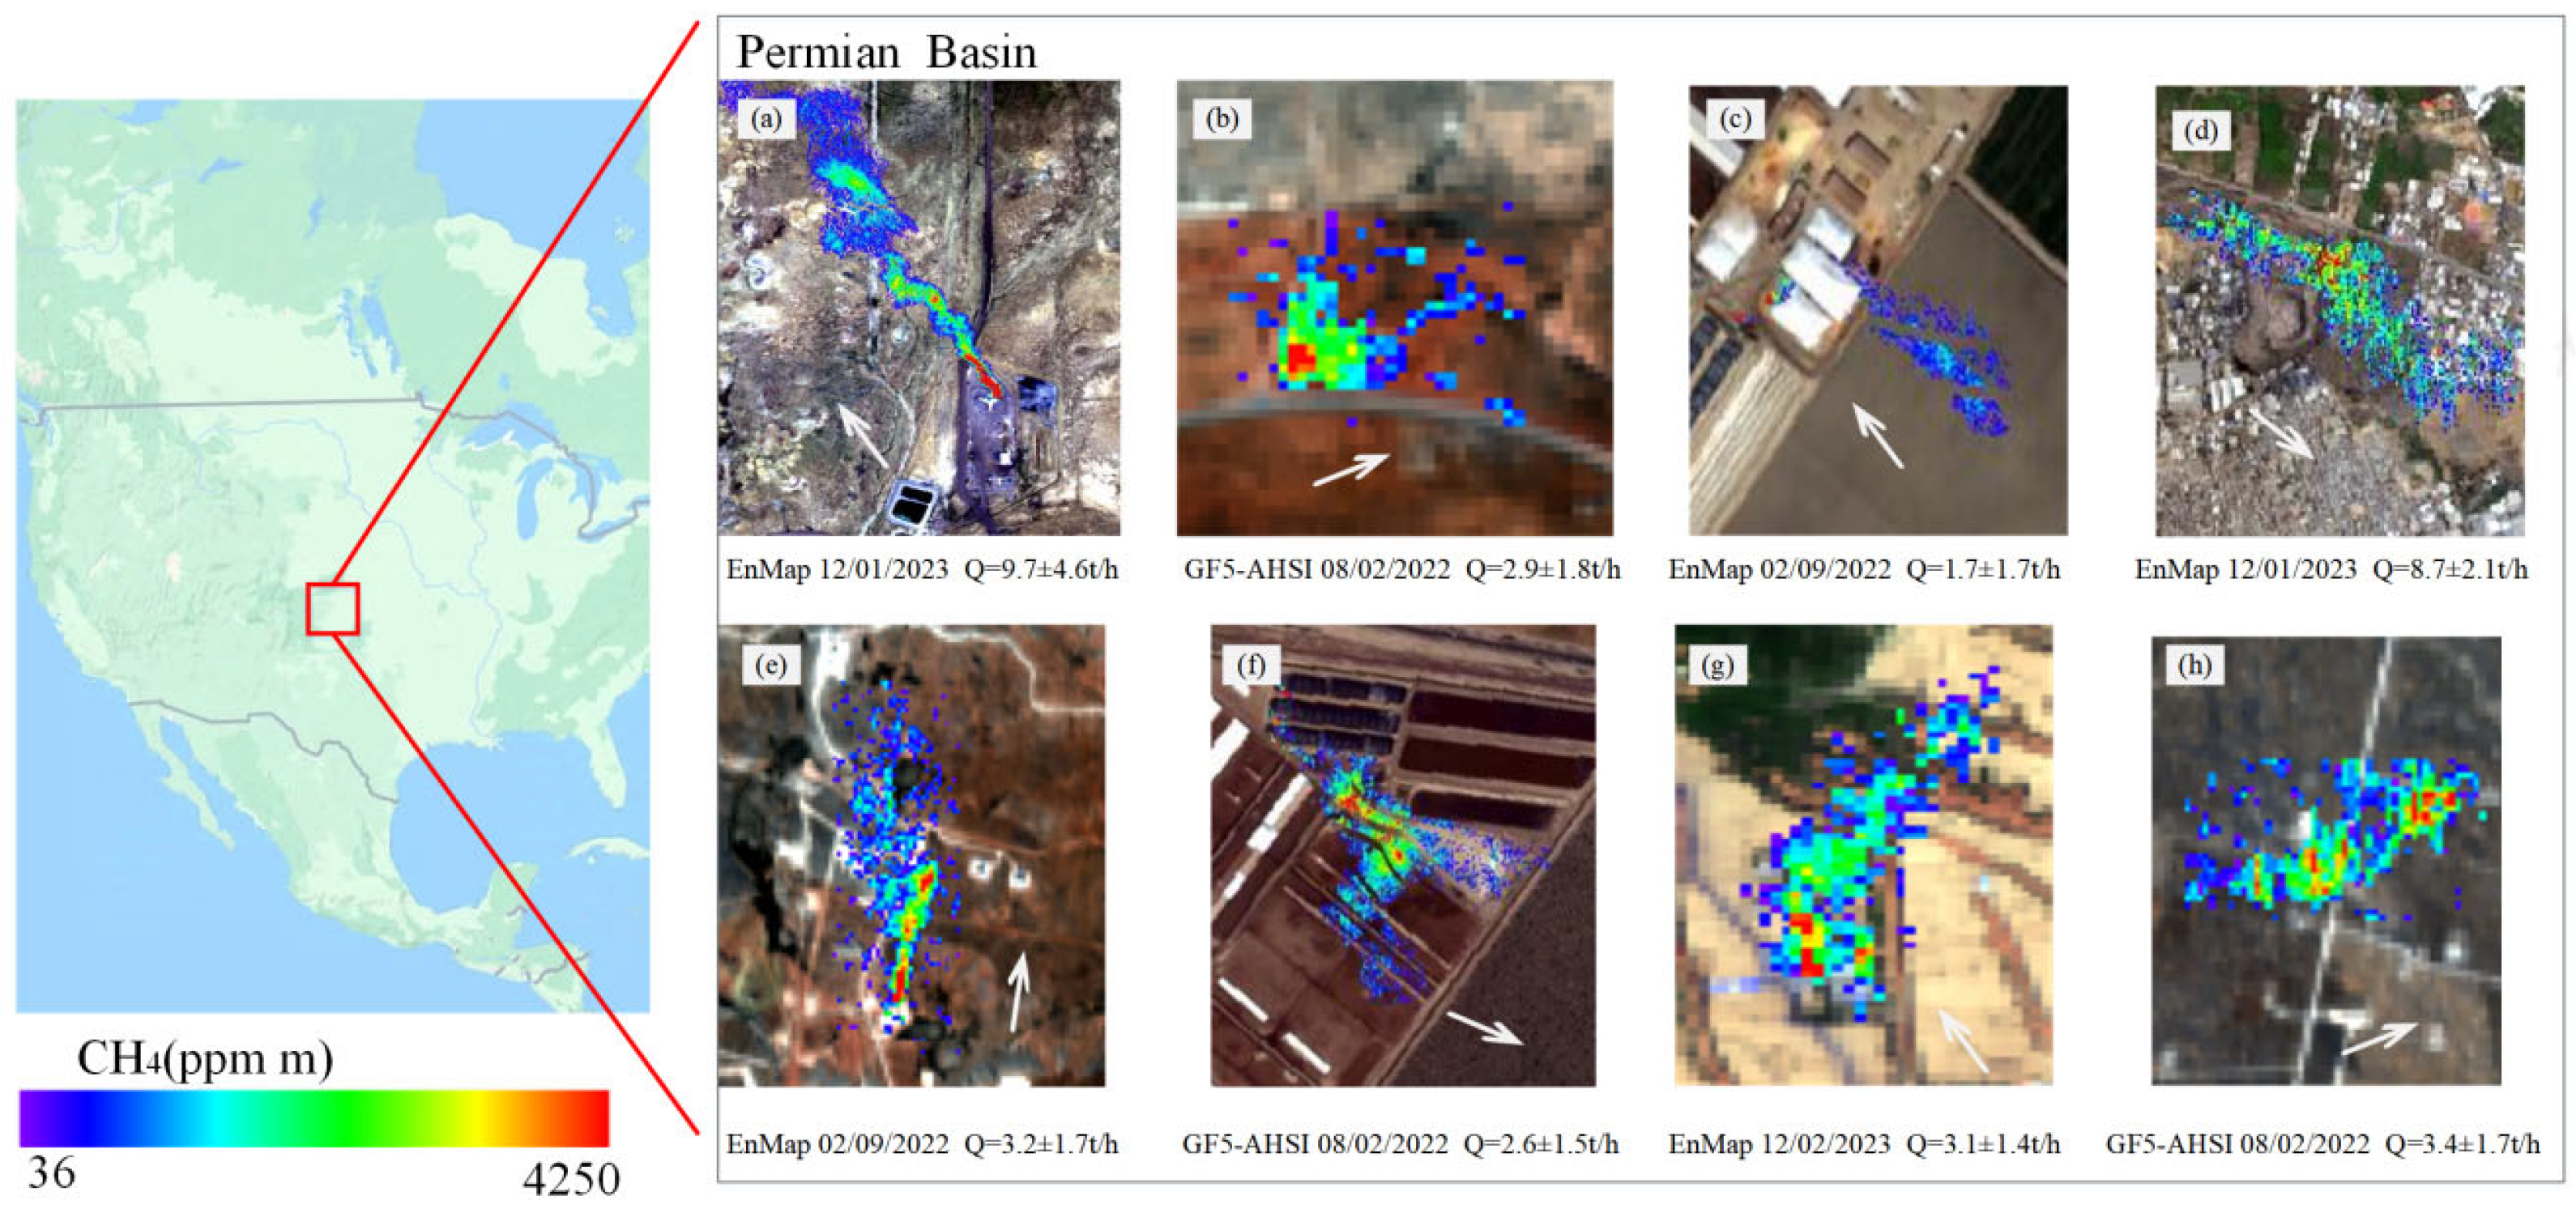
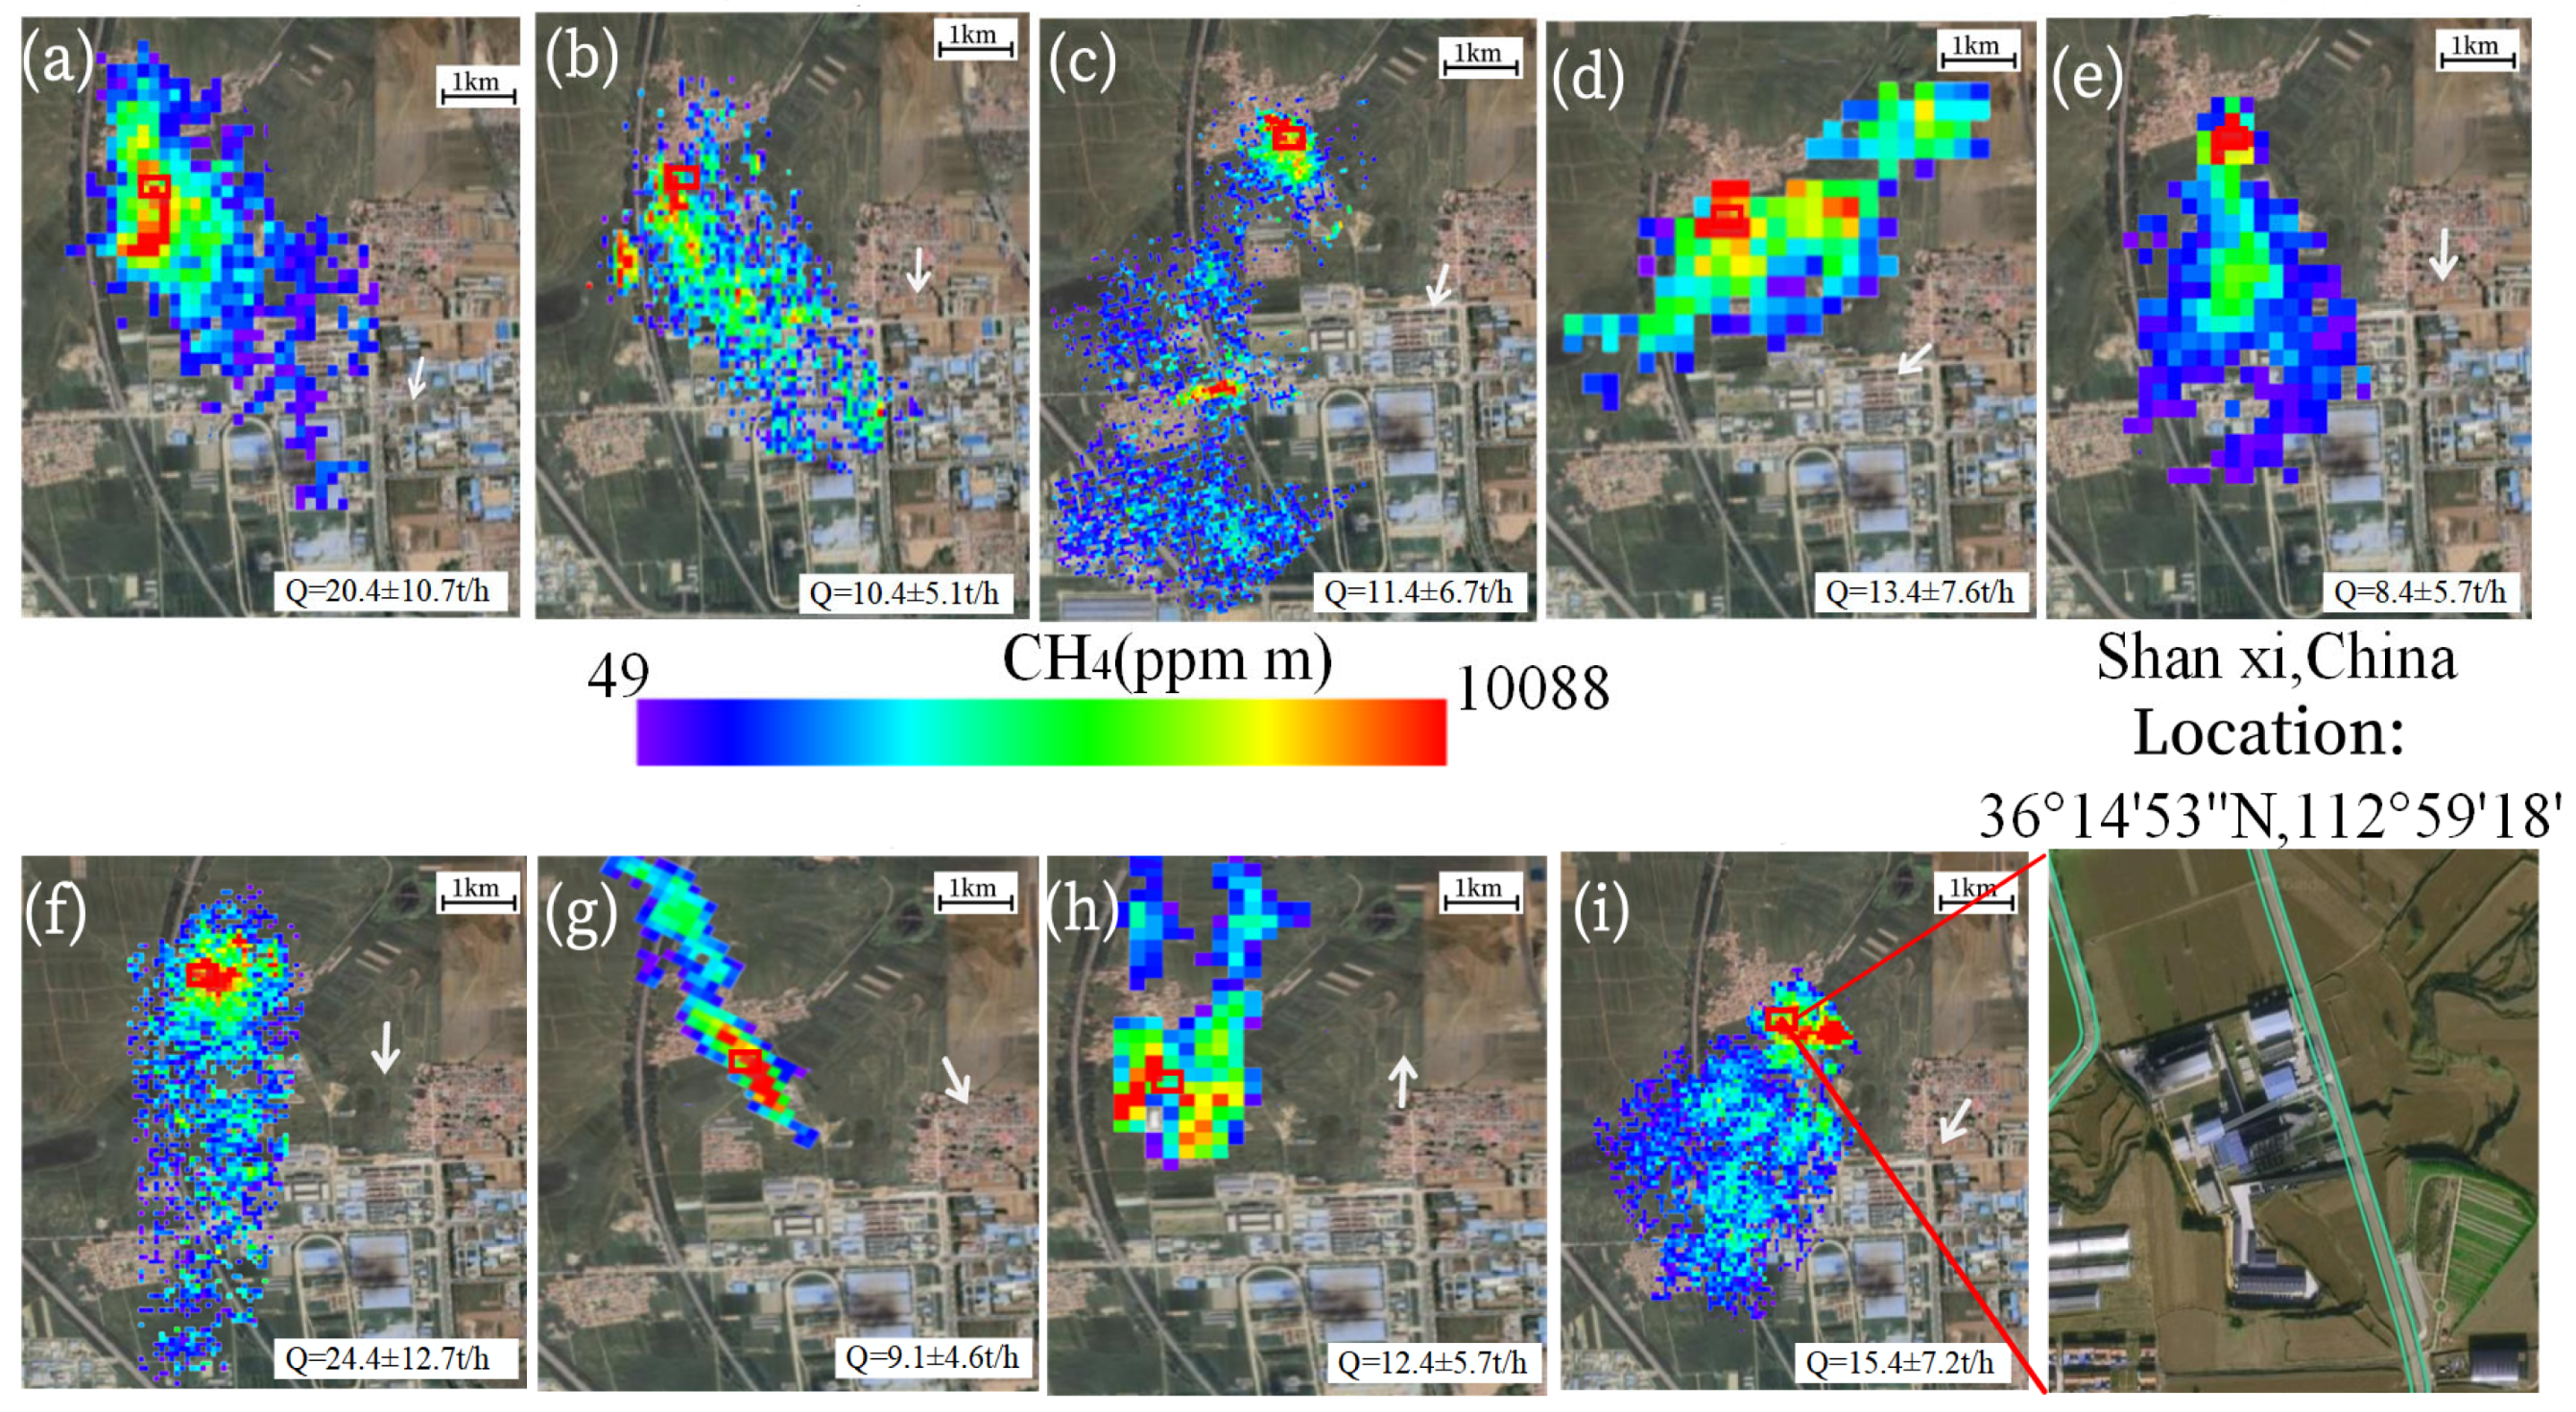
4.1. Identification of Typical Methane Emission Hotspots in China and the United States

China leads the world in anthropogenic methane emissions and is the largest contributor to emissions from the energy sector [42,43]. As the top coal-producing country globally, China’s coal production accounted for 50.7% of the world’s total coal output in 2020 [44]. Studies indicate that China’s methane emissions increased by 1.1 ± 0.4 million tons annually from 2010 to 2015, largely due to coal mining activities [45]. Changzhi, one of China’s top ten coal cities, experiences significant methane leaks during underground mining and in post-mining activities where gas is harnessed for power generation. Wang et al. [32] found that methane emissions from underground mining in Changzhi, Shanxi, constituted over 95% of the region’s total emissions. In major fossil fuel extraction areas, there may be thousands of such emission points.
The United States is the world’s largest producer of oil and natural gas and has consistently been the fourth-largest emitter of methane globally since 2010, with 30% of its annual emissions originating from the oil and gas sector, particularly from shale gas extraction. In 2019, its oil and gas production accounted for 14.7% and 23.4% of the global total, respectively [46]. Alvarez et al. [47] found that methane leaks from the U.S. oil and gas supply chain in 2015 were as high as 13 million tons, 78% more than the U.S. Environmental Protection Agency’s (EPA) estimates for that year, representing a significant portion of the global oil and gas production sector’s methane emissions from 2008 to 2017 (68 to 92 million tons). Crucially, methane emissions from the U.S. oil and gas industry have been increasing year by year. The Permian Basin, located in New Mexico and Texas, is currently the largest oil and gas producing region in the U.S., with rapid growth in oil and gas production over the past decade. Methane leaks during the processes of extraction, gathering, transmission, storage, and supply in this basin are substantial. A recent study by Zhang et al. [48] combining satellite observations from the TROPOMI on the Sentinel-5P satellite with atmospheric modeling methods revealed that the Permian Basin’s methane emissions amount to 2.7 ± 0.5 Tg CH4 a-1. This figure is the largest reported methane flux from any oil and gas producing region in the U.S. to date, and is more than double the bottom-up estimates for the Permian Basin and four times higher than estimates from any other U.S. oil and gas basins. Consequently, detecting and repairing methane point source leaks in fossil fuel production activities is seen as a vital strategy for reducing greenhouse gas concentrations in the atmosphere [49]. Elucidating the dynamics of methane point source emissions from coal mines and the oil and gas production sectors in key regions is essential for bridging the gap between bottom-up and top-down methane emission estimates and for understanding how the energy sector contributes to the rapid increase in atmospheric methane concentrations.
In this study, leveraging the rapid advancements in spatial imaging spectroscopy and data processing techniques, we conducted the first large-scale, high-resolution survey of methane point sources using satellite-based observations. The areas under investigation were the Changzhi region in Shanxi, China, and the Delaware sub-basin within the Permian Basin in the United States. Our dataset was acquired from two satellite missions: China’s Gaofen-5 (GF5-02) equipped with the Advanced Hyperspectral Imager (AHSI) [23], and the imaging spectrometer aboard Germany’s Environmental Mapping and Analysis Program (EnMAP) [26]. We covered an area of approximately 150 by 200 km in the Shanxi Changzhi area and a similar expanse in the Delaware sub-basin of the Permian Basin, capturing a total of 20 images on various dates, primarily including 5 December 2022, 18 October 2022, 4 May 2022, and 30 March 2023, as detailed in Table 1. We employed the Integrated Methane Enhancement (IME) approach to calculate the emission rates of each plume. Given the relatively small instantaneous methane plumes detected from individual point sources, many do not conform to Gaussian behavior, leading to potential significant errors in flux rate inversion using Gaussian plume modeling. The IME method links the total plume mass to the point source emission rate [39], relying on the effective wind speed and characteristic size of the plume, which results in lower errors. With a spatial sampling of 30 m, our survey enabled the mapping of individual methane plumes and the attributing of emissions to specific infrastructure. Our primary objective was to identify, characterize, and quantify the largest point source emissions in these regions, with the overarching goal of aiding future emission reduction efforts.
We successfully detected eight methane emission points in Changzhi, Shanxi, China, and the Permian Basin in the United States, each with an emission rate exceeding 500 kg/h. Guanter et al. [50] estimated the methane point source emission rates in the Changzhi region of Shanxi, China, using the Italian PRISMA hyperspectral imager, to be between 7.7 t/h and 35.5 t/h. For the Permian Basin in the United States, they estimated the methane point source emission rates from oil and natural gas sources to be between 1.7 t/h and 2.8 t/h. Figure 4 illustrates the locations and intensities of the methane plumes detected in Changzhi, Shanxi, after processing the satellite imaging spectroscopy data. On 18 October 2022, the GF5-02-AHSI instrument captured two anomalous methane emission points in Qinyuan County, Changzhi City, as shown in Figure 4e,h. These points were located near the Changxin Coal Mine in Majunyu and the Anda Coal Mine operated by the Tongzhou Group in Shanxi. Analysis of Google Earth imagery and GaoFen-2 satellite images indicated that the detected methane leaks were from gas power plants near these coal mines. The emission rates from these two points were as high as 4.5 ± 2.0 t/h and 2.7 ± 1.2 t/h, comparable to the emissions detected by Sánchez-García et al. [51] from underground mines in Tunliu District, Changzhi, using PRISMA and WorldView-3 satellites.
After processing the satellite imaging spectroscopy dataset, the locations and intensities of the methane plumes detected in the Texas sub-basin of the Permian Basin are shown in Figure 5. The point sources’ emission rates (Q) typically ranged between 1700 kg/h (which we assumed as our detection limit and defined as “extreme emissions”) and 9700 kg/h. This was basically consistent with the research of Frankenberg et al. [8]. They monitored methane emissions in the Permian Basin of the United States using airborne measurements (AVIRIS-NG) and satellite data (TROPOMI). The emission rates were found to be between 2 t/h and 7 t/h. Most plumes were situated in an area spanning from 31.0° to 32.5° N latitude and 103.3° to 104.2° W longitude. This corresponded with the region of highest methane fluxes identified by Zhang et al. in [49] through top-down estimations, indicating a match between our detected emissions and previously reported high-flux areas, but was less well aligned with the bottom-up emission inventory based on the U.S. EPA greenhouse gas inventory updated to account for 2018 infrastructure using well-level information from Enverus DrillingInfo. Enverus DrillingInfo is a leading global platform for energy industry data and analytics [52]. Surrounding the main panel of Figure 5 are subplots illustrating individual examples of methane plumes (for detailed information on plume locations, intensities, and types of emitting facilities, please refer to Table 1). The methane point sources detected in this study represented snapshots of methane plumes with emission intensities exceeding 500 kg/h at the time of satellite overpass, exhibiting a degree of transience due to the intermittent nature of point source emissions from fossil fuel extraction activities. There was considerable variability in both emission rates and source types. For instance, plume b originated from an oil and gas facility with an emission rate of 2.9 ± 1.8 t/h; plume c was from a facility with a lower emission rate; plume e from an oil and gas facility with an emission rate of Q = 3.2 ± 1.7 t/h; while plume f, from a shale gas well, had an emission rate of Q = 2.6 ± 1.5 t/h. Roger et al. [36] quantified the methane point source emission rate here as 2.7 t/h using the German EnMAP hyperspectral imager. Plume d corresponded to a significant emission from an area lacking visible infrastructure elements (such as well pads and storage tanks) with Q = 8.7 ± 2.1 t/h, which is one of the larger methane leaks identified in this region to date. Plume h was a strong emission (Q = 3.4 ± 1.7 t/h), likely due to venting from a gas well, and plume g had an emission rate of 3.1 ± 1.4 t/h, and was from an oil and gas facility. Lastly, plume a was an exceptional case, corresponding to an unusually high emission from a compressor station (Q = 9.7 ± 4.6 t/h). We attributed this to a large transient release, possibly from one of the major natural gas gathering pipelines in the area. Within a few days of this event, at the same location as plume A, TROPOMI also observed a strong methane enhancement (as shown in Figure 6), but we could not ascertain what fraction of the enhancement was actually due to this particular emission.
Among the eight plumes detected in the Permian Basin, all exhibited emission rates exceeding 1000 kg/h. Irakulis detected 37 methane plume point sources in Texas within the Permian Basin, with emission rates ranging from 1 t/h to 7 t/h, based on satellite data from GF5-AHSI and PRISMA [25]. To our knowledge, the Delaware sub-basin within the Permian Basin holds the highest number of extreme point emitters observed in a single oil and gas producing region. For instance, the scale of emissions in the Permian is significantly greater than what was previously recorded in the Barnett Shale [42], where only 5 out of 17,400 well pads were found to emit over 300 kg/h. Furthermore, in a comprehensive campaign utilizing the AVIRIS-NG airborne imaging spectrometer, only 7 plumes with emission rates above 1000 kg/h were identified in the Four Corners gas-producing area out of a total of 250 plumes detected [44]. However, it should be noted that the area sampled by the airborne instruments in the Four Corners is smaller than the region covered by satellite imaging spectrometers in the Permian Basin (approximately 60 km × 50 km, compared to about 150 km × 200 km). This suggests that it is the total number of extreme emitters, rather than the spatial density of sources, that makes the Permian Basin such a notable case.
By examining the distribution of methane emission rates from coal mine point sources detected in Changzhi, Shanxi, and comparing them with the distribution of methane emissions from oil and gas facilities detected in the Permian Basin, we identified some differences in methane emission characteristics between coal mines and oil and gas facilities. The distribution of methane emissions from coal mines may exhibit a more right-skewed pattern, suggesting a lower frequency of extreme emission events. Methane emissions from coal mines might be more persistent in duration [53,54,55], yet the levels of extreme emissions could be lower compared to those from oil and gas facilities. This implies that coal mines are more likely to be detected emitting methane on multiple occasions, which could result in a higher average methane emission level compared to oil and gas facilities.
In our satellite dataset, we also observed multiple detections of plumes from the same methane sources. Notably, the Sanyuan Nan Yao Coal Mine in Changzhi, Shanxi, and the EOG Shale Gas Well in Eddy County, New Mexico, were both monitored by the GF5-02 satellite’s AHSI payload and EnMAP. However, given the limited revisit frequency of the target detection instruments for these two payloads, we utilized Sentinel-2 satellite data on the Google Earth Engine (GEE) platform for the long-term monitoring of these two sites. This approach allowed us to gain a more comprehensive understanding of the methane emission patterns at these locations, providing a scientific basis for the development of effective emission reduction measures. For a detailed discussion, refer to Section 4.2.

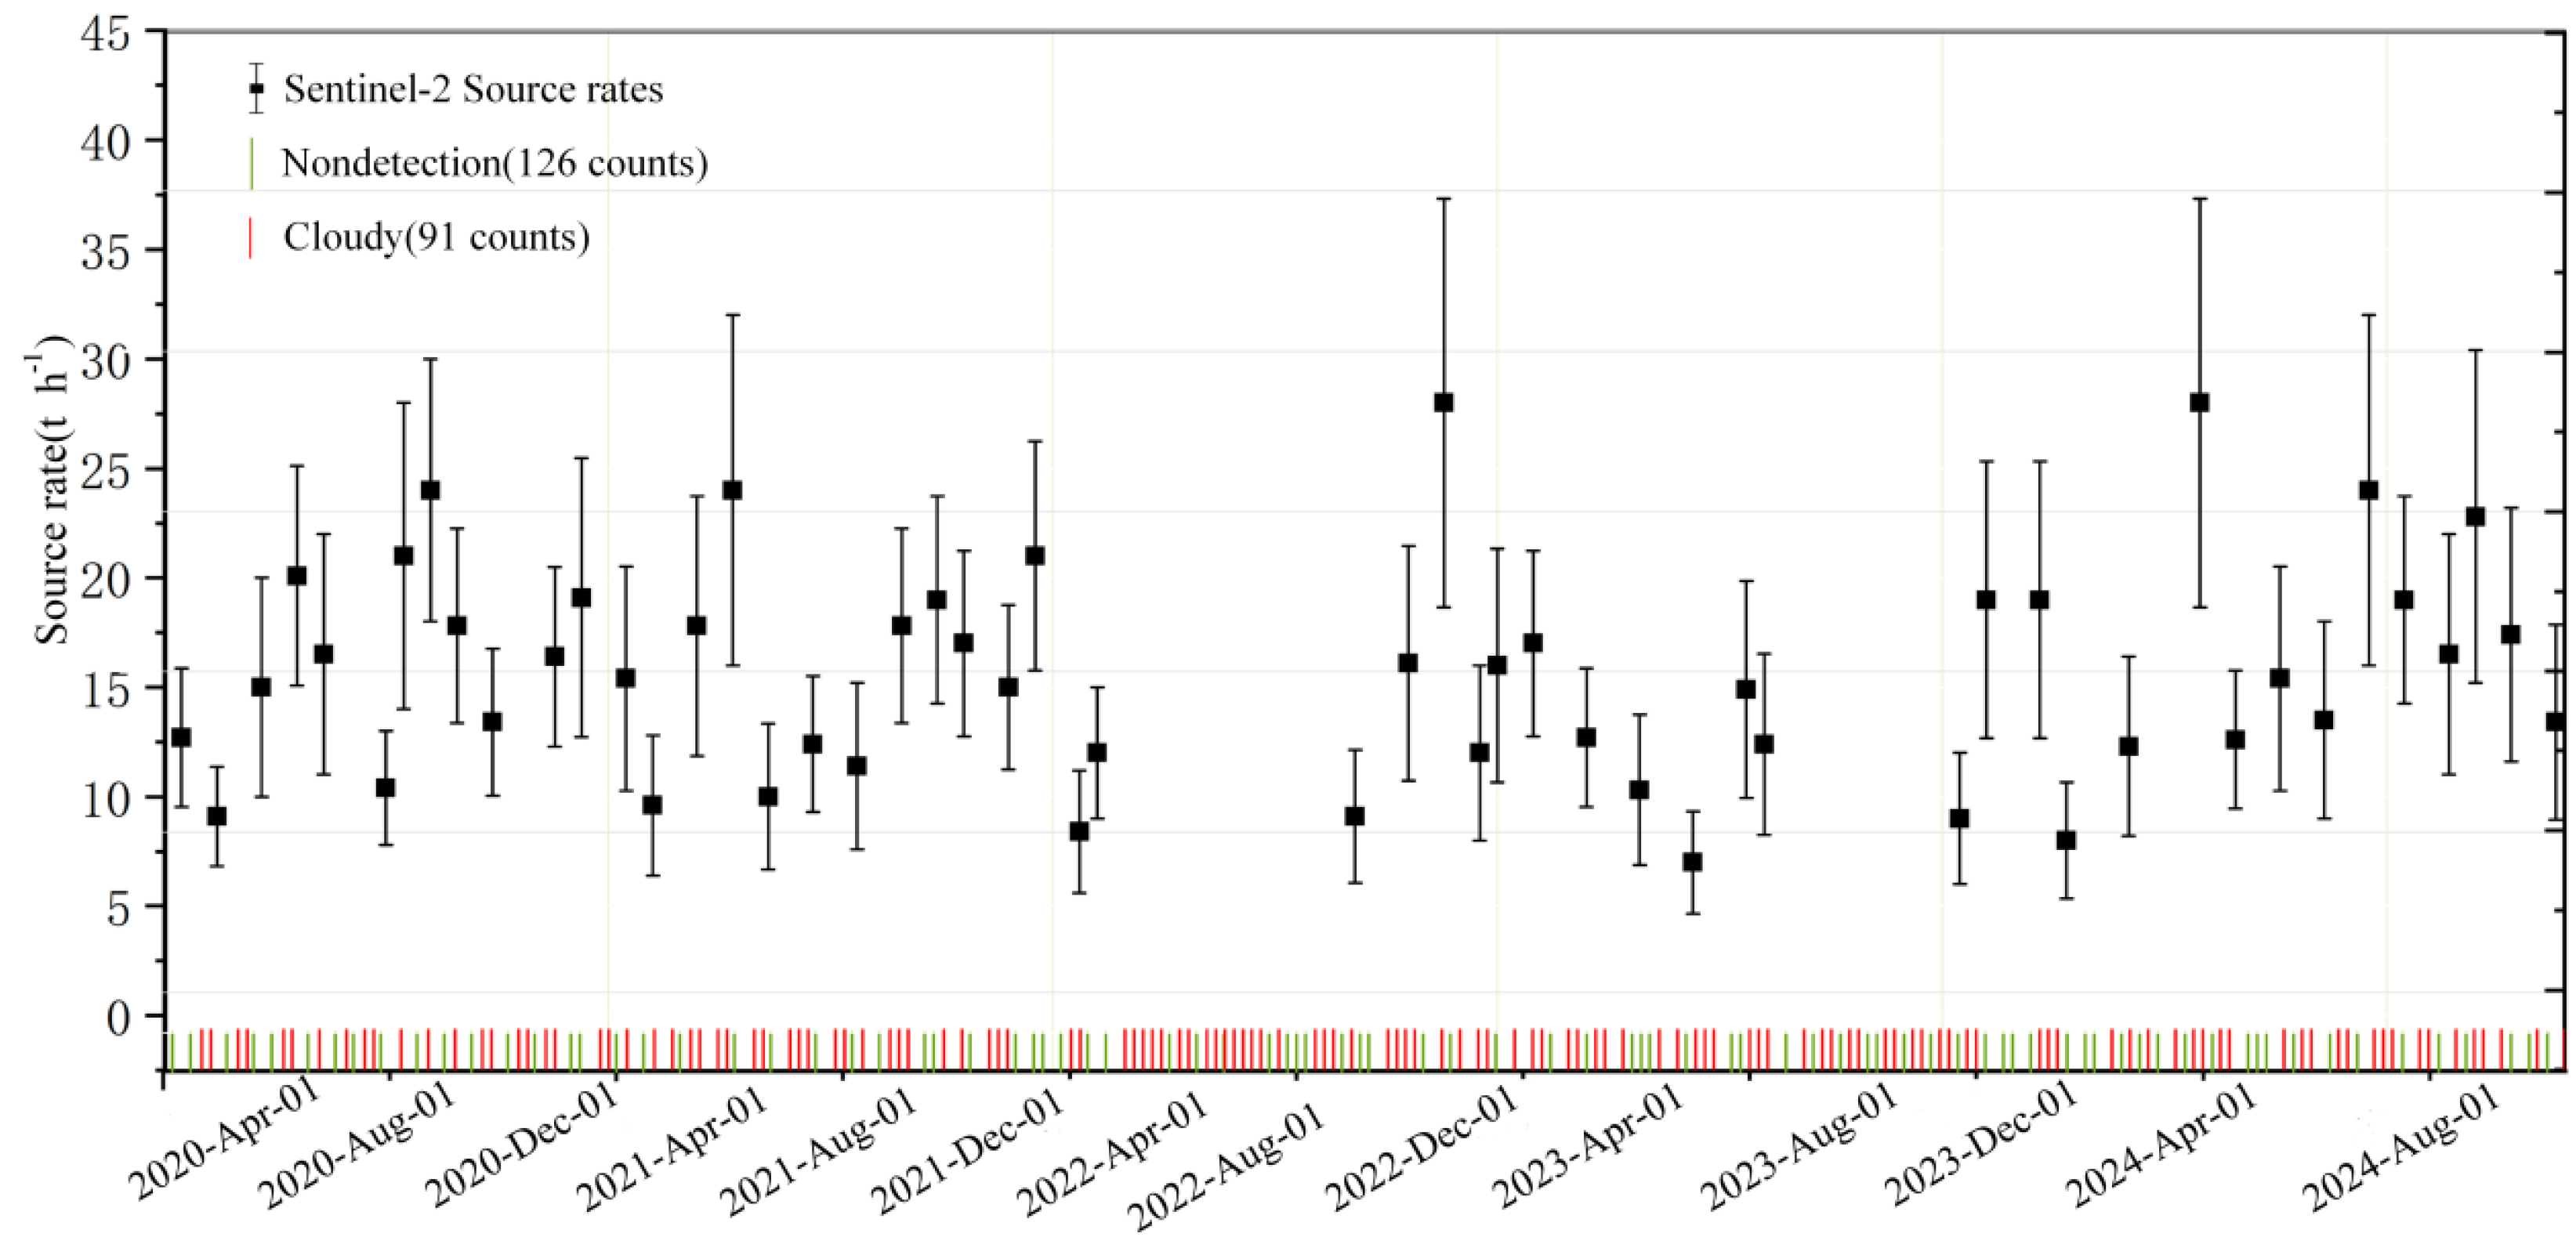
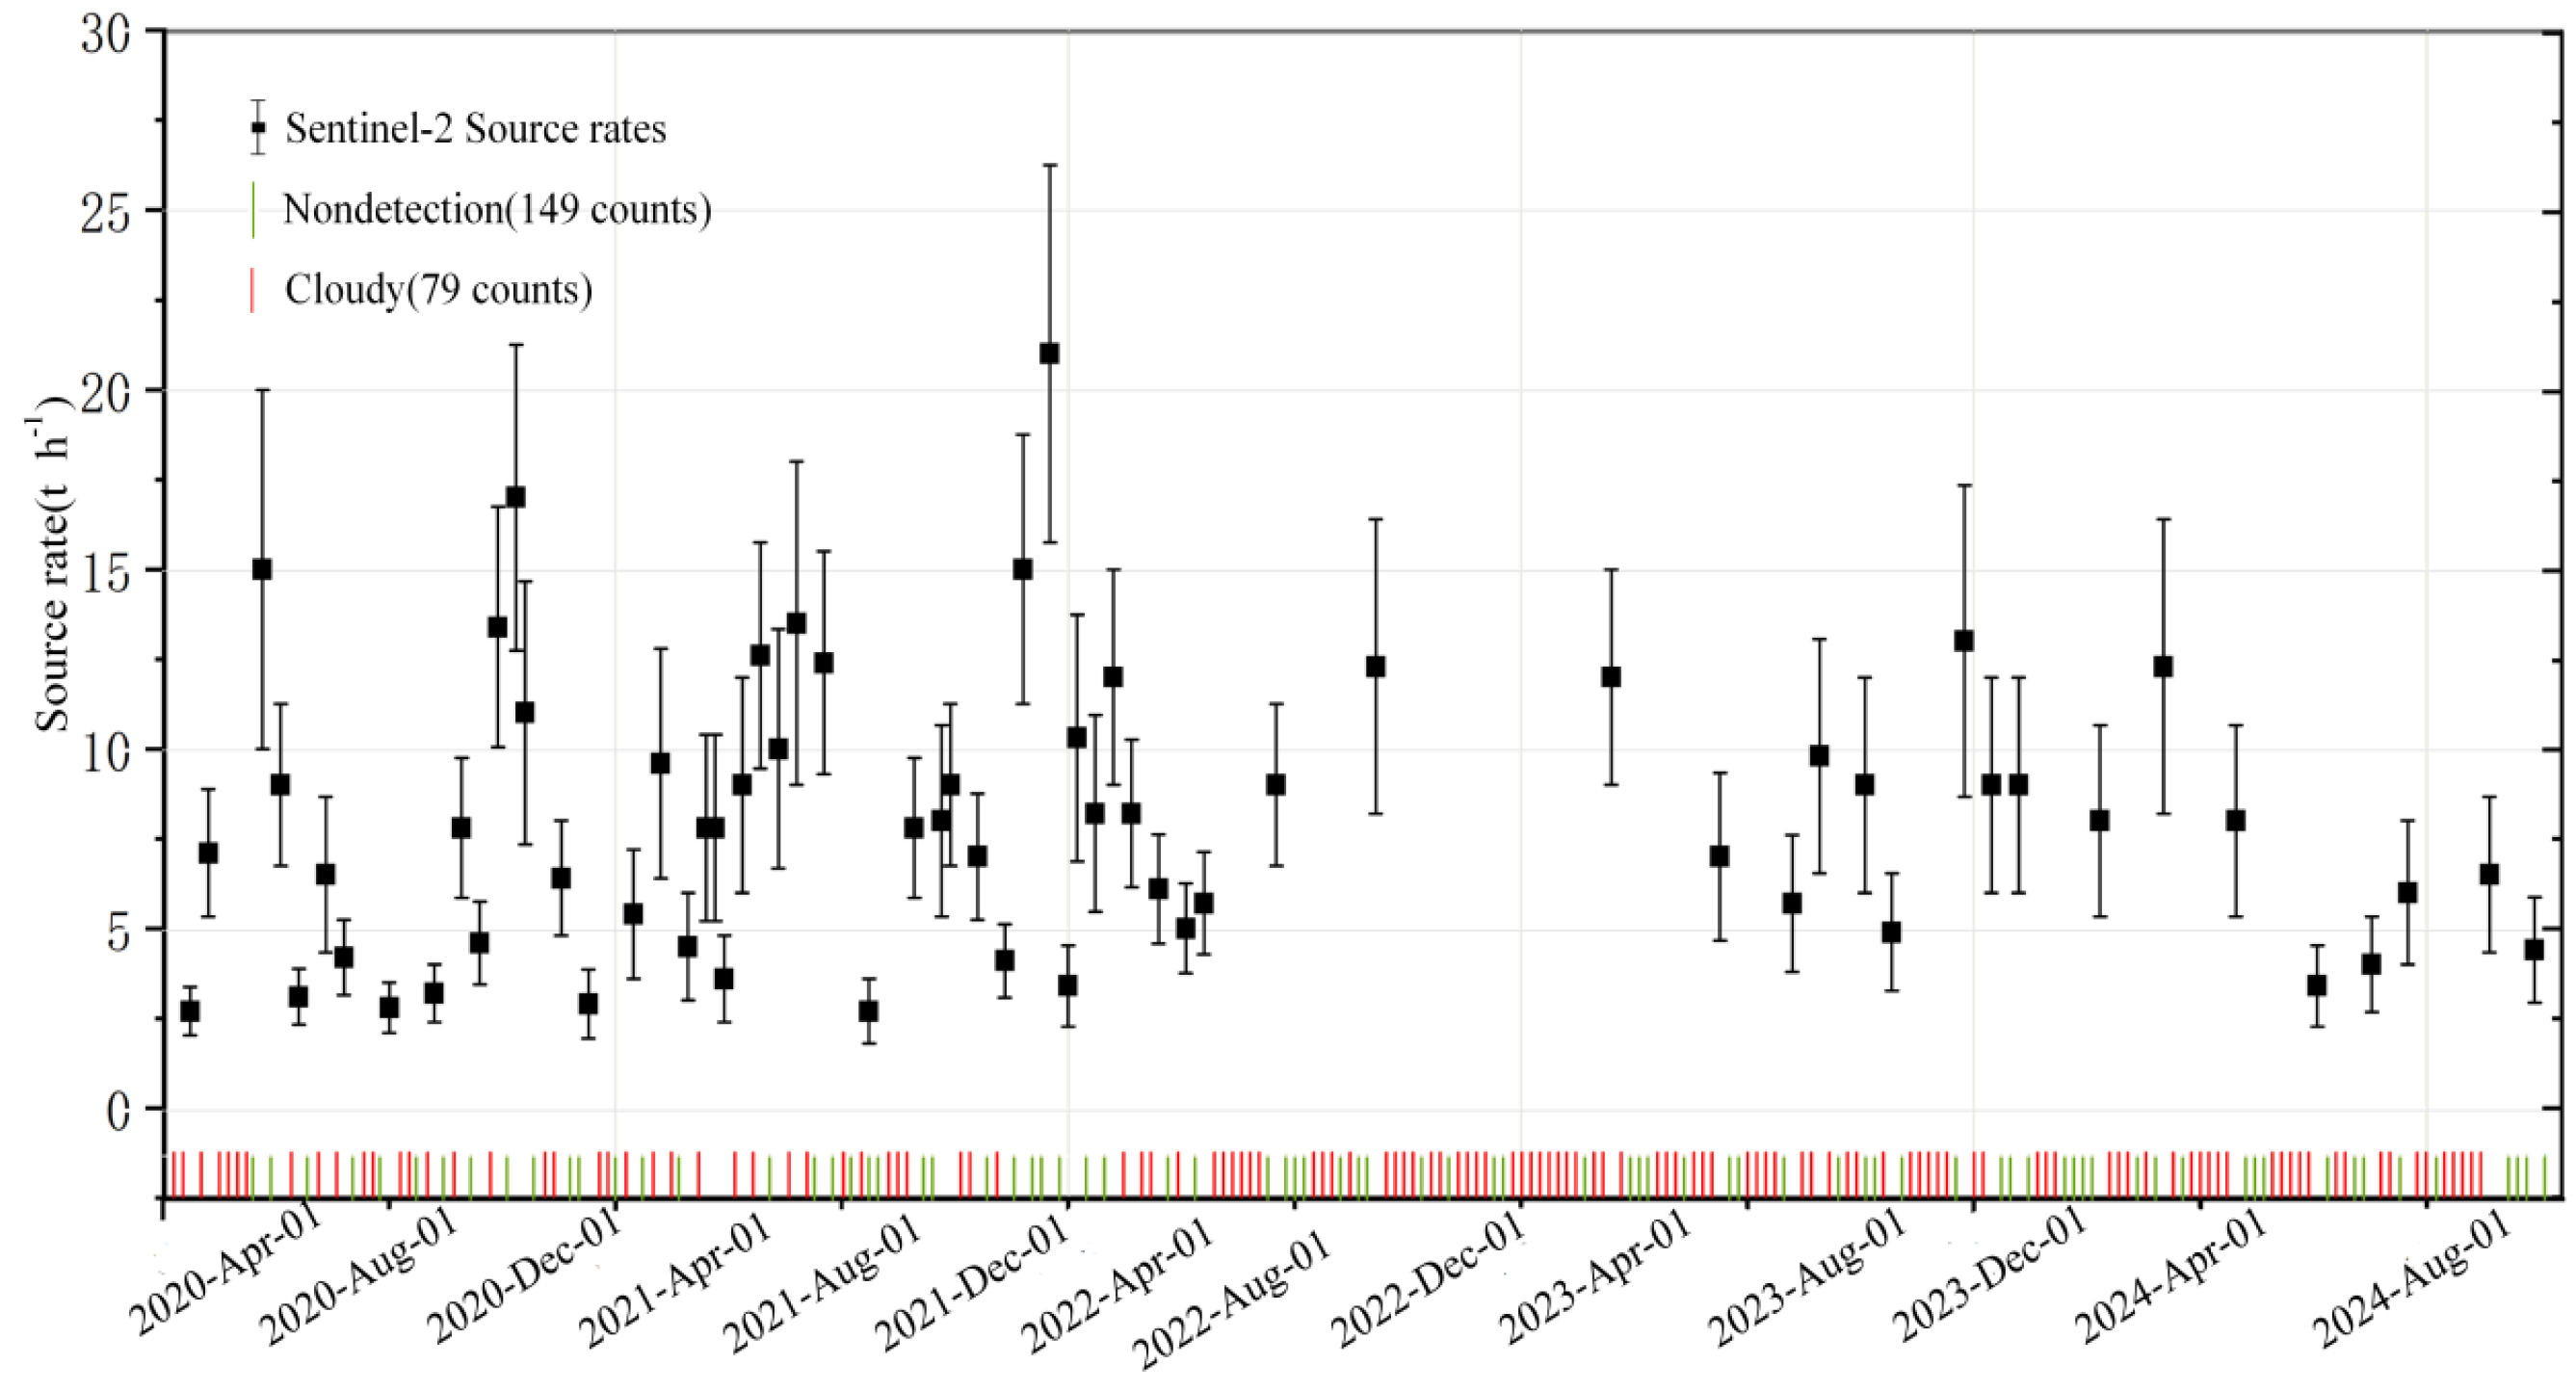
4.2. High-Frequency Monitoring of Methane Point Sources

In this section, we demonstrate the capability of the Sentinel-2 MultiSpectral Instrument (MSI), with its fine pixel resolution of 20 m and rapid revisit rate of 2–5 days, to detect and quantify significant methane point sources. We employ the multi-band multi-pass (MBMP) method, utilizing shortwave infrared (SWIR) measurements from MSI spectral bands 11 (approximately 1560–1660 nm) and 12 (approximately 2090–2290 nm) to identify methane plumes in the atmosphere. The MBMP approach combines data from two bands with a non-plume reference observation to retrieve methane columns. This method is capable of quantifying point source methane emissions up to approximately 3 t/h. We applied these techniques to the high-frequency monitoring of strong methane point source plumes from a coal facility in Shanxi, China (from January 2020 to August 2024), and a compressor station in an oil and gas field in the Permian Basin (from January 2020 to August 2024).

4.2.1. Sanyuan Nan Yao Coal Mine in Shanxi

The point source in Changzhi, Shanxi, is associated with a coal mining facility. We began observing emissions from this source in January 2020, while TROPOMI has detected plumes dating back to November 2017 [42]. The GF5-02-AHSI first identified emissions from this source on 18 October 2022.
The Sanyuan Nan Yao Coal Mine point source in Shanxi exhibited intermittent activity during Sentinel-2 observations from 1 January 2020 to 30 August 2024. Out of 271 satellite overflights, 52 plumes were detected: 91 were obscured by cloud cover, 126 showed no detectable plumes, and there were 2 instances of missing data. Consequently, the persistence rate for the Sanyuan Nan Yao Coal Mine point source, excluding cloud-covered observations, was 19%. Over the four-year measurement period, Sentinel-2 monitored the Sanyuan Nan Yao Coal Mine point source approximately every five days on average. For each satellite overflight with a detectable plume, methane was retrieved within a 1 × 1 km2 area centered on the point source. Figure 7 illustrates some of the methane plumes detected at the Sanyuan Nan Yao Coal Mine point source.
The time series of source rates for the Sanyuan Nan Yao Coal Mine in Shanxi, as shown in Figure 8, were derived from the MBMP method. Our detection of the Sanyuan Nan Yao Coal Mine’s emissions revealed that its emission intensity was more than double that of the EOG Shale Gas Well in Eddy County, with an average emission rate of 14.5 ± 7.2 t/h (ranging from 7.1 to 38.9 t/h), and it fluctuated throughout the 4-year observation period. Bai devised a novel interpolation algorithm based on high-resolution satellite observations (including Gaofen5-01A/02, Ziyuan-1 02D, PRISMA, GHGSat-C1 to C5, EnMAP, and EMIT) estimating the annual average coal mine methane emissions in Shanxi Province from 2019 to 2023 to be 8.9 ± 0.5 t/h [56]. From January 2022 to mid-February 2022, plumes were detected in 66% of cloud-free observations, after which emissions seemed to cease for three months due to the mine’s suspension for illegal overproduction. Emissions resumed in mid-May 2022, but at a lower persistence rate, with plumes detected in only 20% of cloud-free observations. In June 2023, we observed a temporary halt in emissions for nearly a month, likely due to flooding, geological disasters, and other calamities in Shanxi that led to the shutdown of 60 coal mines. The extended shutdown in 2022 reflected the facility operator’s intervention to control methane emissions during coal mining. The reduced frequency of plume detection in June 2023 illustrated how satellite observations can aid in methane emission reduction, while the resumption in May 2022 highlighted the importance of continuous monitoring. Using the 19% persistence rate from the entire record and assuming no daily variations, we estimated the total methane emissions from the mine from 1 January 2020 to 1 October 2024 to be 11.2 kilotons, or approximately 2.4 kilotons per year. This represents 1.1% of the 238.5 thousand tons (Tg) of national methane emissions reported by the Chinese government to the United Nations Framework Convention on Climate Change (UNFCCC) for the coal industry in 2023.
Our research indicates that the Sentinel-2 MultiSpectral Instrument (MSI), with its high pixel resolution (20 m) and quick revisit rate (2–5 days), is capable of detecting and quantifying significant methane point sources. By employing shortwave infrared (SWIR) measurements, Sentinel-2 has successfully conducted high-frequency monitoring of the Sanyuan Nan Yao Coal Mine in Shanxi and the EOG Shale Gas Well in Eddy County, New Mexico, demonstrating its potential in methane emission surveillance. Our approach is readily adaptable to other satellite instruments with approximate SWIR spectral bands, such as Landsat-7 and Landsat-8. The high-frequency detection of anomalous methane point sources based on satellite data can enable timely corrective actions to help reduce global methane emissions. This work illustrates how spaceborne multispectral imaging instruments can facilitate global high-frequency monitoring of large methane point sources by combining a fine pixel resolution with rapid revisit rates.

4.2.2. EOG Shale Gas Well in Eddy County, New Mexico

Utilizing the Sentinel-2 platform on GEE, we conducted high-frequency monitoring of two methane point sources: the Sanyuan Nan Yao Coal Mine in Shanxi and the EOG Shale Gas Well in Eddy County. The EOG Shale Gas Well was initially detected by GF5-02-AHSI in February 2022, with its scale later confirmed by TROPOMI [42]. The location is depicted in the lower right corner of Figure 9. The New Mexico source is a piece of equipment from a shale gas well.
From 1 January 2020 to 30 August 2024, out of 293 Sentinel-2 satellite overpasses, we identified 64 detectable methane plumes from the EOG Shale Gas Well point source, averaging 1 overpass every 5.9 days. Among the 293 detected instances, 79 were due to cloud cover, and 149 showed no detectable plumes, indicating a plume persistence rate of 29% in the cloud-free observations. The lack of detection could be due to the source being inactive or emissions falling below the Sentinel-2 detection threshold. For each cloud-free scenario, we determined plume detection by employing the MBMP retrieval method within a 1 × 1 km2 area centered on the point source. We constructed methane plume masks and estimated the source emission rates using the MBMP retrieval method, as shown in Figure 9, which displays some of the methane plumes retrieved from the EOG Shale Gas Well point source. The emission rates and quantities from the methane point source appeared to be unrelated to the season. Out of 64 plume detections, we estimated the emission rates for 62, disregarding 2 instances that were difficult to distinguish from methane plumes during the retrieval process. Figure 10 illustrates the time series results of source emission rates, ranging from 2.1 to 22.9 t/h, with an average standard deviation of 7.3 ± 3.5 t/h. In September 2022, we observed a significant reduction in emissions from this methane point source, possibly due to control measures taken by the facility operator. Assuming a 29% persistence rate without daily variations, our estimate of the average emission rate implies a total of 16,000 tons of methane emitted over a year-long emission event. This represents 0.9% of the 17 million tons of national methane emissions reported by the U.S. government to the United Nations Framework Convention on Climate Change for the oil and gas industry in 2023. Given the intervention by the facility operator in September 2022, it seems that a significant portion of these emissions could have been avoided if the operator had been notified shortly after the emissions began. Sentinel-2 imagery could enable such interventions in the future.

5. The Proposal of a Tiered Observation Approach

Here, we investigate the methane observation capabilities of Sentinel-2, GF5-02-AHSI, and EnMAP, and how the combination of their coverage and resolution can be used for the hierarchical monitoring of methane leaks, achieving a complete process from large-scale rapid detection to high-precision localization and quantification. Sentinel-2 provides high-frequency, large-scale preliminary monitoring, while EnMAP and GF5-02-AHSI utilize their higher ground pixel resolution and spectral resolution to confirm leaks and provide precise emission quantification. This hierarchical approach improves detection efficiency, reduces costs, and enables rapid responses to short-term leak events. This method can also be applied to other satellite data. The hierarchical methane leak observation method proposed in this study (Figure 11) integrates different satellites and ground-based instruments, as well as auxiliary information sources, to achieve the more comprehensive monitoring of methane leaks. The method also emphasizes the use of information from different (targeted) satellite platforms and supporting information such as reports, news, satellite-observed combustion, and ground-based air quality observations. Particularly in cases where ground observations and auxiliary information are unavailable, such as in remote areas, the satellite remote sensing component of the hierarchical observation method becomes crucial.

6. Discussion

The findings of this study underscore the significant potential of integrating multispectral and hyperspectral satellite data for the detection and quantification of methane super-emitters. By leveraging the complementary strengths of Sentinel-2, EnMAP, and GF5-02-AHSI, we have demonstrated a robust methodology for identifying and monitoring large methane point sources, particularly in regions with high methane emissions such as coal mining areas in China and oil and gas fields in the United States. This approach not only enhances our understanding of methane emission patterns but also provides actionable insights for mitigating climate change.

6.1. Synergy of Multispectral and Hyperspectral Data

The integration of Sentinel-2’s high-frequency revisit capability with the high spectral resolution of EnMAP and GF5-02-AHSI has proven effective in detecting methane plumes with varying emission rates. Sentinel-2’s ability to provide frequent observations (every 25 days) allows for the continuous monitoring of methane hotspots, while EnMAP and GF5-02-AHSI offer the precision needed to quantify emissions accurately. This synergy is particularly valuable in regions where methane emissions are intermittent and highly variable, such as in coal mines and oil and gas facilities. The combination of these datasets enables a more comprehensive understanding of methane dynamics, facilitating the identification of both persistent and transient emission sources.

6.2. Methane Emission Characteristics

Our analysis reveals distinct differences in methane emission patterns between coal mines and oil and gas facilities. Coal mines tend to exhibit more persistent but lower intensity emissions, whereas oil and gas facilities often show more sporadic but higher intensity emissions. This variability underscores the importance of continuous monitoring to capture the full range of emission behaviors. The high-frequency monitoring capability of Sentinel-2, combined with the precise quantification provided by EnMAP and GF5-02-AHSI, offers a comprehensive approach to understanding these emission patterns. Furthermore, the observed variability in emission rates highlights the need for tailored mitigation strategies that address the specific characteristics of different emission sources.

6.3. Implications for Methane Mitigation

The ability to detect and quantify methane emissions in near real-time has significant implications for methane mitigation efforts. By identifying super-emitters promptly, corrective actions can be taken to reduce emissions, thereby contributing to global climate change mitigation. The case studies of the Sanyuan Nan Yao Coal Mine in Shanxi and the EOG Shale Gas Well in Eddy County illustrate how satellite observations can inform operational decisions and regulatory actions. For instance, the observed reduction in emissions from the EOG Shale Gas Well following operator intervention highlights the potential for satellite data to drive timely and effective emission reductions. This capability is crucial for achieving the methane reduction targets set forth in international climate agreements.

6.4. Limitations and Future Directions

While this study demonstrates the effectiveness of satellite-based methane monitoring, several limitations should be acknowledged. The spectral resolution of Sentinel-2, while sufficient for detecting large methane plumes, may not be adequate for identifying smaller or less intense emissions. Additionally, the heterogeneity of surface conditions, particularly in regions like Changzhi, can pose challenges for automatic plume detection and quantification. Future advancements in satellite technology, such as the upcoming CHIME and Carbon Mapper missions, are expected to improve the revisit frequency and spectral resolution, further enhancing our ability to monitor methane emissions globally. Moreover, the integration of machine learning algorithms could improve the accuracy and efficiency of plume detection and quantification, particularly in complex environments.
In conclusion, this study underscores the value of combining multispectral and hyperspectral satellite data for the detection and quantification of methane super-emitters. The proposed tiered observation approach, which leverages the strengths of different satellite platforms, offers a scalable and cost-effective solution for global methane monitoring. As satellite technology continues to advance, the integration of these tools with targeted ground-based observations and policy frameworks will be crucial for achieving significant reductions in global methane emissions.

7. Conclusions

In this study, the 30 m resolution GF5-02-AHSI imaging spectrometer and EnMAP payload used, known for their high sensitivity and detection accuracy, have been proven effective in detecting, quantifying, and attributing strong methane plumes to their source facilities. Using the matched filtering method, we identified a total of 16 methane emission point sources in Changzhi, China, and the Permian Basin, with the majority in Changzhi being concentrated in the southeastern region. By employing the IME method to estimate emission rates, our findings indicated that the emission intensities ranged between 1.7 and 75.1 t/h. The high-frequency monitoring capability of the Sentinel-2 satellite, combined with its 20 m spatial resolution, enabled the effective high-frequency monitoring of methane point sources. This approach provided a robust tool for the timely identification and response to methane leaks. The methane emission rates from the Sanyuan Nanyao Coal Mine in Shanxi and the EOG Shale Gas Well in Eddy County varied across different time scales, underscoring the importance of continuous monitoring. Through a comparative analysis of methane emissions in two distinct regions, we observed the differences in the emission characteristics between coal mines and oil and gas facilities. Methane emissions from coal mines may persist for a longer duration but may exhibit lower extreme emission levels compared to oil and gas facilities.
We have demonstrated the value of Sentinel-2 satellite observations in detecting and quantifying anomalous methane point sources, leveraging their 20 m pixel resolution and frequent revisit rate. Our methane retrieval utilized reflectance measurements from only two coarse-resolution shortwave infrared (SWIR) bands (band 11, approximately 1560–1660 nm; and band 12, approximately 2090–2290 nm). However, the contrast between these bands and/or with non-plume reference scenes enabled the detection and quantification of sources greater than approximately 3 tons per h under favorable surface reflectance conditions. Our demonstration of Sentinel-2’s capability for the high-frequency monitoring of super-emitter methane point sources can be readily extended to other multispectral satellite instruments with similar spectral bands, including Landsat 7 and Landsat 8. In the future, these satellite observation systems could serve as early warning systems to identify high emissions from industrial facilities, enabling prompt corrective actions and significant reductions in total methane emissions at regional and national scales. The integration of multispectral satellite data with targeted instruments like GHGSat for more precise detection, combined with global mapping instruments that can contextualize point source emissions within a regional framework, will be particularly effective.
However, attention must be paid to the uncertainties associated with the retrieval of concentration enhancements, which are influenced by limitations in spectral resolution and signal-to-noise ratio. Additionally, in the Changzhi region, the heterogeneity of the surface has led to higher detection limits, posing a significant challenge to the automatic extraction of plumes. Consequently, many point sources with lower emission rates may remain undetected and unquantified, resulting in a conservative estimate of total emissions.
Looking ahead, beyond the already operational GF5-02, PRISMA, EnMAP, and EMIT satellites, the upcoming high-resolution imaging spectrometers such as CHIME and Carbon Mapper will further improve the revisit frequency for characterizing global methane point sources. When combined with dense ground-based monitoring networks, these observations are expected to inform Methane Alert and Response Systems (MARSs) [57], aiding in the compilation of robust methane inventories and the evaluation of emission reduction policies.

Author Contributions

Original draft preparation and formal analysis, X.C.; review and editing, Y.B. and Q.H.; software, Z.Y. and Z.L.; validation, B.L. All authors have read and agreed to the published version of the manuscript.

Funding

This research was funded by the Key Civil Space Projects (D040101), Sichuan Science and Technology Program (2024ZYD0010).

Institutional Review Board Statement

Not applicable.

Informed Consent Statement

Not applicable.

Data Availability Statement

(1) Sentinel-2 data were derived from the following resources available in the public domain: [https://dataspace.copernicus.eu/, accessed on 13 March 2024]. (2) EnMAP data were derived from the following resources available in the public domain: [https://sso.eoc.dlr.de/enmap/selfservice/public/newuser/, accessed on 13 Feb 2024]. (3) We would like to thank the China Centre for Resources Satellite Data and Application for providing the Gaofen-5 satellite data.

Acknowledgments

We sincerely thank the organizations and individuals who generously provided the free datasets used in this research.

Conflicts of Interest

The authors declare no conflicts of interest.

References

  1. Saunois, M.; Stavert, A.R.; Poulter, B.; Bousquet, P.; Canadell, J.G.; Jackson, R.B.; Raymond, P.A.; Dlugokencky, E.J.; Houweling, S.; Patra, P.K.; et al. The global methane budget 2000–2017. Earth Syst. Sci. Data 2020, 12, 1561–1623. [Google Scholar] [CrossRef]
  2. Etminan, M.; Myhre, G.; Highwood, E.J.; Shine, K.P. Radiative forcing of carbon dioxide, methane, and nitrous oxide: A significant revision of the methane radiative forcing. Geophys Res. Lett. 2016, 43, 12614–12623. [Google Scholar] [CrossRef]
  3. IPCC. Climate Change 2021: The Physical Science Basis; Contribution of Working Group I to the Sixth Assessment Report of the Intergovernmental Panel on Climate Change; Cambridge University Press: Cambridge, UK, 2021; Available online: https://www.ipcc.ch/report/ar6/wg1/ (accessed on 1 January 2022).
  4. Hmiel, B.; Petrenko, V.V.; Dyonisius, M.N.; Buizert, C.; Smith, A.M.; Place, P.F.; Harth, C.; Beaudette, R.; Hua, Q.; Yang, B.; et al. Preindustrial 14 CH4 indicates greater anthropogenic fossil CH4 emissions. Nature 2020, 578, 409–412. [Google Scholar] [CrossRef]
  5. Maasakkers, J.D.; Jacob, D.J.; Sulprizio, M.P.; Scarpelli, T.R.; Nesser, H.; Sheng, J.X.; Zhang, Y.; Hersher, M.; Bloom, A.A.; Bowman, K.W.; et al. Global distribution of methane emissions, emission trends, and OH concentrations and trends inferred from an inversion of GOSAT satellite data for 2010–2015. Atmos. Chem. Phys. 2019, 11, 7859–7881. [Google Scholar] [CrossRef]
  6. Schwietzke, S.; Sherwood, O.A.; Bruhwiler, L.M.P.; Miller, J.B.; Etiope, G.; Dlugokencky, E.J.; Michel, S.E.; Arling, V.A.; Vaughn, B.H.; White, J.W.C.; et al. Upward revision of global fossil fuel methane emissions based on isotope database. Nature 2016, 538, 88–91. [Google Scholar] [CrossRef]
  7. Brandt, A.R.; Heath, G.A.; and Cooley, D. Methane Leaks from Natural Gas Systems Follow Extreme Distributions. Environ. Sci. Technol. 2016, 50, 12512–12520. [Google Scholar] [CrossRef]
  8. Frankenberg, C.; Thorpe, A.K.; Thompson, D.R.; Hulley, G.; Kort, E.A.; Vance, N.; Borchardt, J.; Krings, T.; Gerilowski, K.; Sweeney, C.; et al. Airborne methane remote measurements reveal heavy-tail flux distribution in Four Corners region. Proc. Natl. Acad. Sci. USA 2016, 113, 9734–9739. [Google Scholar] [CrossRef]
  9. Jacob, D.J.; Turner, A.J.; Maasakkers, J.D.; Sheng, J.; Sun, K.; Liu, X.; Chance, K.; Aben, I.; McKeever, J.; Frankenberg, C. Satellite observations of atmospheric methane and their value for quantifying methane emissions. Atmos. Chem. Phys. 2016, 16, 14371–14396. [Google Scholar] [CrossRef]
  10. Kuze, A.; Kikuchi, N.; Kataoka, F.; Suto, H.; Shiomi, K.; Kondo, Y. Detection of methane emission from a local source using GOSAT target observations. Remote Sens. 2020, 12, 267. [Google Scholar] [CrossRef]
  11. Jiang, Y.; Zhang, L.; Zhang, X.; Cao, X. Methane Retrieval Algorithms Based on Satellite: A Review. Atmosphere 2024, 15, 449. [Google Scholar] [CrossRef]
  12. Thompson, D.R.; Thorpe, A.K.; Frankenberg, C.; Green, R.O.; Duren, R.; Guanter, L.; Hollstein, A.; Middleton, E.; Ong, L.; Ungar, S. Space-based remote imaging spectroscopy of the Aliso Canyon CH4 supermitter. Geophys. Res. Lett. 2016, 43, 6571–6578. [Google Scholar] [CrossRef]
  13. Zhang, Y.; Li, Y.C.; Zheng, Y.F.; He, P. Hyperspectral Remote Sensing Technology of GF-5 Satellite and Its Applications. Remote Sens. 2020, 24, 520–533. [Google Scholar]
  14. Lu, T.; Li, Z.; Fan, C.; He, Z.; Jiang, X.; Gao, Y.; Xuan, Y.; de Leeuw, G. Methane Retrieval Algorithms for High-Reflectance Surfaces: Lessons from the Permian Basin. Atmos. Meas. Tech. 2020, 13, 6105–6120. [Google Scholar]
  15. Jervis, D.; McKeever, J.; Durak, B.O.; Sloan, J.J.; Gains, D.; Varon, D.J.; Ramier, A.; Strupler, M.; Tarrant, E. The GHGSat-D imaging spectrometer. Atmos. Meas. Tech. 2021, 14, 2127–2140. [Google Scholar] [CrossRef]
  16. Irakulis-Loitxate, I.; Guanter, L.; Maasakkers, J.D.; Zavala-Araiza, D.; Aben, I. Satellites detect abatable super-emissions in one of the world’s largest methane hotspot regions. Environ. Sci. Technol. 2022, 56, 2143–2152. [Google Scholar] [CrossRef]
  17. Vaughan, A.; Mateo-García, G.; Gómez-Chova, L.; Růžička, V.; Guanter, L.; Irakulis-Loitxate, I. CH4Net: A deep learning model for monitoring methane super-emitters with Sentinel-2 imagery. Atmos. Meas. Tech. 2014, 17, 2583–2593. [Google Scholar] [CrossRef]
  18. Duren, R.M.; Veenstra, B.; Nathan, I. High-Resolution Detection of Methane Plumes from Individual Sources Using WorldView-3. Environ. Sci. Technol. 2022, 56, 8413–8422. [Google Scholar]
  19. Pandey, S.; Nistelrooij, M.; Maasakkers, J.D.; Sutar, P.; Houweling, S.; Varon, D.J.; Tol, P.; Gains, D.; Worden, J.; Aben, I. Daily detection and quantification of methane leaks using Sentinel-3: A tiered satellite observation approach with Sentinel-2 and Sentinel-5p. Remote Sens. Environ. 2023, 296, 113716. [Google Scholar] [CrossRef]
  20. Zavala-Araiza, D.; Alvarez, R.A.; Lyon, D.R.; Allen, D.T.; Marchese, A.J.; Zimmerle, D.J.; Hamburg, S.P. Super-emitters in natural gas infrastructure are caused by abnormal process conditions. Nat. Commun. 2017, 8, 14012. [Google Scholar] [CrossRef]
  21. Pandey, S.; Gautam, R.; Houweling, S.; van der Gon, H.; Sadavarte, P.; Borsdorff, T.; Hasekamp, O.; Landgraf, J.; Tol, P.; van Kempen, T.; et al. Satellite observations reveal extreme methane leakage from a natural gas well blowout. Proc. Natl. Acad. Sci. USA 2019, 116, 26376–26381. [Google Scholar] [CrossRef]
  22. Schneising, O.; Buchwitz, M.; Reuter, M.; Vanselow, S.; Bovensmann, H.; Burrows, J.P. Remote sensing of methane leakage from natural gas and petroleum systems revisited. Atmos. Chem. Phys. 2020, 20, 9169–9182. [Google Scholar] [CrossRef]
  23. Liu, Y.-N.; Zhang, J.; Zhang, Y.; Sun, W.-W.; Jiao, L.-L.; Sun, D.-X.; Hu, X.-N.; Ye, X.; Li, Y.-D.; Liu, S.-F.; et al. The advanced hyperspectral imager: Aboard China’s Gaofen-5 satellite. IEEE Geosci. Remote Sens Mag. 2019, 7, 23–32. [Google Scholar] [CrossRef]
  24. Liu, J.; Liu, X.; Wang, L.; Guo, Y.; Zhao., P. Optimizing Atmospheric Correction through Parallel Acceleration: Reflection Accuracy Analysis of GF-5B Satellite Hyperspectral Sensor Data. In Proceedings of the 2024 3rd International Symposium on Sensor Technology and Control (ISSTC), Zhuhai, China, 25–27 October 2024; pp. 35–38. [Google Scholar] [CrossRef]
  25. Irakulis-Loitxate, I.; Guanter, L.; Liu, Y.-N.; Varon, D.J.; Maasakkers, J.D.; Zhang, Y.; Chulakadabba, A.; Wofsy, S.C.; Thorpe, A.K.; Duren, R.M.; et al. Satellite based survey of extreme methane emissions in the Permian basin. Sci. Adv. 2021, 7, eabf4507. [Google Scholar] [CrossRef]
  26. Guanter, L.; Kaufmann, H.; Segl, K.; Foerster, S.; Rogass, C.; Chabrillat, S.; Kuester, T.; Hollstein, A.; Rossner, G.; Chlebek, C.; et al. The EnMAP spaceborne imaging spectroscopy mission for Earth observation. Remote Sens. 2015, 7, 8830–8857. [Google Scholar] [CrossRef]
  27. Drusch, M.; Del Bello, U.; Carlier, S.; Colin, O.; Fernandez, V.; Gascon, F.; Hoersch, B.; Isola, C.; Laberinti, P.; Martimort, P.; et al. Sentinel-2: ESA’s Optical High-Resolution Mission for GMES Operational Services. Remote Sens. Environ. 2012, 120, 25–36. [Google Scholar] [CrossRef]
  28. Dwomoh, F.K.; Wimberly, M.C. Fire Regimes and Their Drivers in the Upper Guinean Region of West Africa. Remote Sens. 2017, 9, 1117. [Google Scholar] [CrossRef]
  29. Varon, D.J.; McKeever, J.; Jervis, D.; Maasakkers, J.D.; Pandey, S.; Houweling, S.; Aben, I.; Scarpelli, T.; Jacob, D.J. Satellite discovery of anomalously large methane emissions from oil/gas production. Geophys. Res. Lett. 2019, 46, 13507–13516. [Google Scholar] [CrossRef]
  30. Gordon, I.E.; Rothman, L.S.; Hargreaves, R.J.; Hashemi, R.; Karlovets, E.V.; Skinner, F.M.; Conway, E.K.; Hill, C.; Kochanov, R.V.; Tan, Y.; et al. The HITRAN2020 Molecular Spectroscopic Database. J. Quant. Spectrosc. Radiat. Transf. 2022, 277, 107949. [Google Scholar]
  31. Hersbach, H.; Bell, B.; Berrisford, P. The ERA5 global reanalysis. Q. J. R. Meteorol. Soc. 2020, 146, 1999–2049. [Google Scholar] [CrossRef]
  32. Wang, H.Z.; Fan, X.T.; Jian, H.D.; Yan, F.L. Exploiting the Matched Filter to Improve the Detection of Methane Plumes with Sentinel-2 Data. Remote Sens. 2024, 16, 1023. [Google Scholar] [CrossRef]
  33. Dong, D.; Zhang, R.; Guo, W.; Gong, D.; Zhao, Z.; Zhou, Y.; Xu, Y.; Fujioka, Y. Assessing Spatiotemporal Dynamics of Net Primary Productivity in Shandong Province, China (2001–2020) Using the CASA Model and Google Earth Engine: Trends, Patterns, and Driving Factors. Remote Sens. 2025, 17, 488. [Google Scholar] [CrossRef]
  34. Varon, D.J.; Jacob, D.J.; McKeever, J. Quantifying methane point sources from fine-scale satellite observations of atmospheric methane plumes. Atmos. Meas. Tech. 2018, 11, 5673–5686. [Google Scholar] [CrossRef]
  35. Varon, D.J.; Jervis, D.; McKeever, J.; Spence, I.; Gains, D.; Jacob, D.J. High-frequency monitoring of anomalous methane point sources with multispectral Sentinel-2 satellite observations. Atmos. Meas. Tech. 2021, 14, 2771–2785. [Google Scholar] [CrossRef]
  36. Roger, J.; Irakulis-Loitxate, I.; Valverde, A.; Gorroño, J.; Chabrillat, S.; Brell, M.; Guanter, L. High-Resolution Methane Mapping with the EnMAP Satellite Imaging Spectroscopy Mission. IEEE Trans. Geosci. Remote Sens. 2024, 62, 4102012. [Google Scholar]
  37. Berk, A.; Conforti, P.; Kennett, R.; Perkins, T.; Hawes, F.; Van Den Bosch, J. MODTRAN®® 6: A major upgrade of the MODTRAN®® radiative transfer code. In Proceedings of the 2024 6th Workshop on Hyperspectral Image and Signal Processing: Evolution in Remote Sensing (WHISPERS), Lausanne, Switzerland, 24–27 June 2014; Volume 9088, pp. 1–4. [Google Scholar]
  38. Thompson, D.R.; Leifer, I.; Bovensmann, H.; Eastwood, M.; Fladeland, M.; Frankenberg, C.; Gerilowski, K.; Green, R.O.; Kratwurst, S.; Krings, T.; et al. Real-time remote detection and measurement for airborne imaging spectroscopy: A case study with methane. Atmos. Meas. Tech. 2015, 8, 4383–4397. [Google Scholar] [CrossRef]
  39. Thorpe, A.K.; Duren, R.M.; Conley, S.; Prasad, K.R.; Bue, B.D.; Yadav, V.; Foster, K.T.; Rafiq, T.; Hopkins, F.M.; Smith, M.L.; et al. Methane emissions from underground gas storage in California. Environ. Res. Lett. 2020, 15, 045005. [Google Scholar] [CrossRef]
  40. Foote, M.D.; Dennison, P.E.; Thorpe, A.K.; Thompson, D.R.; Jongaramrun-gruang, S.; Frankenberg, C.; Joshi, S.C. Fast and Accurate Retrieval of Methane Concentration from Imaging Spectrometer Data Using Sparsity Prior. IEEE Trans. Geosci. Remote Sens. 2020, 58, 6480–6492. [Google Scholar] [CrossRef]
  41. Molod, A.; Takacs, L.; Suarez, M.; Bacmeister, J.; Song, I.S.; Eichmann, A. The GEOS-5 Atmospheric General Circulation Model: Mean Climate and Development from MERRA to Fortuna; Technical Reports Series; NASA: Washington, DC, USA, 2012. [Google Scholar]
  42. Chen, Z.C.; Jacob, D.J.; Nesser, H.; Sulprizio, M.P.; Lorente, A.; Varon, D.J.; Lu, X.; Shen, L.; Qu, Z.; Peen, E.; et al. Methane emissions from China: A high-resolution inversion of TROPOMI satellite observations. Atmos. Chem. Phys. Discuss. 2022, 22, 10809–10826. [Google Scholar] [CrossRef]
  43. Looney, B.; Dale, S. BP Statistical Review of World Energy 2021. British Petroleum: London, UK, 2021; pp. 4–6. [Google Scholar]
  44. Miller, S.M.; Michalak, A.M.; Detmers, R.G.; Hasekamp, O.P.; Bruhwiler, L.M.; Schwietzke, S. China’s coal mine methane regulations have not curbed growing emissions. Nat. Commun. 2019, 10, 1–8. [Google Scholar] [CrossRef]
  45. Wang, K.; Zhang, J.J.; Cai, B.F.; Liang, S. Estimation of Chinese city-level anthropogenic methane emissions in 2015. Resour. Conserv. Recycl. 2021, 175, 105861. [Google Scholar] [CrossRef]
  46. Lyon, D.R.; Alvarez, R.A.; Zavala-Araiza, D.; Brandt, A.R.; Jackson, R.B.; Hamburg, S.P. Aerial surveys of elevated hydrocarbon emissions from oil and gas production sites. Environ. Sci. Technol. 2016, 50, 4877–4886. [Google Scholar] [CrossRef] [PubMed]
  47. Alvarez, R.A.; Zavala-Araiza, D.; Lyon, D.R.; Allen, D.T.; Barkley, Z.R.; Brandt, A.R.; Davis, K.J.; Herndon, S.C.; Jacob, D.J.; Karion, A.; et al. Assessment of methane emissions from the U.S. oil and gas supply chain. Science 2018, 361, 186–188. [Google Scholar] [CrossRef]
  48. Zhang, Y.; Gautam, R.; Pandey, S.; Omara, M.; Maasakkers, J.D.; Sadavarte, P.; Lyon, D.; Nesser, H.; Sulprizio, M.P.; Varon, D.J.; et al. Quantifying methane emissions from the largest oil-producing basin in the United States from space. Sci. Adv. 2020, 6, eaaz5120. [Google Scholar]
  49. Johan, C.I.; Eleni, M.; Chris, M. Global Methane Assessment: Benefits and Costs of Mitigating Methane Emissions; Stockholm Environment Institute: Stockholm, Sweden, 2021. [Google Scholar]
  50. Guanter, L.; Irakulis-Loitxate, I.; Gorroño, J.; Sánchez-García, E.; Cusworth, D.H.; Varon, D.J.; Cogliati, S.; Colombo, R. Mapping methane point emissions with the PRISMA spaceborne imaging spectrometer. Remote Sens. Environ. 2021, 265, 112671. [Google Scholar] [CrossRef]
  51. Sánchez-García, E.; Gorroño, J.; Irakulis-Loitxate, I.; Varon, D.J.; Guanter, L. Mapping methane plumes at very high spatial resolution with the WorldView-3 satellite. Atmos. Meas. Tech. 2022, 15, 1657–1674. [Google Scholar] [CrossRef]
  52. Maasakkers, J.D.; Jacob, D.J.; Sulprizio, M.P.; Turner, A.J.; Weitz, M.; Wirth, T.; Hight, C.; DeFigueiredo, M.; Desai, M.; Schmeltz, R.; et al. Gridded national inventory of U.S. methane emissions. Environ. Sci. Technol. 2016, 50, 13123–13133. [Google Scholar] [CrossRef]
  53. Lyon, D.R.; Zavala-Araiza, R.A.; Alvarez, R.; Harriss, V.; Palacios, X.; Lan, R.; Talbot, T.; Lavoie, P.; Shepson, T.I.; Yacovitch, S.C.; et al. Constructing a spatially resolved methane emission inventory for the Barnett Shale region. Environ. Sci. Technol. 2015, 49, 8147–8157. [Google Scholar] [CrossRef] [PubMed]
  54. Kholod, N.; Evans, M.; Pilcher, R.C.; Roshchanka, V.; Ruiz, F.; Coté, M.; Collings, R. Global methane emissions from coal mining to continue growing even with declining coal production. J. Clean. Prod. 2020, 256, 959–6526. [Google Scholar]
  55. Liu, Q.; Teng, F.; Nielsen, C.P.; Zhang, Y.Z.; Wu, L.X. Large methane mitigation potential through prioritized closure of gas-rich coal mines. Nat. Clim. Change 2024, 14, 652–658. [Google Scholar] [CrossRef]
  56. Bai, S.; Zhang, Y.; Li, F.; Yan, Y.; Chen, H.; Feng, S.; Jiang, F.; Sun, S.; Wang, Z.; Zhou, C.; et al. High-resolution satellite estimates of coal mine methane emissions from local to regional scales in Shanxi, China. Sci. Total Environ. 2024, 950, 14. [Google Scholar] [CrossRef]
  57. Guanter, L.; Irakulis-Loitxate, I.; Maasakkers, J.D.; Aben, I.; Lelong, C.; Randles, C.A.; Zavala-Araiza, D.; Hamburg, S.P.; Caltagirone, M. Methane alert and response system (Mars): IMEO’s satellite-based system for detection and attribution of methane point sources around the world. In Proceedings of the EGU23, the 25th EGU General Assembly, Vienna, Austria, 23–28 April 2023. [Google Scholar]
Figure 1. Study framework.
Atmosphere 16 00532 g001
Figure 2. Methane transmittance spectrum based on the HITRAN2020 and the spectral response functions of Sentinel-2A/B [32].
Atmosphere 16 00532 g002
Figure 3. The relationship between the 10 m wind speed and the effective wind speed in the study area. (a) Changzhi in Shanxi, China; (b) the Permian Basin in the United States.
Atmosphere 16 00532 g003
Figure 4. Methane plumes and emission rates detected in Changzhi, with the central panel showing a map of the identified methane plumes. The small panels (ah) around the main figure display examples of the detected plumes, in accordance with Table 1. The white arrow indicates the direction of the wind.
Atmosphere 16 00532 g004
Figure 5. Methane plumes and emission rates detected in Permian Basin, with the left panel showing a map of the identified methane plumes. The small panels (ah) around the main figure display examples of the detected plumes, In accordance with Table 1. The white arrow indicates the direction of the wind, red box indicates the study area.
Atmosphere 16 00532 g005
Figure 6. Maps of column-averaged dry air mole fraction of methane (XCH4) derived from TROPOMI data over the area where the massive methane enhancement was detected (marked with a black cross). The black arrows of different directions and sizes represent wind direction and wind speed. (a) Taken on 11 January 2023; (b) taken on 12 January 2023.
Atmosphere 16 00532 g006
Figure 7. Methane plume masks detected at methane point sources located in the Changzhi Sanyuan Nan Yao Coal Mine according to Sentinel-2 observations, with red circles indicating the emission sources and the image in the second row, fifth column showing the located emission source. The white arrow indicates the direction of the wind, the background is from ©Google Earth imagery. The dates in the figure are (a) 10 January 2022; (b) 19 February 2023; (c) 10 April 2022; (d) 2 May 2022; (e) 24 June 2022; (f) 7 September 2022; (g) 19 October 2022; (h) 8 December 2022; (i) 7 January 2023.
Atmosphere 16 00532 g007
Figure 8. The point source of the Sanyuan Nan Yao Coal Mine in Shanxi, and the MBMP retrievals according to Sentinel-2 observations.
Atmosphere 16 00532 g008
Figure 9. Methane plume masks detected at methane point sources located in the EOG Shale Gas Well in Eddy County, New Mexico, according to Sentinel-2 observations, with red circles indicating the emission sources, and the image in the second row, fifth column showing the located emission source. The white arrow indicates the direction of the wind, the background is from ©Google Earth imagery. The dates in the figure are (a) 31 December 2023; (b) 9 November 2023; (c) 10 September 2023; (d) 1 August 2023; (e) 24 June 2023; (f) 7 May 2023; (g) 9 May 2023; (h) 8 February 2023; (i) 7 December 2022.
Atmosphere 16 00532 g009
Figure 10. The EOG Shale Gas Well point source in Eddy County, and use of the MBMP retrievals according to Sentinel-2 observations.
Atmosphere 16 00532 g010
Figure 11. Illustration of a tiered observation approach for detecting methane leaks [19]. The satellite remote sensing component of the approach is highlighted by the red box, while the blue rounded rectangles emphasize the processes following detection and culminating in mitigation.
Atmosphere 16 00532 g011
Table 1. Summary of the detected methane plumes in the Changzhi and Permian Basin using satellite imaging spectroscopy data. The figure code refers to the figure panel where the plume is shown; Q is the estimated emission flux rate.
FigureMissionDateSectorLat, LongQ (t/h)
Figure 4aEnMAP20221205Coal mining36.133, 112.56512.7
Figure 4bGF5-02-AHSI20221018Coal mining36.145, 112.59173.1
Figure 4cGF5-02-AHSI20220504Coal mining36.123, 113.04175.1
Figure 4dEnMAP20230330Coal mining36.084, 113.0039.4
Figure 4eGF5-02-AHSI20221018Coal mining36.105, 113.0244.7
Figure 4fGF5-02-AHSI20221208Coal mining36.107, 113.07218.1
Figure 4gEnMAP20221205Coal mining36.203, 112.52222.7
Figure 4hGF5-02-AHSI20221208Unknown36.103, 113.0322.1
Figure 5aEnMAP20230112Gas well32.149, −103.9959.7
Figure 5bGF5-02-AHSI20220208Oil and gas32.604, −104.2492.9
Figure 5cEnMAP20220902Oil and gas32.301, −104.1201.7
Figure 5dEnMAP20230112Unknown31.659, −103.5438.7
Figure 5eEnMAP20220902Oil and gas31.640, −104.0383.2
Figure 5fGF5-02-AHSI20220208Gas well31.999, −104.1252.6
Figure 5gEnMAP20230112Oil and gas31.710, −103.7663.1
Figure 5hGF5-02-AHSI20220208Gas well32.069, −104.0263.4
Disclaimer/Publisher’s Note: The statements, opinions and data contained in all publications are solely those of the individual author(s) and contributor(s) and not of MDPI and/or the editor(s). MDPI and/or the editor(s) disclaim responsibility for any injury to people or property resulting from any ideas, methods, instructions or products referred to in the content.

