1. Introduction
Isotope ratios are frequently used to constrain the provenance of materials in environmental, planetary and astrochemical environments, and they serve as effective tracers in chemical and biochemical reactions. We consider here their potential application to the plasma in space physics environments with a focus on Earth’s magnetosphere. We present a semi-quantitative analysis meant to examine the possible range of several important isotope ratios.
Magnetospheric plasma derives from two sources, the solar wind and the atmospheric polar wind, with the relative contribution determined in part by the direction of the z-component of the interplanetary magnetic field (IMF), B
z [
1]. Solar wind isotope ratios have been well characterized by analyses of solar wind samples returned by the NASA
Genesis spacecraft [
2]. Isotope ratios from analyses of
Genesis samples are summarized in
Table 1 for H, He, N and O ions. By contrast the isotope ratios of polar wind ions, and the ionosphere in general, are far less studied. Early rocket and satellite measurements had on-board ion mass spectrometers that captured some isotopic profiles [
3] (
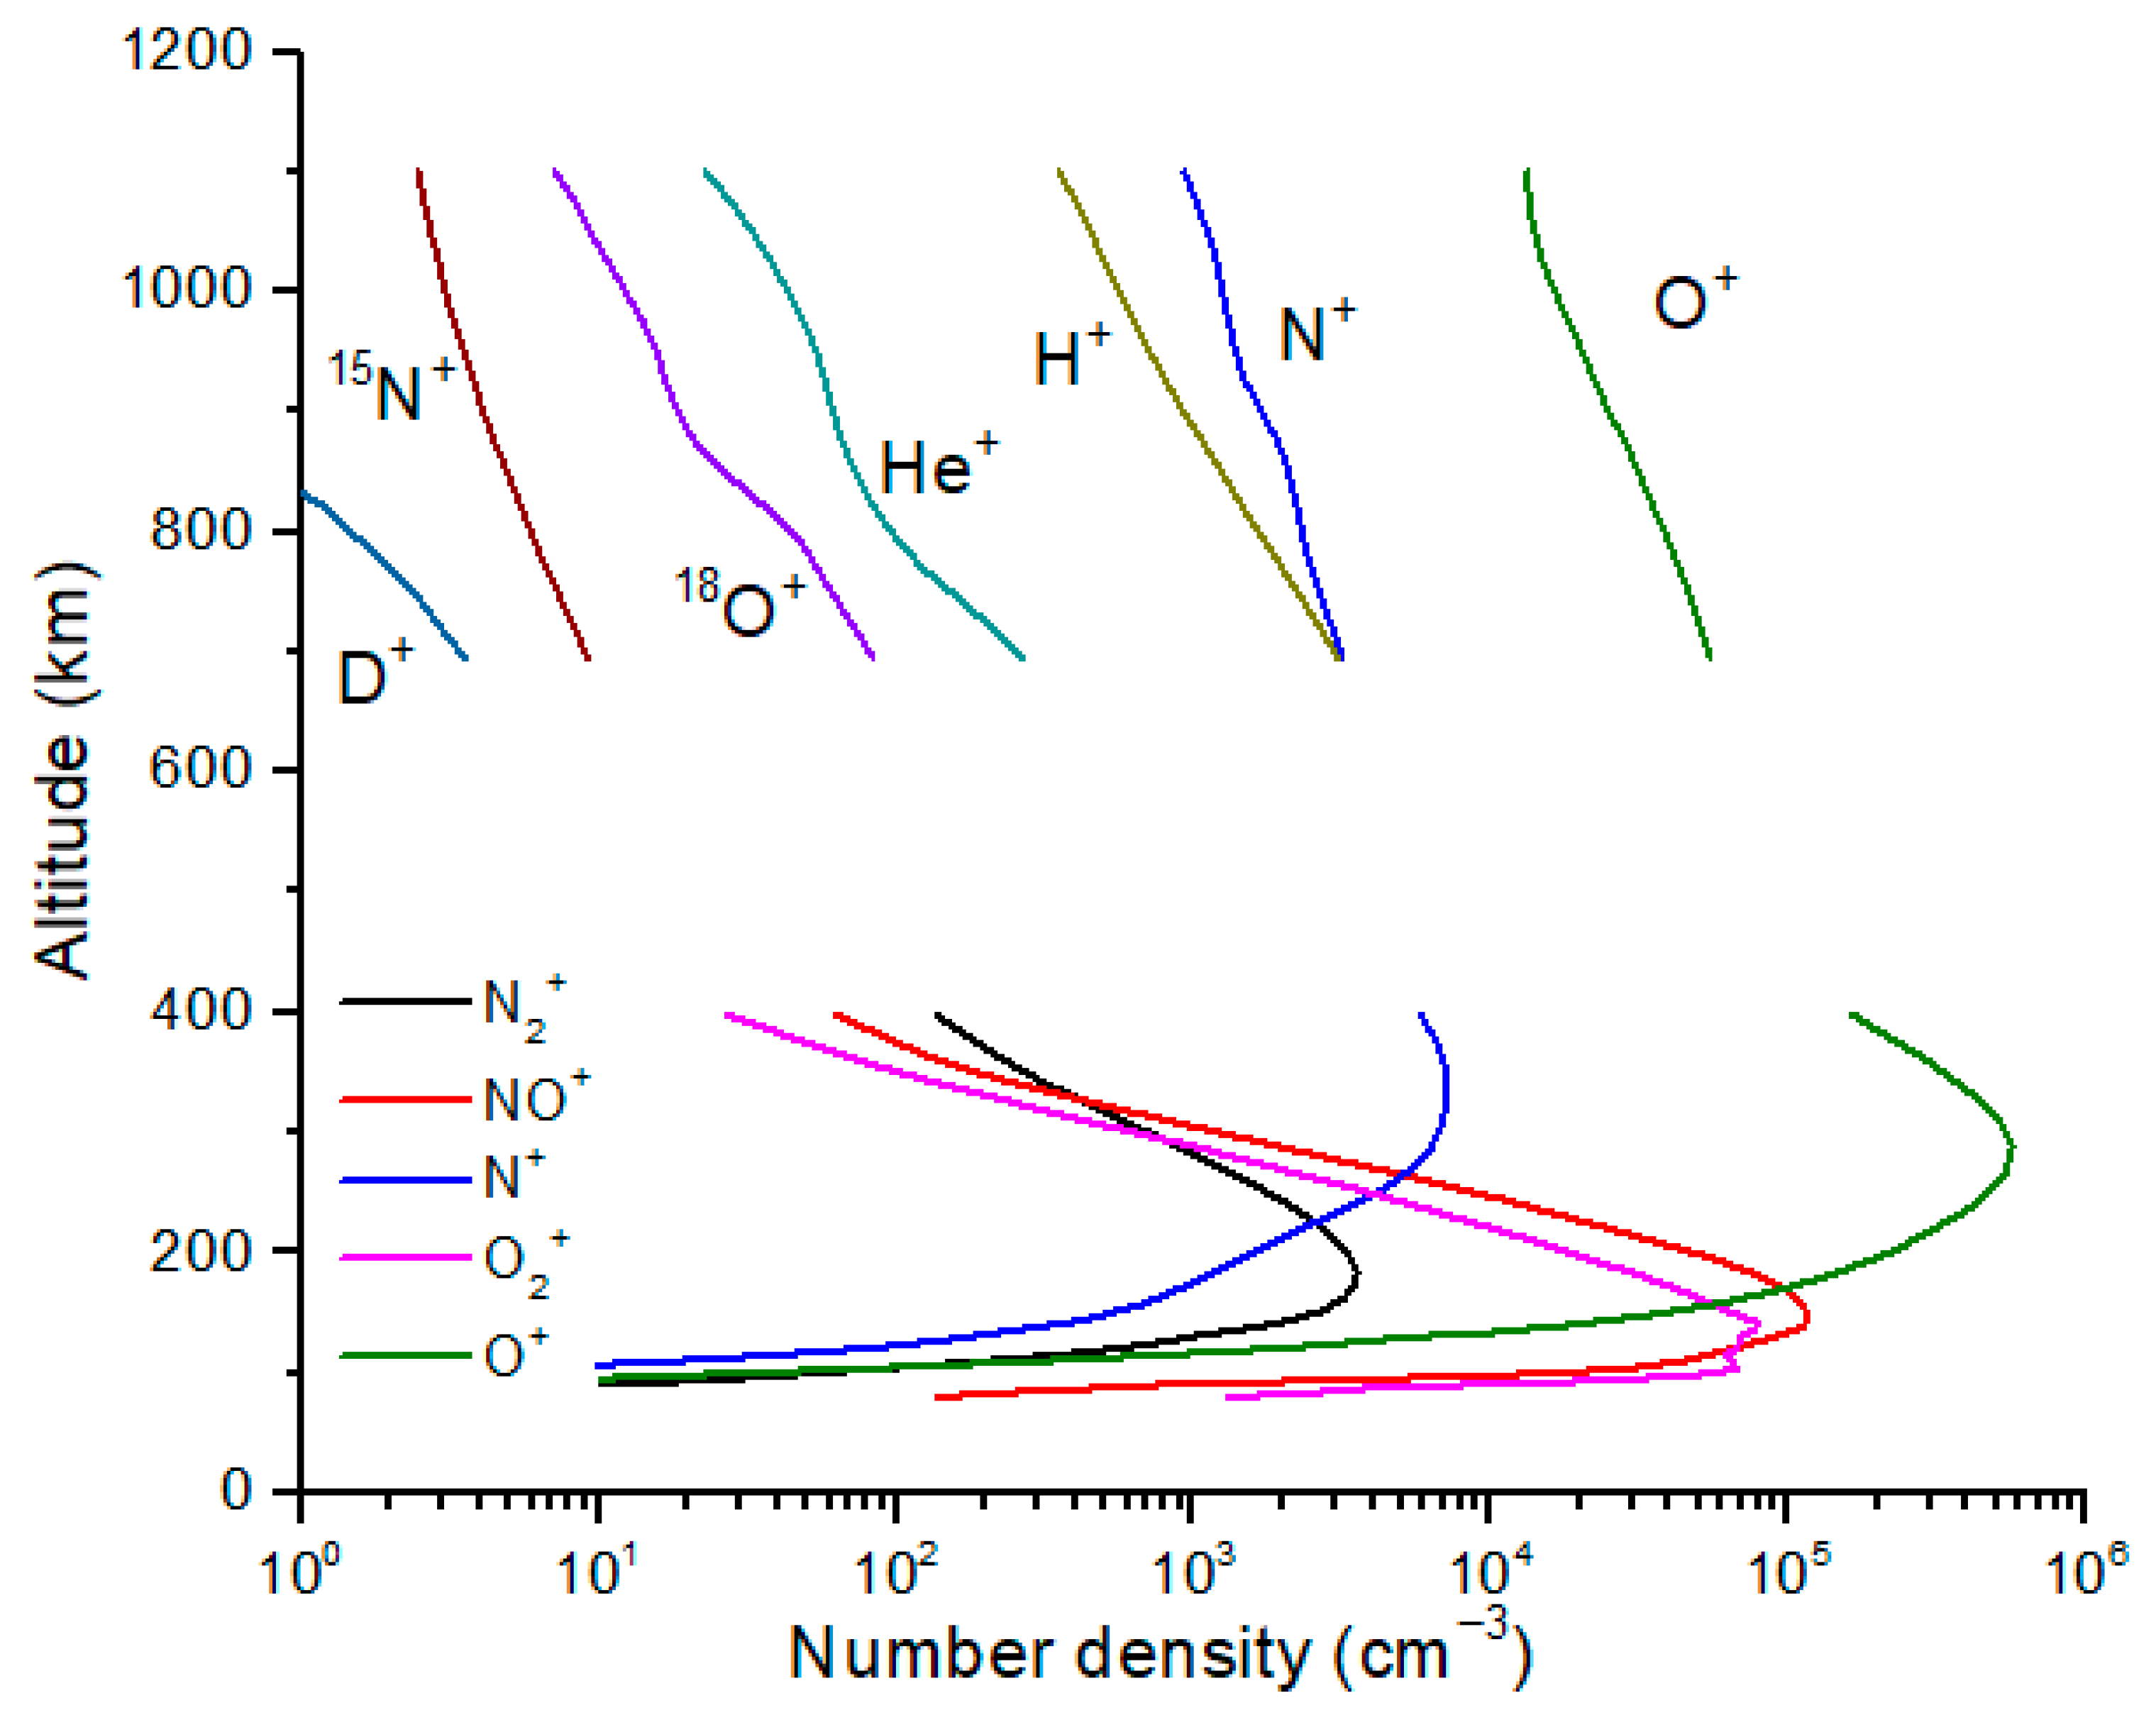
Figure 1), but measurement of isotope ratios was not a primary objective. As a result, it is not clear what uncertainties should be assigned to these isotopic profiles. We note that because of the NASA MAVEN mission, our knowledge of the isotopic composition of the ionosphere of Mars [
4] exceeds our isotopic knowledge of Earth’s ionosphere.
Ion escape from Earth’s atmosphere has been well studied for the polar regions, where ions can escape along open magnetic field lines. This escaping ion flux is referred to as the polar wind, also sometimes called the Earth wind. It has been proposed that Earth’s atmosphere is actively implanted in the lunar regolith [
5,
6]. We will evaluate the implantation of polar wind into lunar regolith by looking at isotope fractionation due to diffusive separation above the homopause. Our methodology is as follows: we compute diffusive separation for isotopic ions in the ionosphere; using isotope ratios for ions at 1000 km altitude and solar wind isotope ratios, we then use the magnetospheric flux model of Chappell et al. (1987) [
1] to estimate isotope ratios for the bulk magnetosphere; finally, we compare our magnetospheric isotope ratios to isotope ratios measured in lunar regolith. We also estimate the low-energy ion flux in the magnetotail at lunar distance using ARTEMIS data from Runov et al. [
7] for geomagnetically quiet conditions. Our results suggest that the implantation of polar wind ions in lunar regolith is not an important process at the present time.
Table 1.
Isotope ratios for standards and for solar wind from Genesis samples.
Table 1.
Isotope ratios for standards and for solar wind from Genesis samples.
| Isotope Ratio | Standard
Ratio | Solar Wind (Ratio) | Solar Wind (Permil) | Solar Photosphere
(Permil) |
|---|
| D/H | 1.5576 × 10⁻⁴ | <2 × 10⁻⁷ | δD = −1000 | ~0 (est.) |
| 3He/4He | 1.340 × 10⁻⁶ | 4.64 × 10⁻⁴ | δ3He = 3.45 × 10⁵ | n/a |
| 15N/14N | 3.676 × 10⁻³ | 2.27 × 10⁻³ [8] | δ15N = −440 | ~−400 (est.) |
| 18O/16O | 2.0052 × 10⁻³ | 1.805 × 10⁻³ [5] | δ18O = −100 | −50 ± 11 [9] |
| 17O/16O | 3.799 × 10⁻⁴ | 3.495 × 10⁻³ [5] | δ17O = −80
Δ17O = −28 | −62 ± 35 [9]
−17 ± 29 |
Figure 1.
Ion mass spectrometer measurements are plotted together with model profiles for the mid-latitude ionosphere. The measured profiles are from the Alouette rocket and the Explorer 31 satellite [
3]. Several isotopic ions were identified, including
18O
+,
15NO
+, and possibly D
+ (reported as mass/charge = 2). Measurements of isotopic ions in Earth’s upper atmosphere are rare. The model profiles (lower set of curves) are shown for comparison and are from reference [
10].
4. Diffusive Equilibrium Profiles in the Ionosphere
To make an estimate of isotope ratios in the ionosphere, we have several possible routes to consider. The most quantitative approach is to use the full set of equations needed to describe ion fluxes in the polar wind. The polar wind is comprised of ions that undergo acceleration along open B field lines out of the upper atmosphere in Earth’s magnetic polar regions. Escaping ions combine with solar wind ions to populate the plasmasphere and magnetosphere. Existing 3D models for the polar wind [
12,
13] capture the acceleration physics but do not presently include isotopes. Another approach is to model the mid-latitude ionosphere using a 1D vertical continuity equation model. There are many such models (e.g., [
10]) and there is the possibility to create such a model from existing 1D photochemical models. Most of these models are not designed to simulate polar escape, but they are valuable for identifying the key chemical reactions for isotopic ions. A third approach, and the one we take here, is to compute diffusive equilibrium profiles for several isotopic ions of interest. This is by far the simplest approach and allows us to make rapid estimates of ion isotope fractionation in the topside ionosphere for realistic temperature profiles. This method captures the bulk of the isotope fractionation which is due to diffusive separation. In future work, more quantitative modeling will be undertaken to fully describe isotope fractionation due to acceleration processes.
Diffusive equilibrium profiles are obtained by integrating the vertical diffusion equation for each ion with the ion flux set to zero. A similar calculation was conducted recently for the isotopes of O atoms in Earth’s thermosphere [
14]. Following Banks and Kockarts [
15], we compute isotopic ion number density,
, from the following expression:
In this expression, a and s are initial and final altitudes, and are electron and ion temperatures, is the mass of the jth ion, is the average ion mass, is the component of the gravitational acceleration parallel to the local magnetic field, and k is the Boltzmann constant. All values except vary with altitude. We assume that is equal to the local vertical component of gravity, which is nearly true in the polar regions.
Representative neutral, electron and ion temperature profiles from reference [
15] and from the IRI model [
16] are shown in
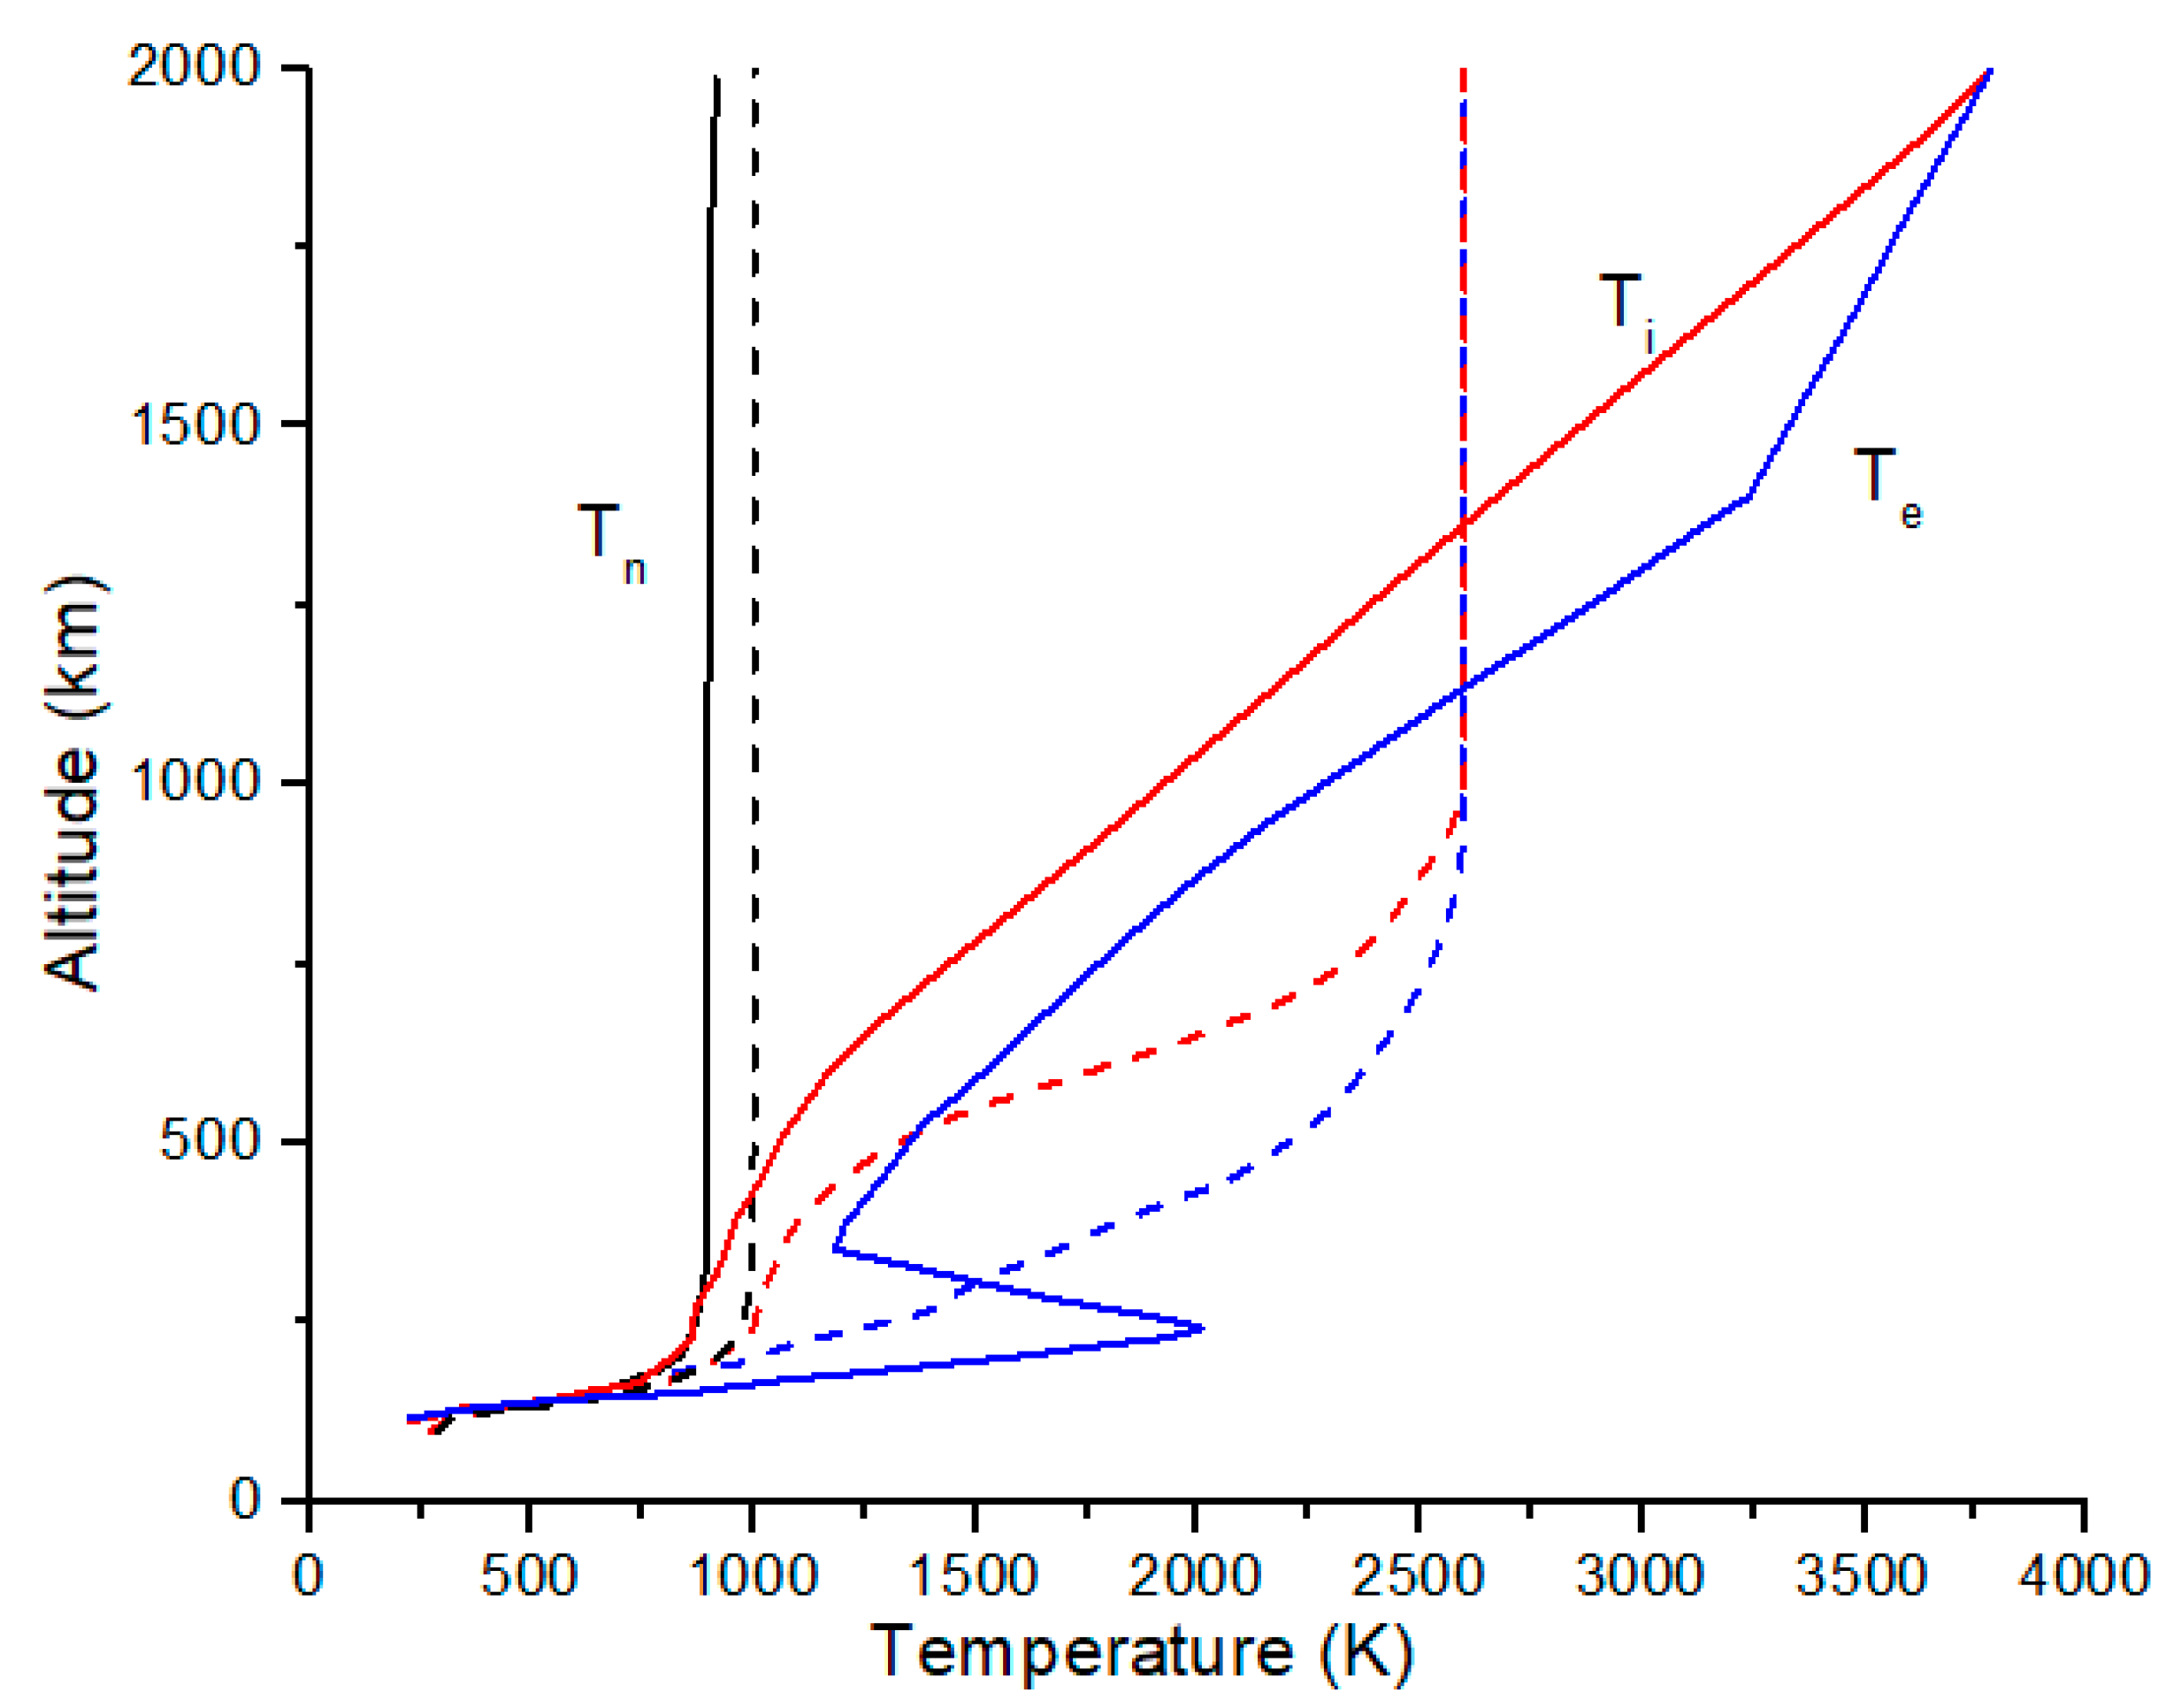
Figure 2, with peak ion and electron temperatures of 2600 K and a peak neutral temperature of 1000 K at 1000 km and with lower values for the IRI model at 20° N latitude. Electron and ion temperatures are usually higher due to solar ionizing radiation at high altitudes and then thermally equilibrate with the neutral gas by collisions at lower altitudes. The elevated ion and electron temperatures create large plasma scale heights in the topside ionosphere compared to the neutral gas scale height, which reduces isotope fractionation by diffusive separation for the ions compared to the atomic neutrals.
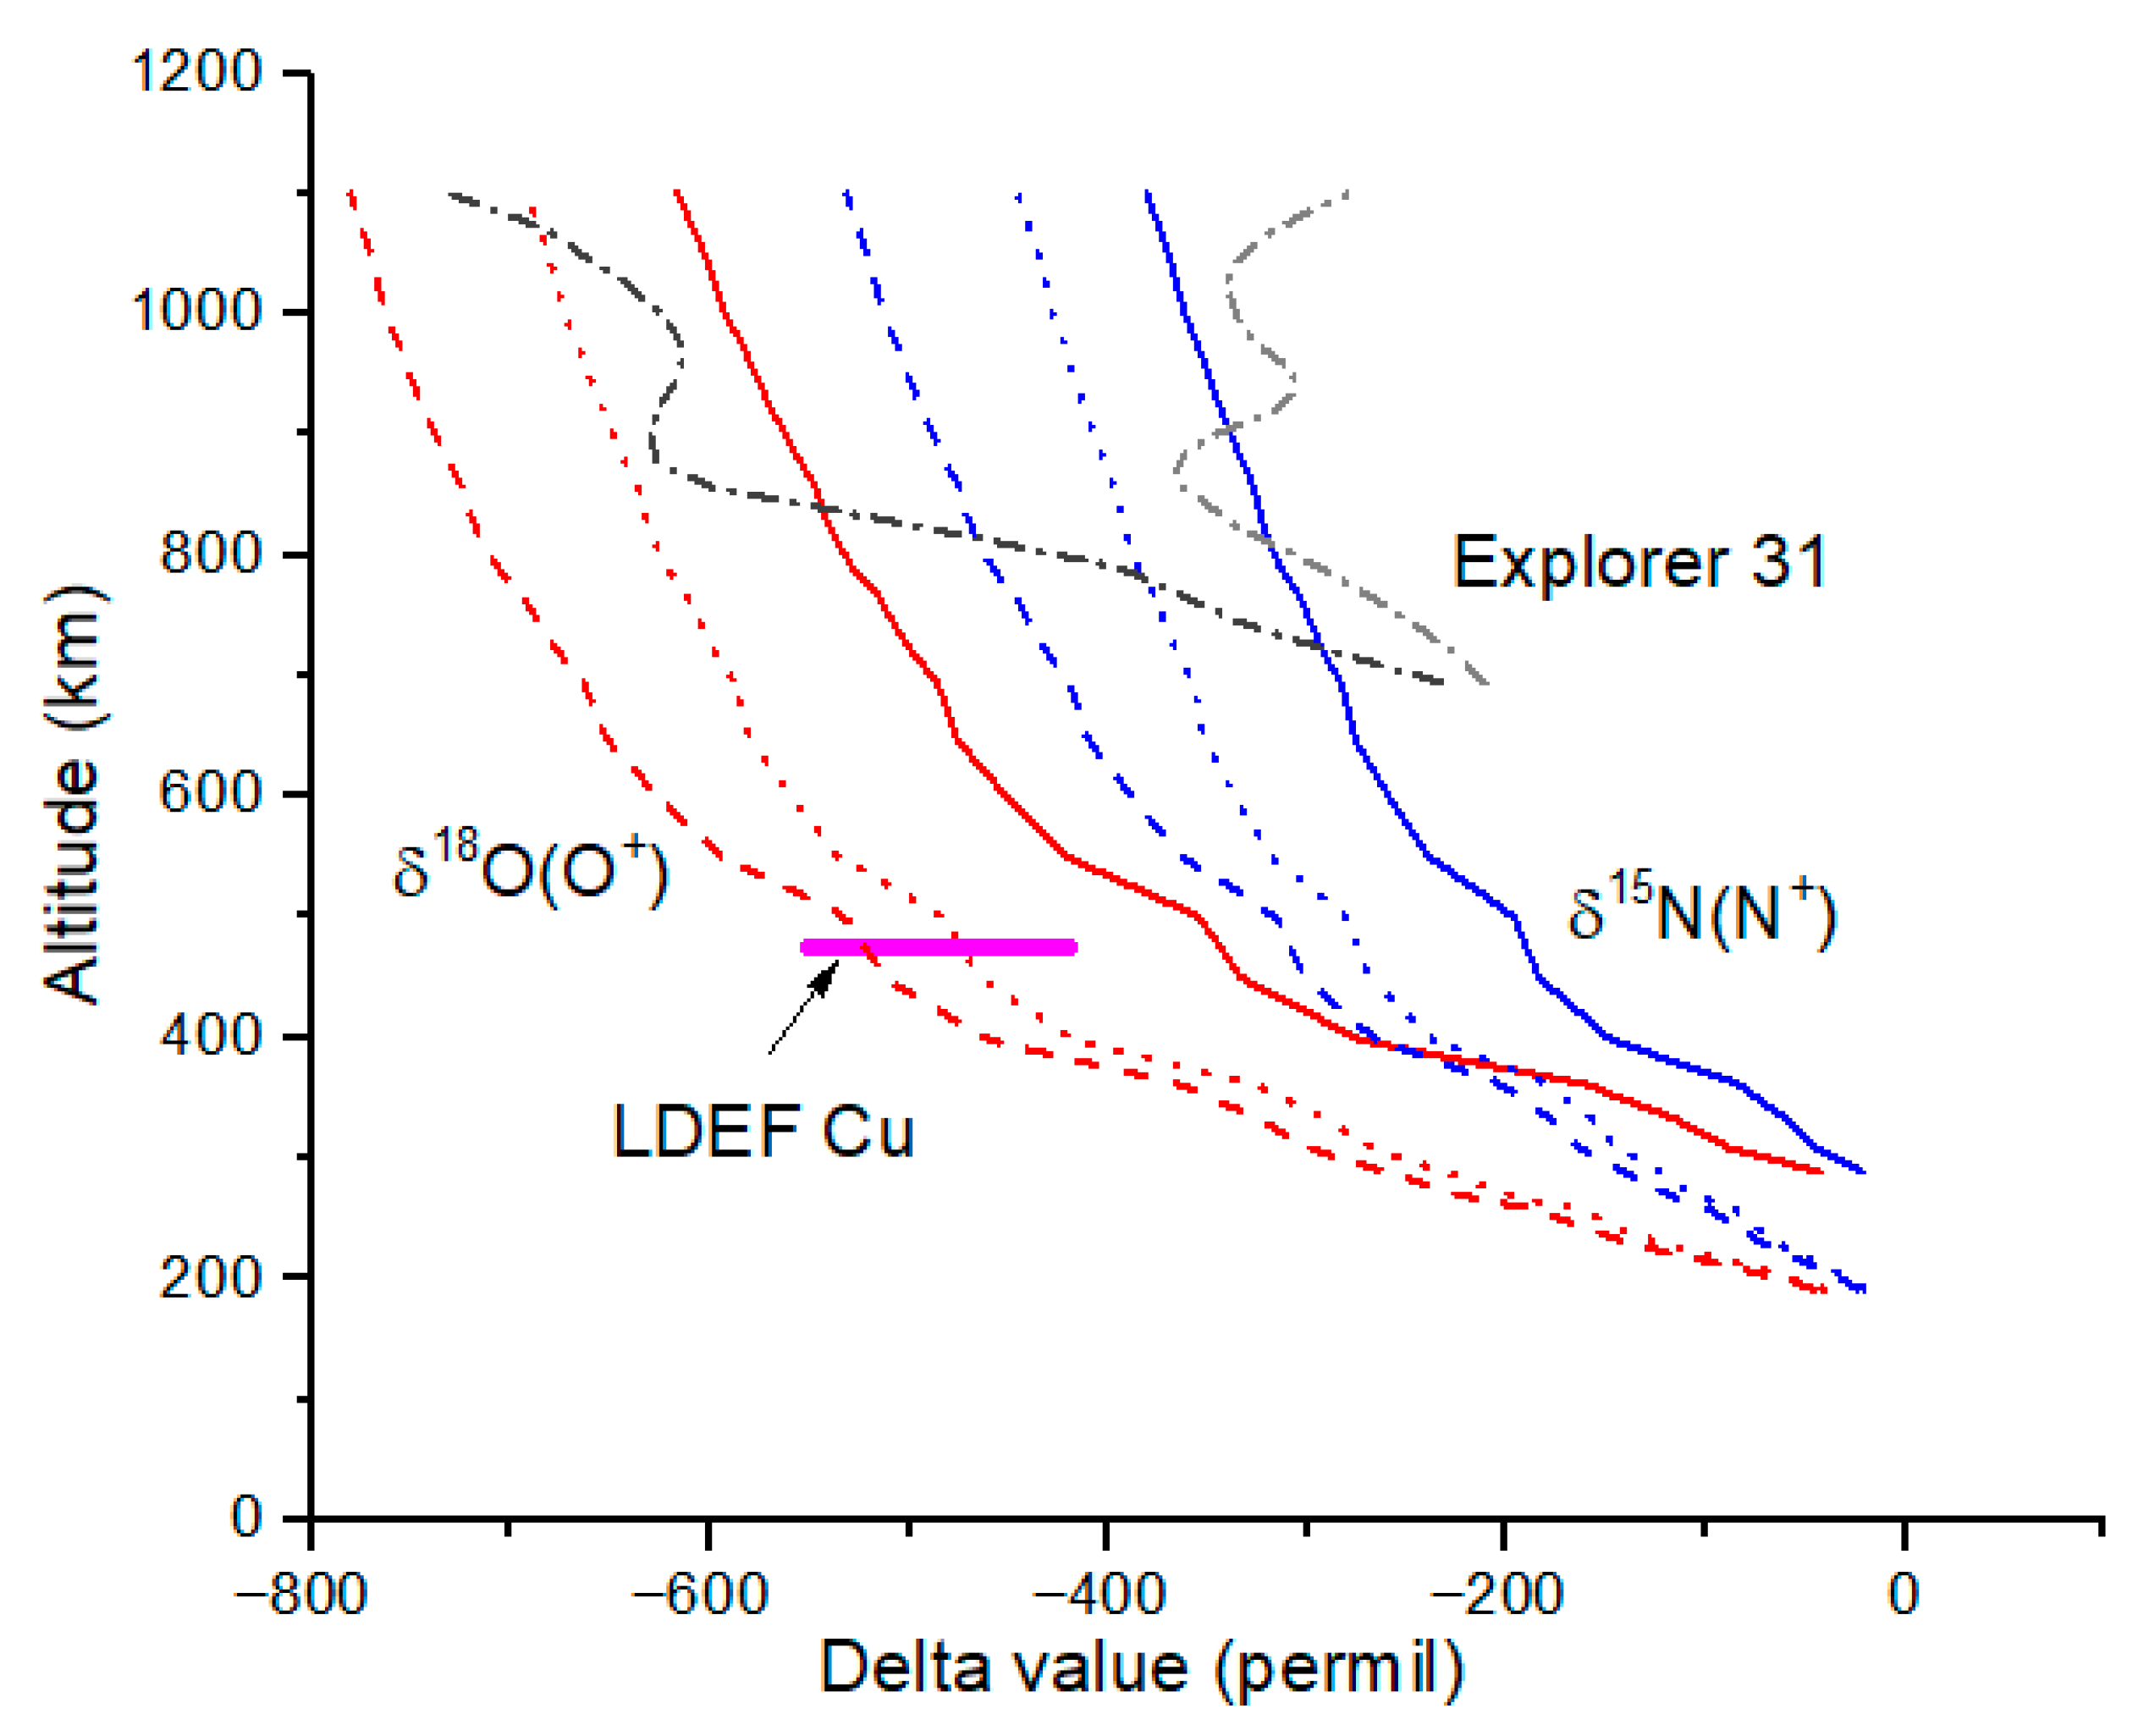
We compute diffusive equilibrium profiles for N
+ and O
+ starting from 190 and 290 km (
Figure 3). Because the ion peaks for N
+ and O
+ are at ~250–300 km (
Figure 1), and because the homopause is at ~100 km, our estimated fractionation at higher altitudes likely underestimates the actual values. Diffusive separation occurs for all species and isotopes above the homopause but affects the atomic neutrals most because of the lower neutral temperature. A 1D vertical photochemical model of the ionosphere will capture this fractionation more accurately. As already noted, our purpose here is to make simple estimates of the isotope fractionation due to diffusive separation of the atomic ions.
At 1000 km, which we take as the boundary between the ionosphere and plasmasphere and as a plausible escape altitude for all ions, diffusive separation reduces delta-values to δ
18O = −600 to −660‰ from the model and −620‰ from spacecraft data (
Figure 3,
Table 2). For N isotopes, δ
15N = −350 to −420‰ from the model and −320‰ from spacecraft data. The agreement between the model δ-values and the Explorer 31 values is poor. This is especially true for δ
18O(O
+), which decreases from −200‰ to −600‰ from 700 km to 850 km for the Explorer 31 data. It is not clear what physical process could be responsible for this dramatic decrease in δ-value; the model results clearly show that diffusive separation alone cannot be the cause.
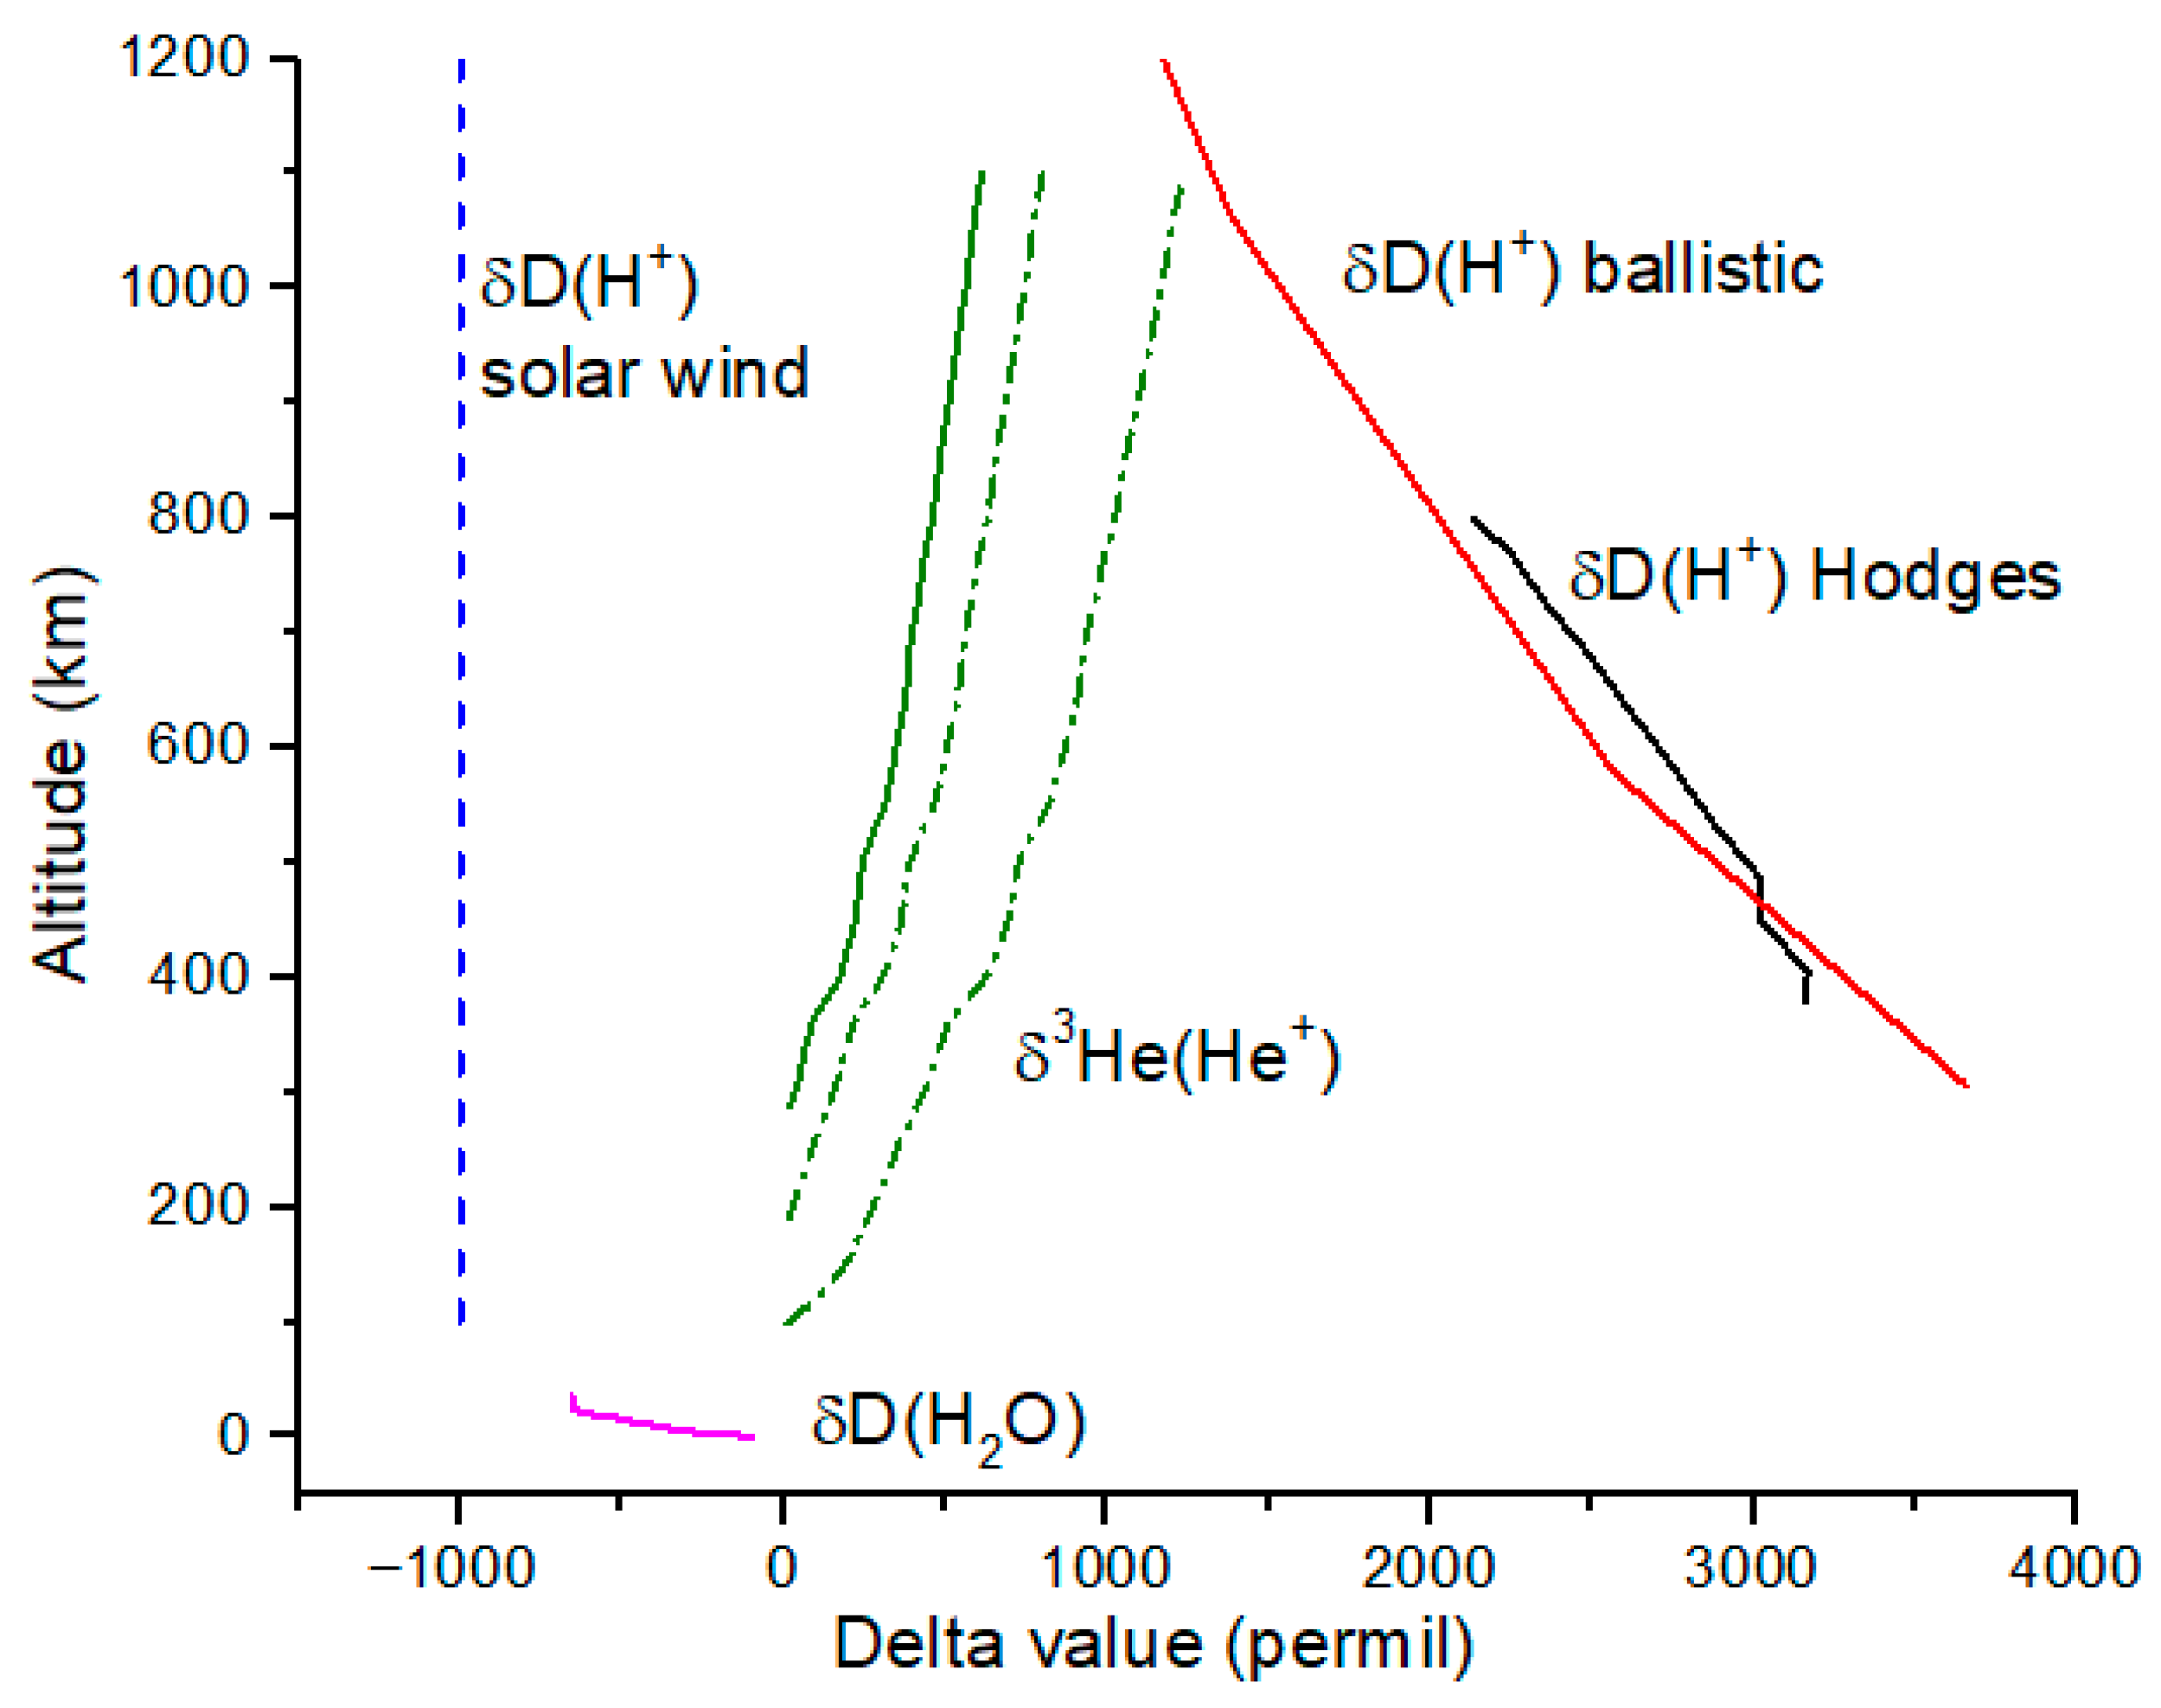
Delta-value profiles for the ionosphere are shown for He
+ and H
+ in
Figure 4. The He
+ profiles are computed using Equation (6) for initial altitudes of 100, 200 and 300 km. Because He does not have a molecular form, we expect the 100 km profile to be most accurate. Diffusive separation enhances
3He relative to
4He, resulting in an increasing δ
3He with altitude for He
+. At 1000 km, δ
3He ~ 1200‰, a substantial enrichment in
3He but still very small compared to the solar wind with δ
3He ~ 3.5 × 10
5‰ for He
2+ relative to Earth atmosphere.
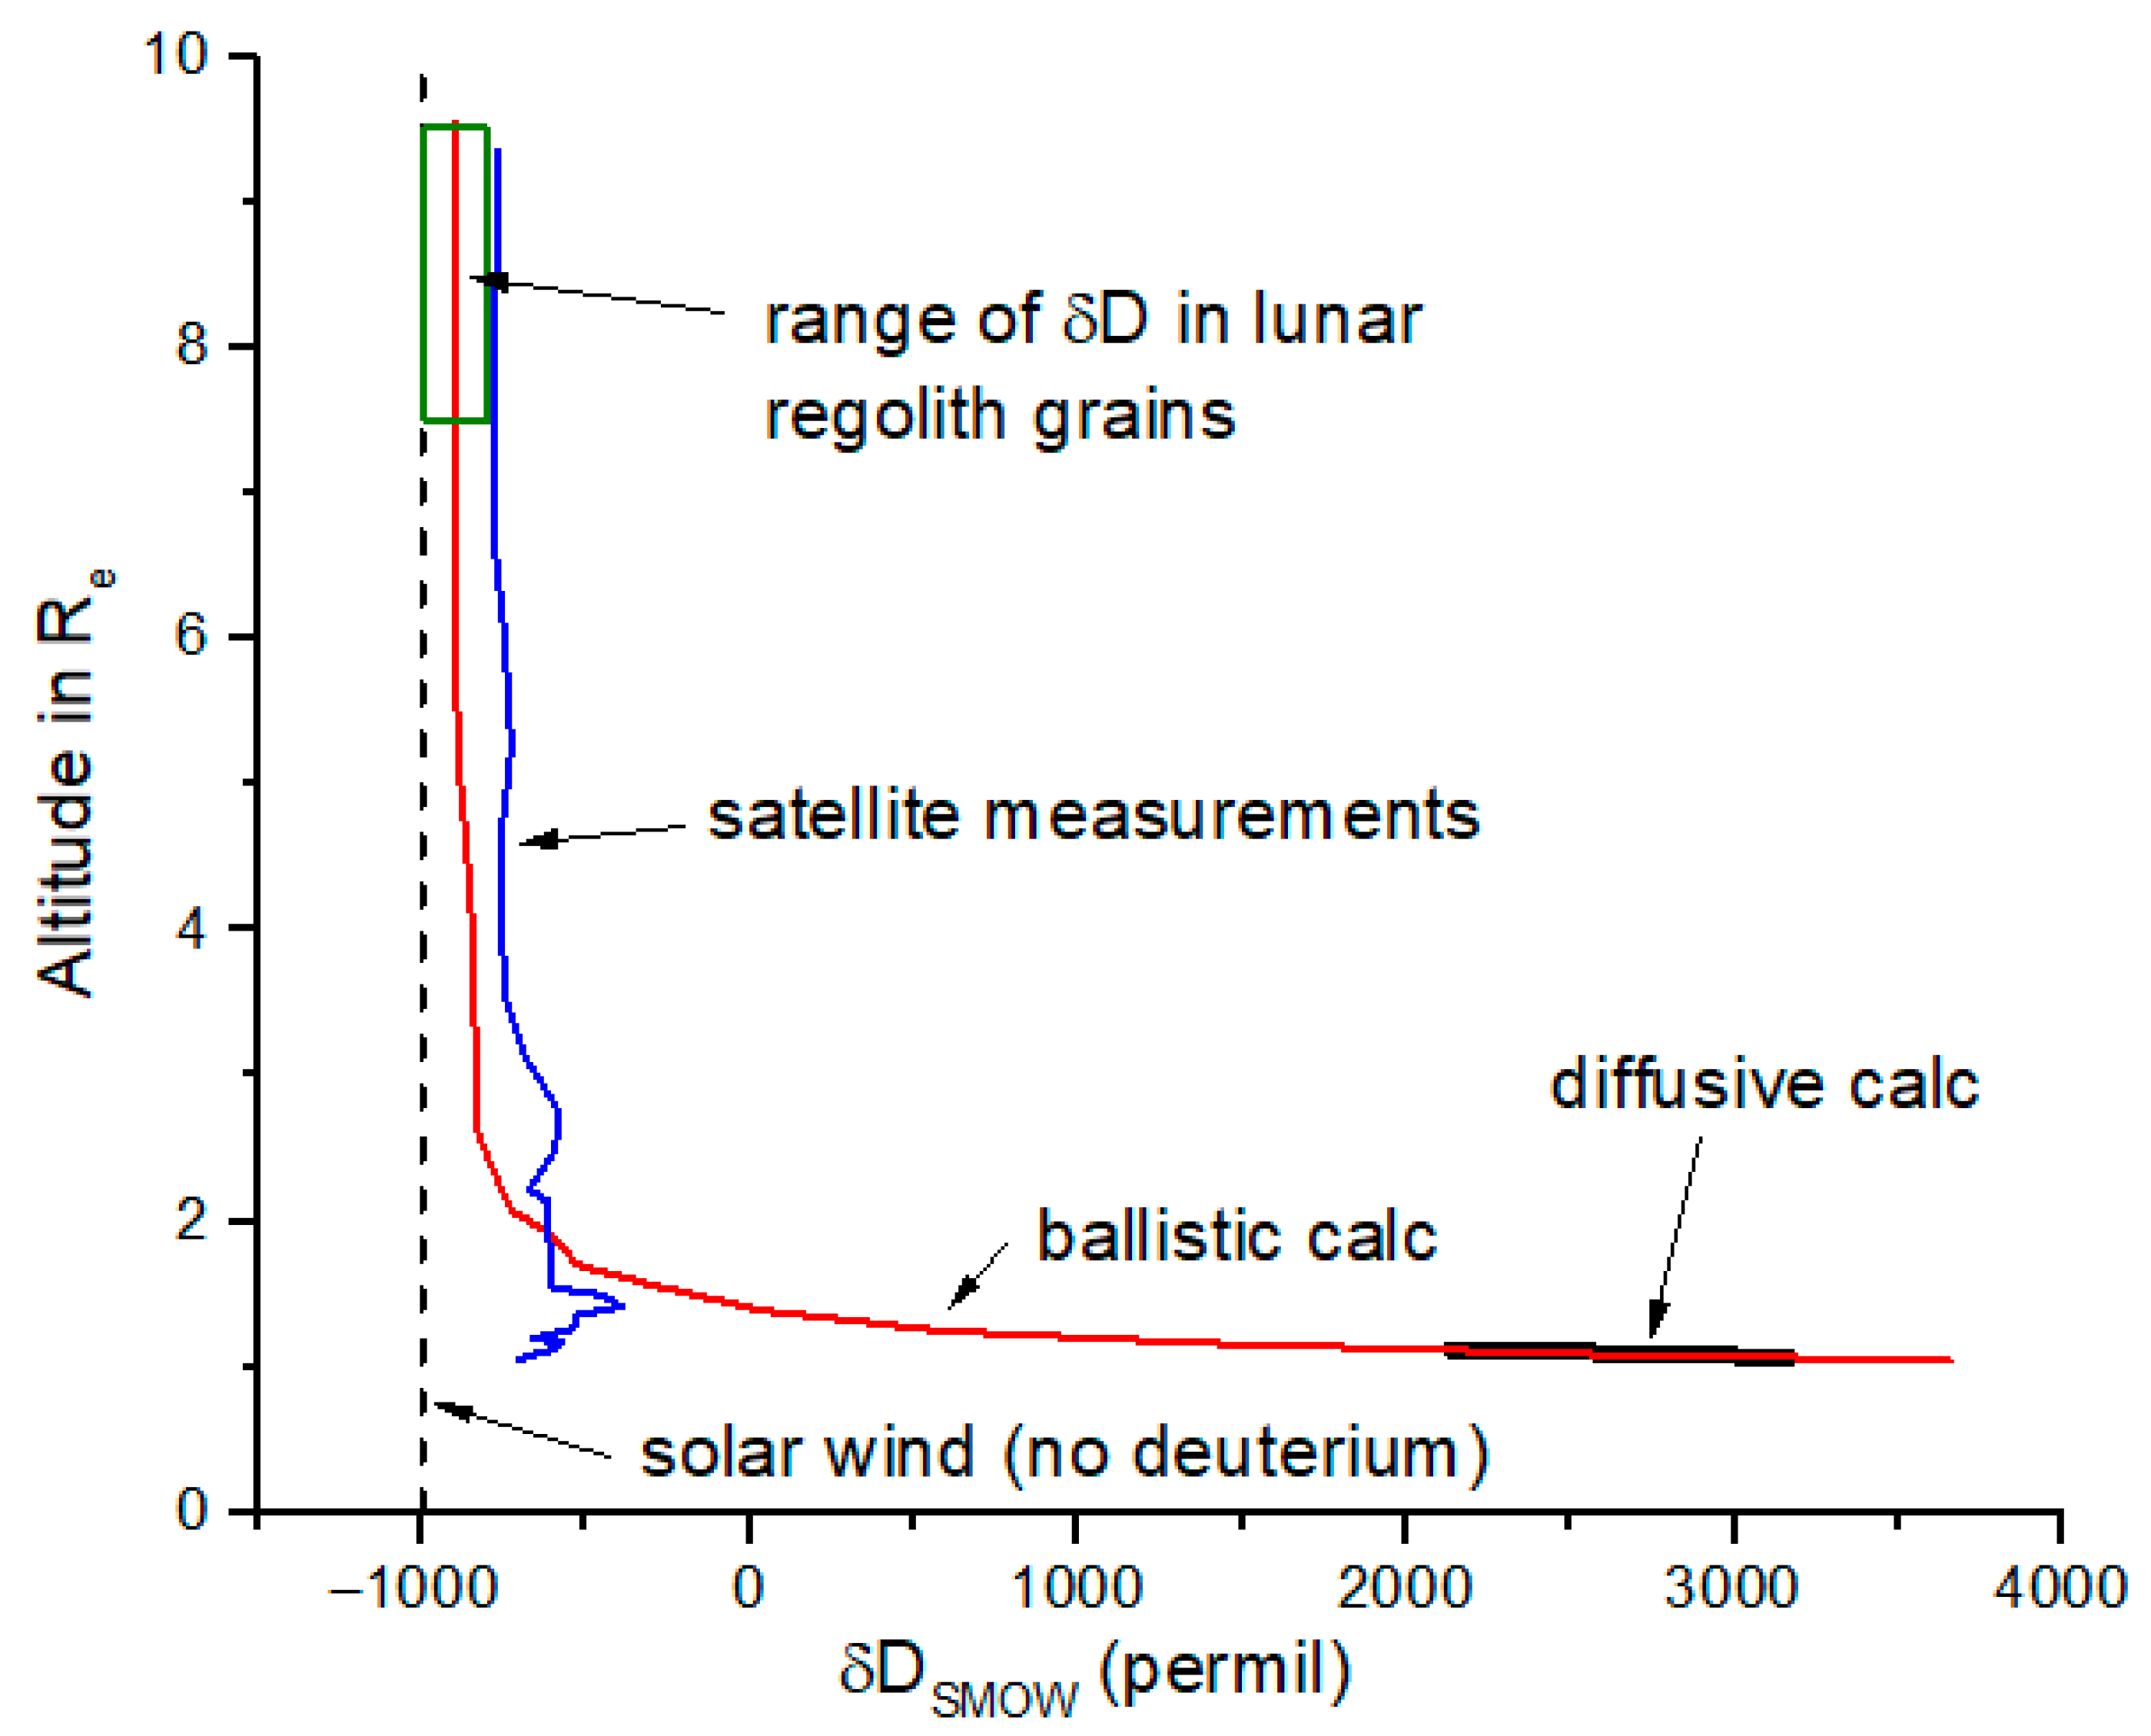
The delta-values profiles for H
+ in
Figure 4 are from ballistic trajectories computed by Hodges (1998) [
11]. Also shown are satellite measurements summarized in reference [
11]. H isotope δ-values in the lower atmosphere below the homopause are highly enriched in D compared to ocean water due to preferential escape of H. Diffusive separation causes a reversal in this trend above the homopause. Deuterium has never been detected in solar wind to within an upper limit of 0.2 ppm; hence, δH of H
+ is nearly −1000‰, the minimum possible value (
Figure 4).
A summary of measured and model isotope ratios at 1000 km is given in
Table 2. Some caveats are necessary for
Table 2 and
Figure 3 and
Figure 4. First, we do not expect escape of mid-latitude ions. They are mostly trapped by the nearly horizontal magnetic field lines. The choice of 1000 km as an escape altitude is therefore somewhat arbitrary. However, since we are not modeling ion escape, we must choose an altitude up to which we compute isotope fractionation due to diffusive separation. Second, these approximate mid-latitude ion isotope ratios may differ significantly from the corresponding ratios in the polar wind. Important physical processes affecting polar wind ion profiles include wave heating, parallel electric fields (parallel to Earth’s B field), electron precipitation, and other processes specific to the polar ionosphere. The addition of ion isotopes to polar wind models [
14] will allow more physically accurate ion profiles to be computed. Third, more modern measurements of isotope number densities in the ionosphere are needed. It is difficult to know how much faith to put in the Explorer 31 minor isotope data.
5. Delta-Values of Ions in the Magnetosphere
The magnetosphere consists of ions derived from the ionosphere and the solar wind, with the ionosphere supplying the majority of the ions heavier than He that have an atmospheric source. The mechanisms of ion injection into the magnetosphere and their corresponding fluxes have long been an important topic in space physics [
1]. The orientation of the vertical component of the interplanetary magnetic field (IMF), B
z, is a key factor. A southward B
z, which we write as B
z ↓, allows for reconnection between the IMF B field and Earth’s magnetic field near the magnetopause. A northward B
z, B
z ↑, forces reconnection to occur closer to the cusps of the magnetosphere. These two scenarios result in different fluxes of solar wind ions entering the magnetosphere. In addition, a southward B
z results in greater geomagnetic activity and enhances the flux of ionospheric ions into the magnetosphere. During times when the IMF field is dominated by a Parker spiral configuration with neither a significant northward or southward component, the influx of solar wind ions is likely diminished but still present.
We compute isotopic delta-values for magnetospheric ions from a flux-weighted sum of solar wind and ionospheric ions. This is highly uncertain at present but will provide a useful benchmark for future studies. We treat the magnetosphere as monolithic, which of course it is not. The plasmasphere, cusp regions, plasma sheet and tail regions receive different flux under different solar and geomagnetic conditions and have different ion residence times. A full 3D magnetospheric model could be used to quantify the isotopic composition of the different components of the magnetosphere, but this would be a major computational task.
Delta-values for the magnetosphere are computed for O ions as follows:
where
ϕ is the flux of ions into the plasmasphere from either the solar wind (sw) or polar wind (pw) and
n has a value of 1 or 6 for the polar wind and solar wind, respectively. Similar expressions apply for N, H, and He ions. The flux of solar wind O ions is given by the following:
where
and
ions s
−1 [
1]. For the polar wind, we have the following:
with a typical O ion fraction of
and
ions s
−1 [
1]. Analogous equations are used for magnetospheric N, He and H ions.
To quantify the ion fluxes for the polar and solar winds, we use the source fluxes from Chappell et al. [
1] for geomagnetically quiet (B
z ↑) and active (B
z ↓) conditions, which include flux ranges corresponding to solar minimum and solar maximum. Chappell et al. [
1] give fluxes for H, He and O ions but do not include N ions. We computed solar wind N ion fluxes by scaling O ion fluxes by the N/O ratio in bulk solar wind as determined from measurement of fluences from Genesis samples with a N fluence of 1.23 × 10
12 cm
−2 and an O fluence of 1.17 × 10
13 cm
−2 [
18]. For polar wind fluxes, we used the ratio of mid-latitude ions measured by Explorer 31 at 1000 km, n(O
+) = 1.5 × 10
4 cm
−3 and n(N
+) = 1.3 × 10
3 cm
−3 (
Figure 1) [
3]. The resulting ion source fluxes to the magnetosphere are given in
Table 3.
Delta-values for N and O ions in the magnetosphere are shown in
Figure 5, along with Explorer 31 data and solar wind value from measurements of Genesis samples. Also in
Figure 5 is the diffusive separation curve for N
+ and O
+ computed using Equation (6). As expected, the polar wind dominates the composition of the N and O ions in the magnetosphere, with the latter’s range shown by the dashed rectangular region close to the ionosphere value at 1000 km for the maximum likely solar wind flux of 1 × 10
28 ions s
−1. The dominance of the ionospheric source over the solar wind source simply reflects the trace abundance of N and O ions in the solar wind (and Sun) versus their dominant presence in Earth’s upper atmosphere.
For H and He ions, we plot both δ-values and ratios because of the wide range of values encompassed by the solar wind and Earth ionosphere. The ionosphere and solar wind isotope ratios are widely separated due to the lack of D in solar wind and the high
3He
2+/
4He
2+ value in solar wind compared to
3He/
4He in the atmosphere. The inset in
Figure 6 shows δ-values for the ionosphere. The magnetosphere value is computed from Equation (7) using δ-values and fluxes in
Table 2 and
Table 3. The D
+/H
+ ratio is 0.95 × 10
−4 which implies a δD ~ −400‰. The magnetosphere value for
3He
2+/
4He
2+ is close to that of the solar wind. We conclude that the polar wind likely contributes significantly to the H isotope composition of H
+ in the magnetosphere.
6. Implications for Implantation of Earth Atmosphere in Lunar Regolith
Ion implantation of lunar regolith by solar wind ions and magnetospheric ions has been often discussed [
5,
6,
21,
22,
23,
24]. The Moon spends about 25% of its orbit within Earth’s magnetotail, so both ion types should be present in the regolith. Recent D/H measurements confirm that regolith mineral grains contain H highly depleted in D, as would occur for solar wind implantation [
21]. Helium-3 has previously been demonstrated to have an abundance in lunar regolith consistent with solar wind implantation [
22].
A weighted sum of the magnetosphere (25%) and solar wind (75%) values in
Figure 5 and
Figure 6 yield the points labeled ‘pw + sw at Moon’, where pw + sw means a weighted sum of polar wind and solar wind ions. For
Figure 5, the pw + sw value is δ
15N = −420‰ and δ
18O = −225‰. Lunar samples this depleted in
18O have not been either seen or inferred to be present in lunar regolith. For the same weighting, H and He isotopes are predicted (
Figure 6) to be very similar to a solar wind ratio for He isotopes and similar to some measurements of H isotopes in lunar silicate grains [
21]. The pw + sw point in
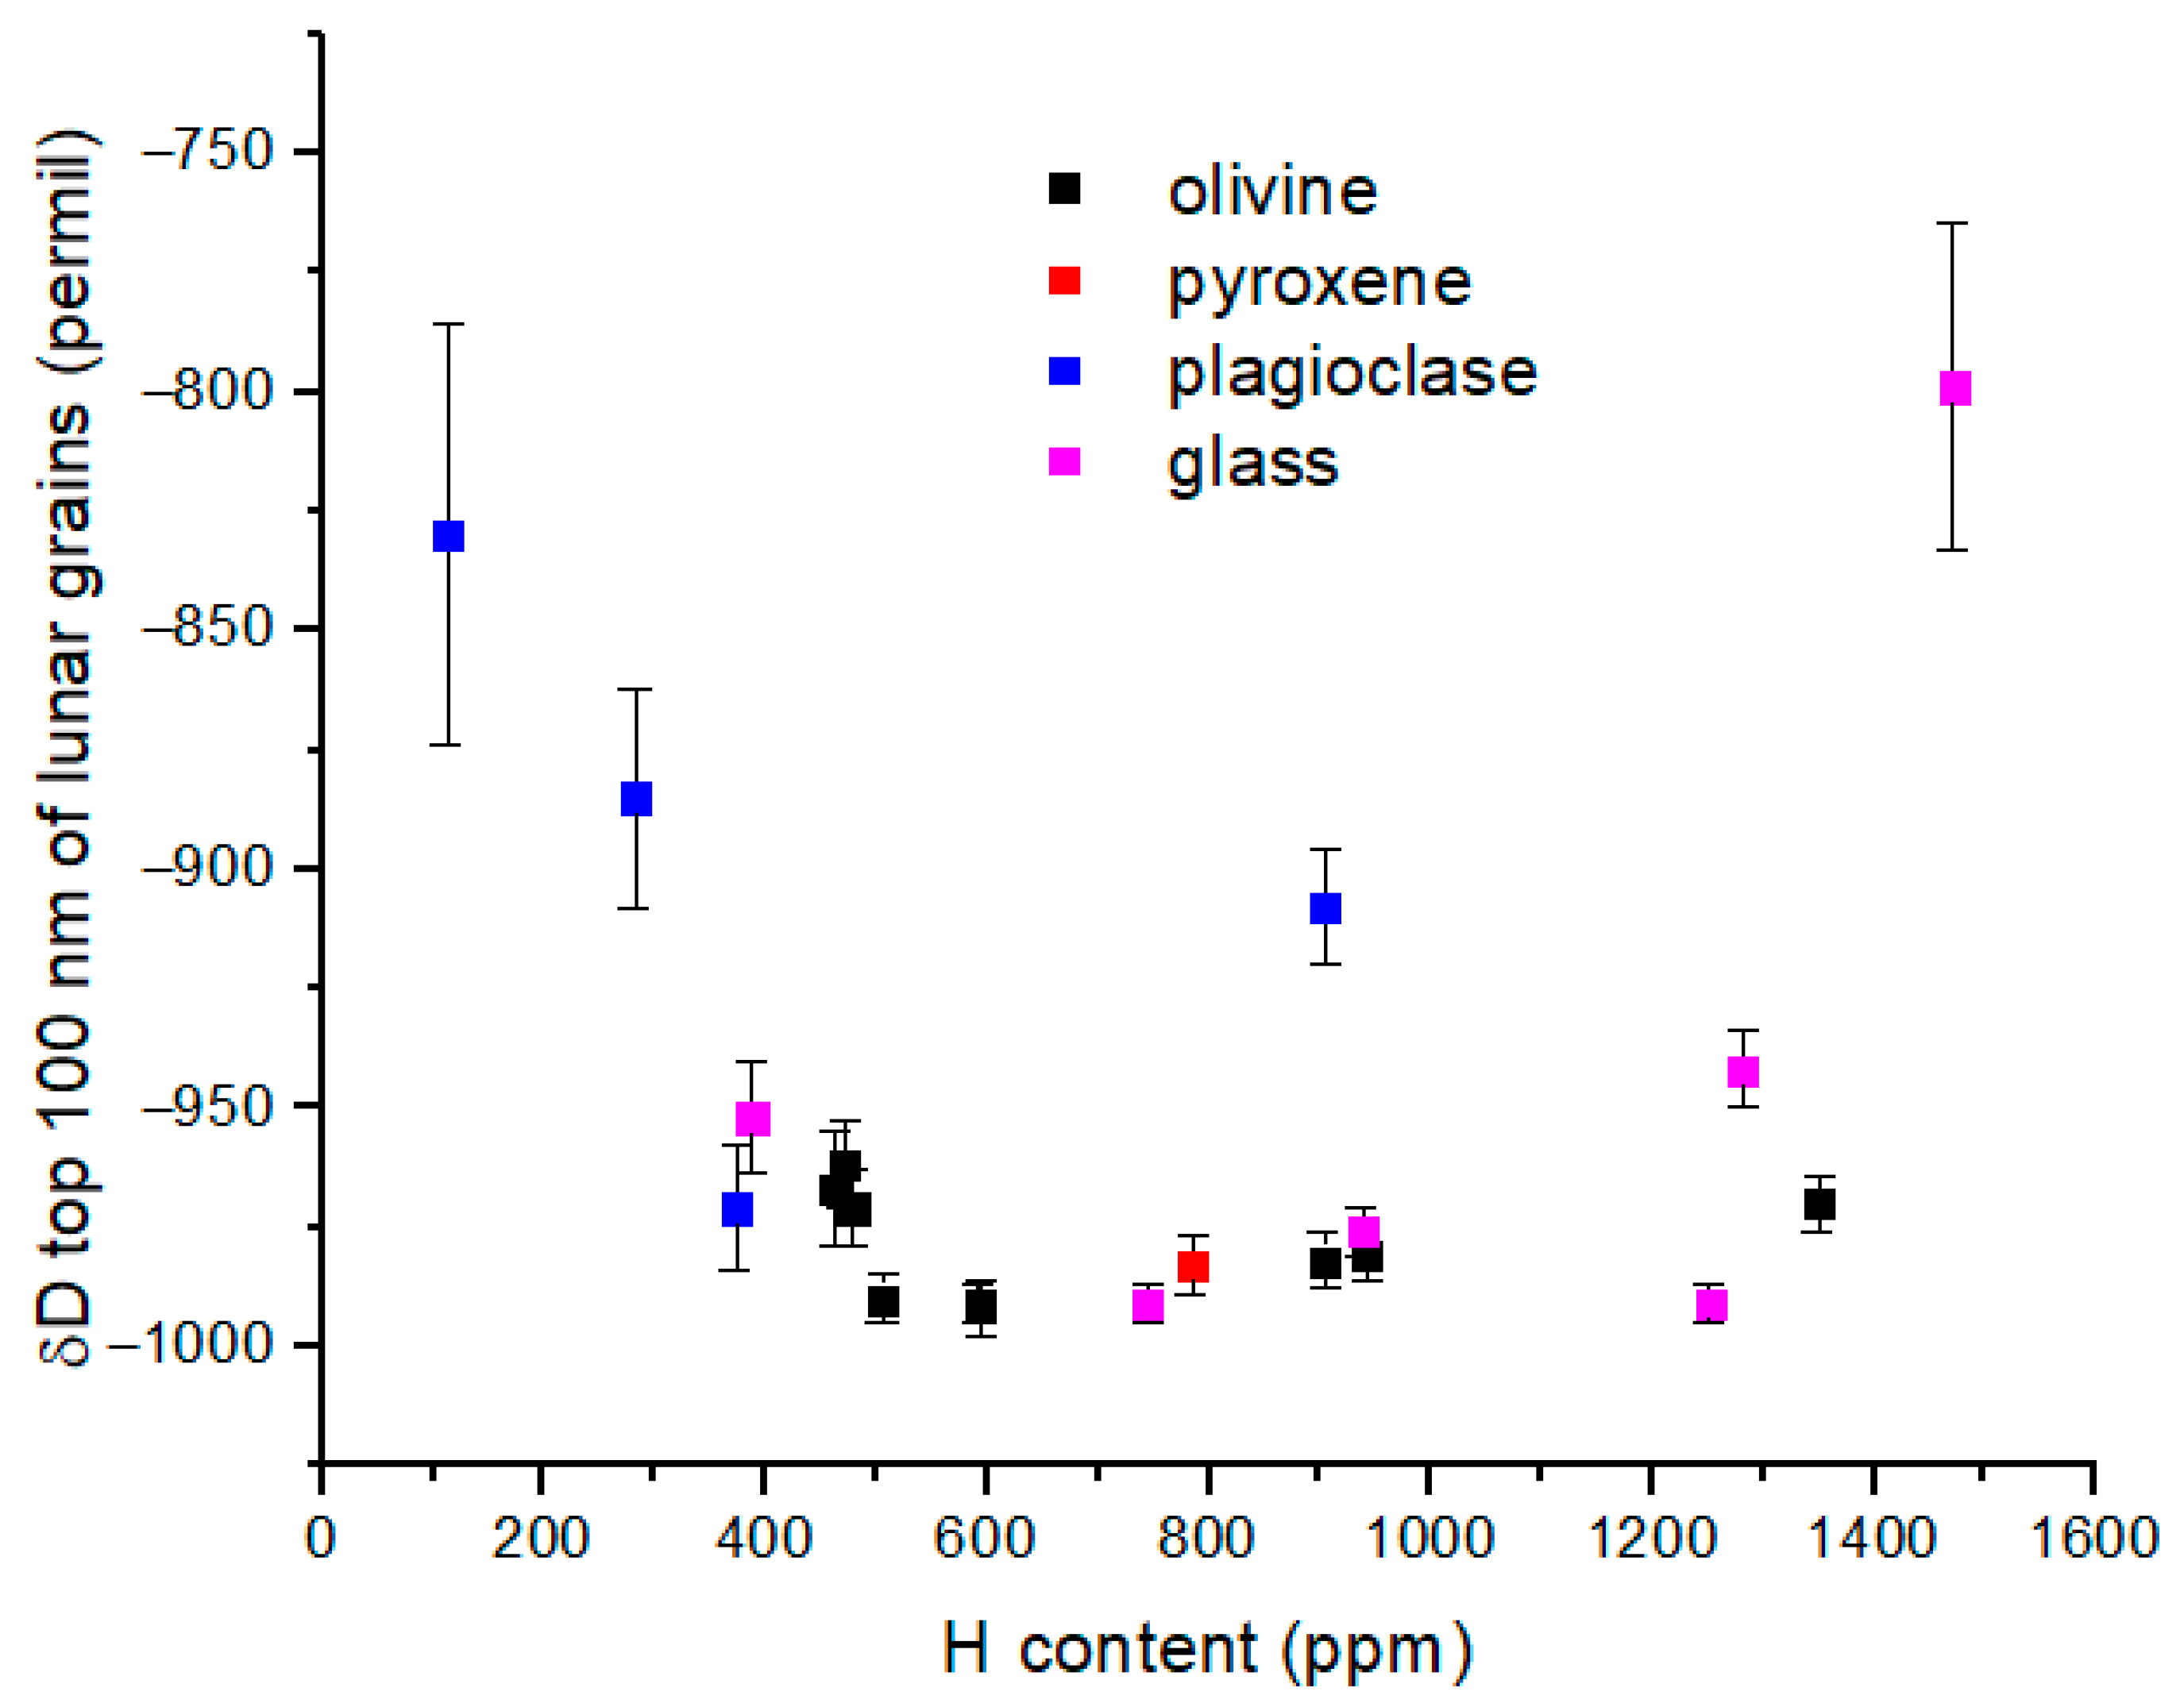
Figure 6 has δD = −850‰, similar to the most D-enriched values measured in lunar silicate grains (
Figure 7) [
21]. It is possible that polar wind protons are present at a measurable abundance in the lunar regolith. However, it must be noted that δD is predicted to decrease rapidly for H
+ in the upper ionosphere and into the plasmasphere according to model calculations from Hodges et al. (
Figure 8) [
11], in which case it becomes more difficult to distinguish polar wind protons from solar wind protons based only on D/H ratio in lunar grains.
A more accurate description of the ion flux at the Moon considers the ion fluxes in the magnetosphere including the possibility of a mass filter effect. Measurements from the ARTEMIS spacecraft in the magnetotail at lunar distance are especially valuable for estimating ion fluxes (Runov et al., 2023) [
7]. Summing over the lunar orbit for H isotopes at the lunar surface, we find the following:
In Equation (10), the subscript ‘tail’ refers to H
+ in the magnetotail at lunar distance, and
forb is the fraction of time the Moon is in the magnetosphere, which is about 25% of the lunar orbit. Ignoring lunar latitude, if we focus only on the lunar nearside, then
forb ≈ 0.5 because the nearside is directed at the Earth when the Moon is in the magnetosphere and is directed partly away from the Sun when the Moon is outside the magnetosphere [
22]. Equation (10) can also be written for O, N and He ions.
Magnetotail protons are derived from both the polar and solar winds. Runov et al. [
7] give estimated ion fluxes at lunar distances while the ARTEMIS spacecraft was in the magnetotail during geomagnetically quiet conditions. The energy–time spectrogram in
Figure 3 of reference [
7] shows the tailward-streaming low-energy ion flux at about 60R
E. These low-energy ions are thought to be from the polar wind. Although ARTEMIS does not have a mass spectrometer, relative masses can be inferred from the spectrogram energies with O
+ at ~500 eV and H
+ at ~30 eV, an energy difference consistent with a low-energy streaming plasma. The differential energy fluxes are 1 × 10
4 and 5 × 10
4 eV cm
−2 s
−1 sr
−1 for O
+ and H
+, respectively.
Ion flux can be estimated from measured the ARTEMIS omnidirectional differential ion flux,
by integrating over energy and solid angle as follows:
Runov et al. [
7] give particle spectra,
, for central plasma sheet (CPS), outer plasma sheet (OPS) and lobe regions, as well as for low-energy ions (LEI), all at 60 R
E. The LEI are sufficiently low-energy (<1 KeV) that we will assume that they follow field lines with a negligibly small pitch angle. Integrating the LEI flux over energy yields 1240 ions cm
−2 s
−1 sr
−1. Multiplying by 4π steradians, the implied directional O
+ flux is 1.6 × 10
4 O
+ cm
−2 s
−1. Taken over the cross sectional area of the Moon, and ignoring potential complexities in the shape of the field lines near the Moon, the LEI O
+ flux at the near side lunar surface is 1.5 × 10
21 ions s
−1. Comparing this to the solar wind flux of O
6+, given by the following:
which for typical values of
nsw = 7 cm
−3 at 1 AU and
vsw = 450 km s
−1 is
ϕ(O
6+) = 2.3 × 10
5 cm
−2 s
−1. Over the lunar cross section, this corresponds to 2.1 × 10
22 O
6+ s
−1 or about 14 times the polar wind flux at the near side. If the LEI flux is polar wind, it is nearly all incident on the lunar near side, whereas only ~½ of the solar wind flux is incident on the near side. The near side solar wind flux is then 1.1 × 10
22 O
6+ s
−1, or about 7 times the LEI flux. If the LEI flux in Runov et al. [
7] is mostly protons rather than O
+, as suggested by the differential energy spectrum for LEI, then the solar wind-to-polar wind ratio would be >>7 for near side implanted ions.
Ion fluxes at the CPS with
β >> 1, OPS with
β ~ 1, and lobes with
β << 1, are much higher than the LEI flux, where
β is the ratio of plasma pressure to magnetic pressure. From Runov et al. [
7], ion fluxes in the plasma sheet and lobes at lunar distance are 1.4 × 10
6 cm
−2 s
−1 (OPS), 1.0 × 10
7 cm
−2 s
−1 (CPS) and 1.1 × 10
6 cm
−2 s
−1 (lobes) over an assumed solid angle of 4π. Many of these ions are at energies >> 1 KeV and so are likely to have non-negligible pitch angles, a complication that we will neglect here. We further assume that these high ion fluxes are ions derived primarily from the solar wind, but polar wind ions may also be present. At a distance of 15R
E, O
+ ions have been measured with ARTEMIS ESA and appear to be contributing to the thinning of the current sheet [
25]. Similar measurements at 60R
E are not possible due to spacecraft charging.
The implications of the above estimates for polar wind ion fluxes at the Moon are clear. For geomagnetically quiet conditions, the solar wind dominates the flux of O ions at the lunar near side surface by at least a factor ~7. A key caveat is that if the plasma sheet or lobes contain a high fraction of polar wind ions, then implantation of ionospheric O
+ may be a more important process. For geomagnetically active conditions, the polar wind fluxes of O
+ and N
+ are ~3–4 times higher than for geomagnetically quiet conditions, and the injection of solar flux ions into the magnetosphere is a factor of 2 smaller (
Table 3). Thus, for active conditions, the polar wind flux of O
+ and N
+ is ~2 times smaller than the solar wind flux of O
+ and N
+ at the near side. To evaluate δ
18O(O
n+) in the magnetotail at lunar distance, we calculate the following:
where the fluxes are evaluated at lunar distance. LEI refers to the low-energy ions believed to be of polar wind origin, and HEI refers to the OPS, CPS and lobe ions, most of which are probably of solar wind origin. The total HEI flux from reference [
7] is 1.3 × 10
7 cm
−2 s
−1. From Equation (8), the O
+6 fraction of the HEI flux is 9.6 × 10
3 cm
−2 s
−1. From Equation (13), we find
= −410‰. If the LEI flux at lunar distance is mostly atmosphere-derived protons with an H
+ flux 5 times higher than the O
+ flux, the δ
18O in the tail is −210‰. The latter value is probably more realistic. Using the version of Equation (13) for H
+, we find
= −997‰ because we assumed that all HEI ions derive from the solar wind. This assumption leads to a result that differs from our earlier results using the Chappell [
1] model and illustrates the degree of uncertainty present in some aspects of our analysis.
Finally, we use Equation (10) to estimate the isotopic composition of ions at the lunar surface integrated over the year. Using the results of reference [
7] and with the assumptions stated above, δD(H
+) at the lunar near side is the solar wind value of ~−1000‰. If there is s substantial fraction of polar wind H
+ in the high-energy ions, then δD(H
+) > −1000‰. On
Figure 6, this result would imply a ‘pw + sw’ value at the Moon that essentially coincides with the
Genesis value. For O ions at the lunar surface, the O-version of Equation (10) yields
= −130‰, assuming that all LEI ions are polar wind O
+, and −110‰, assuming LEI ions with a 5 times higher H
+ versus O
+ flux. Given that a similar scaling will apply to N ions, this moves the ‘pw + sw’ result on
Figure 5 quite close to the solar wind result.
Whether the polar wind O
+ signature is recognizable in lunar regolith may depend on the fraction of time geomagnetically active conditions are present. From the NOAA Space Weather Scales, the total number of geomagnetic storms from minor to severe are ~2600 per 11-year solar cycle [
26]. If we assume an average storm duration of 1 h for all storms, the fraction of time geomagnetic storms occur is about 2.7% over a solar cycle. The weighted delta-value on the lunar near side averaged over the geomagnetic cycle is then as follows:
Future analyses of ARTEMIS data will hopefully provide insight into the ion fluxes present at lunar distance during geomagnetically active conditions. It is possible that the polar wind O+ flux is significantly higher at the Moon during active conditions, even more so than would be inferred from the Chappell model.
Summarizing the results of this section, as a first approximation to isotopic composition of ions at the lunar surface, we assumed the Moon to be within Earth’s magnetosphere for 25% of its orbit. We then computed ion fluxes into the magnetosphere from the model of Chappell et al. [
1] and assigned appropriate isotope ratios (δ-values) for polar wind and solar wind ions. This approach yields
Figure 5 and
Figure 6, which exhibit a dominance of polar wind on the isotope signatures of O
+ and N
+ and a significant contribution to H
+. In contrast, the He ion isotope ratio is set by the solar wind. However, this approach only informs us about ions in the near-Earth magnetosphere. We then used results from Runov et al. [
7] to attempt to constrain ion abundances in the magnetotail at lunar distance and during geomagnetically quiet conditions. If we assume that low-energy ions (LEI) are derived from the polar wind, and that more energetic ions observed in the plasma sheet and lobes (high-energy ions or HEI) are derived from the solar wind, then the isotopic composition of the ions present at the lunar surface is dominated by solar wind. A quantitative assessment of ion fluxes at lunar distance for active conditions has not yet been conducted. The dominance of the implantation of solar wind over polar wind ions is consistent with the lack of atmospheric isotope signature (due to diffusive separation) in lunar regolith isotope measurements.
7. Implications for O Isotopes in Metal Grains in Lunar Regolith
Measurements of oxygen isotopes in metal grains in lunar regolith have revealed that additional processes must be present. Lunar regolith metal grains are valuable for studying O isotope implantation and/or delivery to the lunar surface because of their low inherent O abundance. One set of O isotope measurements showed evidence for implanted O with a large
17O depletion, Δ
17O ~ −20‰ [
23], which is roughly consistent with solar wind values from
Genesis [
27]. Another set of measurements of revealed a
17O enrichment of Δ
17O ~ +26‰ [
24]. The latter
17O enrichment resembles that of stratospheric O
3, and has been attributed to atmospheric O via an ‘Earth wind’ [
5]. Escape of stratospheric O
3 is not possible due to the overlying atmosphere, but escape of O
+ occurs via the polar wind, as we have discussed above.
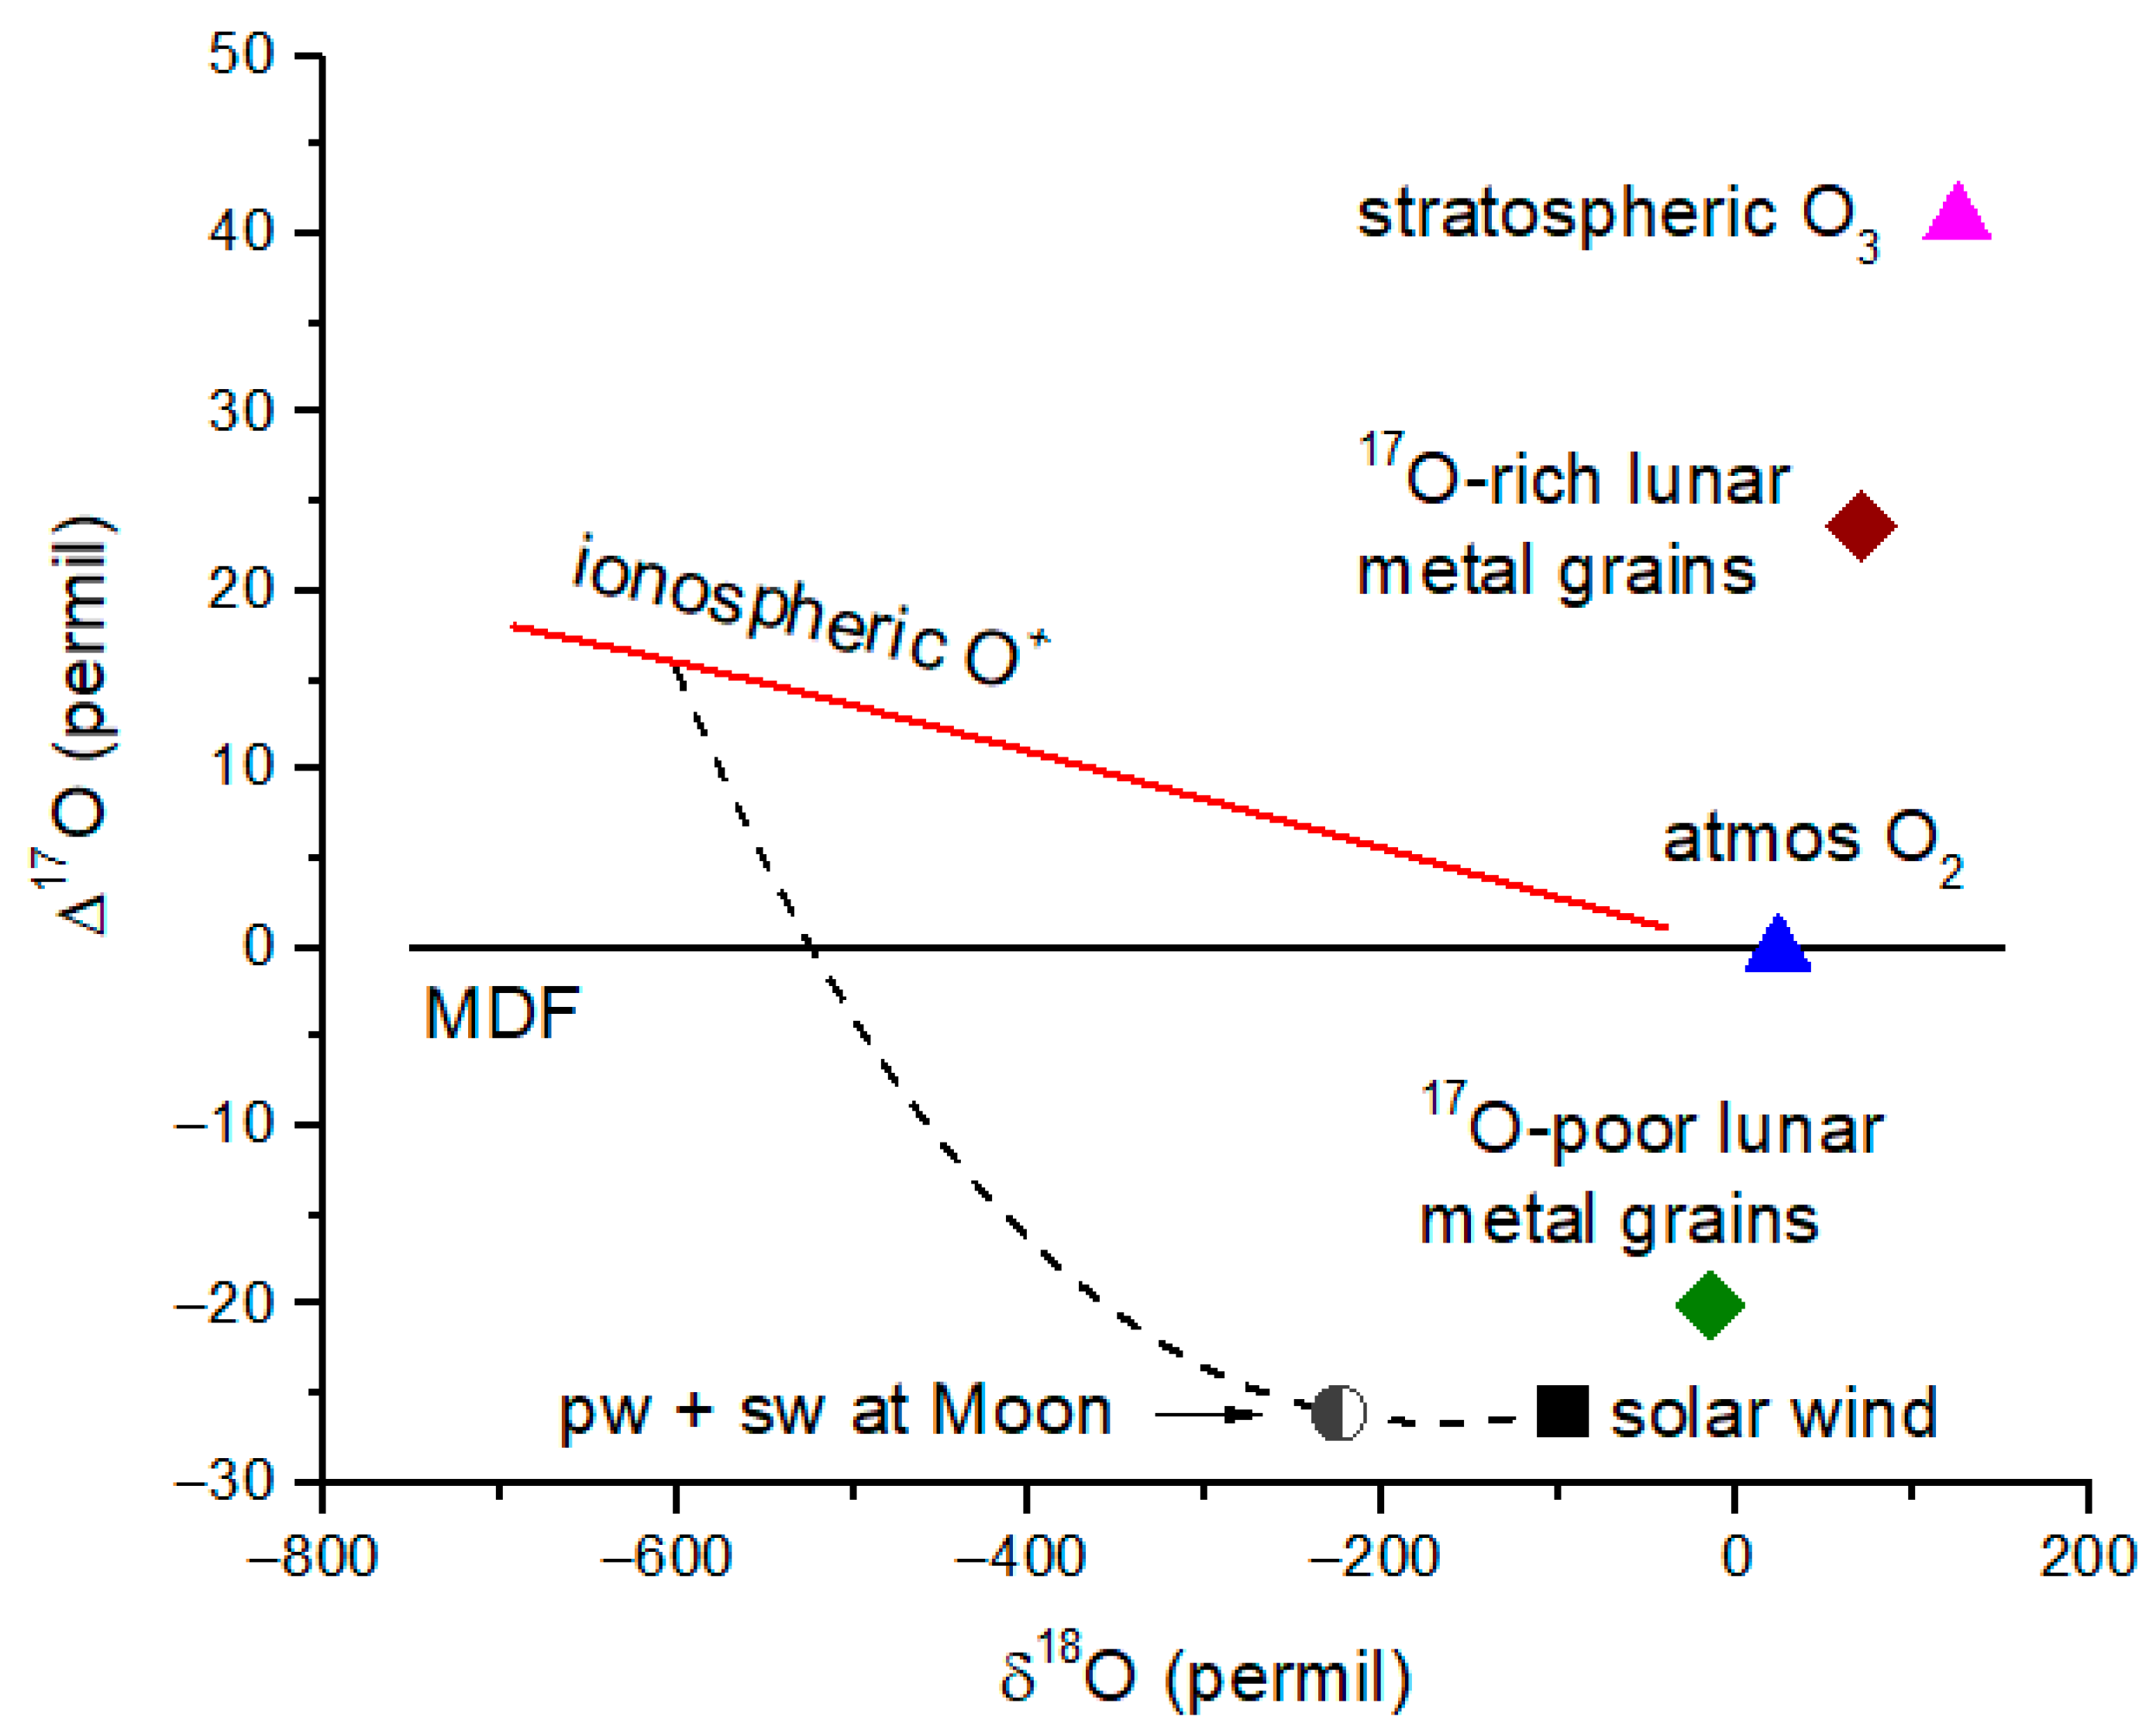
Figure 9 summarizes the relevant reservoirs and fractionation processes for O isotopes in the magnetosphere, atmosphere and solar wind. The
17O-rich and the
17O-poor measurements in lunar metal grains are shown, together with atmospheric O
2 and O
3 and solar wind values from
Genesis. Diffusive separation of the isotopes of O
+ produces an extreme depletion in
18O at an altitude ~1000 km as previously shown in
Figure 3. In addition, diffusive separation yields a
17O enrichment of about 17‰ due to gravitational fractionation [
14]. This
17O enrichment is similar to that of the
17O-rich metal grains, but because of the extreme depletion of
18O, we must reject the suggestion of an atmospheric origin for the isotope signatures measured by Ireland et al. (2006) [
24]. A reanalysis of lunar metal grains shows that the
17O-rich signature is 5–10 times more prevalent than the
17O-poor signature [
28]. We consider briefly what this source might be.
An isotope mixing line in
Figure 9 (dashed line) shows the expected delta-values for a mixture of polar wind (ionosphere at 1000 km) and solar wind, with the ‘pw + sw’ point having a solar wind weighting of 75%. It is clear from
Figure 9 that there is not any combination of polar wind and solar wind that can reproduce the
17O-rich metal grains, from which we conclude that Earth atmosphere is not responsible for the
17O-rich metal grain signatures.
Since the
17O-rich signature is not solar and cannot be from Earth’s atmosphere, it must be either brought in by interplanetary dust particles (IDPs) or produced by reactions with energetic protons at the surface. We estimate an IDP flux at the lunar surface of 510 tons yr
−1 [
29]. For an IDP composition that is ~1/2 O by mass, the IDP flux delivers an O atom flux of
fO,IDP ~ 7.9 × 10
5 O atoms cm
−2 s
−1. As we’ve already determined, the solar wind flux of O
6+ ions is
fO,SW ~ 2.3 × 10
5 cm
−2 s
−1, a factor of 3.4 lower than
fO,IDP. Oxygen isotope ratio measurements on IDPs collected from the stratosphere show broadly chondritic values, with some particles exhibiting distinctly positive or negative Δ
17O values [
30]. Based on these IDP measurements, there would appear to be an insufficient flux of IDPs with Δ
17O > 0 to account for Ireland et al.’s observations [
24]. The surface vaporization flux from incoming IDPs and meteoroids is estimated to be equivalent to a production of 2.0 × 10
7 O atoms cm
−2 s
−1 [
29], which may be large enough to allow for non-statistical chemical effects at the lunar surface.
Recent infrared measurements of H
2O on the lunar surface demonstrate the presence of water at multiple orbital phases [
31,
32]. The depth of IR absorption does not vary significantly as the Moon passes in and out of Earth’s magnetotail, either suggesting a magnetospheric source of water [
31] or a non-ionic source of water. The isotopic composition of the water is unknown, but H isotope measurements are consistent with a high fraction of solar wind H [
21]. If the solar wind is supplying the H and the polar wind is the source of the O, then the lunar surface water would be among the most isotopically depleted water reservoirs in the solar system. Other sources of H or H
2O include the lunar interior, while O could be derived from regolith silicates or from IDPs. In this case, the lunar surface water may be isotopically similar to SMOW. A combination of solar wind H and crustal O is possible as well. Isotope ratio measurements of lunar regolith water would resolve the provenance of lunar surface water.
8. Discussion
There are many aspects of this work which can be improved or expanded upon. As we discussed above, adding isotopes to existing polar wind models [
12,
13] is an essential step in quantifying the escape fluxes for isotopic ions. Inclusion of isotopic ions in quantitative models of ion transport in the plasmasphere and magnetosphere would necessarily follow. The importance of diurnal, seasonal and solar cycle variations in isotopic escape fluxes needs to be investigated. Another important issue, already touched on, is how the escape fluxes of isotopic ions vary from geomagnetically quiet to active conditions. The precipitation of soft electrons [
33] that often accompanies active conditions will likely modify ion escape rates and may reduce the isotope fractionation generated by diffusive separation due to an elevated plasma temperature profile.
Within the ionosphere and magnetosphere models is the fundamentally important quantity,
νin, the ion-neutral collision frequency. It plays a key role in determining electrical conductivities in the ionosphere and plasma transport properties in the magnetosphere. It is instructive to consider how
νin varies with isotope mass. For elastic ion-neutral collisions involving an ion and induced-dipole interaction, the collision frequency is [
34]
where
nn is the neutral gas number density,
mn and
mi are the neutral and ion masses,
μin is the reduced mass, and
αn is the neutral gas polarizability. Designating the collision frequency for rare isotopic ions as
, the ratio of common-to-rare isotopic collision frequencies is
For the cases of 17O+-16O and 18O+-16O collisions, the collision frequency ratio from Equation (16) is 1.047 and 1.093, respectively, which are large enough to lead to additional isotope fractionation in transport models. However, the rare isotopes of interest (D, 3He, 15N, 17O, 18O) are quite low in abundance, so it would be surprising if the isotopes made large changes in plasma properties.
9. Conclusions
Isotope ratios for He
+, N
+ and O
+ have been estimated for Earth’s topside ionosphere, assuming diffusive equilibrium conditions, and combined with previous calculations for H
+. Diffusive separation produces isotope ratio profiles in fair agreement with mid-latitude Explorer 31 mass spectrometer data for O
+ and N
+. Using these ionospheric isotope ratios, the isotopic composition of the magnetosphere has been estimated by summing the polar wind (approximated using the mid-latitude ionosphere) ion fluxes with solar wind ion fluxes using the source fluxes of Chappell et al. (1987) [
1]. As expected, N and O ions in the magnetosphere come primarily from the polar wind, while He ions come primarily from the solar wind. Protons are contributed by both the atmosphere and the solar wind, producing a proton isotopic composition in the magnetosphere that is strongly dependent on the ion escape altitude, here assumed to be 1000 km.
It has been previously suggested that the polar wind (Earth wind) contributes significantly to the lunar regolith by implantation of magnetospheric ions during the 25% of the time the Moon resides in the Earth’s magnetosphere. We show here that the very extreme depletion in 18O due to diffusive separation in the ionosphere implies a very small contribution of polar wind ions to the lunar regolith. Polar wind O+ is not consistent with measured O isotopes in lunar regolith. Most likely, the 17O-rich lunar metal grains require the input of planetary material such as IDPs to the lunar surface.
In addition, we used ARTEMIS data at lunar distance from Runov et al. [
7] to estimate the heavy ion implantation flux at the Moon for geomagnetically quiet conditions. Assuming that low-energy ions (LEI) are derived entirely from the polar wind escape flux, the implied atmospheric implantation flux is even lower than for our estimate using the Chappell model. Thus, not only are atmospherically derived O
+ ions not consistent with lunar regolith isotope measurements due to diffusive separation but the flux of heavy LEI appears to be too low to compete with solar wind implantation of O ions. The latter result may change during active conditions.
With respect to future work, adding isotopes to existing polar wind models should be a priority. Measurements of isotope ratios in the polar ionosphere would be valuable to achieve a better understanding of the escape process. Measurements of D+ or other isotopic ions in the plasmasphere or magnetosphere, while difficult due to their low abundances, would be valuable as a tracer of polar wind input. Because D+ and He2+ have the same mass-to-charge ratio for low-resolution mass spectrometers, careful consideration must be given to how to avoid mass interference with He2+. Even with these difficulties, we argue for an expanded role for isotopic analysis in space physics.
