Article

Occurrence and Atmospheric Patterns Associated with Individual and Compound Heatwave–Ozone Events in São Paulo Megacity

by
Vanessa Silveira Barreto Carvalho
1,
Paola do Nascimento Silva
1,
Aline Araújo de Freitas
1,
Vitor Lucas dos Santos Rosa Tenório
1,
Michelle Simões Reboita
1,*,
Taciana Toledo de Almeida Albuquerque
2 and
Leila Droprinchinski Martins
3
1
Instituto de Recursos Naturais, Universidade Federal de Itajubá—UNIFEI, Av. BPS, 1303, Itajubá 37500-903, MG, Brazil
2
Departamento de Engenharia Sanitária e Ambiental, Universidade Federal de Minas Gerais—UFMG, Belo Horizonte 31270-901, MG, Brazil
3
Campus Londrina, Universidade Federal Tecnológica do Paraná—UFTPR, Av. dos Pioneiros, 3131, Londrina 86036-370, PR, Brazil
*
Author to whom correspondence should be addressed.
Atmosphere 2025, 16(7), 822; https://doi.org/10.3390/atmos16070822
Submission received: 19 May 2025 / Revised: 29 June 2025 / Accepted: 4 July 2025 / Published: 6 July 2025
(This article belongs to the Section Meteorology)

Abstract

High ozone (O3) concentrations are frequently recorded in São Paulo Megacity, with extreme O3 levels often linked to high temperatures and heatwaves, phenomena expected to intensify with climate change. The co-occurrence of extreme O3 and heatwaves poses amplified risks to environmental and human health. Hence, this study aims to analyze individual and compound extreme O3 and heatwave events and assess the associated atmospheric patterns. Hourly O3 and temperature (T) data from 20 sites (1998–2023) were used to calculate the maximum daily 8 h average O3 (MD8A-O3) and maximum daily temperature (Tmax). The Mann–Kendall test identified trends for these variables. The 90th percentile of data from September to March defined thresholds for extreme events. Events were classified as extreme when MD8A-O3 and Tmax exceeded their thresholds for at least six consecutive days. ERA5 data were used to evaluate atmospheric patterns during these events. The results show positive trends in MD8A-O3 in 62% of sites, with values exceeding WHO Air Quality Guidelines, alongside positive Tmax trends in 90% of sites. Over the study period, four compound events, seven heatwaves, and four extreme O3 events were identified. Compound and individual events were associated with the South America Subtropical Anticyclone and positive temperature anomalies. Individual O3 events were linked to cold anomalies south of 30° S and positive geopotential height anomalies at 850 hPa. These findings highlight the increasing occurrence of extreme O3 and heatwaves in São Paulo and their atmospheric drivers, offering insights to enhance awareness, forecasting, and policy responses to mitigate health and environmental impacts.

1. Introduction

More than 55% of the world’s population currently lives in urban areas, a figure expected to rise to 68% by 2050 [1]. This urbanization trend contributes to the expansion of metropolitan areas with populations exceeding 10 million, known as megacities [2]. These urban hubs are highly vulnerable to environmental challenges such as air pollution [3,4,5,6] and climate change [7,8]. The detrimental effects of air pollution on human health, including exacerbation of existing conditions and increased mortality, are well-documented [9,10,11,12,13]. Similarly, climate change directly impacts health through extreme weather events [8,14,15] and disrupts urban infrastructure, affecting water quality, energy systems, and more [7,8]. Those effects caused by air pollution and climate change are responsible for economic losses and other adverse impacts, especially to those who are economically and socially vulnerable [8,16,17].
Although often treated separately, air pollution and climate change are closely interconnected through emissions, atmospheric chemistry, and physics [18]. Air pollution is directly influenced by weather and climate, and climate change affects air quality via changes in ventilation rates, precipitation patterns, and chemical processes [19,20]. In several regions of the world, climate change has led to increased extreme weather events involving heavy rainfall, droughts, and heatwaves [8], which affect air pollution levels, and further complicate this relationship.
The concurrent occurrence of multiple dependent hazards that can cause or increase environmental and societal risk, such as droughts, heat, and air pollution, is defined as a compound event [21,22]. These events pose greater risks than individual extremes [23]. The sixth assessment report (AR6) of the Intergovernmental Panel on Climate Change (IPCC) revealed that, since the 1950s, anthropogenic influence has likely increased the frequency of compound extreme events, especially concurrent heatwaves and droughts, which are also projected to become more frequent in the future [8]. Examples of compound events also include heavy rain on saturated soil, compound precipitation and wind extremes, and humid heatwaves [24].
Recent studies have highlighted the growing threat of compound heat and O3 events [25,26,27,28,29,30]. O3, a secondary pollutant produced through photochemical reactions involving nitrogen oxides (NOx) and volatile organic compounds (VOCs), poses significant air pollution challenges worldwide. Heatwaves during boreal summers, for instance, have been shown to amplify O3 concentrations by up to 30% in urban China [30]. Similar findings demonstrate that urban areas face greater risks of compound heat and O3 events compared to rural regions [28]. Climate models also predict a rise in such compound events globally, with a projected increase of 34.6 annual compound-event days by 2071–2090 under high-emission scenarios [27]. Jahn and Hertig (2022) [26], using climate model simulations, also projected an increase in compound extreme O3 and temperature events in central Europe by the end of the 21st century.
In Brazil, the Megacity of São Paulo, home to over 20.7 million people [31], frequently records O3 levels above World Health Organization (WHO) recommendations [32,33,34]. Alarmingly, over 3 million people in São Paulo’s most vulnerable areas are exposed to O3 concentrations exceeding WHO attention levels [35]. In the region, several studies have linked these high O3 levels with elevated temperatures through modeling [36,37] and observational studies [38,39], a concern given the expected increase in heatwave occurrences in southeastern Brazil [40].
Given the projected increase in extreme events and their compounded impacts, adopting an integrated approach to assess O3 exposure with and without extreme heat is crucial to develop effective strategies for improving air quality and, consequently, public health. This is particularly important for megacities like São Paulo, where the synergistic effects of high temperatures and O3 pollution present significant threats to health and economic stability.
Urban areas worldwide face growing challenges from compound climate–pollution extremes, with recent studies highlighting increased risks in rapidly developing regions such as China, Europe, and North America [26,29,30]. However, the magnitude and characteristics of these events vary considerably depending on regional geography, meteorological regimes, and urban infrastructure. The São Paulo Megacity presents a particularly complex case due to its unique combination of dense urban sprawl, heterogeneous topography, high vehicular emissions, and pronounced urban heat island effects [32,41]. These features interact with regional-scale circulation patterns—especially the South Atlantic Subtropical Anticyclone (SASA)—to create conditions conducive to both heat and ozone extremes. Therefore, by applying a compound-event framework in a Global South megacity, this study offers new insights into the interaction between meteorological extremes and air quality under local conditions that differ markedly from those in the Global North. Thus, this work contributes to closing a significant knowledge gap by providing a long-term climatological assessment of these events, characterizing the underlying synoptic conditions, and identifying regionally relevant physical drivers that can inform climate adaptation and public health strategies in Brazil.
To date, no studies have specifically evaluated compound extreme O3 and heatwave events in São Paulo Megacity. Addressing this gap, the present study aims to (a) assess individual and compound extreme O3 and heatwave events from 1998 to 2023; and (b) analyze the atmospheric patterns associated with these events. Additionally, it provides a comprehensive overview of the long-term variability and trends in O3 concentrations in the Megacity of São Paulo. This integrated approach highlights the pressing need for targeted mitigation strategies and the importance of addressing compound hazards in rapidly urbanizing regions worldwide.

2. Materials and Methods

2.1. Study Area

The Megacity of São Paulo, also known as the Metropolitan Area of São Paulo (MASP), is located in São Paulo state in southeastern Brazil (Figure 1). Covering nearly 8000 km2, the megacity encompasses 39 municipalities with more than 7 million vehicles [42], representing 5.95% of the national fleet (119,227,657 vehicles; [43]). This extensive vehicular fleet is the primary source of air pollutant emissions in the region. According to the Environmental Agency of São Paulo state [42], vehicles in the MASP account for 96% of carbon monoxide (CO) emissions, 70% of hydrocarbons (HC), 60% of nitrogen oxides (NOx), 8% of sulfur oxides (SOx), and 40% of particulate matter (PM).
The region’s climate is shaped by the South American Monsoon System (SAMS), characterized by rainy summers and dry winters [44]. Large-scale atmospheric systems, such as cold fronts, the South Atlantic Convergence Zone (SACZ), and the SASA, play a key role in influencing the precipitation patterns and, consequently, the local air quality [45]. Additionally, mesoscale systems, including sea breeze circulations, urban heat island effects [41], and mountain/valley circulations [46], significantly impact the region’s weather conditions and air quality.

2.2. Data

Hourly O3 concentrations and temperature data from the Megacity of São Paulo, covering the period from 1998 to 2023, were obtained from CETESB’s QUALAR website (Air Quality—https://cetesb.sp.gov.br/ar/qualar/, accessed on 01 July 2025). This study considered a total of 20 sites from CETESB with available air quality and/or meteorological observations. However, since not all CETESB sites measure meteorological variables, daily maximum temperature data provided by the National Institute of Meteorology (INMET—https://bdmep.inmet.gov.br/, accessed on 01 July 2025) from another 2 stations were also incorporated into the analysis when available. Details of the sites included in the study are provided in Table 1.
ERA5 reanalysis data, provided by the European Center for Medium-Range Weather Forecasts (ECMWF), were used to characterize the atmospheric patterns associated with compound and individual heatwave and O3 extreme events from 1998 to 2023. This dataset combines model outputs and observational data to produce a consistent global dataset with a horizontal spatial resolution of 0.25° [47]. The ERA5 variables analyzed included geopotential heights, zonal and meridional wind components at 850 hPa and 250 hPa levels, mean sea level pressure (MSLP), and 2 m air temperature. The 850 and 250 hPa levels were chosen because they represent, respectively, the low and upper level atmospheric circulation patterns over South America [48]. It is important to acknowledge that ERA5 data, with its 0.25° spatial resolution and reliance on interpolation in regions with sparse observational coverage, may not fully capture local-scale meteorological variability—particularly in complex urban environments like São Paulo [47].
Daily data from the Climate Prediction Center (CPC), produced by the National Oceanic and Atmospheric Administration (NOAA), was also used to examine precipitation patterns over the same period. These data are derived from the interpolation of approximately 30,000 meteorological stations worldwide, resulting in a high-quality dataset with a spatial resolution of 0.5° [49]. ERA5 data were used to characterize atmospheric patterns due to their high spatial resolution. However, for precipitation, CPC data were chosen, as they perform better in the South American Monsoon region [50].

2.3. Methodology

The maximum daily 8 h average of O3 concentrations (MD8A-O3) and the maximum daily temperature (Tmax) were calculated through the hourly data from CETESB monitoring stations. Additionally, daily average values for MD8A-O3 and Tmax were computed to represent area-wide conditions across the Megacity of São Paulo. These averages were calculated dynamically based on the stations with valid data available on each specific day, ensuring spatial representativeness despite occasional gaps in data coverage. Hence, for each day, the area-wide averages considered only valid data from the stations available on that specific day. To assess the long-term O3 variability in the Megacity of São Paulo, the average and maximum monthly values of MD8A-O3 for each site and the entire area were calculated and compared to the WHO guidelines [51]. Daily and monthly averages for each site were only calculated when at least 75% of data were valid. The Mann–Kendall test (MK), a nonparametric test described by Mann (1945) [52] and Kendall (1975) [53], was applied to the MD8A-O3 and Tmax values of all sites to verify trends and their statistical significance. This test is widely used to identify trends in hydrological and meteorological time series, and is valued for its robustness and applicability [54,55,56]. Statistical significance was assessed based on the p-value; values below 0.05 were considered statistically significant [57].
The percentile technique was employed to define the thresholds for extreme events. The percentile divides the data into 100 parts, so that each part represents 1% of the data [57]. Specifically, the 90th percentile (p90) thresholds for MD8A-O3 and Tmax were calculated using data from September to March, which corresponds to the period with the highest ozone and temperature values in the MASP [32,33]. To ensure the robustness of these thresholds and reduce the influence of interannual variability, only stations with at least 10 years of valid data were used in the site-level p90 calculations. Stations with shorter records were still included in the daily megacity average calculations when valid data were available.
From September to March, the daily average of MD8A-O3 and Tmax values (average of all sites with valid data on a specific day) were compared to the p90 megacity average threshold. Although different methods can be used to identify heatwaves, in this study, heatwave events were considered when Tmax values were higher than the p90 threshold for 6 consecutive days, as described by Curado et al. (2023) [58] and by Molina et al. (2020) [6], who analyzed heatwaves in subtropical Brazil. The same method was applied to define O3 extreme events. Hence, compound heatwave and O3 extreme events were identified when the p90 threshold values for MD8A-O3 and Tmax were exceeded at the same time for at least 6 consecutive days.
Data from ERA5 and CPC, from 1998 to 2023, were used to create maps with anomalies and averages, aiming to identify atmospheric circulation patterns associated with the occurrence of heatwaves, ozone extremes, and compound events. The average patterns were calculated by considering all days associated with both individual and compound events. To calculate the anomalies, climatological averages for the period from September to March (1998–2023) were computed and then subtracted from the mean patterns of the individual and compound events.
To summarize, the procedure for identifying compound ozone–heatwave events involved the following steps: (1) calculation of daily MD8A-O3 and Tmax values for each site and the megacity average; (2) determination of the p90 thresholds for each variable using data from September to March at stations with at least 10 years of valid records; (3) classification of a heatwave or ozone extreme event when the respective variable exceeded its p90 threshold for six or more consecutive days; and (4) identification of compound events when both variables simultaneously exceeded their p90 thresholds for at least six consecutive days. This framework allows the detection of persistent and concurrent extreme events.

3. Results and Discussion

3.1. Long-Term Variability and Trends

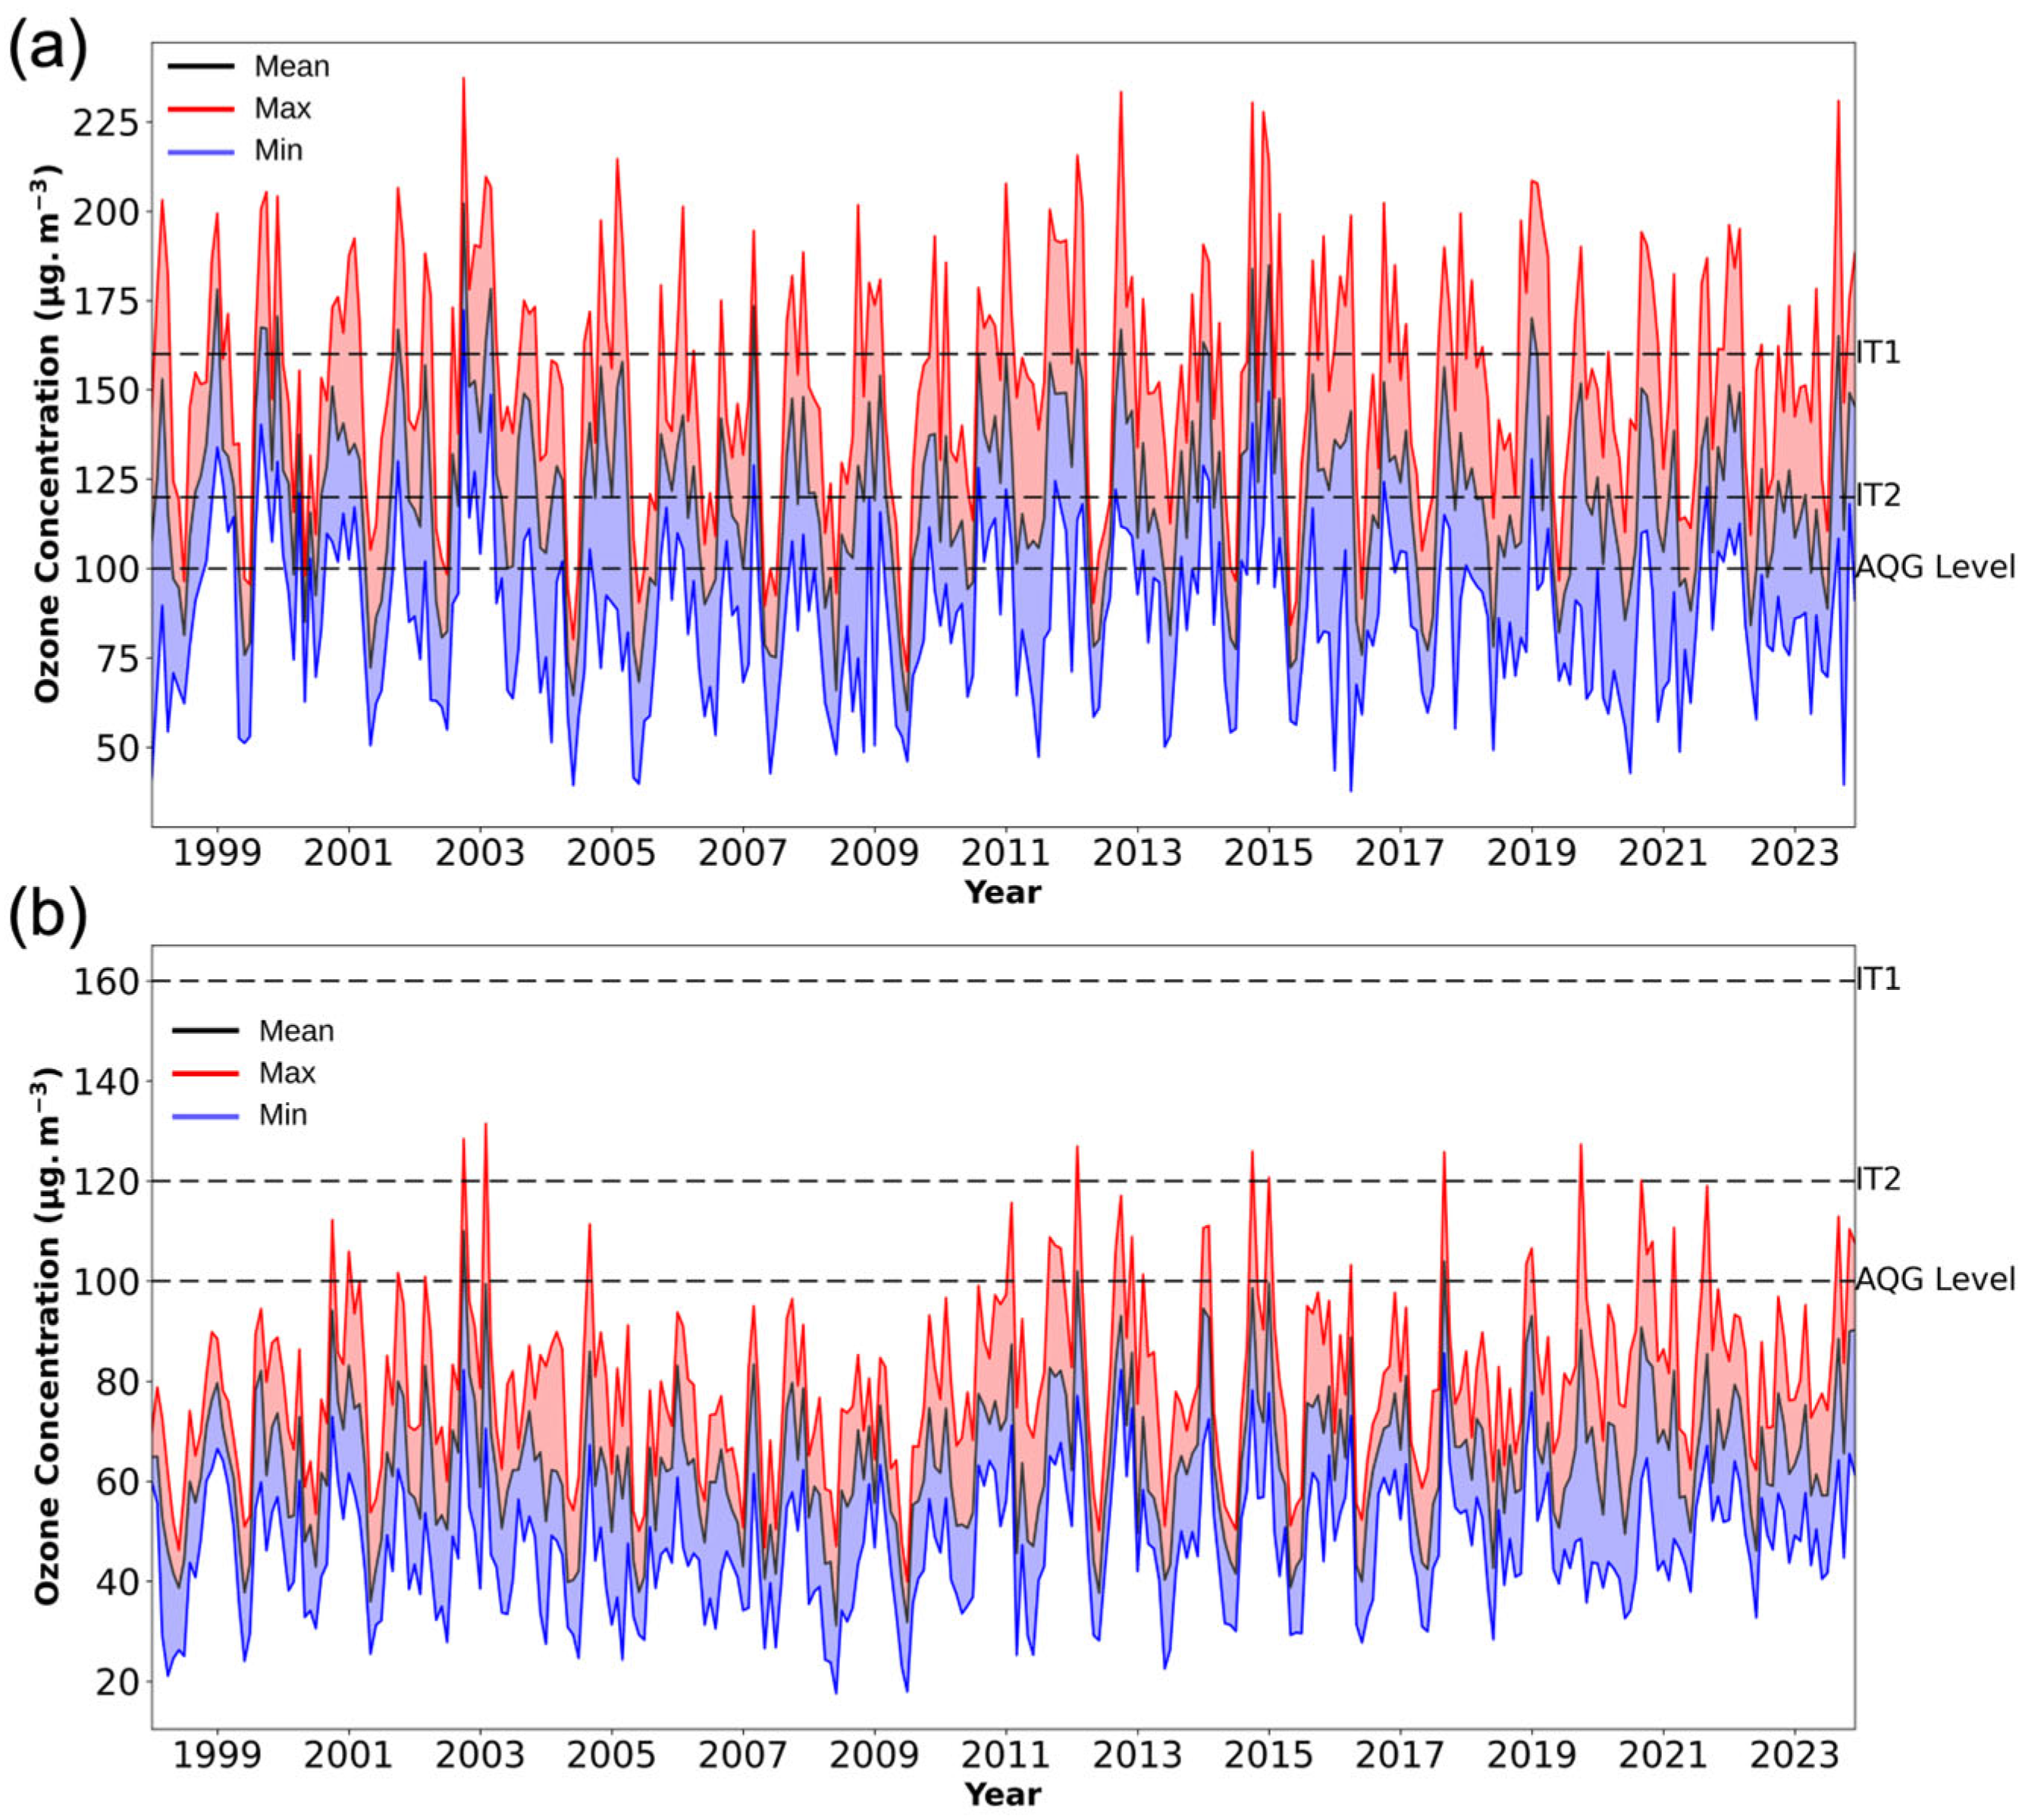
The monthly average and maximum MD8A-O3 values (Figure 2a,b, respectively) exceed the Air Quality Guideline (AQG) and Interim Targets (ITs—IT-1 and IT-2) recommended by the World Health Organization (WHO; 2021) [51] during several months of the time series. The ITs, which are set lower than the AQG, represent a phased approach to reducing air pollution [59]. IT-1, having the highest threshold (160 µg.m−3), is proposed as an initial goal for air pollution reduction. While the monthly averages of MD8A-O3 only occasionally surpass IT-2 (120 µg.m−3), the maximum values frequently exceed the first target (IT-1). Data from all sites included in this study recorded values above the ITs and, consequently, the AQG (100 µg.m−3). These findings underscore the significant air quality degradation in the Megacity of São Paulo, particularly concerning O3 levels, and align with previous studies by Carvalho et al. (2015) [32] and Gómez Peláez et al. (2020) [60].
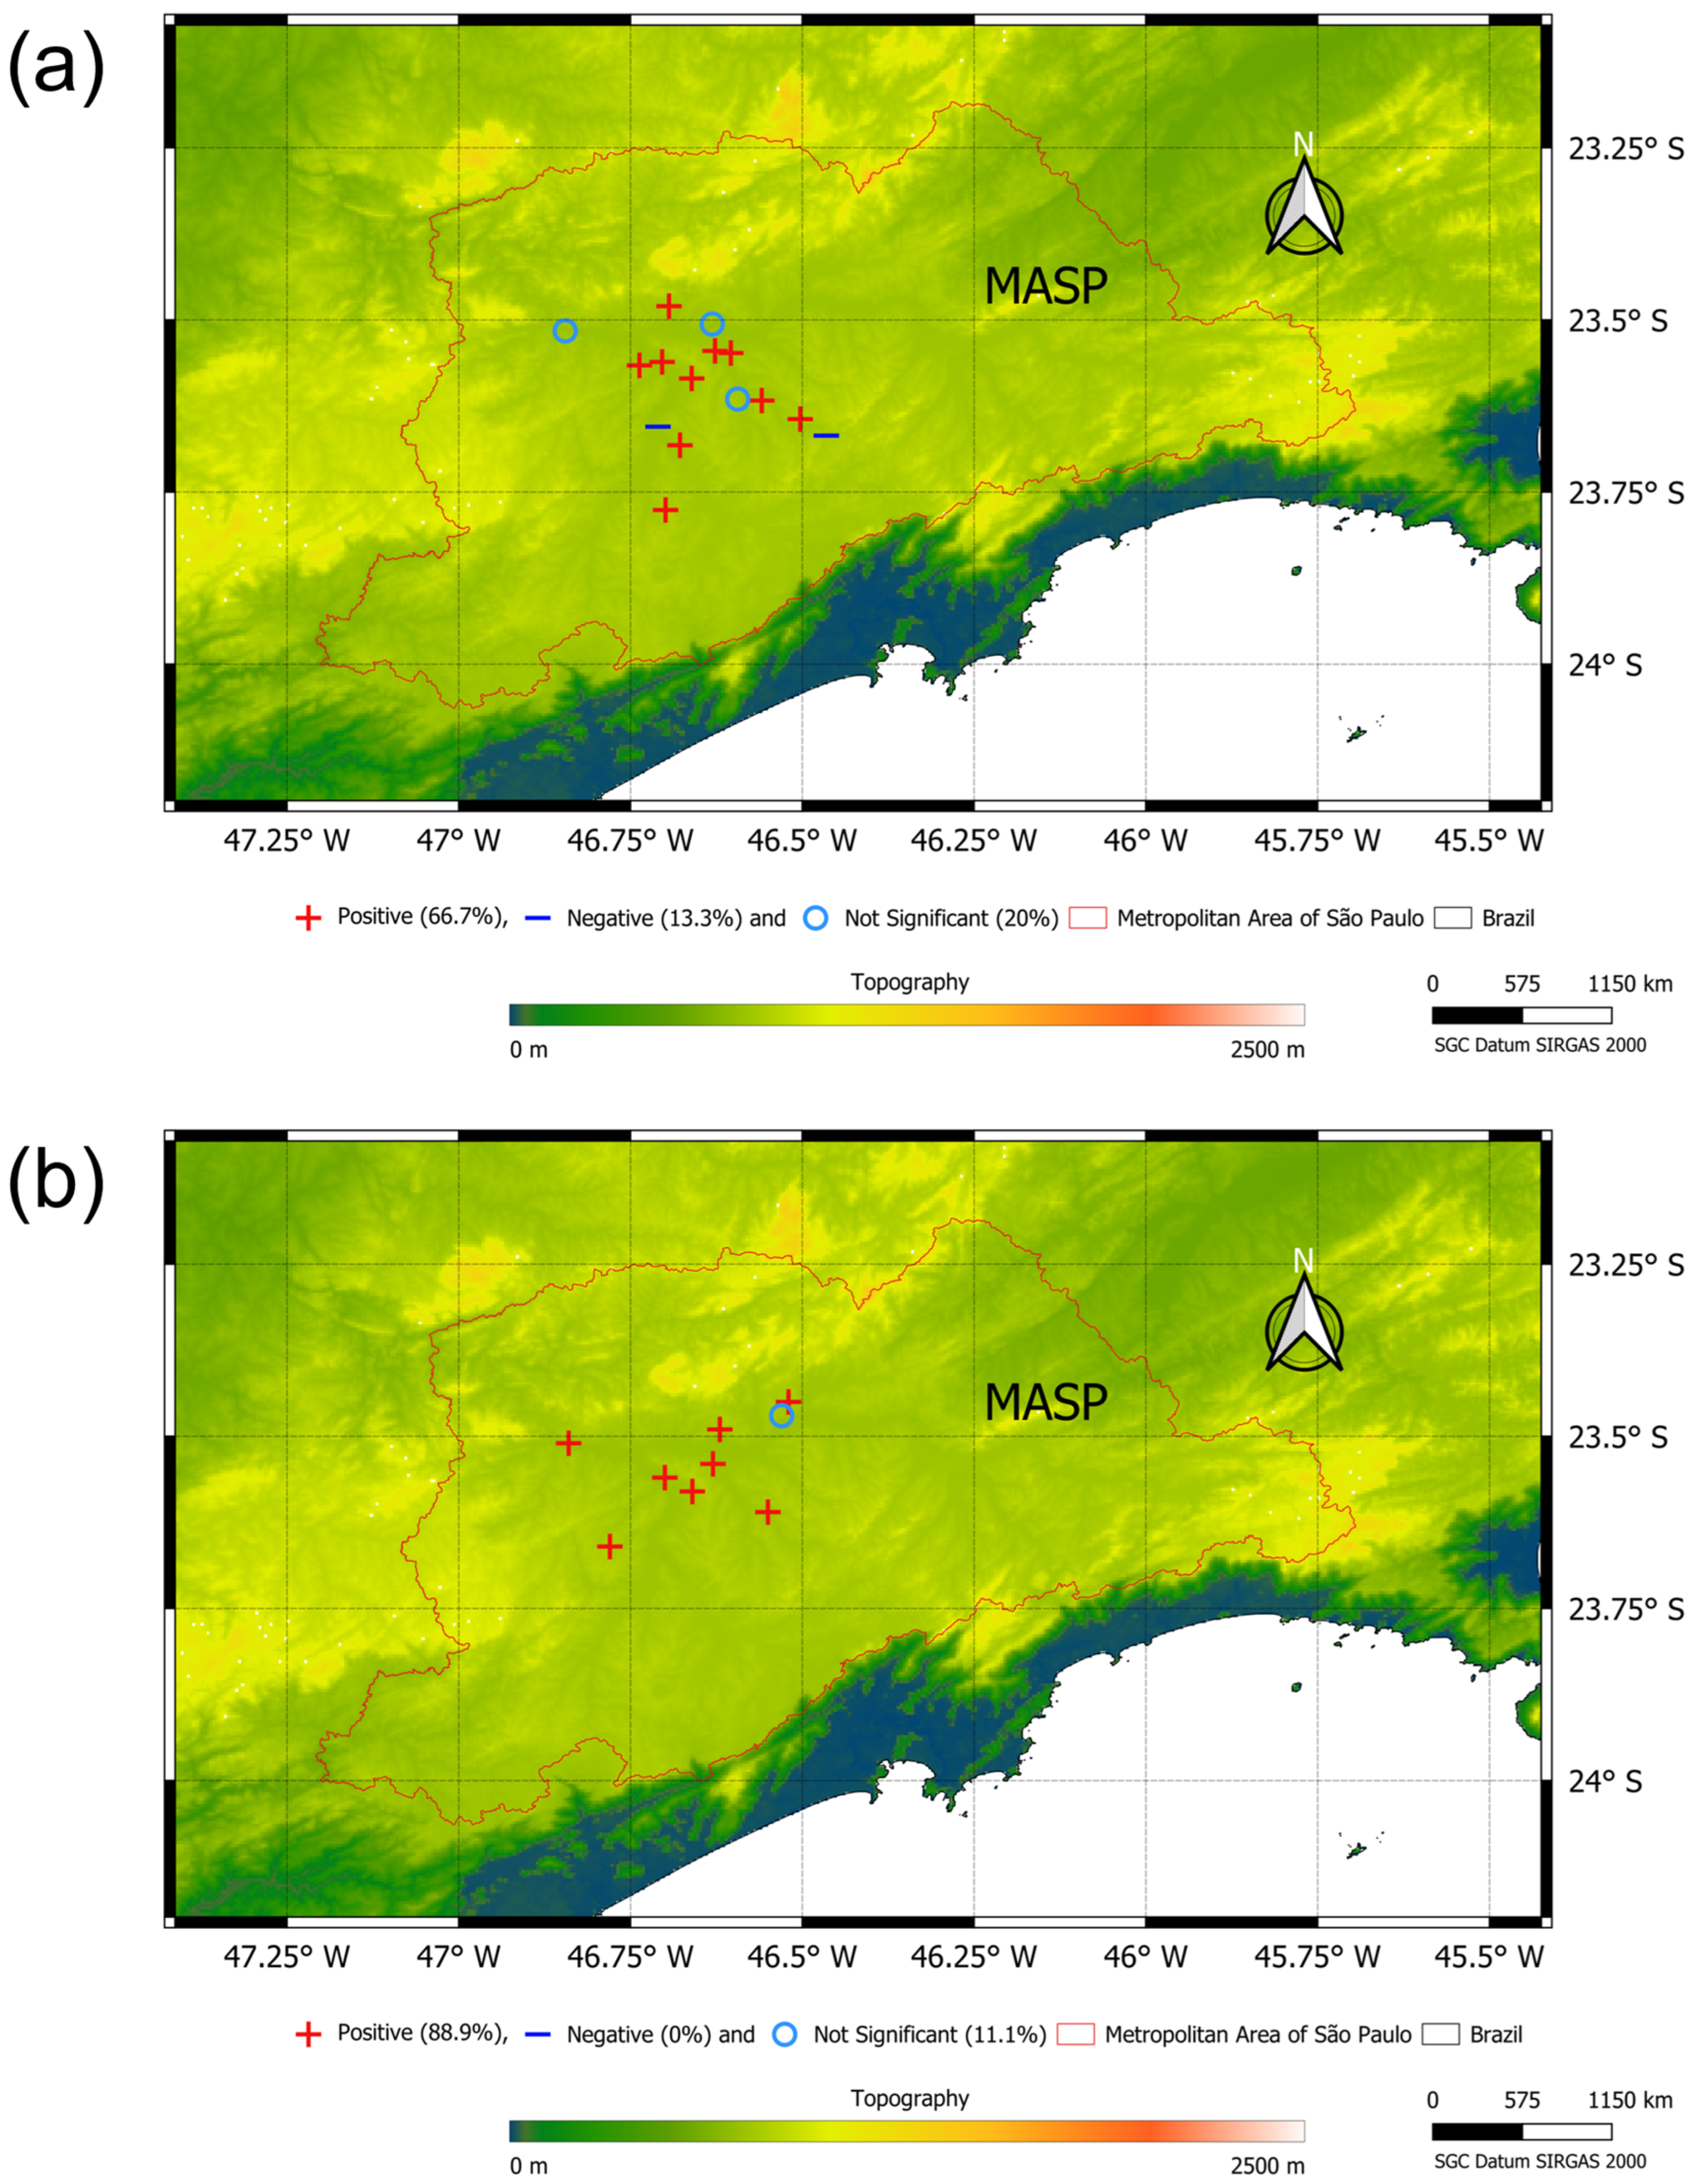
Figure 3 presents the results of the MK trend analysis for MD8A-O3 and Tmax values at each site from 1998 to 2023. Only sites with at least 10 years of valid data were included in this analysis. For MD8A-O3, about 66.7% (10 stations) of the sites exhibited significant positive (increase) trends. Significant negative (decrease) trends were observed only at the Santo Amaro and Mauá sites, while non-significant trends were recorded at Santana, Diadema, and Carapicuíba. All other sites showed significant positive (increase) trends. These contrasting trends are mainly attributed to differences in local emission sources influencing each monitoring site. CETESB (2023) [42] classifies its monitoring stations by spatial representativeness. Urban-scale stations, such as USP-IPEN, Ibirapuera, and Interlagos, reflect the broader background air quality of large metropolitan areas, whereas neighborhood-scale stations, like Mauá and Santo Amaro, are more influenced by nearby emission sources such as traffic, local industry, and vegetation. This classification helps explain the contrasting trends observed across sites. While most urban-scale stations showed significant increases in ozone (MD8A-O3), some neighborhood-scale stations showed decreases or non-significant trends. A likely explanation is the influence of ozone titration at neighborhood-scale sites, where high concentrations of nitric oxide (NO) from local traffic react with O3, removing it from the atmosphere via the reaction NO + O3 → NO2 + O2. This process tends to suppress ozone levels locally. In contrast, urban-scale sites are less affected by direct NO emissions, and as regional NOx emissions decline, ozone titration is reduced, allowing background O3 concentrations to rise. These findings are consistent with Carvalho et al. (2015) [32] and Boari et al. (2023) [61], who reported positive (increase) O3 concentration trends for 54% and 62% of sites in the MASP, respectively. Carvalho et al. (2015) [32] also identified negative (decrease) trends for Mauá, while Schuch et al. (2019) [39] and Boari et al. (2023) [61] reported similar results for Santo Amaro.
However, these earlier studies based their analyses on hourly O3 concentrations rather than MD8A-O3, which may account for some discrepancies in the results. Additionally, potential shifts in O3 trends over time could explain the differences. For example, Seguel et al. (2024) [62] analyzed MD8A-O3 data from several South American cities, including São Paulo. They identified clear positive (increase) trends after change points—primarily post-2010—across the 5th, 50th, and 90th percentiles with high or very high certainty. Dário et al. (2024) [63] also identified positive (increase) trends in MD8A-O3 values in the MASP region between 2000 and 2023, especially during the austral summer. As shown by Schuch et al. (2019) [39], negative (decrease) trends in MD8A-O3 were detected in residential areas and locations near trees.
As for Tmax, significant positive (increase) trends were observed at eight (88.9%) out of the nine analyzed sites. The only exception was Guarulhos, where no significant trend was detected. While studies on Tmax trends in the MASP are limited, Curado et al. (2023) [58] also reported positive (increase) trends in the annual mean air temperature for the region.

3.2. Individual and Compound Extreme Events

To identify individual and compound heatwave and ozone extreme events, the p90 thresholds were calculated (Table 2). Tmax p90 values ranged from 30.9 °C in Ibirapuera, an urban park in the city of São Paulo, to 34.4 °C in São Caetano do Sul, a municipality within the MASP’s largest industrial center. The lower threshold in Ibirapuera was expected, as parks are known to reduce surface temperatures [64]. On the other hand, higher urban heat island intensities, associated with extreme thermal discomfort during summer afternoons (3.2 °C), were identified in São Caetano do Sul [65]. The average p90 for Tmax across the MASP was 32.59 °C.
The lowest MD8A-O3 p90 values were observed in Pinheiros (99.75 μg.m−3), Grajaú-Parelheiros (100.63 μg.m−3), and Parque Dom Pedro II (107.75 μg.m−3). In contrast, the highest thresholds were recorded at USP-IPEN (132.13 μg.m−3) and Ibirapuera (130.38 μg.m−3), consistent with previous reports of high O3 levels in these areas [33,66]. The average p90 for MD8A-O3 across the megacity was 110.76 μg.m−3. Pinheiros, influenced primarily by traffic emissions, Grajaú-Parelheiros, located near the Billings Reservoir and natural protected areas, and Parque Dom Pedro II, adjacent to a major bus terminal, accounted for the lowest thresholds. Carvalho et al. (2020) [33] also reported elevated nitrogen monoxide (NO) levels at these stations between 12:00 and 17:00 (local time). Higher NO concentrations are associated with lower O3 levels due to titration effects in these areas.
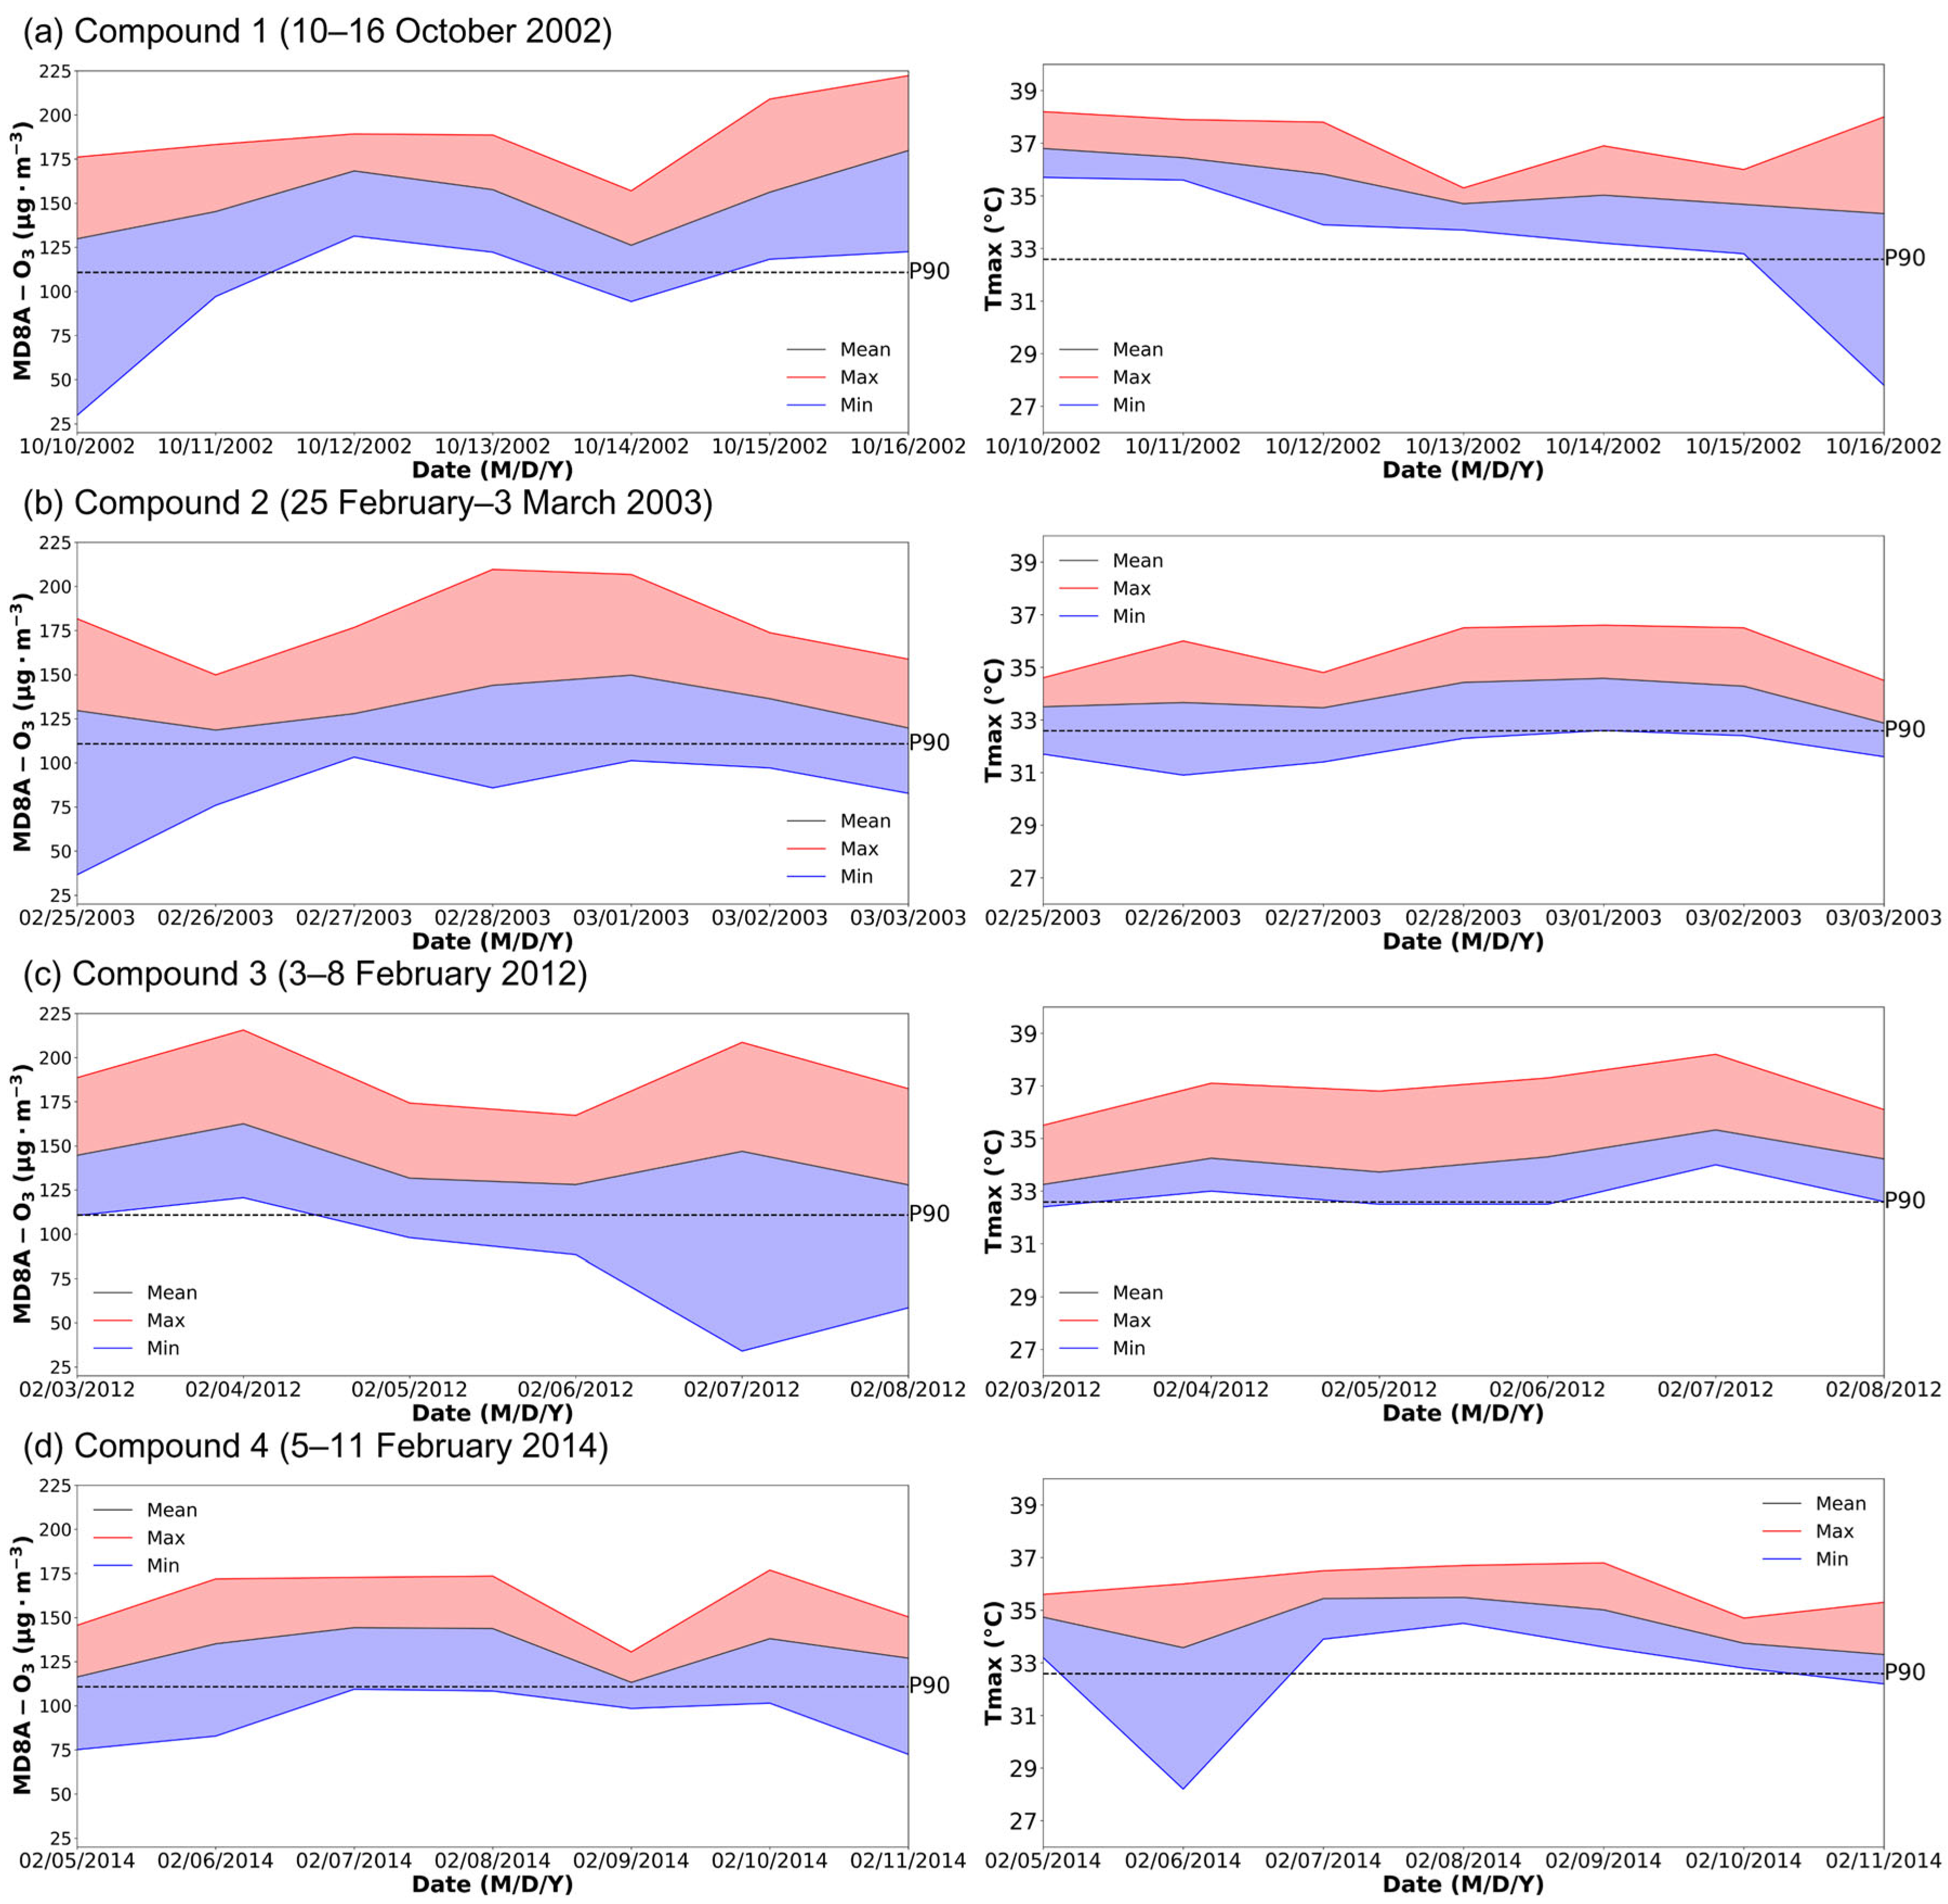
From 1998 to 2023, four compound heatwaves and O3 extreme events were identified in São Paulo (see Table 3). In general, these events occurred predominantly in February, with an average duration of 6 to 7 days. This persistence is worrying, as prolonged exposure to ozone can increase the demand for hospital care, hospitalizations for respiratory problems, and even mortality [67]. Furthermore, Figure 4 illustrates the daily variations in MD8A-O3 concentrations (left panels) and maximum temperatures (Tmax, right panels) for four compound events: (a) 10–16 October 2002, (b) 25 February–3 March 2003, (c) 3–8 February 2012, and (d) 5–11 February 2014. In all four events, both MD8A-O3 and Tmax consistently remained above the 90th percentile thresholds, reinforcing the co-occurrence of extreme heat and ozone due to favorable meteorological conditions such as high solar radiation, stagnant air, and elevated temperatures. A consistent pattern emerges with concurrent increases in O3 concentrations and maximum temperatures, especially during the middle and later phases of each event, where temperature peaks closely align with elevated MD8A-O3 values. The 2002 and 2003 events (Figure 4a,b) exhibit a clear decline in both Tmax and MD8A-O3 towards the final days, indicating a potential change in meteorological conditions, such as increased cloud cover and precipitation, leading to the dissipation of the extreme conditions. In contrast, the 2012 and 2014 events (Figure 4c,d) show a more sustained elevation of both variables, with fluctuations but no abrupt declines, suggesting prolonged atmospheric conditions favoring O3 formation. Interestingly, the intensity of the MD8A-O3 peaks varies across the events, likely reflecting variations in precursor emissions, boundary layer dynamics, synoptic-scale influences, and even background pollution levels at the time.
High ozone concentrations during these periods were also documented by [36,68,69]. For example, [36] analyzed high O3 concentrations from 24 February to 5 March 2003, using numerical simulations with the SPM-BRAMS model. The study identified high temperatures, clear skies, an absence of precipitation, and calm nighttime and early morning winds as key meteorological drivers. Additionally, the influence of the SASA was linked to elevated O3 levels in the MASP.
In addition to the four compound events identified (Table 3), seven heatwaves and four extreme O3 events were also recorded. Notably, the relationship between high ozone concentrations and elevated temperatures was evident even during periods not classified as compound events. When analyzing all days with Tmax (or MD8A-O3) values above the 90th percentile, the average MD8A-O3 was 110.38 μg.m−3, and the average Tmax was 32.16 °C. During heatwaves, the lowest MD8A-O3 value recorded was 72 μg.m−3, with more than 58% of the days within these periods exceeding the 90th percentile for MD8A-O3.
For extreme ozone events (excluding compound events), over 68% of the 34 days analyzed recorded temperatures above the Tmax p90 threshold, with the lowest temperatures during these events exceeding 27 °C. Similarly, Li et al. (2024) [30] observed in China that the likelihood of MD8A-O3 levels surpassing the World Health Organization’s guideline of 100 μg.m−3 increased from 62.4% on non-heat days to 82.5% during heatwaves. The authors also reported a positive O3 anomaly exceeding 30 μg.m−3 in metropolitan areas during heatwaves compared to non-heat days.

3.3. Anomalous Atmospheric Patterns

Figure 5 presents composites for various atmospheric variables associated with predominant patterns during heatwaves (first column), O3 extreme events (second column), and compound events (third column). The influence of the SASA, with a 1012 hPa isobar and positive 2 m air temperature anomalies, dominates southeastern Brazil in all three scenarios. However, temperature anomalies are strongest over São Paulo, exceeding 5 °C during heatwaves (Figure 5a) and compound events (Figure 5c). Notably, Chen et al. (2024) [70] demonstrated that high temperatures impact ozone formation through multiple pathways, primarily by accelerating photochemical reactions, increasing precursor emissions, and modifying boundary layer dynamics, while also highlighting that neglecting the covariation of meteorological factors may lead to an overestimation of the O3–temperature relationship.
O3 extreme events differ from heatwave and compound events, displaying cold anomalies south of 30° S likely associated with pre-frontal troughs that modulate regional circulation and pollutant dispersion (Figure 5b). For instance, negative geopotential height anomalies at 850 hPa (indicative of low pressure due to cold air masses) extend over southern Brazil, with maximum values over the Atlantic Ocean (Figure 5e). A similar pattern is observed at 250 hPa (Figure 5h). These findings align with Oliveira et al. (2022) [71], who identified positive pressure anomalies over São Paulo and negative anomalies over Argentina during persistent O3 exceedance events, often linked to advancing frontal systems. Such pre-frontal conditions, associated with high pollutant concentrations, have also been documented in previous studies [71,72,73].
The atmospheric patterns for O3 extreme events also differ due to the more pronounced zonal (west–east) orientation of positive geopotential height anomalies at 850 hPa over the Atlantic Ocean (Figure 5e), compared to the northwest–southeast orientation in heatwave and compound event composites. Regardless of the composite, the SASA shifts westward from its climatological position [74], with stronger anomalies during heatwaves and compound events (Figure 5d,f). The westward displacement of SASA inhibits deep convection and weakens the South Atlantic Convergence Zone (SACZ-activity [40,75,76,77]), reducing cloud cover and increasing surface solar radiation. This feedback mechanism results in higher temperatures and favors O3 formation. Studies in Houston, United States, have shown that specific atmospheric circulation patterns—such as low wind speeds, sea breeze recirculation, and mesoscale stagnation—are strongly linked to high ozone episodes. Banta et al. (2011) [78] emphasized the role of low wind speeds, while Banta et al. (2005) [79] documented how late sea breeze fronts and convergence zones contribute to pollutant buildup. Li et al. (2020) [80] further demonstrated that ozone peaks occur during stagnation or sea breeze conditions identified via wind clustering. These findings support the present study’s conclusion that persistent SASA-related stagnation in São Paulo similarly enhances ozone accumulation and compound event occurrence.
At 250 hPa, intense anomalies also appear at lower levels, indicating an influence on patterns at 850 hPa. These anomalies are linked to wave patterns starting in the western or central Pacific Ocean, and propagating toward South America [81]. During O3 extreme events, a stronger negative geopotential height anomaly extends from the South Pacific to the southern South Atlantic, forming a trough absent in other composites (Figure 5g–i). The pattern resembles a cold air intrusion, which enhances stability, thereby prolonging pollutant accumulation [81] for O3 events, while patterns for heatwaves and compound events align with reports of heatwave and drought conditions [40,75,77].
Precipitation deficits are shown in Figure 5j–l. Heatwave and compound events are associated with negative precipitation anomalies, most intense during compound events (below −6 mm.day−1). Lu et al. (2024) [82] also found that, in the Beijing–Tianjin–Hebei region, composite ozone events associated with heatwaves and atmospheric stagnation registered reduced precipitation compared to individual extreme events. In contrast, O3 extreme events lack a consistent pattern, with positive (up to 4 mm.day−1) and negative (down to −4 mm.day−1) anomalies across the region.
Although only four compound events were identified during the study period, composite anomaly analysis was used to identify the dominant synoptic-scale atmospheric patterns associated with their occurrence. This approach helps to highlight recurrent features—such as the westward displacement of the SASA, positive temperature anomalies, and suppressed precipitation—commonly observed during these events. However, we acknowledge that important differences in circulation structure may exist between individual cases. Given the limited number of events, averaging may smooth out specific features. Therefore, future work should incorporate detailed case-by-case synoptic analyses to complement the composite perspective and improve understanding of the mechanisms driving each event.
Similar findings were reported for the Greater Bay Area of China, where atmospheric patterns during compound heat and O3 events mirrored those of individual O3 events but with greater intensity and faster development [29].

4. Conclusions

The objectives of this study were (a) to analyze the occurrence of compound and individual extreme O3 concentrations and heatwaves in the MASP, and (b) to evaluate the atmospheric patterns associated with these events. Hourly O3 and air temperature (T) data from 20 monitoring sites in the MASP, covering the period from 1998 to 2023, were used to calculate the maximum daily 8 h average O3 concentrations (MD8A-O3) and maximum daily temperatures (Tmax).
The historical analysis of MD8A-O3 revealed values exceeding the AQG-WHO guidelines, with significant positive trends observed at 62% of the sites. Combined with the positive Tmax trends found at 90% of the sites, these results suggest worsening air quality conditions for the region. Over the study period, four compound events, seven heatwaves, and four extreme O3 events were identified.
Atmospheric patterns during both individual and compound events showed the influence of the SASA and positive surface temperature anomalies. However, cold anomalies south of 30° S and positive geopotential height anomalies at 850 hPa were uniquely associated with individual O3 extreme events. Precipitation deficits (below −6 mm.day−1) were observed during heatwaves and compound events, contributing to elevated temperatures and O3 formation.
This study provides critical insights into the dynamics of individual and compound extreme heatwave and O3 events in the MASP, highlighting the increasing risks posed by climate variability and air pollution. The significant positive trends in both O3 concentrations and Tmax, combined with frequent exceedances of the AQG-WHO thresholds, underline the pressing need for effective air quality and heatwave mitigation strategies. The atmospheric patterns identified, including the role of the SASA and precipitation deficits, shed light on the meteorological drivers of these events. By understanding these mechanisms, this research offers valuable information to enhance forecasting and preparedness for extreme events.
These findings have important implications for public policy and air quality management in megacities. The observed increase in compound ozone–heatwave events, particularly during persistent SASA conditions, suggests the need for proactive mitigation strategies. Integrating large-scale atmospheric indicators—such as geopotential height anomalies and SASA positioning—into early warning systems could enhance the predictability of such events and support timely public health responses. Based on these forecasts, short-term emission control measures—such as limiting vehicular traffic, adjusting industrial activity, or issuing synchronized heat and air quality alerts—could be adopted to minimize population exposure to hazardous conditions. These measures would be especially beneficial for socially vulnerable communities, who often face disproportionate health risks from extreme heat and air pollution. Moreover, the analytical approach applied in this study may serve as a foundation for developing region-specific forecasting frameworks and informing climate adaptation policies in other Brazilian urban areas. These conclusions are particularly relevant for improving public awareness and guiding institutional responses, ultimately contributing to the design of integrated strategies for environmental and health risk reduction in rapidly urbanizing regions such as the MASP.

Author Contributions

Conceptualization, V.S.B.C.; methodology, V.S.B.C., P.d.N.S., A.A.d.F. and M.S.R.; software, V.S.B.C., P.d.N.S., A.A.d.F. and V.L.d.S.R.T.; formal analysis, V.S.B.C., P.d.N.S., A.A.d.F. and M.S.R.; writing—original draft preparation, V.S.B.C., P.d.N.S., A.A.d.F. and M.S.R.; writing—review and editing, V.S.B.C., T.T.d.A.A. and L.D.M. All authors have read and agreed to the published version of the manuscript.

Funding

This work was supported by the Brazilian agencies of Coordenação de Aperfeiçoamento de Pessoal de Nível Superior—Brasil (CAPES)—Financing Code 001, Conselho Nacional de Desenvolvimento Científico e Tecnológico (CNPq), and Fundação de Amparo à Pesquisa de Minas Gerais (FAPEMIG).

Institutional Review Board Statement

Not applicable.

Informed Consent Statement

Not applicable.

Data Availability Statement

All datasets used in this study are available on public online databases: CETESB’s QUALAR: https://cetesb.sp.gov.br/ar/qualar/ (accessed on 1 July 2025), INMET: https://bdmep.inmet.gov.br (accessed on 1 July 2025), and ERA5: https://cds.climate.copernicus.eu/datasets/reanalysis-era5-single-levels?tab=overview (accessed on 1 July 2025).

Acknowledgments

The authors thank all institutions that provided data for this study.

Conflicts of Interest

The authors declare no conflicts of interest.

References

  1. World Health Organization Urban Health (WHO) 2021. Urban Health. Available online: https://www.who.int/news-room/fact-sheets/detail/urban-health (accessed on 18 September 2024).
  2. Molina, M.J.; Molina, L.T. Megacities and Atmospheric Pollution. J. Air Waste Manag. Assoc. 2004, 54, 644–680. [Google Scholar] [CrossRef] [PubMed]
  3. Mage, D.; Ozolins, G.; Peterson, P.; Webster, A.; Orthofer, R.; Vandeweerd, V.; Gwynne, M. Urban Air Pollution in Megacities of the World. Atmos. Environ. 1996, 30, 681–686. [Google Scholar] [CrossRef]
  4. Chan, C.K.; Yao, X. Air Pollution in Mega Cities in China. Atmos. Environ. 2008, 42, 1–42. [Google Scholar] [CrossRef]
  5. Marlier, M.E.; Jina, A.S.; Kinney, P.L.; DeFries, R.S. Extreme Air Pollution in Global Megacities. Curr. Clim. Change Rep. 2016, 2, 15–27. [Google Scholar] [CrossRef]
  6. Molina, M.O.; Sánchez, E.; Gutiérrez, C. Future Heat Waves over the Mediterranean from an Euro-CORDEX Regional Climate Model Ensemble. Sci. Rep. 2020, 10, 8801. [Google Scholar] [CrossRef]
  7. Salimi, M.; Al-Ghamdi, S.G. Climate Change Impacts on Critical Urban Infrastructure and Urban Resiliency Strategies for the Middle East. Sustain. Cities Soc. 2020, 54, 101948. [Google Scholar] [CrossRef]
  8. Calvin, K.; Dasgupta, D.; Krinner, G.; Mukherji, A.; Thorne, P.W.; Trisos, C.; Romero, J.; Aldunce, P.; Barrett, K.; Blanco, G.; et al. IPCC, 2023: Climate Change 2023: Synthesis Report. Contribution of Working Groups I, II and III to the Sixth Assessment Report of the Intergovernmental Panel on Climate Change; Core Writing Team, Lee, H., Romero, J., Eds.; Intergovernmental Panel on Climate Change (IPCC): Geneva, Switzerland, 2023. [Google Scholar]
  9. Dockery, D.W.; Pope, C.A.; Xu, X.; Spengler, J.D.; Ware, J.H.; Fay, M.E.; Ferris, B.G.; Speizer, F.E. An Association between Air Pollution and Mortality in Six U.S. Cities. N. Engl. J. Med. 1993, 329, 1753–1759. [Google Scholar] [CrossRef]
  10. Pope Iii, C.A. Lung Cancer, Cardiopulmonary Mortality, and Long-Term Exposure to Fine Particulate Air Pollution. JAMA 2002, 287, 1132. [Google Scholar] [CrossRef]
  11. Gurjar, B.R.; Jain, A.; Sharma, A.; Agarwal, A.; Gupta, P.; Nagpure, A.S.; Lelieveld, J. Human Health Risks in Megacities Due to Air Pollution. Atmos. Environ. 2010, 44, 4606–4613. [Google Scholar] [CrossRef]
  12. Liu, C.; Chen, R.; Sera, F.; Vicedo-Cabrera, A.M.; Guo, Y.; Tong, S.; Coelho, M.S.Z.S.; Saldiva, P.H.N.; Lavigne, E.; Matus, P.; et al. Ambient Particulate Air Pollution and Daily Mortality in 652 Cities. N. Engl. J. Med. 2019, 381, 705–715. [Google Scholar] [CrossRef]
  13. Hu, F.; Guo, Y. Health Impacts of Air Pollution in China. Front. Environ. Sci. Eng. 2021, 15, 74. [Google Scholar] [CrossRef]
  14. Ebi, K.L.; Hess, J.J. Health Risks Due To Climate Change: Inequity In Causes And Consequences: Study Examines Health Risks Due to Climate Change. Health Aff. 2020, 39, 2056–2062. [Google Scholar] [CrossRef] [PubMed]
  15. Ebi, K.L.; Vanos, J.; Baldwin, J.W.; Bell, J.E.; Hondula, D.M.; Errett, N.A.; Hayes, K.; Reid, C.E.; Saha, S.; Spector, J.; et al. Extreme Weather and Climate Change: Population Health and Health System Implications. Annu. Rev. Public Health 2021, 42, 293–315. [Google Scholar] [CrossRef] [PubMed]
  16. Makri, A.; Stilianakis, N.I. Vulnerability to Air Pollution Health Effects. Int. J. Hyg. Environ. Health 2008, 211, 326–336. [Google Scholar] [CrossRef]
  17. Benevolenza, M.A.; DeRigne, L. The Impact of Climate Change and Natural Disasters on Vulnerable Populations: A Systematic Review of Literature. J. Hum. Behav. Soc. Environ. 2019, 29, 266–281. [Google Scholar] [CrossRef]
  18. Von Schneidemesser, E.; Monks, P.S.; Allan, J.D.; Bruhwiler, L.; Forster, P.; Fowler, D.; Lauer, A.; Morgan, W.T.; Paasonen, P.; Righi, M.; et al. Chemistry and the Linkages between Air Quality and Climate Change. Chem. Rev. 2015, 115, 3856–3897. [Google Scholar] [CrossRef]
  19. Jacob, D.J.; Winner, D.A. Effect of Climate Change on Air Quality. Atmos. Environ. 2009, 43, 51–63. [Google Scholar] [CrossRef]
  20. Baklanov, A.; Molina, L.T.; Gauss, M. Megacities, Air Quality and Climate. Atmos. Environ. 2016, 126, 235–249. [Google Scholar] [CrossRef]
  21. Zscheischler, J.; Westra, S.; Van Den Hurk, B.J.J.M.; Seneviratne, S.I.; Ward, P.J.; Pitman, A.; AghaKouchak, A.; Bresch, D.N.; Leonard, M.; Wahl, T.; et al. Future Climate Risk from Compound Events. Nat. Clim. Change 2018, 8, 469–477. [Google Scholar] [CrossRef]
  22. Zscheischler, J.; Seneviratne, S.I. Dependence of Drivers Affects Risks Associated with Compound Events. Sci. Adv. 2017, 3, e1700263. [Google Scholar] [CrossRef]
  23. Ridder, N.N.; Ukkola, A.M.; Pitman, A.J.; Perkins-Kirkpatrick, S.E. Increased Occurrence of High Impact Compound Events under Climate Change. npj Clim. Atmos. Sci. 2022, 5, 3. [Google Scholar] [CrossRef]
  24. Zscheischler, J.; Martius, O.; Westra, S.; Bevacqua, E.; Raymond, C.; Horton, R.M.; Van Den Hurk, B.; AghaKouchak, A.; Jézéquel, A.; Mahecha, M.D.; et al. A Typology of Compound Weather and Climate Events. Nat. Rev. Earth Environ. 2020, 1, 333–347. [Google Scholar] [CrossRef]
  25. Hertig, E.; Russo, A.; Trigo, R.M. Heat and Ozone Pollution Waves in Central and South Europe—Characteristics, Weather Types, and Association with Mortality. Atmosphere 2020, 11, 1271. [Google Scholar] [CrossRef]
  26. Jahn, S.; Hertig, E. Using Clustering, Statistical Modeling, and Climate Change Projections to Analyze Recent and Future Region-Specific Compound Ozone and Temperature Burden Over Europe. GeoHealth 2022, 6, e2021GH000561. [Google Scholar] [CrossRef]
  27. Ban, J.; Lu, K.; Wang, Q.; Li, T. Climate Change Will Amplify the Inequitable Exposure to Compound Heatwave and Ozone Pollution. One Earth 2022, 5, 677–686. [Google Scholar] [CrossRef]
  28. An, N.; Chen, Y.; Zhai, P.; Li, J.; Wei, Y. Compound Hot and Ozone Extremes in Urban China. Urban Clim. 2023, 52, 101689. [Google Scholar] [CrossRef]
  29. Huang, Z.; Luo, M.; Gao, M.; Ning, G.; Ge, E.; On Chan, T.; Wu, S.; Zhang, H.; Tang, Y. Different Characteristics of Independent and Compound Extreme Heat and Ozone Pollution Events in the Greater Bay Area of China. Int. J. Appl. Earth Obs. Geoinf. 2023, 124, 103508. [Google Scholar] [CrossRef]
  30. Li, M.; Huang, X.; Yan, D.; Lai, S.; Zhang, Z.; Zhu, L.; Lu, Y.; Jiang, X.; Wang, N.; Wang, T.; et al. Coping with the Concurrent Heatwaves and Ozone Extremes in China under a Warming Climate. Sci. Bull. 2024, 69, 2938–2947. [Google Scholar] [CrossRef]
  31. Instituto Brasileiro de Geografia e Estatística (IBGE) População 2022—Regiões Metropolitanas Das Capitais. 2022. Available online: https://atlasescolar.ibge.gov.br/brasil/caracteristicas-demograficas/distribuicao-da-populacao/21896-regioes-metropolitanas-das-capitais (accessed on 18 September 2024).
  32. Carvalho, V.S.B.; Freitas, E.D.; Martins, L.D.; Martins, J.A.; Mazzoli, C.R.; Andrade, M.D.F. Air Quality Status and Trends over the Metropolitan Area of São Paulo, Brazil as a Result of Emission Control Policies. Environ. Sci. Policy 2015, 47, 68–79. [Google Scholar] [CrossRef]
  33. Carvalho, V.S.B.; Martins, F.B.; Da Silveira, W.W.; De Campos, B.; Simões, J.B. Variance Analysis Applied to Ground-Level Ozone Concentrations in the State of São Paulo, Brazil. Braz. J. Chem. Eng. 2020, 37, 505–513. [Google Scholar] [CrossRef]
  34. Andrade, M.D.F.; Kumar, P.; De Freitas, E.D.; Ynoue, R.Y.; Martins, J.; Martins, L.D.; Nogueira, T.; Perez-Martinez, P.; De Miranda, R.M.; Albuquerque, T.; et al. Air Quality in the Megacity of São Paulo: Evolution over the Last 30 Years and Future Perspectives. Atmos. Environ. 2017, 159, 66–82. [Google Scholar] [CrossRef]
  35. Chiquetto, J.B.; Silva, M.E.S.; Cabral-Miranda, W.; Ribeiro, F.N.D.; Ibarra-Espinosa, S.A.; Ynoue, R.Y. Air Quality Standards and Extreme Ozone Events in the São Paulo Megacity. Sustainability 2019, 11, 3725. [Google Scholar] [CrossRef]
  36. Carvalho, V.S.B.; Freitas, E.D.D.; Mazzoli, C.R.; Andrade, M.D.F. Avaliação Da Influência de Condições Meteorológicas Na Ocorrência e Manutenção de Um Episódio Prolongado Com Altas Concentrações de Ozônio Sobre a Região Metropolitana de São Paulo. Rev. bras. Meteorol. 2012, 27, 463–474. [Google Scholar] [CrossRef]
  37. Sánchez-Ccoyllo, O.R.; Ynoue, R.Y.; Martins, L.D.; De Fátima Andrade, M. Impacts of Ozone Precursor Limitation and Meteorological Variables on Ozone Concentration in São Paulo, Brazil. Atmos. Environ. 2006, 40, 552–562. [Google Scholar] [CrossRef]
  38. Silva Júnior, R.S.D.; Oliveira, M.G.L.D.; Andrade, M.D.F. Weekend/Weekday Differences in Concentrations of Ozone, Nox, and Non-Methane Hydrocarbon in the Metropolitan Area of São Paulo. Rev. Bras. Meteorol. 2009, 24, 100–110. [Google Scholar] [CrossRef]
  39. Schuch, D.; De Freitas, E.D.; Espinosa, S.I.; Martins, L.D.; Carvalho, V.S.B.; Ramin, B.F.; Silva, J.S.; Martins, J.A.; De Fatima Andrade, M. A Two Decades Study on Ozone Variability and Trend over the Main Urban Areas of the São Paulo State, Brazil. Environ. Sci. Pollut. Res. 2019, 26, 31699–31716. [Google Scholar] [CrossRef]
  40. Geirinhas, J.L.; Russo, A.; Libonati, R.; Sousa, P.M.; Miralles, D.G.; Trigo, R.M. Recent Increasing Frequency of Compound Summer Drought and Heatwaves in Southeast Brazil. Environ. Res. Lett. 2021, 16, 034036. [Google Scholar] [CrossRef]
  41. Freitas, E.D.; Rozoff, C.M.; Cotton, W.R.; Dias, P.L.S. Interactions of an Urban Heat Island and Sea-Breeze Circulations during Winter over the Metropolitan Area of São Paulo, Brazil. Bound.-Layer Meteorol. 2007, 122, 43–65. [Google Scholar] [CrossRef]
  42. Companhia Ambiental do Estado de São Paulo (CETESB) Qualidade Do Ar No Estado de São Paulo. 2023. Available online: https://cetesb.sp.gov.br/ar/wp-content/uploads/sites/28/2023/07/Relatorio-de-Qualidade-do-Ar-no-Estado-de-Sao-Paulo-2022.pdf (accessed on 18 September 2024).
  43. Instituto Brasileiro de Geografia e Estatística (IBGE) Frota de Veículos. 2023. Available online: https://cidades.ibge.gov.br/brasil/pesquisa/22/28120 (accessed on 18 September 2024).
  44. Reboita, M.S.; Gan, M.A.; Rocha, R.P.D.; Ambrizzi, T. Regimes de Precipitação Na América Do Sul: Uma Revisão Bibliográfica. Rev. bras. Meteorol. 2010, 25, 185–204. [Google Scholar] [CrossRef]
  45. Ferreira, G.W.S.; Reboita, M.S. A New Look into the South America Precipitation Regimes: Observation and Forecast. Atmosphere 2022, 13, 873. [Google Scholar] [CrossRef]
  46. Ribeiro, F.N.D.; Oliveira, A.P.D.; Soares, J.; Miranda, R.M.D.; Barlage, M.; Chen, F. Effect of Sea Breeze Propagation on the Urban Boundary Layer of the Metropolitan Region of Sao Paulo, Brazil. Atmos. Res. 2018, 214, 174–188. [Google Scholar] [CrossRef]
  47. Hersbach, H.; Bell, B.; Berrisford, P.; Hirahara, S.; Horányi, A.; Muñoz-Sabater, J.; Nicolas, J.; Peubey, C.; Radu, R.; Schepers, D.; et al. The ERA5 Global Reanalysis. Quart J. R. Meteoro. Soc. 2020, 146, 1999–2049. [Google Scholar] [CrossRef]
  48. Vasquez, T. Weather Analysis & Forecasting Handbook, 2nd ed.; Weather Graphics Technologies: Garland, TX, USA, 2021; ISBN 10: 0983253307. [Google Scholar]
  49. Chen, M.; Shi, W.; Xie, P.; Silva, V.B.S.; Kousky, V.E.; Wayne Higgins, R.; Janowiak, J.E. Assessing Objective Techniques for Gauge-based Analyses of Global Daily Precipitation. J. Geophys. Res. 2008, 113, 2007JD009132. [Google Scholar] [CrossRef]
  50. Freitas, A.A.D.; Carvalho, V.S.B.; Reboita, M.S. Extreme Precipitation Events During the Wet Season of the South America Monsoon: A Historical Analysis over Three Major Brazilian Watersheds. Climate 2024, 12, 188. [Google Scholar] [CrossRef]
  51. World Health Organization (WHO). WHO Global Air Quality Guidelines: Particulate Matter (PM2.5 and PM10), Ozone, Nitrogen Dioxide, Sulfur Dioxide and Carbon Monoxide; World Health Organization: Bonn, Germany, 2021; ISBN 978-92-4-003422-8. [Google Scholar]
  52. Mann, H.B. Nonparametric Tests Against Trend. Econometrica 1945, 13, 245. [Google Scholar] [CrossRef]
  53. Kendall, M.G. Rank Correlation Methods, 4th ed.; Charles Griffin: London, UK, 1975. [Google Scholar]
  54. Ye, X.; Xu, C.-Y.; Li, X.; Zhang, Q. Comprehensive Evaluation of Multiple Methods for Assessing Water Resources Variability of a Lake–River System under the Changing Environment. Hydrol. Res. 2018, 49, 332–343. [Google Scholar] [CrossRef]
  55. Ali, R.; Kuriqi, A.; Abubaker, S.; Kisi, O. Long-Term Trends and Seasonality Detection of the Observed Flow in Yangtze River Using Mann-Kendall and Sen’s Innovative Trend Method. Water 2019, 11, 1855. [Google Scholar] [CrossRef]
  56. Wang, F.; Shao, W.; Yu, H.; Kan, G.; He, X.; Zhang, D.; Ren, M.; Wang, G. Re-Evaluation of the Power of the Mann-Kendall Test for Detecting Monotonic Trends in Hydrometeorological Time Series. Front. Earth Sci. 2020, 8, 14. [Google Scholar] [CrossRef]
  57. Wilks, D.S. Statistical Methods in the Atmospheric Sciences, 4th ed.; Elsevier: Amsterdam, The Netherlands, 2019; ISBN 978-0-12-815823-4. [Google Scholar]
  58. Curado, L.F.A.; De Paulo, S.R.; De Paulo, I.J.C.; De Oliveira Maionchi, D.; Da Silva, H.J.A.; De Oliveira Costa, R.; Da Silva, I.M.C.B.; Marques, J.B.; De Souza Lima, A.M.; Rodrigues, T.R. Trends and Patterns of Daily Maximum, Minimum and Mean Temperature in Brazil from 2000 to 2020. Climate 2023, 11, 168. [Google Scholar] [CrossRef]
  59. Krzyzanowski, M.; Cohen, A. Update of WHO Air Quality Guidelines. Air Qual Atmos Health 2008, 1, 7–13. [Google Scholar] [CrossRef]
  60. Gómez Peláez, L.M.; Santos, J.M.; De Almeida Albuquerque, T.T.; Reis, N.C.; Andreão, W.L.; De Fátima Andrade, M. Air Quality Status and Trends over Large Cities in South America. Environ. Sci. Policy 2020, 114, 422–435. [Google Scholar] [CrossRef]
  61. Boari, A.; Pedruzzi, R.; Vieira-Filho, M. Air Pollution Trends and Exceedances: Ozone and Particulate Matter Outlook in Brazilian Highly Urbanized Zones. Environ. Monit. Assess 2023, 195, 1058. [Google Scholar] [CrossRef] [PubMed]
  62. Seguel, R.J.; Castillo, L.; Opazo, C.; Rojas, N.Y.; Nogueira, T.; Cazorla, M.; Gavidia-Calderón, M.; Gallardo, L.; Garreaud, R.; Carrasco-Escaff, T.; et al. Changes in South American Surface Ozone Trends: Exploring the Influences of Precursors and Extreme Events. Atmos. Chem. Phys. 2024, 24, 8225–8242. [Google Scholar] [CrossRef]
  63. Dário, M.S.; Novais, D.G.; Pauliquevis, T.; Rizzo, L.V. Long-Term Trends and Probability Distribution Functions of Air Pollutant Concentrations in the Megacity of São Paulo. Derbyana 2024, 45, e816. [Google Scholar] [CrossRef]
  64. Venkatraman, S.; Kandasamy, V.; Rajalakshmi, J.; Sabarunisha Begum, S.; Sujatha, M. Assessment of Urban Heat Island Using Remote Sensing and Geospatial Application: A Case Study in Sao Paulo City, Brazil, South America. J. S. Am. Earth Sci. 2024, 134, 104763. [Google Scholar] [CrossRef]
  65. Valverde, M.C.; Coelho, L.H.; De Oliveira Cardoso, A.; Paiva Junior, H.; Brambila, R.; Boian, C.; Martinelli, P.C.; Valdambrini, N.M. Urban Climate Assessment in the ABC Paulista Region of São Paulo, Brazil. Sci. Total Environ. 2020, 735, 139303. [Google Scholar] [CrossRef]
  66. De Paula Corrêa, M.; Germano Marciano, A.; Silveira Barreto Carvalho, V.; Bernardo De Souza, P.M.; Da Silveira Carvalho Ripper, J.; Roy, D.; Breton, L.; De Vecchi, R. Exposome Extrinsic Factors in the Tropics: The Need for Skin Protection beyond Solar UV Radiation. Sci. Total Environ. 2021, 782, 146921. [Google Scholar] [CrossRef]
  67. Sarra, S.R.; Mülfarth, R.C.K. Os Impactos Da Onda de Calor de 2019 Sobre a Saúde Da População Na Cidade de Bauru (Estado de São Paulo—Brasil)/The Impacts of the 2019 Heatwave on Population Health in the City of Bauru (State of Sao Paulo—Brazil). Braz. J. Dev. 2021, 7, 63941–63960. [Google Scholar] [CrossRef]
  68. Alvin, D. Estudo Dos Principais Precursores de Ozônio Na Região Metropolitana de São Paulo. Ph.D. thesis, Universidade de São Paulo, São Paulo, Brazil, 2013. [Google Scholar]
  69. Valdambrini, N.M.; Ribeiro, F.N.D. Avaliação Das Ultrapassagens Dos Padrões de Ozônio Troposférico No Estado de São Paulo de 2014 a 2019. Rev. Bras. Meteorol. 2021, 36, 735–747. [Google Scholar] [CrossRef]
  70. Chen, B.; Zhen, L.; Wang, L.; Zhong, H.; Lin, C.; Yang, L.; Xu, W.; Huang, R.-J. Revisiting the Impact of Temperature on Ground-Level Ozone: A Causal Inference Approach. Sci. Total Environ. 2024, 953, 176062. [Google Scholar] [CrossRef]
  71. Oliveira, M.C.Q.D.; Drumond, A.; Rizzo, L.V. Air Pollution Persistent Exceedance Events in the Brazilian Metropolis of Sao Paulo and Associated Surface Weather Patterns. Int. J. Environ. Sci. Technol. 2022, 19, 9495–9506. [Google Scholar] [CrossRef]
  72. Sánchez-Ccoyllo, O.R.; De Fátima Andrade, M. The Influence of Meteorological Conditions on the Behavior of Pollutants Concentrations in São Paulo, Brazil. Environ. Pollut. 2002, 116, 257–263. [Google Scholar] [CrossRef] [PubMed]
  73. Hong, J.; Mao, F.; Chen, L.; Zhang, Y.; Gong, W. Rapid Extreme Particulate Pollution during Cold Frontal Passage over Central China. Atmos. Res. 2022, 280, 106453. [Google Scholar] [CrossRef]
  74. Reboita, M.S.; Ambrizzi, T.; Silva, B.A.; Pinheiro, R.F.; Da Rocha, R.P. The South Atlantic Subtropical Anticyclone: Present and Future Climate. Front. Earth Sci. 2019, 7, 8. [Google Scholar] [CrossRef]
  75. Coelho, C.A.S.; De Oliveira, C.P.; Ambrizzi, T.; Reboita, M.S.; Carpenedo, C.B.; Campos, J.L.P.S.; Tomaziello, A.C.N.; Pampuch, L.A.; Custódio, M.D.S.; Dutra, L.M.M.; et al. The 2014 Southeast Brazil Austral Summer Drought: Regional Scale Mechanisms and Teleconnections. Clim. Dyn. 2016, 46, 3737–3752. [Google Scholar] [CrossRef]
  76. Santos, T.C.D.; Reboita, M.S.; Carvalho, V.S.B. Investigação Da Relação Entre Variáveis Atmosféricas e a Concentração de MP10 E O3 No Estado de São Paulo. Rev. Bras. Meteorol. 2018, 33, 631–645. [Google Scholar] [CrossRef]
  77. Reboita, M.S.; Mattos, E.V.; Capucin, B.C.; Souza, D.O.D.; Ferreira, G.W.D.S. A Multi-Scale Analysis of the Extreme Precipitation in Southern Brazil in April/May 2024. Atmosphere 2024, 15, 1123. [Google Scholar] [CrossRef]
  78. Banta, R.M.; Senff, C.J.; Alvarez, R.J.; Langford, A.O.; Parrish, D.D.; Trainer, M.K.; Darby, L.S.; Michael Hardesty, R.; Lambeth, B.; Andrew Neuman, J. Dependence of Daily Peak O3 Concentrations near Houston, Texas on Environmental Factors: Wind Speed, Temperature, and Boundary-Layer Depth. Atmos. Environ. 2011, 45, 162–173. [Google Scholar] [CrossRef]
  79. Banta, R.M.; Senff, C.J.; Nielsen-Gammon, J.; Darby, L.S.; Ryerson, T.B.; Alvarez, R.J.; Sandberg, S.P.; Williams, E.J.; Trainer, M. A Bad Air Day in Houston. Bull. Amer. Meteor. Soc. 2005, 86, 657–670. [Google Scholar] [CrossRef]
  80. Li, W.; Wang, Y.; Bernier, C.; Estes, M. Identification of Sea Breeze Recirculation and Its Effects on Ozone in Houston, TX, During DISCOVER-AQ 2013. JGR Atmos. 2020, 125, e2020JD033165. [Google Scholar] [CrossRef]
  81. Capucin, B.C.; Rehbein, A.; Reboita, M.S.; Lucyrio, V.; Escobar, G.C.J. Análise Sinótica e de Grande Escala de Ondas de Frio Extremas No Sudeste Do Brasil No Século XX. Anu. Inst. Geociênc. 2022, 45, 41532. [Google Scholar] [CrossRef]
  82. Lu, P.; Liu, R.; Luo, Z.; Li, S.; Wu, Y.; Hu, W.; Xue, X. Impacts of Compound Extreme Weather Events on Summer Ozone in the Beijing-Tianjin-Hebei Region. Atmos. Pollut. Res. 2024, 15, 102030. [Google Scholar] [CrossRef]
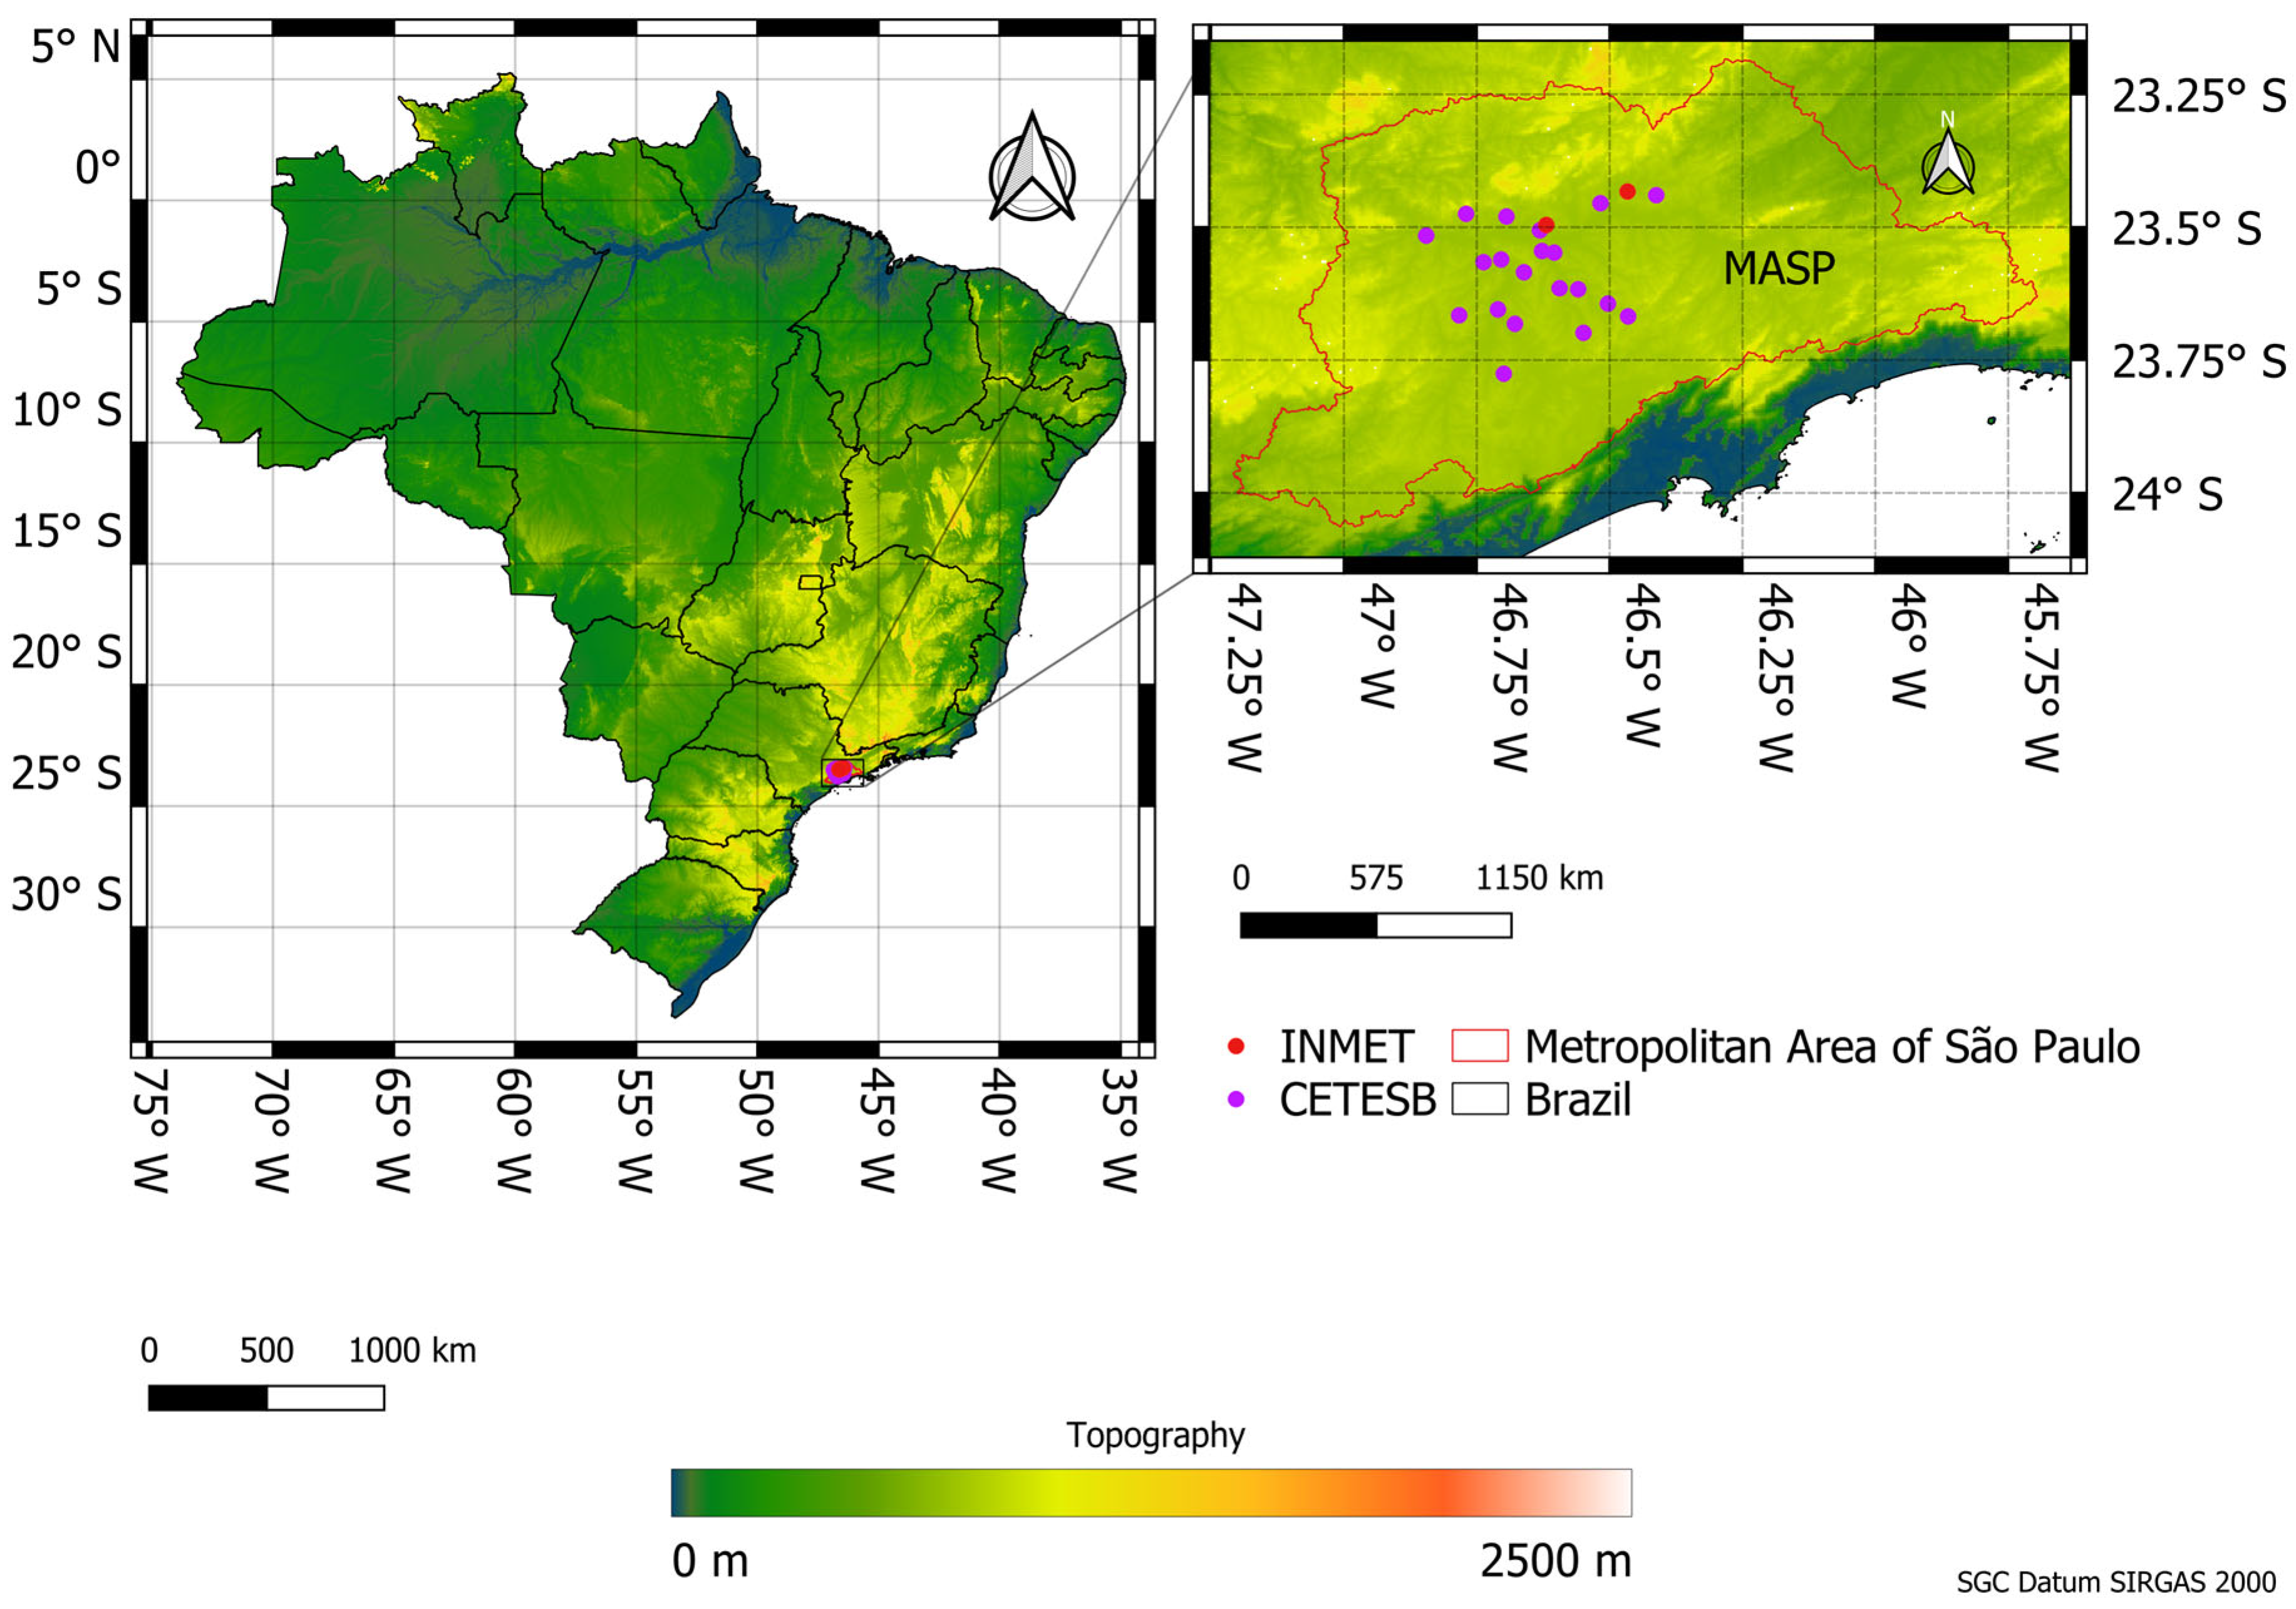
Figure 1. Study area. The location of the MASP in Brazil is presented on the left side, and on the right side, the MASP is presented in detail. The purple dots represent the location of the CETESB air quality and meteorology stations considered in this study, and the red dots represent the location of the INMET weather stations.
Atmosphere 16 00822 g001
Figure 2. Monthly maximum (a) and mean (b) MD8A-O3 values (in µg.m−3) for the Megacity of São Paulo, based on data recorded between 1998 and 2023 at 20 stations. In each panel, the bottom line represents the lowest value among stations (minimum of the maximum in (a); minimum of the mean in (b)), the middle line indicates the mean among stations, and the top line shows the highest value among stations (maximum of the maximum in (a); maximum of the mean in (b)). Dashed lines indicate the Air Quality Guideline (AQG) value and the Interim Targets (IT-1 and IT-2) recommended by the WHO (2021) [51].
Atmosphere 16 00822 g002
Figure 3. MK trend results for (a) the MD8A-O3 and (b) Tmax values at all sites from 1998 to 2023. Positive values indicate increasing trends, and negative values indicate decreasing trends. Trends are considered statistically significant when p-value < 0.05. Non-significant values (p-value ≥ 0.05) represent trends that are not statistically significant, whether increasing or decreasing.
Atmosphere 16 00822 g003
Figure 4. Daily MD8A-O3 concentrations (left panels, in µg.m−3) and maximum temperatures (Tmax, right panels, in °C) for four compound events: (a) 10–16 October 2002, (b) 25 February–3 March 2003, (c) 3–8 February 2012, and (d) 5–11 February 2014. The solid lines represent daily values, while the dashed lines indicate the 90th percentile thresholds for each variable.
Atmosphere 16 00822 g004
Figure 5. (ac) Mean sea level pressure (hPa, green lines), temperature at 2 m anomaly (°C, in color), and wind at 850 hPa (m.s−1, arrows); (df) anomalies of geopotential height (m, in color) and wind (m.s−1, arrows) at 850 hPa; (gi) anomalies of geopotential height (m, in color) and wind (m.s−1, arrows) at 250 hPa; (jl) precipitation anomaly (mm.day−1, in color). Figures in the first column (a,d,g,j) represent the composition considering only days during the heatwaves, in the second column (b,e,h,k), days during ozone extreme events, and in the third column (c,f,i,l), the atmospheric patterns during the compound events.
Atmosphere 16 00822 g005
Table 1. Sites and variables measured.
CodeNamePeriodParametersLat (°S)Lon (°W)
63Santana1999–2023O3−23.506−46.631
64Santo Amaro2000–2023O3−23.655−46.710
65Mauá1998–2023O3−23.668−46.465
72P. D. Pedro II1998–2023O3, T−23.545−46.627
83Ibirapuera1998–2023O3, T−23.585−46.661
85Moóca1998–2023O3−23.548−46.604
86São Caetano1998–2023O3, T−23.617−46.559
92Diadema1999–2023O3−23.615−46.594
95Cidade Universitária USP—IPEN2007–2023O3−23.566−46.737
96N. Sra. do Ó2004–2023O3−23.480−46.694
98Grajaú—Parelheiros2007–2023O3, T−23.776−46.699
99Pinheiros1999–2023O3, T−23.561−46.704
100Santo André—Capuava2000–2023O3−23.644−46.503
262Interlagos2012–2023O3, T−23.682−46.678
263Carapicuíba2012–2023O3, T−23.516−46.845
264Guarulhos—Paço Municipal2012–2023O3, T−23.455−46.517
269Capão Redondo2012–2023O3, T−23.666−46.783
272São Bernardo—Centro2014–2023O3, T−23.699−46.549
279Guarulhos—Pimentas2015–2023O3, T−23.440−46.412
284Pico do Jaraguá2016–2023O3, T−23.475−46.770
83075Guarulhos *1998–2014Tmax−23.433−46.466
83781Mirante de Santana *1998–2023Tmax−23.496−46.619
* INMET weather stations.
Table 2. The 90th percentile (p90) threshold values for each station and for the MASP average.
CodeNameO3 (p90)Tmax (p90)
63Santana119.63-
64Santo Amaro115.63-
65Mauá117.75-
72P. D. Pedro II107.7532.8
83Ibirapuera130.3830.9
85Moóca112.25-
86São Caetano118.6334.2
92Diadema113.00-
95Cidade Universitária USP—IPEN132.13-
96N. Sra. do Ó115.88-
98Grajaú—Parelheiros100.63-
99Pinheiros99.7533.5
100Santo André—Capuava115.13-
262Interlagos124.13-
263Carapicuíba110.3832.3
264Guarulhos—Paço Municipal113.6332.6
269Capão Redondo-32.0
83075Guarulhos-33.2
83781Mirante de Santana-32.6
MASP Average-110.7632.59
Table 3. Dates of individual and composite extreme events in the Megacity of São Paulo between 1998 and 2023. The first column presents the dates of exclusively heatwave events, the second column shows exclusively extreme ozone events, and the third column indicates composite events, characterized by the simultaneous occurrence of both.
Heatwave (6 Consecutive Days Above the Tmax p90 Threshold)O3 Extremes (6 Consecutive Days Above the MD8A-O3 p90 Threshold)Compound Events
7–12 February 20031–7 September 199910–16 October 2002 1
31 January to 8 February 20108–14 October 201425 February to 3 March 2003 2
22–30 January 201112–20 January 20153–8 February 2012 3
27 January to 4 February 20148–18 November 20235–11 February 2014 4
9–14 January 2015
28 January to 2 February 2019
22–27 September 2023
1 Heatwave started in 5 October. 2 O3 extreme event started on 24 February and lasted until 4 March. 3 Heatwave lasted until 9 February. 4 Heatwave started on 27 January (identified as a single heatwave event until 5 February) and lasted until 13 February.
Disclaimer/Publisher’s Note: The statements, opinions and data contained in all publications are solely those of the individual author(s) and contributor(s) and not of MDPI and/or the editor(s). MDPI and/or the editor(s) disclaim responsibility for any injury to people or property resulting from any ideas, methods, instructions or products referred to in the content.