Abstract
This study aims to recover, interpret and analyse the early meteorological observations made in Venice by Bernardino Zendrini from 1738 to 1743. Zendrini used a cistern barometer, an Amontons-type air thermometer and an additional mercury thermometer, i.e., a de l’Isle one. By comparing and interpreting the existing details, the instruments have been re-imagined, interpreted and discussed; finally their unknown scale and calibration points have been calculated. The barometer readings needed standard corrections, which were not known at that time. The scale of the air thermometers was in inches of mercury. Zendrini used a reversed scale, with boiling water set to 0, but neglected the second calibration point and the length of the tube. In addition, he gave the thermoscopic readings without the corresponding pressures. The methodology for the calibration, validation and transformation of the readings into modern units, i.e., hPa and °C, is carefully discussed. This paper provides and analyses new data, and improves our knowledge about the history of science, meteorological measurements, instruments and observations in the first half of the 18th century.
1. Introduction
As is well known, meteorological measurements in Padua were first made in 1725 by Marquis Giovanni Poleni (born 1683–died 1761), a professor at the University of Padua, mathematician, physicist, engineer, architect and initiator of a series of meteorological observations (Figure 1a). Poleni built his thermometer in 1709, with the help of his friend Giovanni Battista Morgagni. Starting in 1740, Morgagni made a second, parallel series [1,2,3,4,5].
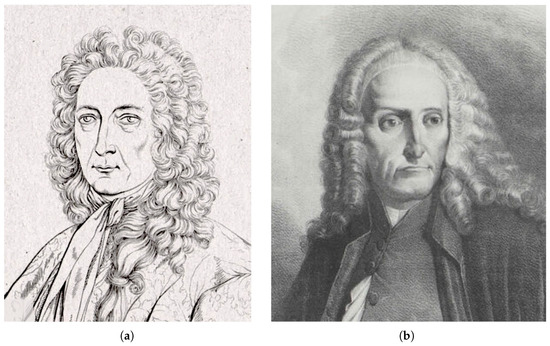
Figure 1.
(a) Giovanni Poleni; (b) Bernardino Zendrini (Courtesy of Austrian National Library, CC-BY-NC-SA 4.0).
The first meteorological observations in Venice were made by Bernardino Zendrini (born 1679–died 1747), an illustrious doctor, mathematician, hydraulic engineer and astronomer, with responsibility for the public works of the ‘Serenissima,’ i.e., the Most Serene Republic of Venice (Figure 1b). He was also a consultant to Charles VI, the Holy Roman Emperor and ruler of the Austrian Habsburg monarchy, who invited him to Vienna; to Pope Clement XII for the reorganization of some rivers of the Papal States; and to the Republic of Lucca for port works and making rivers safer. He too was a ‘great friend’ of Poleni, and in 1740, they worked together, on behalf of the Serenissima, on the construction of a coastal dam to protect the city from the sea, known as the ‘Murazzi’ of the Lido [6,7,8].
Starting from 1736, Zendrini made various observations of astronomical events (aurora borealis, eclipses, astral conjunctions) and then he performed measurements of air pressure, temperature, and precipitation. As far as meteorological observations are concerned, he published a summary of the data from 1738 to 1743 in four papers [9,10,11,12]. Because of his various activities, he was forced to interrupt and then stop his observations. After his death, the measurements were taken up by a friend and former disciple of Zendrini and Poleni, i.e., Tommaso Temanza, who made observations from 1751 to 1763.
In addition to friendship and an interest in meteorology, a common element of all these characters was the use of the Amontons-type air thermometer. In 1709, Poleni and Morgagni built together an air thermometer [1], which Poleni then used throughout his life. Zendrini made simultaneous observations with two thermometers: an Amontons and a de l’Isle one [5,9,10,11,13,14]. The latter thermometer was initially left undefined in the first two publications, but in the third one it was named de l’Isle (‘Islianum Thermometrum’) [11]. Zendrini did not understand the physics underlying the Amontons thermometer. Therefore, he neglected to provide the simultaneous matched heights of the two mercury columns in the thermoscope and the barometer. In addition, he read the column of mercury of the thermoscope starting from the point of ebullition of water, without specifying to what level this corresponded. The scale was undefined because the second calibration point (i.e., melting ice) was not given. The use of an undefined scale and the lack of metadata have discouraged all scholars who have tried to tackle this series to date.
Two centuries ago, the Danish climatologist Schouw complained bitterly: “I do not believe that conclusions can be drawn from these data” [13]. Referring to all the observers in Venice, he was strongly skeptical and categorical: “all these data cannot deserve trust” [13]. Such a severe judgment is undoubtedly justified from the point of view of those who look with hindsight and note various flaws in the technical–scientific rigor of the observers. However, the obscure observations provided by these pioneers constitute the only information available for that time in Venice, so they deserve the utmost attention and effort to extract as much information as possible.
This article presents a thorough study carried out to understand the instruments, and decipher and recover the pressure and temperature observations made by Zendrini. The first aim is to rescue, interpret, correct and transform the raw data into modern units and analyse them, taking advantage of the contemporary series of Poleni in Padua, which has already been recovered and reconstructed [5,15,16,17,18]. For the temperature, it was necessary to reconstruct the characteristics of the thermometers used and carry out a retrospective calibration to recognize the measured values. The final aim was to establish whether the two thermometers were kept inside or outside, and to identify Zendrini’s modus operandi.
Since the discussion may be complex for some technical details of the thermometers, instead of presenting first all the instruments and then a critical discussion, for the sake of clarity, one instrument has been dealt with at a time, from its presentation to its conclusion.
2. Handwritten Registers and Publications
The registers with the daily observations made by Zendrini have been irretrievably lost. A century ago, Crestani [14] had already searched for them in vain in all of the libraries and archives of Venice and Padua, and our research had the same result. A summary of the observations is found scattered in the files that Zendrini published in a cultural journal in Venice between 1741 and 1744, edited by Angelo Calogerà, as shown in Table 1. The articles are written in Latin, and report some interesting data, such as the climatic extremes of each year of observation. However, as explained, the information contained is not sufficient to interpret the instrument scales.

Table 1.
Daily pressure and temperature observations made by Zendrini.
Zendrini was engaged in several activities in and outside Venice, including official consultancy assignments that took him abroad, e.g., in Bologna, Ravenna, Lucca, Vienna, and so on [19]. Therefore, it is unlikely that he could take regular observations every day and keep a register in good order. It is likely that he made his observations on the most interesting days. Only the rain observations were probably regular, because he collected the rain in a big vessel, and could read the level at his convenience. In addition, it must be said that in that period, when sums and divisions were done by hand, calculating averages required a great deal of effort and time. Instead, the middle point, derived from the Aristotelian principle ‘in medio stat virtus’ (the right thing is in the middle), could easily be calculated from the two extremes [20]. Moreover, this also greatly simplified the observations, because the temperature extremes were reached in the heart of winter and summer, so it was sufficient to measure temperature for one or two months within these two seasons. As an authoritative reference, this practice was used in the secondary stations of the Medici Network (1654–1650) [21] and also by de la Hire, who published annually in the Mémoires de l’Académie Royale de Paris the temperature extremes he measured in the Royal Observatory of Paris, starting in 1692 [22]. It should also be said that the information given with the two extremes was considered preferable to the average, because with the two extremes, one had an idea of the variability, as well as of the “normal” value represented by the median. Finally, by limiting the commitment to short periods of measurement, it was possible to balance one’s professional life with conducting the observations.
3. The Barometer
Nothing is said about the barometer. Very likely, it was a basic Torricelli cistern barometer. In the 18th century, the barometric readings were not corrected. Since the diameter of the capillary tube is not given, it is not possible to estimate and correct for the capillary error. We have corrected the error for the different density of mercury due to thermal expansion to standard conditions, using the following formula [23,24]:
where and are the pressures at the temperatures 0 °C and °C, respectively. As the temperature for corrections was not given, we considered the values measured in Padua that generally depart by °C from the ones measured in Venice.
Moreover, since the center of Venice is located at latitude 45°26′, correction for latitude is not necessary.
With the Amontons thermometer, the matched pressure must be considered at the actual instrument level and not reduced to sea level. In contrast, when the atmospheric pressure is intended as a meteorological parameter to be compared with other stations, this should be reduced to sea level. However, in this specific case, things are different. The average height of the streets in Venice is about 1 m above the average sea level and we do not know what floor Zendrini lived on. Since Venetian houses are generally four storeys, assuming an intermediate floor, the correction is of the order of 0.5 hPa. It is preferable to avoid unjustified corrections, and to consider them in terms of uncertainty bands. The extreme pressure levels observed by Zendrini are reported in Table 2.
Table 2.
The yearly extreme barometer readings with the original date (in Latin and translated), the values of the observed mercury column heights ( in ounces 1 and lines of Paris; converted to mm Hg), the temperature to correct the thermal expansion of mercury (from Poleni’s contemporary record), and the corrected pressure (in hPa).
4. Thermometers and Thermometer Scales in the Eighteenth Century
The air thermometer is very sensitive to the strong expansion that the air undergoes when it is heated, and Galileo’s thermoscope was based on this principle. The instrument was a kind of U-bend pressure gauge, with a flask containing air (which acted as a bulb), compressed by a column of mercury (Figure 2a). The use of thermoscopes in the 17th century is well documented in the literature, and images can be seen in meteorological treatises of the late 17th century. However, the readings were affected by the atmospheric pressure. At the beginning of the 18th century, two solutions were found to transform this device into a thermometer to obtain real temperature readings [20]. Amontons [25] established that the temperature was represented by the total height of the two mercury columns, i.e., it was sufficient to sum the column of the barometer and the column of the thermoscope. So, the Amontons thermometer was composed of two instruments: a thermoscope (improperly nicknamed ‘thermometer’) and a barometer, placed in proximity to it, as in Figure 2b [26]. In Bologna, Vittorio Francesco Stancari sealed the top of the thermometric tube to make it independent of atmospheric pressure [27,28]. Jacopo Bartolomeo Beccari and Gusmano Galeazzi used this instrument from 1715 to 1737, but then abandoned it, probably because it was damaged [29].
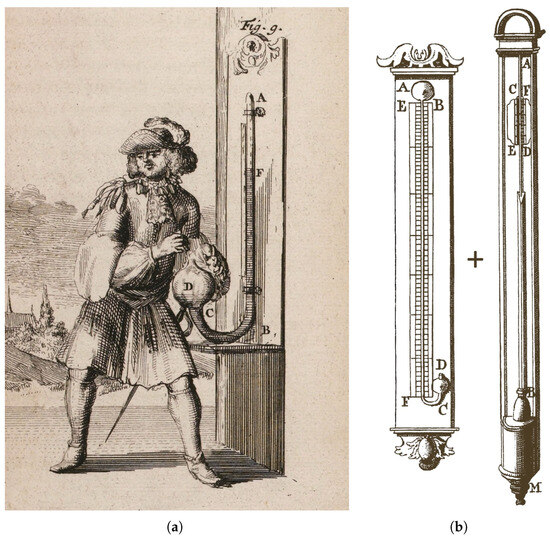
Figure 2.
(a) Before the creation of the Amontons thermometer, the thermoscope was normally used as an air thermometer (from D*** alias D’Alencé [30]). (b) The Amontons thermometer, constituted by a thermoscope and a barometer [26]. Letters in (a). D: The flask containing the air pocket. CA: The J-shaped glass tube containing the mercury column. The top of A is open in the Amontons’ thermometer; it is hermetically sealed in Stancari’s thermometer. F: The top of the mercury column. B: The wooden tablet to which the thermometer is fixed. Letters in (b). On the left: an Amontons thermometer as explained, but with a clearer graduated scale, EF. On the right, a barometer. AB: The glass tube. FD: A little sliding scale called a ‘vernier’ or ‘nonius’, which is attached to the side of the last significative three inches of the larger scale, CE, to read small fractional values. M: The advanced barometers had a screw mechanism to adjust the mercury level in the cistern. Zendrini used a basic instrument: certainly without a ‘nonius’ and very likely without a screw adjustment (Courtesy of Gallica, Bibliothèque Nationale de France, CC-BY-NC-SA 4.0).
Amontons used a spherical flask to contain the air (Figure 3a), while Poleni preferred a cylindrical bulb [1] to always keep the section of the free surface of mercury the same (Figure 3b) and therefore avoid the non-linearity that the spherical bulbs generated [15]. The history of the observations in Padua has been reconstructed, and the records have been recovered, corrected and analysed and made publicly available [5,15,16,17,31]; the same was performed for Bologna [29,32,33,34].
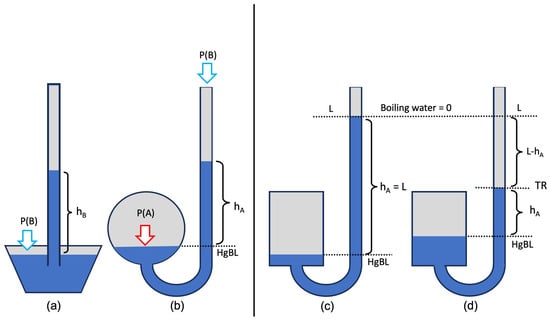
Figure 3.
(a) Torricelli’s cistern barometer; height of the mercury column in the barometer; atmospheric pressure acting on the barometer and on the open tube of the Amontons thermoscope. (b) Amontons thermoscope; height of the mercury column; pressure exerted inside the flask of the thermoscope; HgBL baseline, which corresponds to the free surface of mercury. (c) Zendrini thermoscope at calibration. The level L reached by at boiling temperature was initially taken as a reference, with inverse scale. (d) Zendrini’s temperature readings are expressed as ; however, L, and HgBL are unknown.
It is useful to analyse the physical principle of this instrument to understand the corrections needed to interpret Zendrini’s readings. The height of the barometric column is generated by the atmospheric pressure acting on the free surface of the mercury in the cistern. The same pressure, however, is exerted on the top of the column in the thermoscope and opposes the pressure exerted in the flask, reducing the level of the thermoscopic column. The sum of the two heights and is independent of and is only determined by the pressure of the air pocket in the flask. Therefore, the temperature of the Amontons thermometer is given by the sum of the two mercury columns and , read in the barometer (Figure 3a) and in the thermoscope, respectively (Figure 3b).
The transformation from this height in inches to temperature in °C is obtained by relating this sum to the values reached in the calibration, made using melting ice as a lower reference and boiling water as a higher reference. Of course, the free surface of the mercury in the flask shifts with temperature and pressure, so the height of the mercury column must be measured starting from the baseline given by the free surface of the mercury. Therefore, the scale should be adjusted before each reading. When this is not performed, the readings need to be corrected.
Unfortunately, Zendrini was not a physicist and did not understand the physics of the Amontons thermometer. In addition, he was misled by the novelties of the universal thermometer that was being proposed at that time, as discussed later. As a matter of fact, he considered the barometer and the thermoscope as two independent instruments. Therefore, when he read an extreme value of pressure, he noted the date and reported the level read in the barometer, but without the temperature necessary to correct it for the density of mercury. Similarly, when he read on the thermoscope an extreme level, he reported this value but without the matched column of pressure to be summed. From Zendrini, we know that the annual pressure range in 1738 was 1 ounce (27.22 mm Hg hPa). Assuming the average atmospheric pressure, the uncertainty in temperature is ounce (about mm). Since, in 1738, the annual excursion in the thermoscope ranged between 18 ounces and 2 lines (494.5 mm) and 23 ounces and 1 line (628.3 mm), equal to 134 mm, the amplitude of the uncertainty is of the order of 20% of the signal. This error is quite considerable.
Padua is located about 30 km from Venice; the pressure difference between the two locations is of the order of hPa, and we know the contemporary values observed by Poleni. Then, by using Poleni’s pressure to correct the readings of Zendrini’s thermoscope, the amplitude of the uncertainty is reduced to 1% of the signal. This method allows us to integrate the temperature values of the thermoscope with a good approximation by substituting the missed pressure of Venice with the corresponding values of Padua.
In the first paper with the 1738 observations, Zendrini [9] wrote that he had used an Amontons air thermometer, and that he had adopted the inverted scale, counting the height of the column of mercury from the top of the tube, rather than from the base, as others also did: Ole Römer in 1702; Joseph-Nicolas de l’Isle, when in 1724, he was appointed in St Petersburg [35]; and Anders Celsius in the first calibration, before Carl Linné alias Linnaeus (1737) converted the scale into the well-known Centigrade scale (Figure 4) [36,37].
Figure 4.
The first representation of the increasing Centigrade scale, made by Linnaeus (detail from Linné 1737, Courtesy of Bayerische Staatsbibliothek NoC-NC 1.0).
Having an inverted or an increasing scale does not create difficulties for data transformation. The problem lies in how Zendrini calibrated the thermoscope and presented his data, omitting some key information. First, Zendrini kept the thermoscope at boiling water temperature and marked on the thermoscope the level of the mercury column (Figure 3). Then, he gave the temperature readings R starting from L, that is, the difference . This leads to two problems: L is not known, and the base value HgBL, which is continually changing, is not known either.
5. Reconstructing the Scale of the Amontons Thermometer
We can reconstruct the Amontons scale if the extreme values measured in Venice are related to the contemporary observations of pressure and temperature in Padua. To this aim, it should be considered that in summer, the temperature in Venice is around 1 °C less and in winter, is 1 °C higher than in Padua, due to the mitigative effect of the sea. Under this assumption, the calibration is made of three points: the boiling water that is known, the winter extreme as the second calibration point, and the summer extreme, to verify the goodness of this linear fit.
As all of the unknown or perturbing factors (e.g., scale unit, atmospheric pressure) give linear contributions, it is possible to perform a new empirical calibration in °C, taking advantage of the few things known and under some specific simplifying assumptions and operative steps, as follows:
- The new temperature scale refers to the standard atmospheric pressure, i.e., 1013 hPa.
- The boiling point is confirmed on the top of the scale.
- The Zendrini temperature readings () of 1738 are converted from ounces to mm.
- Considering the contemporary atmospheric pressure P (hPa) measured by Poleni in Padua, this is converted into Torr by multiplying it by mm Hg/hPa and the disturbing effect of pressure is calculated: .
- In the thermoscope, 1 mm Hg in excess on the top of the column lowers the height of the mercury column by 1 mm, and vice-versa for lower values, so that , and it is possible to adjust (mm) for the pressure effect.
- The extreme winter temperature reading (mm) is corrected for the effect of with an algebraic sum, i.e., the observed corrected (mm) value.
- For the extreme winter temperature, the corrected height is coverted to Padua temperature, but mitigated by +1 °C for the proximity to the sea.
- In principle, we now have two calibration points: boiling water and the winter extreme. However, it is better to verify and add a third calibration point, taking advantage of the summer extreme that is internal to this interval. If this calibration is good, the three points are aligned and the coefficient of determination gives the goodness of this linear fit.
- The same methodology is repeated for the summer extreme, but mitigated by −1 °C for the proximity to the sea and the third calibration point is applied to the calibration plot.
- The linear interpolation equation gives the new calibration, and if is close to 1, then this calibration allows us to interpret all of Zendrini’s readings using this new calibration scale.
The result of the above empirical calibration made with the 1738 data, including the additional Zendrini readings (corrected for ) for 1739 and 1741, is reported in Figure 5. The linear best-fit equation to transform the converted temperature reading (mm) into °C is as follows:
with .
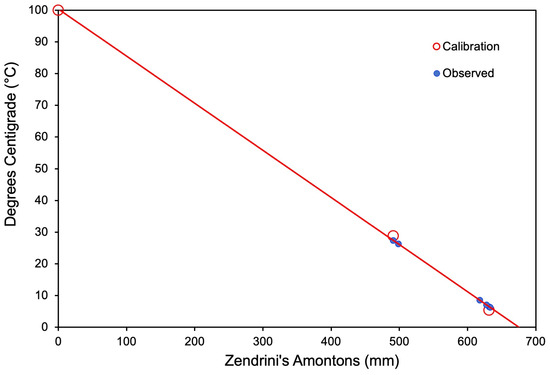
Figure 5.
Calibration of the Amontons thermometer used by Zendrini, based on the 1783 records. Open red circles: calibration. Blue dots: observed values.
It should be noted that the intercept is 100.3 instead of 100 (0.3% departure) for the interpolation made with approximations (for instance, the point of boiling water may have been made at non-standard pressure). From Equation (3), the usual lower calibration point at melting ice can be calculated, i.e., °C at mm. Considering that the scale should include values below the freezing point, one should conclude that the total length of the tube, and the wooden tablet with the scale, should have been about 1 m long, or a little less.
The alignment of the three calibration points shows that the response is linear and suggests that the flask with the air pocket is a cylinder, following Poleni’s style, not the Amontons spherical flask.
If, instead of mm, one passes to cm, then the slope of the line becomes . This value is not random, but, if one considers the first two significant figures, it is close to the ratio of the pressures in the flask, or of the heights H of the mercury columns at 100° and °C, found in the literature, i.e., Poleni in the 1709 calibration in Venice, found 1.40, and in that of Padua, 1.33; the value found by Amontons was 1.40, and by Lambert, was 1.37 [15]. These values are related to the ratio of the absolute temperatures of the two fixed points, i.e., . However, it must be considered that air thermometers did not operate with a perfect gas, but with air with some moisture dispersed in it. The latter could change state at certain combinations of temperature and pressure.
In conclusion, the extremes for the various years reported by Zendrini for the Amontons thermometer are reported in Table 3.
Table 3.
Amontons readings with original date (in Latin and English), values of the observed mercury column height (in ounces and lines of Paris, and mm), correction for the counteracting pressure (from Poleni’s contemporary record) and transformation into modern units (, in mm and °C).
Considering that in winter, the temperature frequently reaches or drops below the freezing point in Venice, the mild winter values >6 °C indicate that the thermometer was kept indoors, and the building was poorly ventilated.
6. De l’Isle Thermometer Used by Zendrini
In addition to the Amontons thermometer, Zendrini used an unknown mercury one. In the first two papers, he only wrote that the boiling point was set to zero but missed a second calibration point. The capillary was 10 ounces (28.9 cm) long, and the bulb was a cylinder 2 ounces (5.8 cm) long and ounce (1.4 cm) in diameter. He added a scale with every ‘digit’ divided into 120 parts. The digit is of a Venice foot, i.e., 21.7 mm, and each part was 0.2 mm. Zendrini wrote that the hottest day was in August, with 464 parts below the boiling point, and the extreme cold in January was 181 parts below it, i.e., 32.6 mm, that is, a yearly range of digit, as he specified. The problem is that we do not know any temperature value to associate with this scale. In the first paper, with the observations made in 1738, Zendrini [6] wrote that the zero was fixed at boiling water for both the Amontons and the unknown thermometers. In the third paper, with the observations made in 1741, Zendrini [11] wrote that the unknown thermometer was a de l’Isle thermometer.
It must be specified that Joseph-Nicolas de l’Isle planned to build a universal thermometer, whose scale was independent of everything, and could be easily reconstructed by anyone, anywhere in the world, and at any time [35]. Then, the scale would have been determined according to the contraction of the thermometric fluid, the mercury, or rather, the contraction of the mercury relative to that of the glass that constituted the tube. The universal degrees indicated the value of the contraction: the higher the degree, the greater the contraction. This led to an inverse scale, decreasing with the hot and increasing with the cold. Since de l’Isle [35] had found that there was a linear relationship between the contraction of mercury and the temperature measured with the air thermometer, but not with water or alcohol, the contraction of mercury, like that of air, would provide the universal thermometric scale. In other words, the degrees of the thermometer should have been interpreted in terms of the percentage of reduction in the mercury volume, which could be identified by the subdivisions of the scale. The scale should have as many subdivisions as possible, such as 100, 1000, or 10,000, depending solely on the size of the thermometer. These principles were enunciated in a speech in 1733 to the Academy of S. Petersburg and published in 1738 [35], the year in which Zendrini began his measurements.
The thermometer built by de l’Isle in 1724 had the scale divided into 2400 or 2700 degrees °D to account for the low temperatures in St Petersburg. In 1738, Josias Weitbrecht recalibrated the thermometer for St Petersburg, with a second scale in degrees °De (to be distinguished from the previous ones in °D), with boiling water at 0 °De and the temperature of the cellars of Paris at 100 °De. Consequently, the melting ice was 150 °De [36,38]. The latter is known as the de l’Isle scale °De and was included in the overviews of the most used scales.
A very interesting and poorly known overview of different scales was published by Martine in 1740 [39], which includes the Celsius scale in the increasing Centigrade version, two years before that usually attributed to Celsius [40] in 1742. This has been added at the last minute to the edge of the table in Figure 6a. It should be noted that the overview reports the Amontons scale, in contrast to the scale used by Zendrini or Poleni; the Poleni scale, an early type of Réaumur scale, differed from the well-known ’false’ Réaumur scale by 0 °R at melting ice to 80 °R at boiling water and from the de l’Isle scale by 0 °De at boiling water and 150 °De at melting ice.
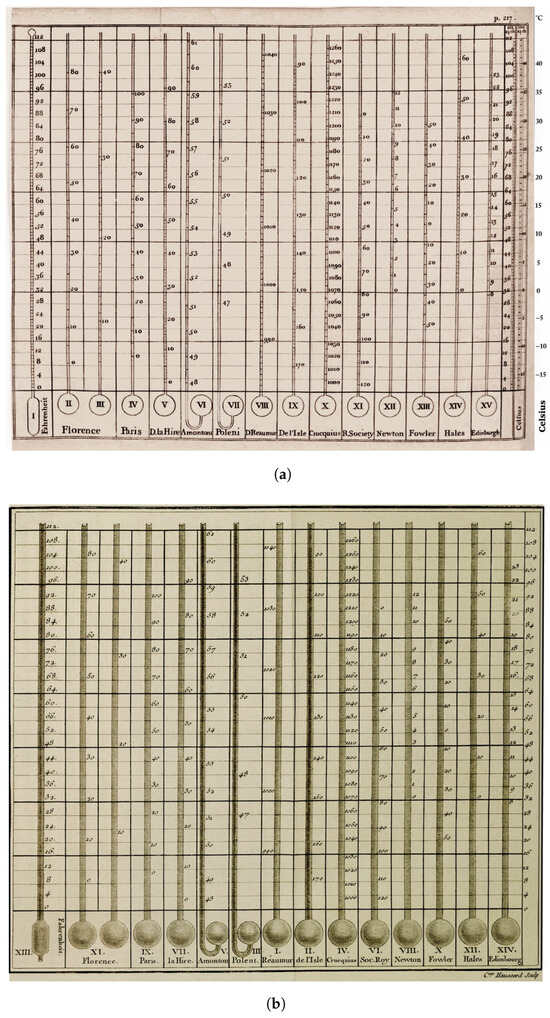
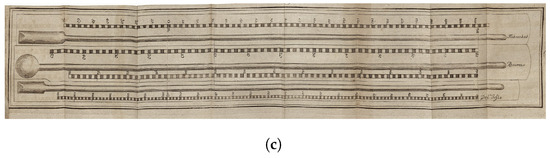
Figure 6.
(a) Overview of the most popular thermometric scales: Fahrenheit, Florence, Paris, de la Hire, Amontons, Poleni, du Réaumur, de l’Isle, Crucquius, Royal Society, Newton, Fowler, Hales, Edinburgh, Fahrenheit (repeated without heading) and Celsius, and their conversion from Martin (1740) [39]. (b) The same from Cotte (1774) [41]; (c) Fahrenheit, the two Réaumur scales, and the de l’Isle scale, from Kretzschmar (1777) [42]. Credits: (a) Courtesy of the British Museum, CC-BY-NC-SA 4.0. (b) Courtesy of Gallica, Bibliothèque Nationale de France, CC-BY-NC-SA 4.0. (c) Courtesy of the Bayerische StaatsBibliothek No C-NC1.0.
A very famous overview was published by Cotte in 1774 [41], which is almost identical to the previous one, but does not mention the Celsius scale (Figure 6b).
A third, specific overview including only Fahrenheit, both false and true Réaumur, and de l’Isle 0 °De at boiling water and 150 °De at melting ice was published by Kretzschmar in 1777 [42] (Figure 6c).
However, the de l’Isle thermometer scale used by Zendrini was not as universal and repeatable as hoped. In 1738, Zendrini used the first type of scale °D based on the contraction proposed by de l’Isle in 1724. This had no repeatable reference values. In contrast, the de l’Isle thermometers built after 1738 had a different scale, with degrees 0 °De at boiling water and 150 °De at melting ice. This is the well-known de l’Isle scale.
If one considers that Zendrini began the measurements in 1738, it can be understood that he was convinced by the know-how of the moment, trusting what de l’Isle had said in 1733 [35]. On this theory, he considered an air thermometer and a mercury thermometer, both calibrated on the basis of the temperature of boiling water as the only reference, relying on the contraction of air or mercury. It was probably for this reason that he did not give the second calibration point, thus putting anyone who wanted to interpret his data in difficulty.
Indeed, the Zendrini thermometer was similar to the first de l’Isle type, with only one calibration point at boiling water at 0 °D and a reversed scale. However, measuring 464 degrees in August 1738 and 645 degrees in January, the Zendrini thermometer does not fit any known scale, including the early thermometer with the de l’Isle and Celsius twin scale kept in Uppsala [43]). In the absence of a second reference, it is impossible to transform these readings into °C.
Every year, Zendrini reported the maximum and minimum temperature, and the indication of the calendar day in which the extremes occurred (Table 4). As explained for Amontons, we can take advantage of the contemporary series of Padua to determine these two extremes. In addition, we know that the top of the scale refers to boiling water, and that it is set to 0 °D. Therefore, it is possible to proceed to calibrate the thermometer with the linear fit of three points: boiling water and the two extremes of the year 1738 (Figure 7). The result is given by the following equation:
where is the thermometer reading in °D, and . Again, the intercept is 99.35 instead of 100 (0.65%) for the interpolation made with approximations. From Equation (4), the two calibration points can be derived: boiling water °D and melting ice °D.
Table 4.
De l’Isle readings with original date (in Latin) and values (parts) of the scale and transformation into °C.
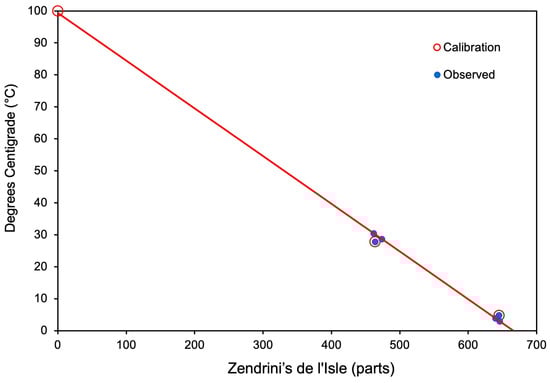
Figure 7.
Calibration of the de l’Isle thermometer used by Zendrini, based on the 1738 record.
It the previous sections, we have seen that the Amontons scale was longer than 60 cm, and that the de l’Isle thermometer was 30 cm. However, if one transforms the Amontons scale into mm and leaves the de l’Isle one with its original division into fine parts, then the equations for calibration are almost the same. For both thermometers, the boiling point was set at 0 °, while the melting point of ice in the two thermometers was 674 mm for the Amontons and 666 °D for the de l’Isle scales, respectively, with a difference of 1.4%. However, this occurred by chance, for this particular choice of units.
7. Thermometer Exposure
Zendrini did not specify whether the thermometer was kept inside or outside. Given the technology of the 18th century, air thermometers had the scale marked in ink on paper and glued to a wooden tablet. In addition, the glass tube was fixed to the tablet with an iron wire, and changes in humidity would have forced the wooden tablet to shrink or swell and break the glass with the iron’s tension. For this reason, thermometers could not be exposed directly to the sun, and they did not resist rain: in other words, they could not be exposed outdoors [20]. In addition, the network of the Royal Society, London, recommended that the thermometer was kept inside a room, possibly facing north, in which the fire in the fireplace would never be lit [44]. Poleni had followed these directives, ventilating the room well before each reading [5,45]. Very likely, Zendrini did the same.
Crestani [14] supposed that Zendrini had kept the Amontons thermometer inside and the de l’Isle outside to have indoor and outdoor observations. However, he could not prove this hypothesis. The analysis of the measured values shows that the extremes of the Amontons scale are mitigated compared to the de l’Isle scale, which shows lower temperatures in winter and higher ones in summer. This suggests that the big Amontons thermometer was always kept inside, while the small and movable de l’Isle thermometer was placed outside, at least for a certain amount of time before readings. The difference between the two thermometers is not constant, also because the choice of extreme days made by Zendrini for the Amontons thermometer depended only on the reading of the thermoscope column, without taking into account the barometric departure. This introduced a certain randomness that could correspond to a few mm of reading.
8. Conclusions
This study has opened a window into the first half of the 18th century and has made it possible to know Zendrini’s observations, under which hypotheses and with what instruments he operated. The thermometers used were quite rare. The Amontons thermometer was one of only three used in Italy, by Poleni, Zendrini and Temanza. It is possible, however, that even though there were three observers, there were only two instruments, assuming that Zendrini’s heirs passed the Amontons thermometer to their friend Temanza when Zendrini died. The de l’Isle thermometer of the first type, on the other hand, is the only one known in Italy.
We understand that Zendrini used an Amontons-type thermometer, with a cylindrical flask, following the model built by his friend Poleni. He was fooled by de l’Isle’s innovative ideas that a universal scale could be constructed, based on a single calibration point and on the contraction of the thermometric fluid. Unfortunately, this led to a scale that could not be interpreted. Zendrini did not understand that the Amontons thermometer required the sum of the columns of the thermoscope and the barometer, so he omitted this second datum. Fortunately, it has been possible to correct and interpret his data using the pressure measured in Padua by Poleni. Finally, it has been possible to recognize that Zendrini kept the Amontons thermometer indoors because the winter and summer temperatures were mitigated by the building. In this respect, Schouw’s [13] criticisms were justified.
However, it should be kept in mind that Zendrini was first and foremost a doctor, and a thermometer kept inside the house had a value of social medicine, which tells the temperature of the houses in which people lived, without heating, and this information was considered useful to interpret seasonal diseases.
The de l’Isle thermometer also had similar problems, due to its incorrect calibration, based on a single fixed point. In this case, we have also reconstructed the scale, and concluded that the thermometer was kept outside, as Crestani [14] had supposed. The outdoor exposure could have been permanent, or more likely, was for a short time before each reading.
This study has made it possible to reconstruct the readings of instruments, which no one has been able to achieve so far. However, the contribution to knowledge of the climate is modest, because only a few values of temperature and pressure were given. It can only be said that the three years 1738, 1739 and 1741 were not extreme, but rather mild.
Even if the climate contribution is modest, the results acquired are of undoubted cultural interest as they allow us to improve our knowledge on the history of ancient meteorological instruments and measurements. This study holds methodological value as a useful example of approaching, managing and critically solving problems related to observations performed in the first instrumental period, lacking the necessary metadata.
Author Contributions
D.C., A.d.V. and F.B. contributed to the conception and design of this paper. D.C., A.d.V. and F.B. contributed to the data recovery and interpretation and discussion of results. The first draft of the manuscript was prepared by D.C. and revised by A.d.V. and F.B. All authors have read and agreed to the published version of the manuscript.
Funding
This research received no external funding.
Data Availability Statement
The data presented in this study are available in FigShare at the url https://doi.org/10.6084/m9.figshare.c.7884848 (accessed on 19 June 2025).
Conflicts of Interest
The authors declare no conflicts of interest.
References
- Poleni, G. Johannis Poleni Miscellanea hoc est: I Dissertatio de Barometris et Termometris; Alvise Pavini: Venice, Italy, 1709. [Google Scholar]
- Cossali, P. Elogio di Giovanni Poleni; Bettoni: Padua, Italy, 1813. [Google Scholar]
- Crestani, G. L’inizio delle osservazioni meteorologiche a Padova. Il contributo di Giovanni Poleni alla meteorologia. In Memorie Della R. Accademia di Scienze Lettere ed Arti; Rondi, G.B.: Padua, Italy, 1926; Volume XLII, pp. 19–83. [Google Scholar]
- Ongaro, G. Il sodalizio tra Giovanni Poleni e Giambattista Morgagni. In Giovanni Poleni Idraulico Matematico Architetto Filologo (1683–1761); Soppelsa, M.L., Ed.; Accademia Patavina di Scienze Lettere ed Arti, Collana Accademica: Padua, Italy, 1988; Volume 10, pp. 187–202. [Google Scholar]
- Camuffo, D. History of the long series of the air temperature in Padova (1725–today). Clim. Change 2002, 53, 7–76. [Google Scholar] [CrossRef]
- Zendrini, B. Leggi e Fenomeni, Regolazioni ed Usi Delle Acque Correnti; Pasquali: Venice, Italy, 1741. [Google Scholar]
- Zendrini, A. Documenti Autentici che Dimostrano Doversi Unicamente a Bernardino Zendrini, il Progetto per la Costruzione del Celebre Riparo Detto i Murazzi dei Lidi di Venezia; Tipografia Alvisopoli: Venice, Italy, 1835. [Google Scholar]
- Gennari, G. Elogio del Marchese Giovanni Poleni; Tipi del seminario: Padua, Italy, 1839. [Google Scholar]
- Zendrini, B. Observationes Meteorologicae Venetiis Habitae Ann. MDCCXXXVIII. In Raccolta d’Opusculi Scientifici, e Filologici; Calogerà, A., Ed.; Occhi: Venice, Italy, 1741; Volume XXIII. [Google Scholar]
- Zendrini, B. Fasciculus observationum Astronomicarum & Meteorologicarum ad annum MDCCXXXVIII & MDCCXXXIX. In Raccolta d’Opusculi Scientifici, e Filologici; Calogerà, A., Ed.; Occhi: Venice, Italy, 1741; Volume XXIV. [Google Scholar]
- Zendrini, B. Fasciculus I observationum Astronomicarum & Meteorologicarum annorum MDCCXL & MDCCXLI. In Raccolta d’Opusculi Scientifici, e Filologici; Calogerà, A., Ed.; Occhi: Venice, Italy, 1744; Volume XXX. [Google Scholar]
- Zendrini, B. Fasciculus II observationum Astronomicarum & Meteorologicarum annorum MDCCXLII & MDCCXLIII. In Raccolta d’Opusculi Scientifici, e Filologici; Calogerà, A., Ed.; Occhi: Venice, Italy, 1744; Volume XXXI. [Google Scholar]
- Schouw, J.F. Tableau du climat de la végétation de l’Italie. Résultat de deux voyages en ce pays dans les années 1817–1819 et 1829–1830. In Tableau de la Température et des Pluies de l’Italie; Luno: Copenhagen, Denmark, 1839; Volume 1. [Google Scholar]
- Crestani, G. Le osservazioni meteorologiche—I fenomeni meteorologici. In La Laguna di Venezia; Magrini, G., Ed.; Ferrari: Venice, Italy, 1933; Volume I, Part II, Tomo III, pp. 1–203. [Google Scholar]
- Camuffo, D. Calibration and instrumental errors in early measurements of air temperature. Clim. Change 2002, 53, 297–330. [Google Scholar] [CrossRef]
- Camuffo, D. Errors in early temperature series arising from changes in style of measuring time, sampling schedule and number of observations. Clim. Change 2002, 53, 331–354. [Google Scholar] [CrossRef]
- Cocheo, C.; Camuffo, D. Corrections of systematic errors and data homogenisation in the Padova series (1725–today). Clim. Change 2002, 53, 77–100. [Google Scholar] [CrossRef]
- Camuffo, D.; Cocheo, C.; Sturaro, G. Corrections of systematic errors, data homogenisation and climatic analysis of the Padova pressure series (1725–1999). Clim. Change 2006, 79, 493–514. [Google Scholar] [CrossRef]
- Zendrini, A. Elogio di Bernardino Zendrini Matematico Della Repubblica di Venezia; Palese: Venice, Italy, 1807. [Google Scholar]
- Camuffo, D. Microclimate for Cultural Heritage, 3rd ed.; Elsevier: Amsterdam, The Netherlands, 2019. [Google Scholar] [CrossRef]
- Camuffo, D.; Bertolin, C. The earliest temperature observations in the world: The Medici Network (1654–1670). Clim. Change 2012, 111, 335–363. [Google Scholar] [CrossRef]
- Académie des Sciences. Histoire de l’Académie Royale des Sciences Avec les Mémoires de Mathématique et Physique; Schreuder et Mortier: Amsterdam, The Netherlands, 1760. [Google Scholar]
- World Meteorological Organization. Technical Note No 7: Reduction of Atmospheric Pressure; Volume WMO-No. 36; World Meteorological Organization: Geneva, Switzerland, 1954; Available online: https://library.wmo.int/idurl/4/59011 (accessed on 2 May 2025).
- World Meteorological Organization. Technical Note No. 61: Note on the Standardization of Pressure Reduction in the International Network of Synoptic Stations; Volume WMO-No. 154; World Meteorological Organization: Geneva, Switzerland, 1964; Available online: https://library.wmo.int/idurl/4/59654 (accessed on 2 May 2025).
- Amontons, G. Discours sur quelques propriétés de l’Air & le moyen d’en connaitre la température dans tous les climats de la Terre. In Mémoires de Mathématique et de Physique; Coignard & Guerin: Paris, France, 1702; pp. 155–174. [Google Scholar]
- Chambers, E. Cyclopædia: Or a Universal Dictionary of Arts and Sciences. Table of Pneumaticks; Knagton: London, UK, 1728; Volume 2. [Google Scholar]
- Stancari, V.F. De Thermometro ab Amontonio recens inventis. Ex epistula ad Maraldum. In Printed Posthumous in: Schedae Mathematicae; Barbiroli Archigymnasium: Bologna, Italy, 1708; pp. 53–55. [Google Scholar]
- Zeno, A.; Zeno, P.C. Victorii Francisci Stancarii… Articolo VII. In Giornale de’ Letterati d’Italia; Giovanni Giacomo Hertz: Venice, Italy, 1714; Volume 17, pp. 170–202. [Google Scholar]
- Camuffo, D.; della Valle, A.; Bertolin, C.; Santorelli, E. The Stancari air thermometer and the 1715–1737 record in Bologna, Italy. Clim. Change 2016, 139, 623–636. [Google Scholar] [CrossRef]
- D’Alencé, J. Traittez des Barometres, Thermometres et Notiometres ou Hygrometres; Westein: Amsterdam, The Netherlands, 1688. [Google Scholar]
- Camuffo, D.; Bertolin, C. Recovery of the Early Period of Long Instrumental Time Series of Air Temperature in Padua, Italy (1716–2007). Phys. Chem. Earth 2012, 40–41, 23–31. [Google Scholar] [CrossRef]
- Baiada, E. Da Beccari a Ranuzzi: La meteorologia nell’Accademia Bolognese nel XVIII secolo. In Le Meteore ed il Frumento: Clima, Agricoltura, Meteorologia a Bologna nel ’700; Finzi, R., Ed.; Il Mulino: Bologna, Italy, 1986; pp. 99–261. [Google Scholar]
- Brunetti, M.; Buffoni, L.; Lo Vecchio, G.; Maugeri, M.; Nanni, T. Tre Secoli di Meteorologia a Bologna; CUSL: Milan, Italy, 2001. [Google Scholar]
- Camuffo, D.; della Valle, A.; Bertolin, C.; Santorelli, E. Temperature observations in Bologna, Italy, from 1715 to 1815: A comparison with other contemporary series and an overview of three centuries of changing climate. Clim. Change 2017, 142, 7–22. [Google Scholar] [CrossRef]
- de l’Isle, J.N. Les thermomètres de mercure rendus universels, en leur faisant marquer en tout tems la quantité dont le volume du mercure est diminué par la température présente de l’air au dessous de l’étendüe qu’il a dans l’eau bouillante. In Memoires Pour Servir à l’Histoire & Aux Progrès de l’Astronomie, de la Géographie & de la Physique; Imprimerie de Académie des Sciences: St. Petersbourg, Russia, 1738; pp. 267–284. [Google Scholar]
- Middleton, W. A History of the Thermometer and Its Use in Meteorology; Hopkins Press: Baltimore, MD, USA, 1966. [Google Scholar]
- Broberg, G. The Man Who Organized Nature: The Life of Linnaeus; Princeton University Press: Princeton, NJ, USA, 2023. [Google Scholar]
- Browne, F. Thermometers. Pharm. J. Trans. 1889, 19, 1010–1013. [Google Scholar] [CrossRef]
- Martine, G. Chapter 4: The Comparison of Different Thermometers. In Essays Medical and Philosophical; Millar: London, UK, 1740. [Google Scholar]
- Celsius, A. Observationer om Twänne Beständiga Grader på en Thermometer; Vetenskaps Akademiens Handlingar: Stockholm, Sweden, 1742; Volume 4, pp. 197–205. [Google Scholar]
- Cotte, L. Mémoires sur la Météorologie Pour Servir de Suite et de Supplément au Traité de Météorologie Publié en 1774; Imprimerie Royale: Paris, France, 1774. [Google Scholar]
- Kretzschmar, J.A. Vergleichung der Drey Gewöhnlichen Thermometer, als der Fahrenheitischen, Delilischen und Reaumürischen: So Wohl Durch Rechnung als Verzeichnung; Jacobäern: Lipsia, Germany, 1777. [Google Scholar]
- Bergström, H.; Moberg, A. Daily Air Temperature and Pressure Series for Uppsala (1722–1998). Clim. Change 2002, 53, 213–252. [Google Scholar] [CrossRef]
- Jurin, J. Invitatio ad observationes Meteorologicas communi consilio instituendas a Jacobo Jurin. Philos. Trans. 1723, 379, 422–427. [Google Scholar]
- Poleni, G. Viri Celeberrimi Johannis Marchionis Poleni, R. S. S. ad virum Doctissimum Jacobum Jurinum, M. D. R.S.S. Epistola, qua continetur Summarium Observationum Meteorologicarum per sexennium Patavij habitarum. Philos. Trans. 1731, 421, 201–216. [Google Scholar]
Disclaimer/Publisher’s Note: The statements, opinions and data contained in all publications are solely those of the individual author(s) and contributor(s) and not of MDPI and/or the editor(s). MDPI and/or the editor(s) disclaim responsibility for any injury to people or property resulting from any ideas, methods, instructions or products referred to in the content. |
© 2025 by the authors. Licensee MDPI, Basel, Switzerland. This article is an open access article distributed under the terms and conditions of the Creative Commons Attribution (CC BY) license (https://creativecommons.org/licenses/by/4.0/).