
Exploring the Causes of Multicentury Hydroclimate Anomalies in the South American Altiplano with an Idealized Climate Modeling Experiment

 , , , and
Abstract
1. Introduction
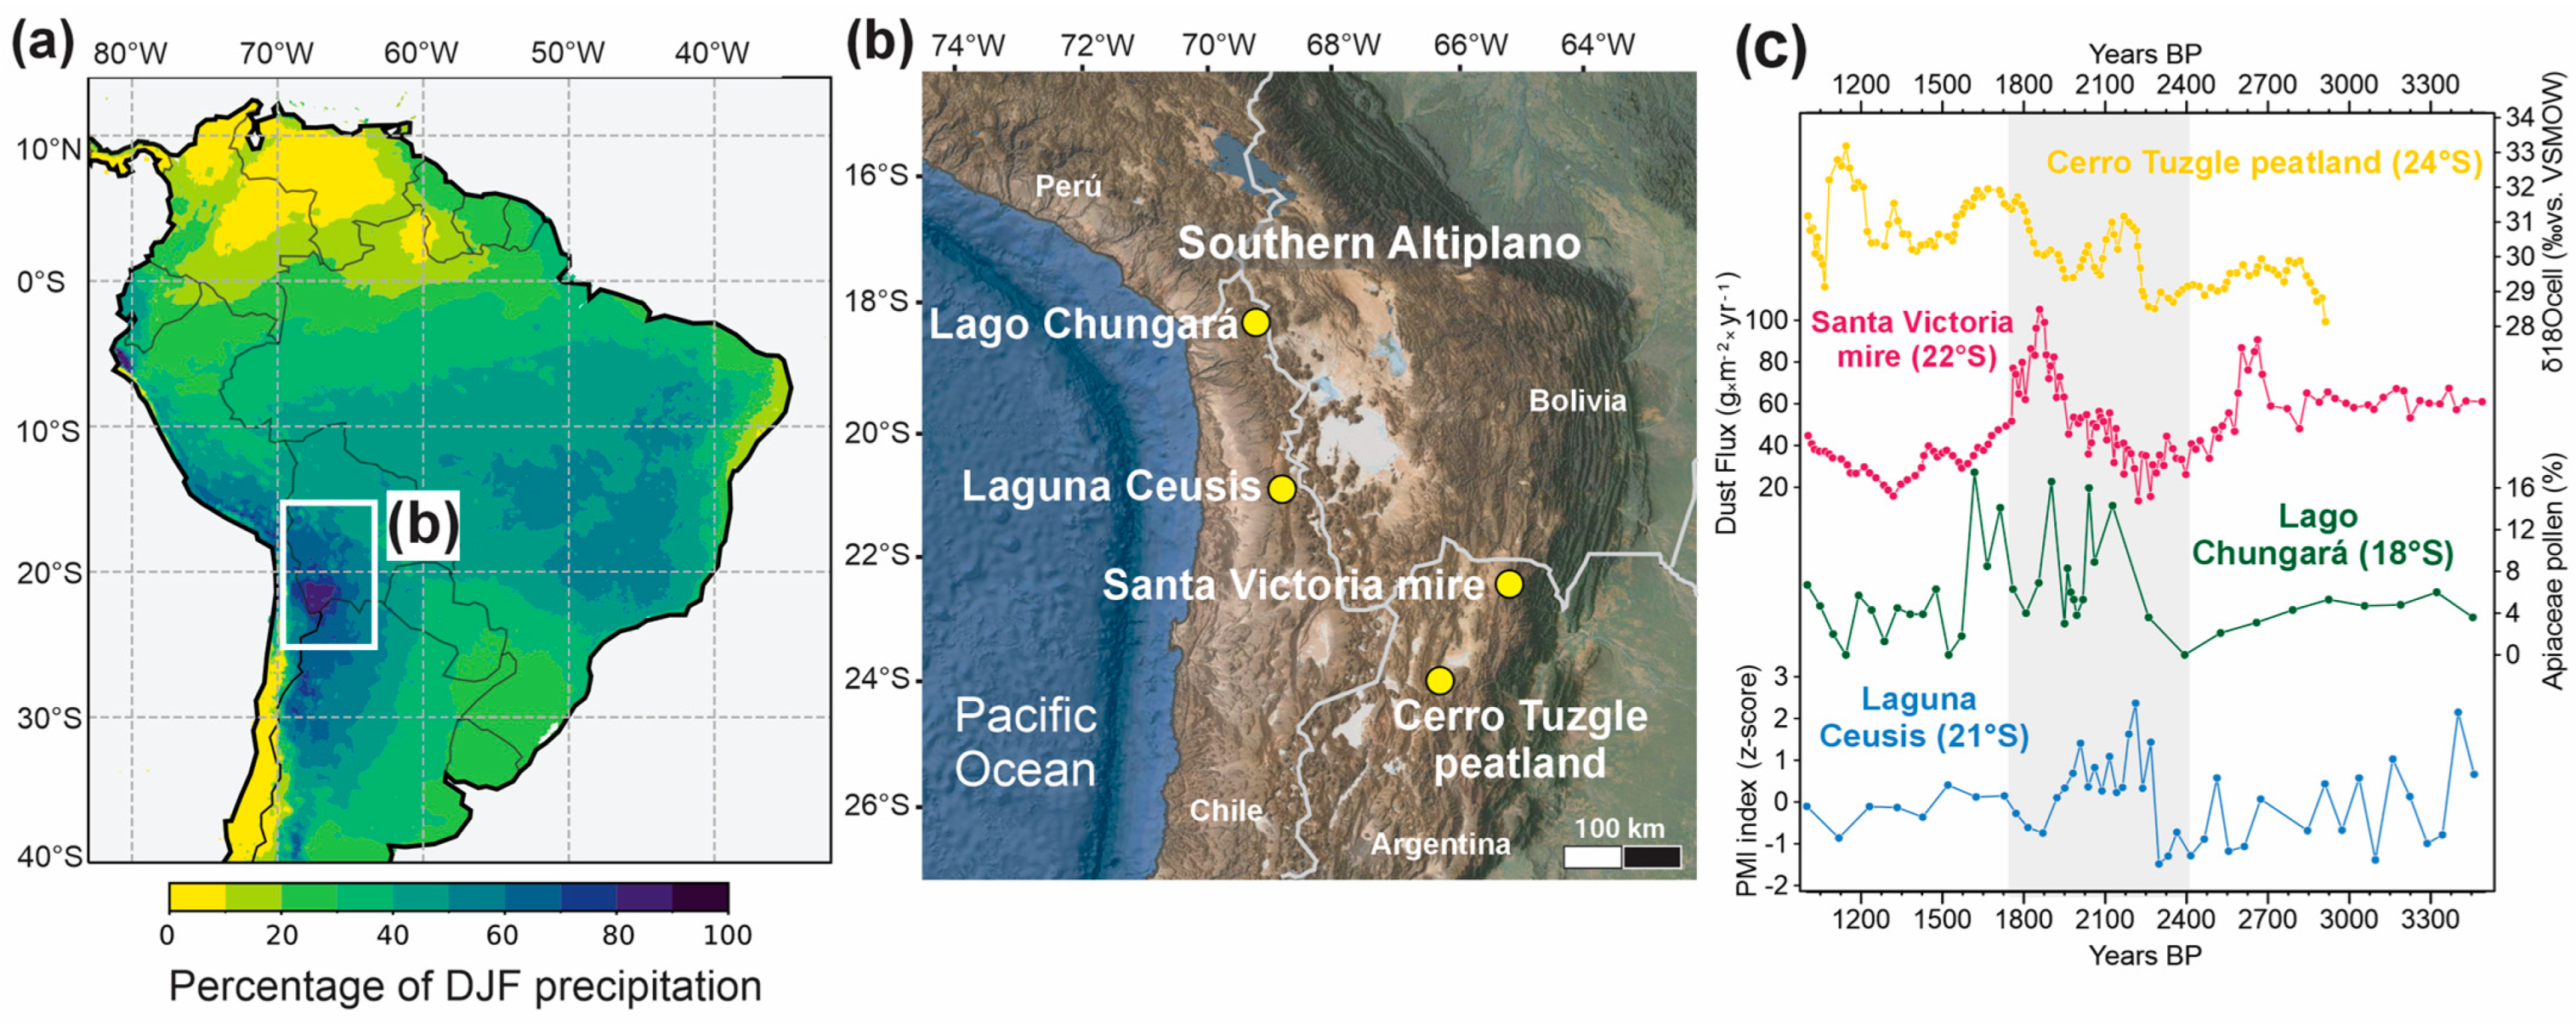
2. Study Area
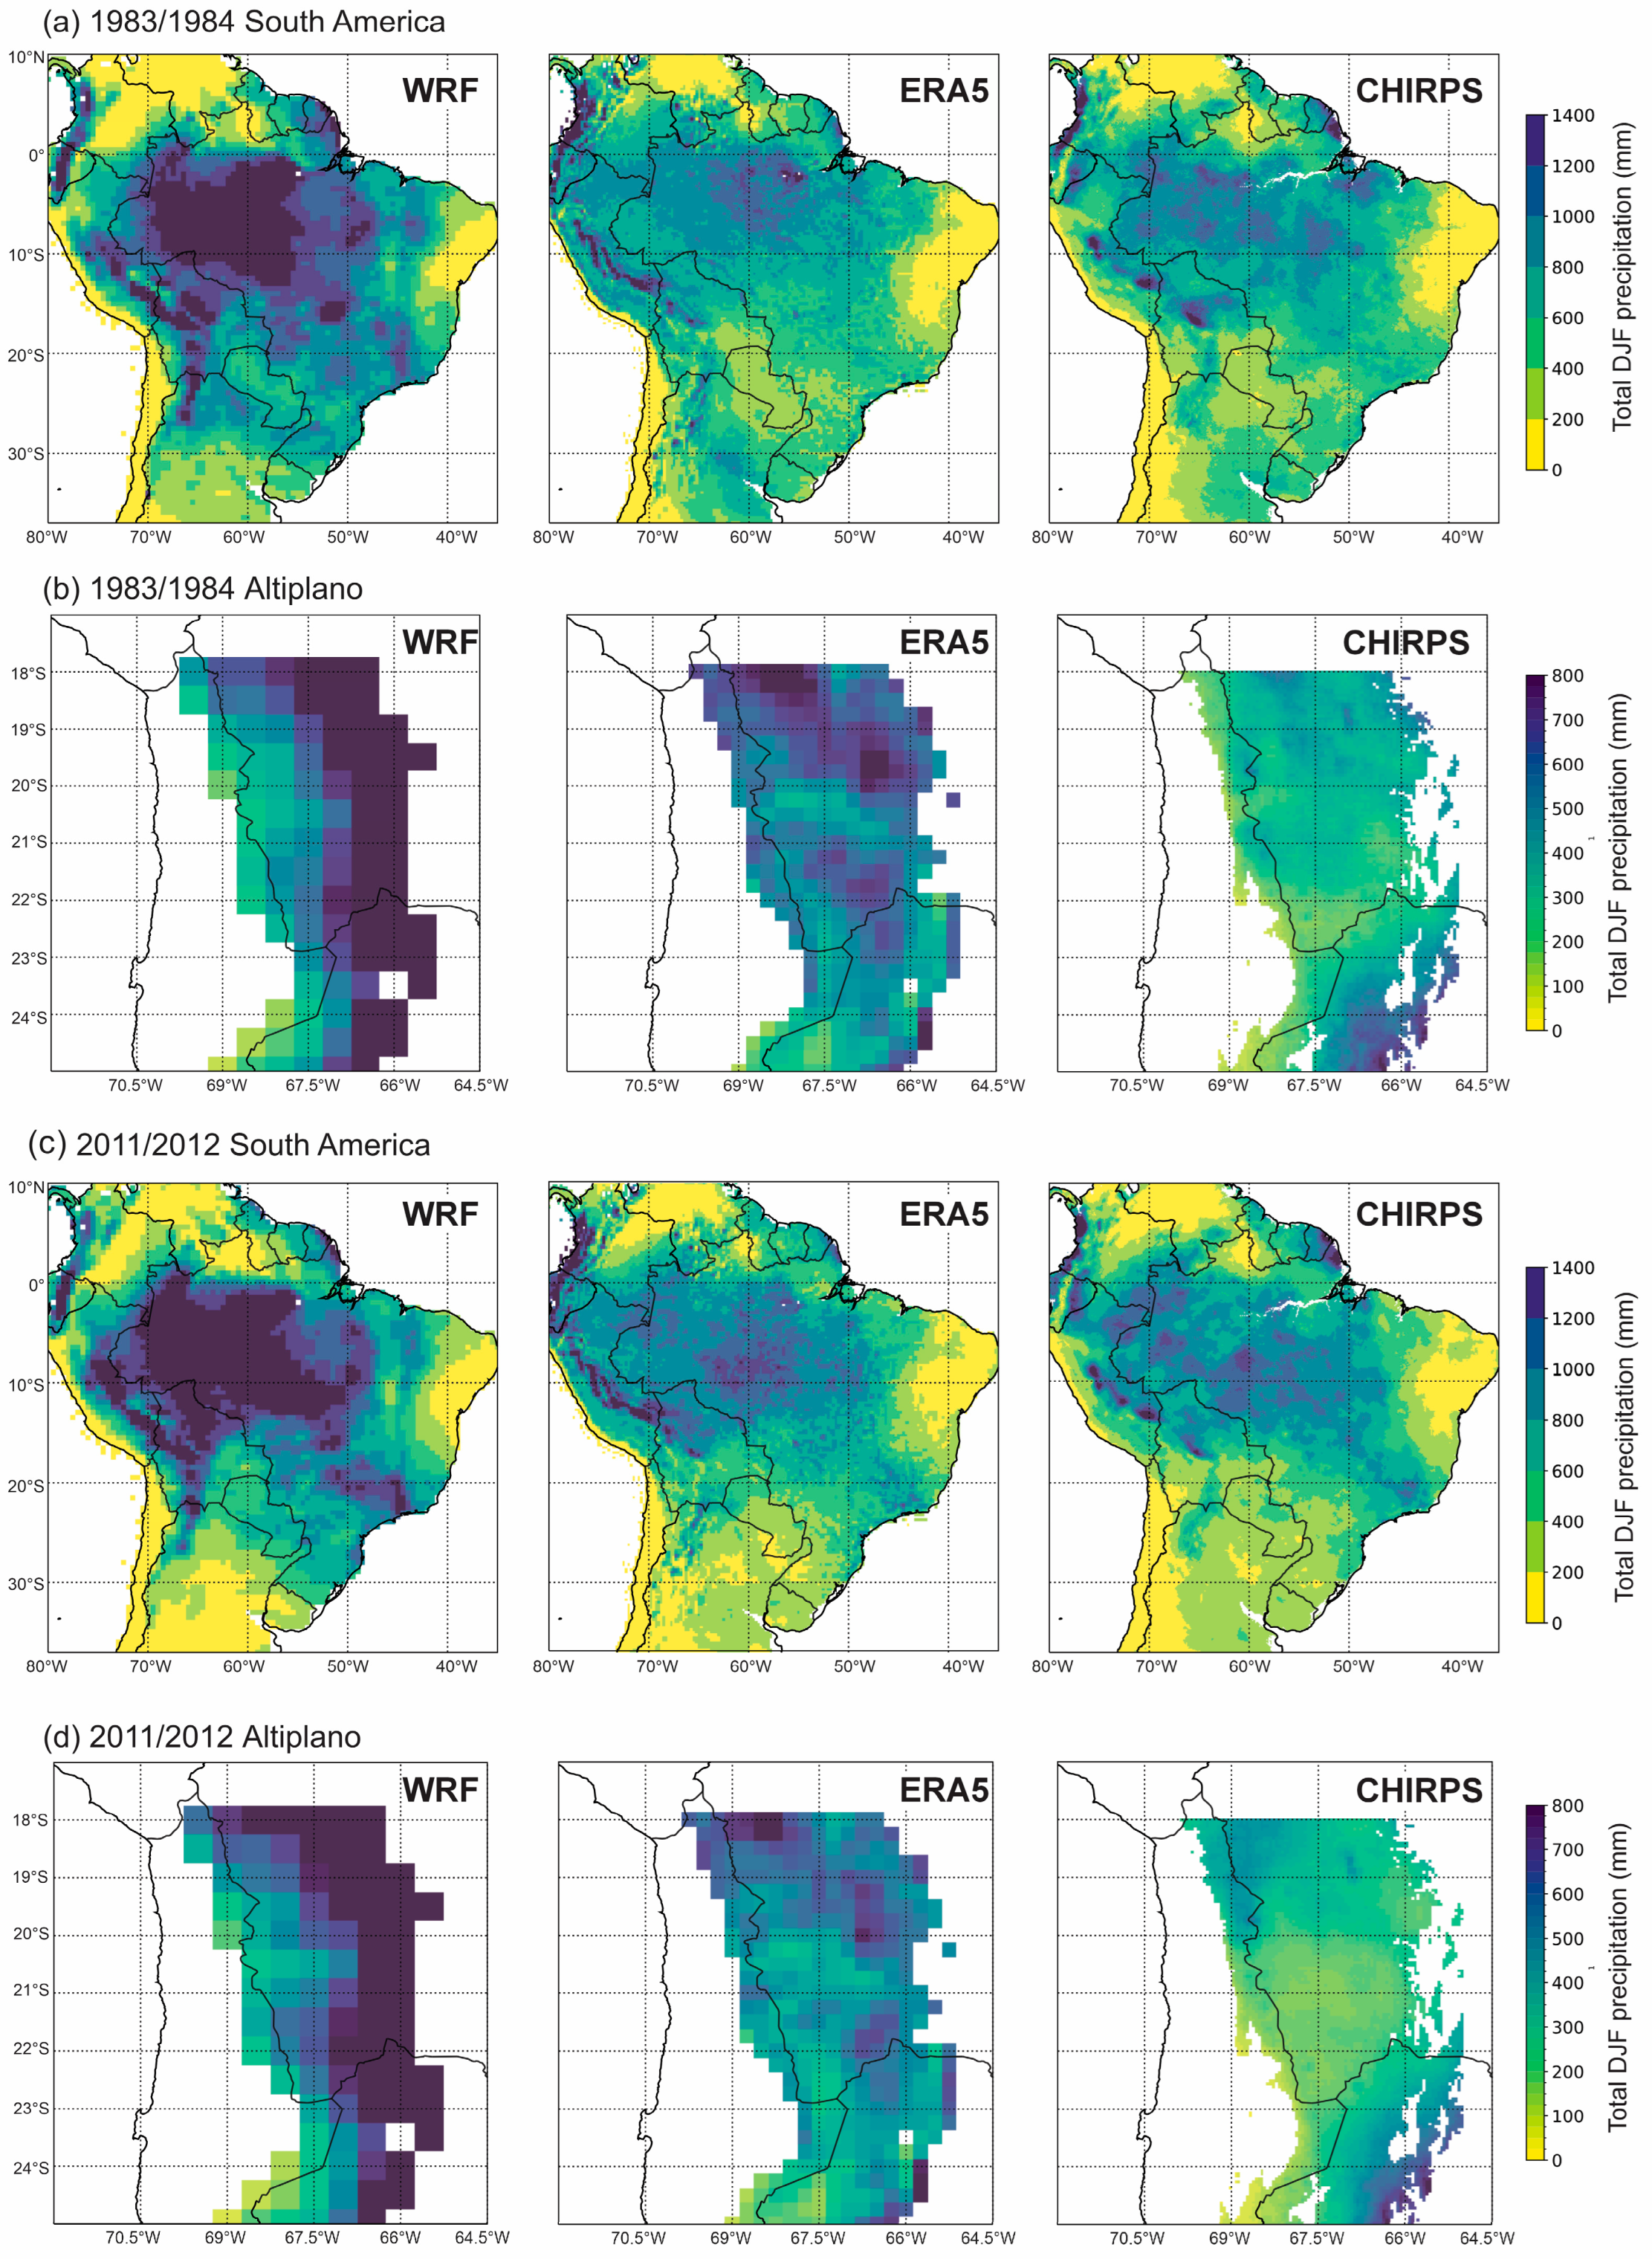
3. Database and Methods
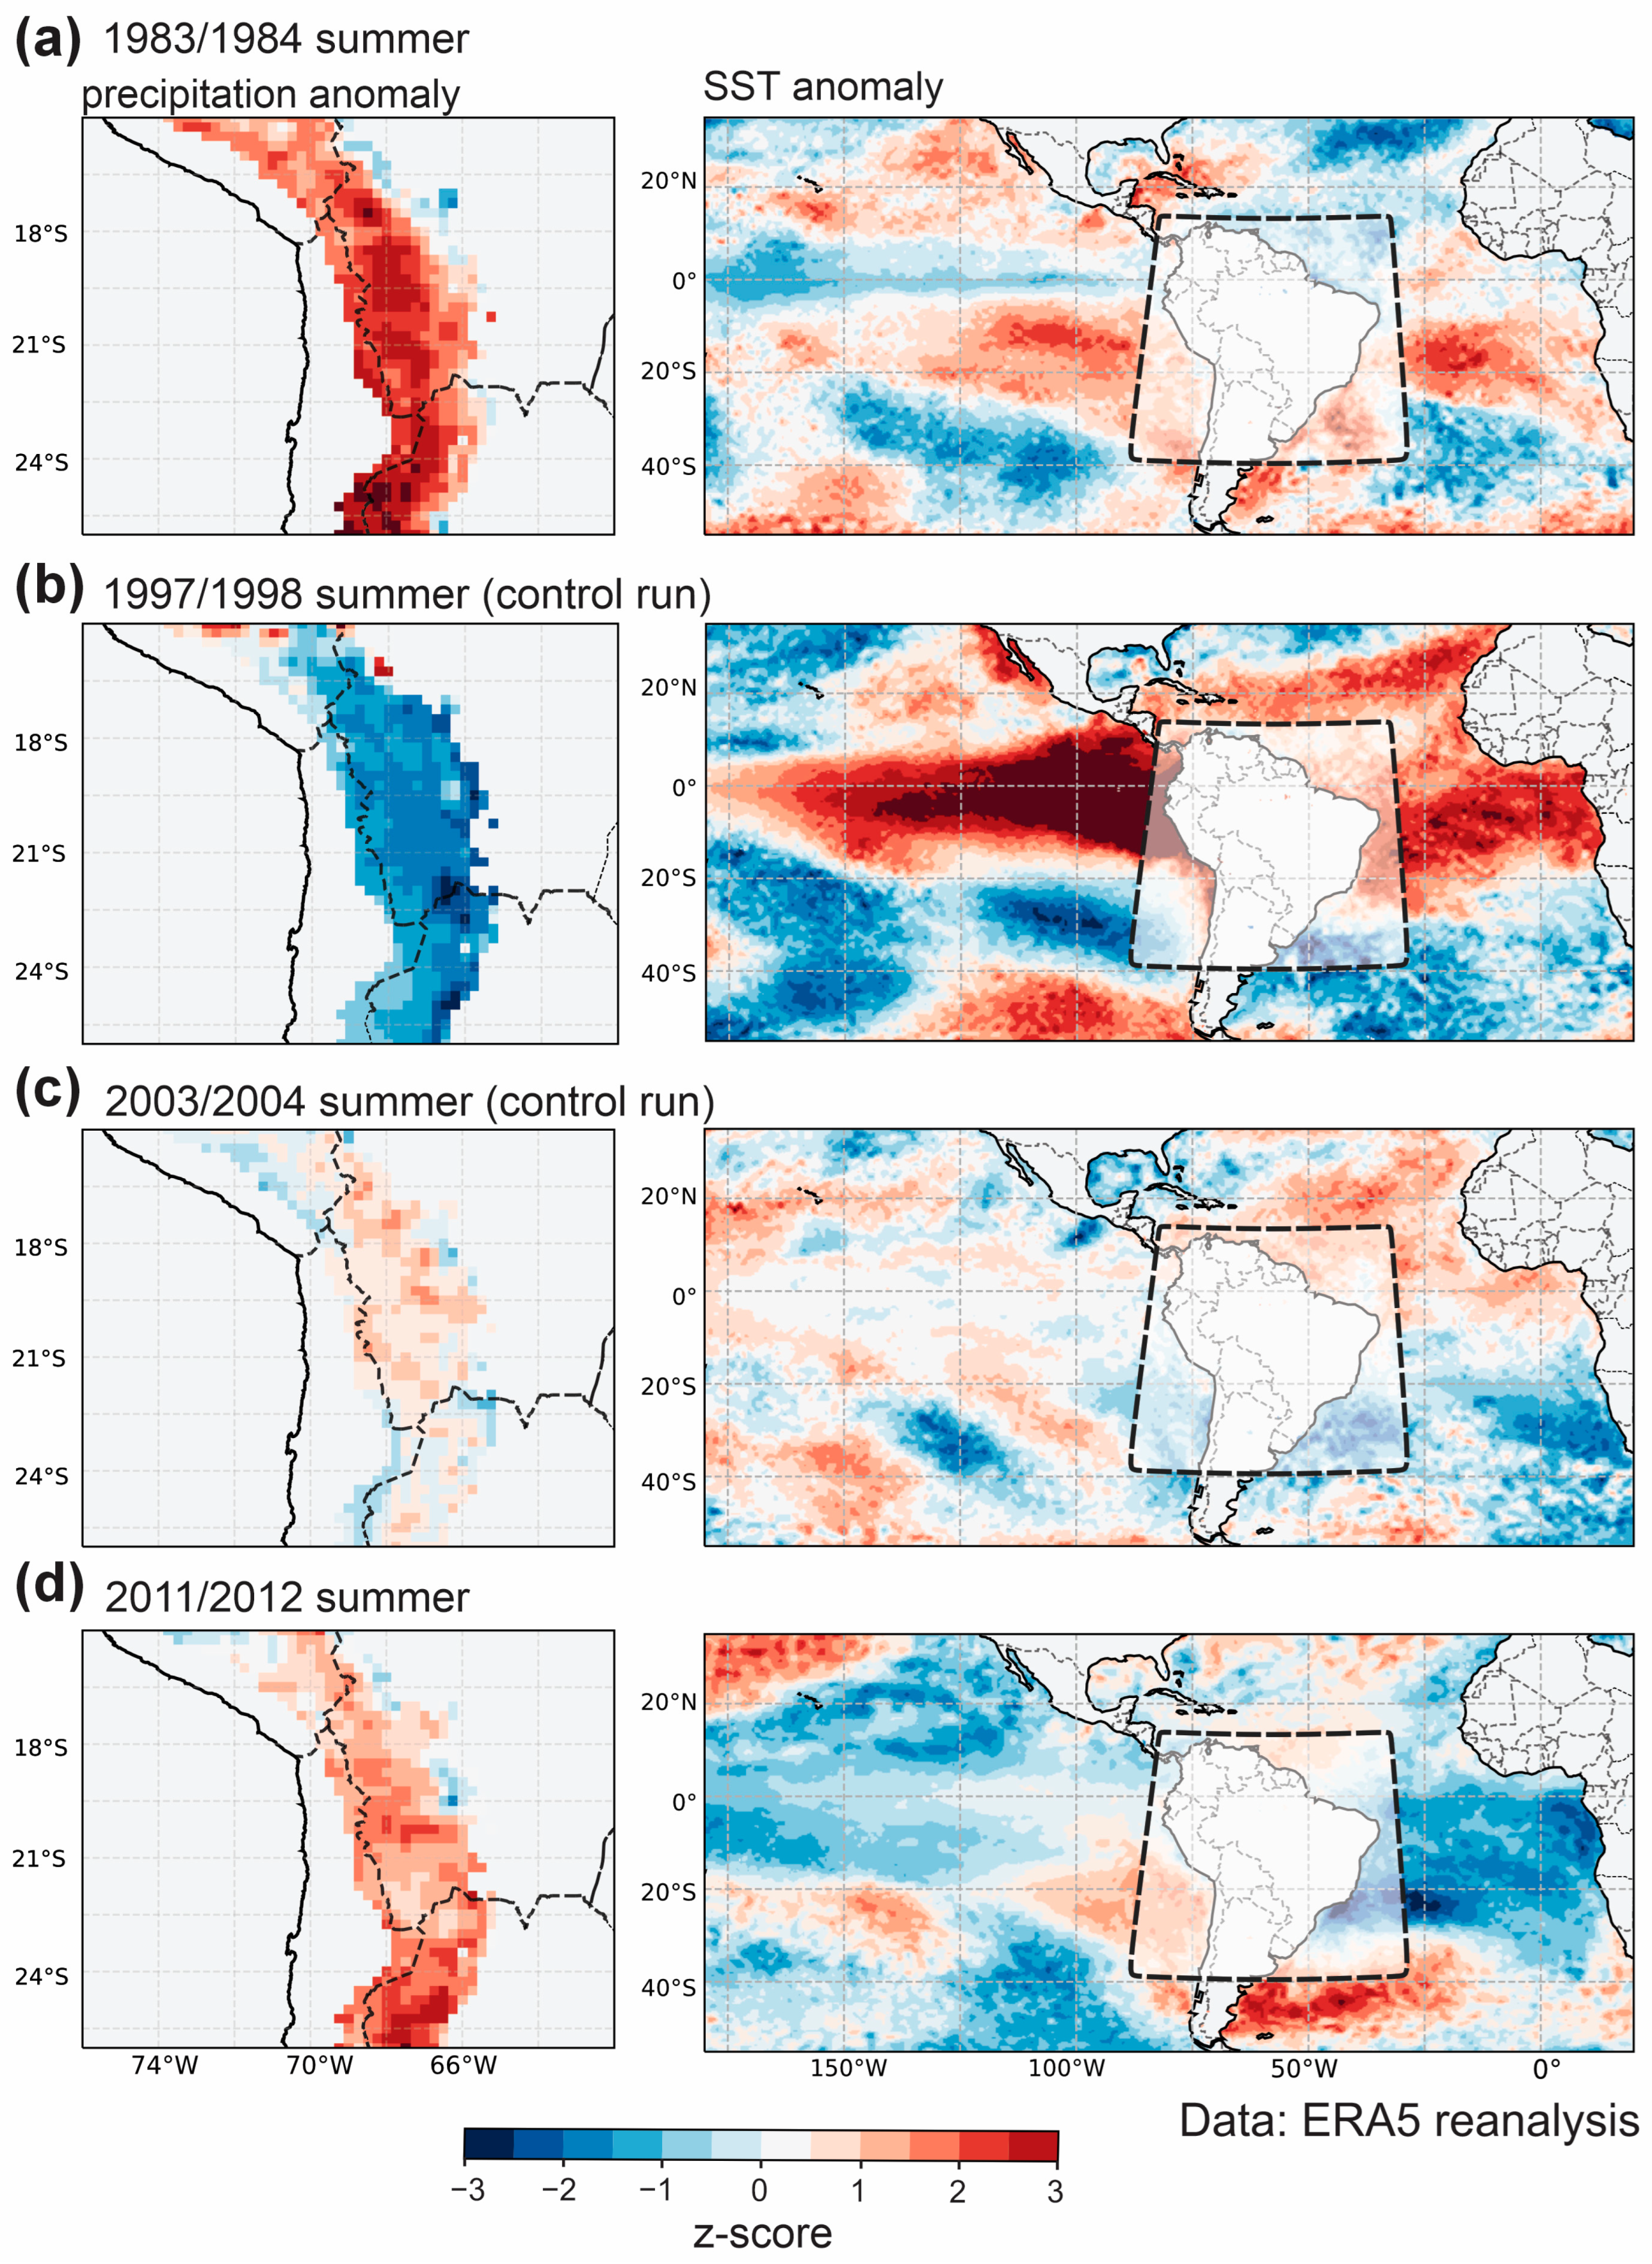
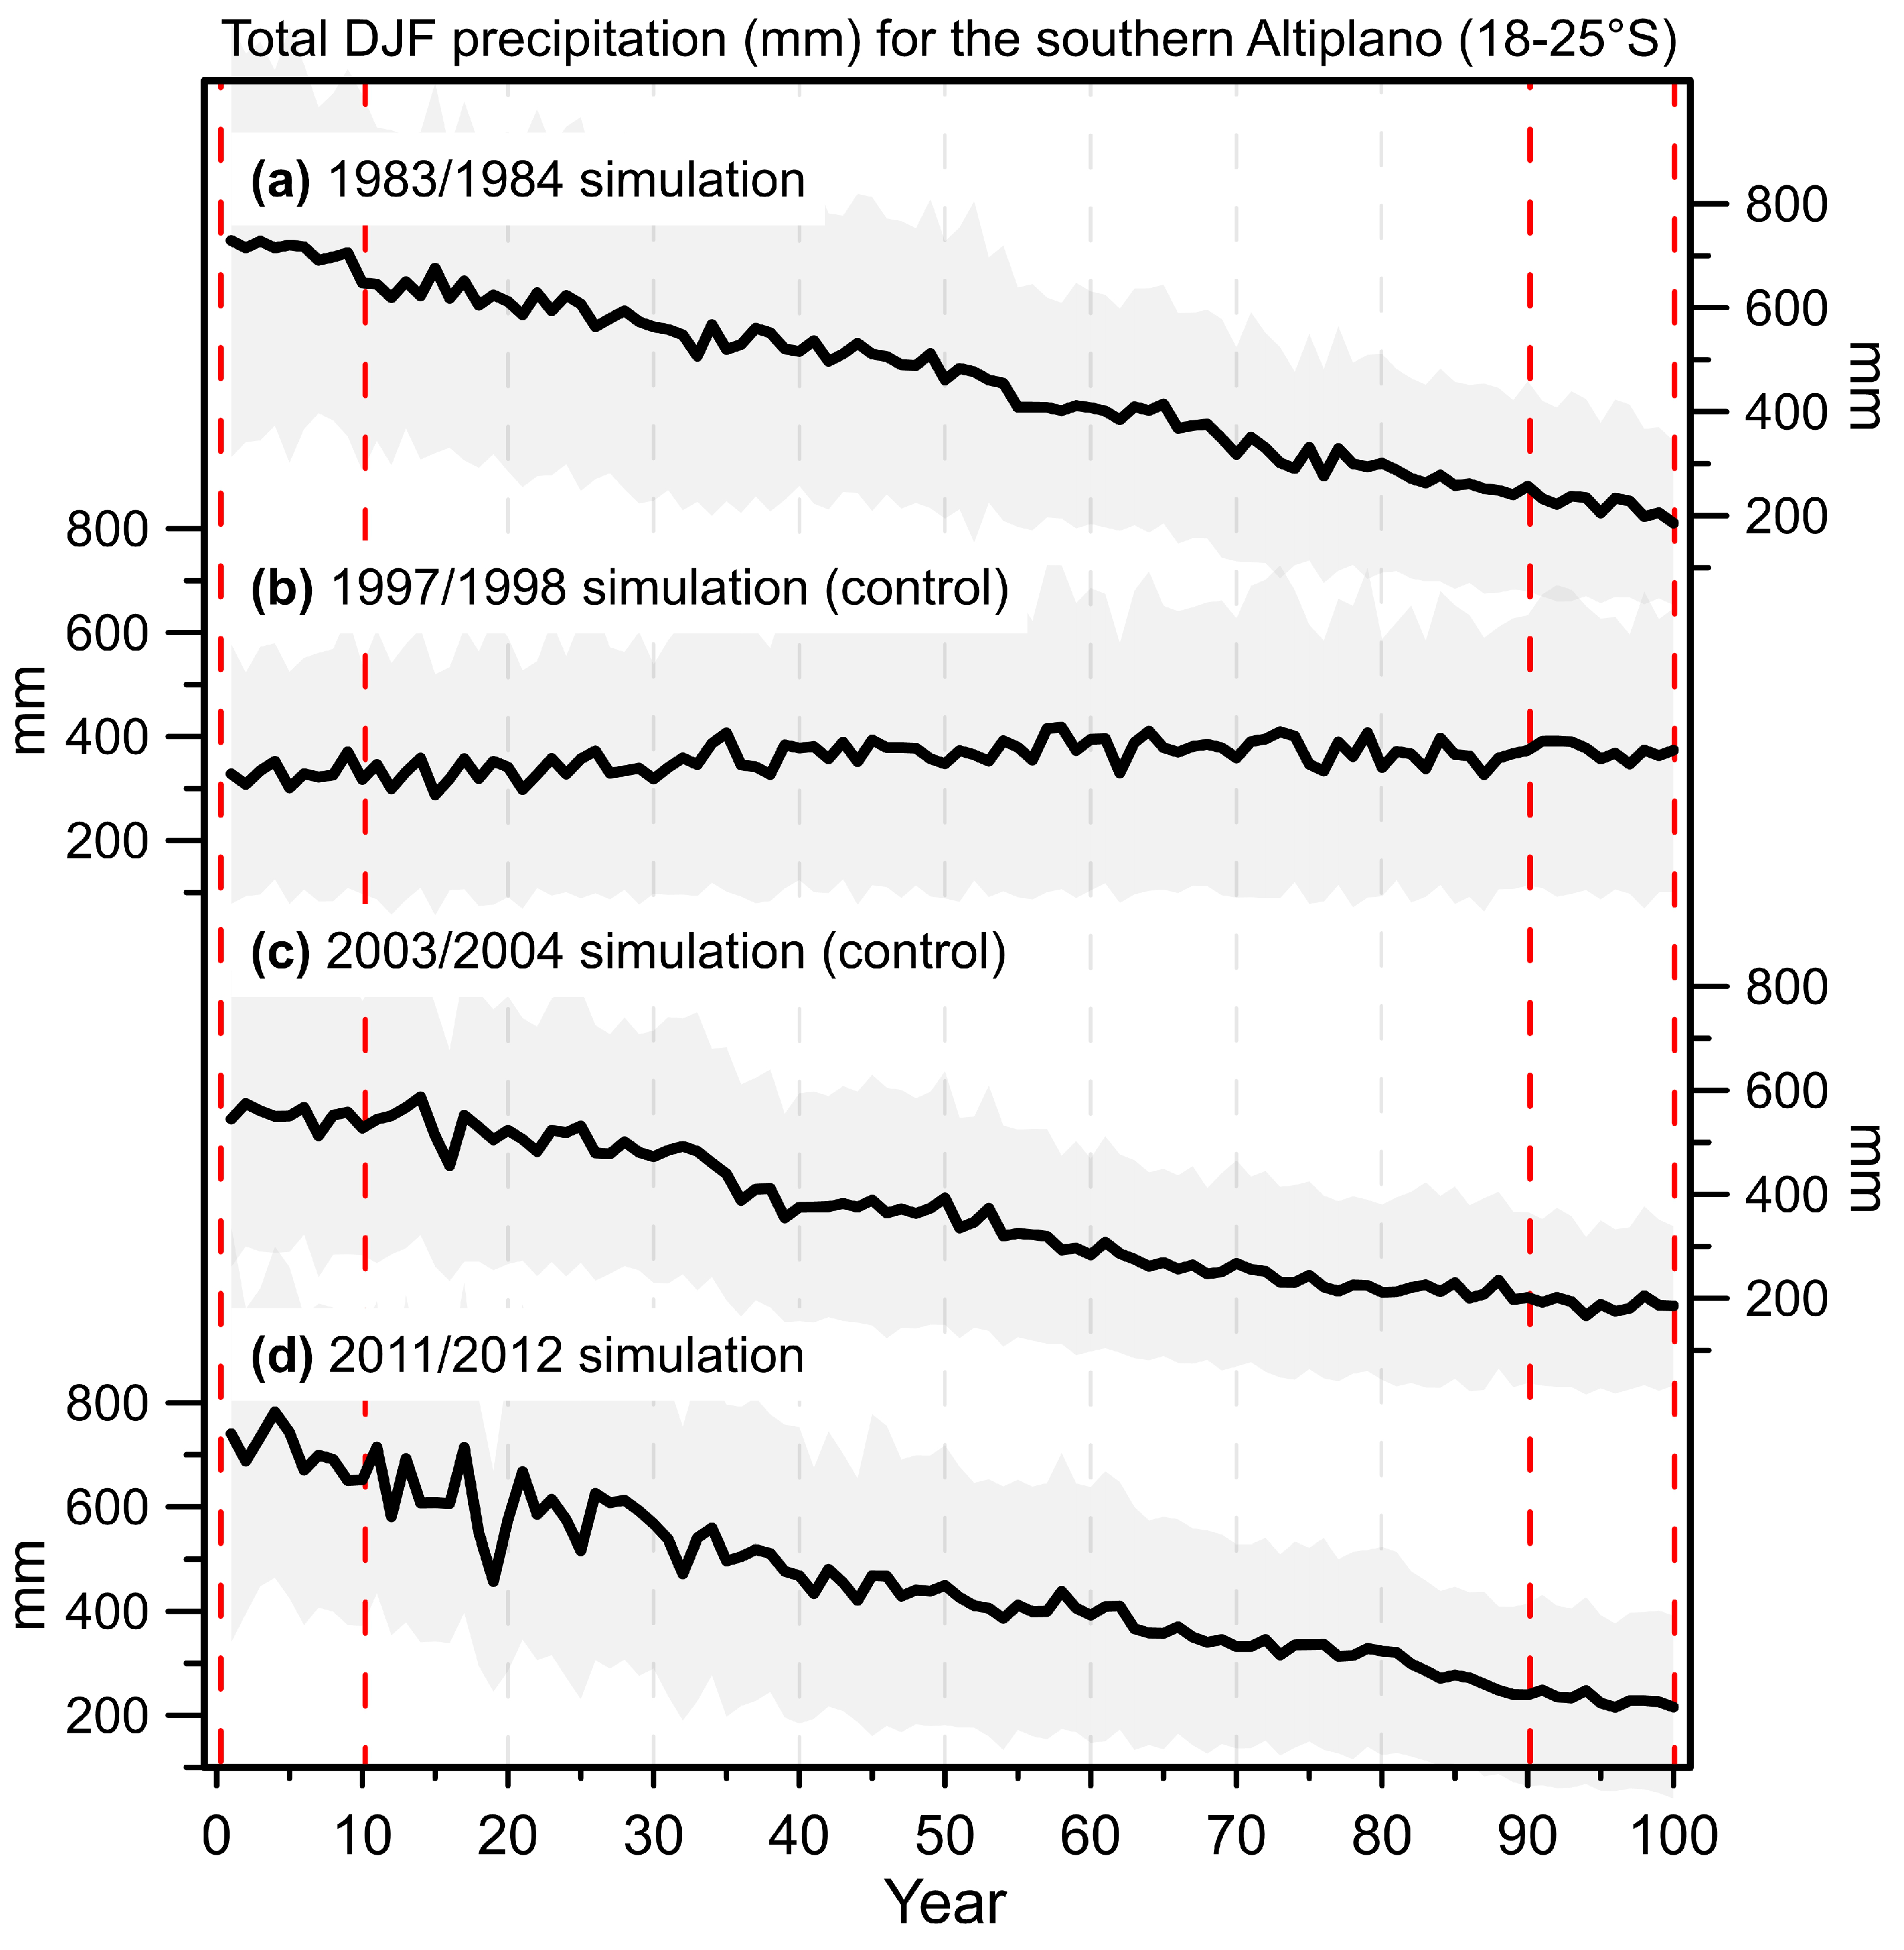
Experimental Setup
4. Results
5. Discussion
6. Conclusions
Supplementary Materials
Author Contributions
Funding
Data Availability Statement
Acknowledgments
Conflicts of Interest
Abbreviations
| WRF | Weather Research and Forecasting (WRF) |
| DJF | December–January–February |
| MAM | March–April–May |
| ENSO | El Nino Southern Oscillation |
| PDO | Pacific Decadal Oscillation |
| BH | Bolivian High |
| LBCs | Lateral boundary conditions |
| SALLJ | South American Low-Level Jet |
| SAOD | South Atlantic Ocean Dipole |
| SACZ | South Atlantic Convergence Zone |
| SASM | South American summer monsoon |
| ITCZ | Intertropical Convergence Zone |
| SST | Sea surface temperature |
References
- García, M.; Raes, D.; Jacobsen, S.-E.; Michel, T. Agroclimatic constraints for rainfed agriculture in the Bolivian Altiplano. J. Arid Environ. 2007, 71, 109–121. [Google Scholar] [CrossRef]
- Canedo-Rosso, C.; Uvo, C.B.; Berndtsson, R. Precipitation variability and its relation to climate anomalies in the Bolivian Altiplano. Int. J. Climatol. 2019, 39, 2096–2107. [Google Scholar] [CrossRef]
- Vuille, M.; Carey, M.; Huggel, C.; Buytaert, W.; Rabatel, A.; Jacobsen, D.; Soruco, A.; Villacis, M.; Yarleque, C.; Timm, O.E. Rapid decline of snow and ice in the tropical Andes–Impacts, uncertainties and challenges ahead. Earth-Sci. Rev. 2018, 176, 195–213. [Google Scholar]
- Satgé, F.; Hussain, Y.; Xavier, A.; Zolá, R.P.; Salles, L.; Timouk, F.; Seyler, F.; Garnier, J.; Frappart, F.; Bonnet, M.-P. Unraveling the impacts of droughts and agricultural intensification on the Altiplano water resources. Agric. For. Meteorol. 2019, 279, 107710. [Google Scholar]
- Anderson, T.G.; Christie, D.A.; Chávez, R.O.; Olea, M.; Anchukaitis, K.J. Spatiotemporal peatland productivity and climate relationships across the Western south American altiplano. J. Geophys. Res. Biogeosci. 2021, 126, e2020JG005994. [Google Scholar] [CrossRef]
- Blin, N.; Hausner, M.; Leray, S.; Lowry, C.; Suárez, F. Potential impacts of climate change on an aquifer in the arid Altiplano, northern Chile: The case of the protected wetlands of the Salar del Huasco basin. J. Hydrol. Reg. Stud. 2022, 39, 100996. [Google Scholar]
- Bennett, M.; New, M.; Marino, J.; Sillero-Zubiri, C. Climate complexity in the Central Andes: A study case on empirically-based local variations in the dry Puna. J. Arid Environ. 2016, 128, 40–49. [Google Scholar]
- Crispín-DelaCruz, D.B.; Morales, M.S.; Andreu-Hayles, L.; Christie, D.A.; Guerra, A.; Requena-Rojas, E. High ENSO sensitivity in tree rings from a northern population of Polylepis tarapacana in the Peruvian Andes. Dendrochronologia 2022, 71, 125902. [Google Scholar]
- Morales, M.; Christie, D.; Villalba, R.; Argollo, J.; Pacajes, J.; Silva, J.; Alvarez, C.; Llancabure, J.; Gamboa, C.S. Precipitation changes in the South American Altiplano since 1300 AD reconstructed by tree-rings. Clim. Past 2012, 8, 653. [Google Scholar]
- Abbott, M.B.; Binford, M.W.; Brenner, M.; Kelts, K.R. A 350014C yr high-resolution record of water-level changes in Lake Titicaca, Bolivia/Peru. Quat. Res. 1997, 47, 169–180. [Google Scholar] [CrossRef]
- Baker, P.A.; Fritz, S.C.; Garland, J.; Ekdahl, E. Holocene hydrologic variation at Lake Titicaca, Bolivia/Peru, and its relationship to North Atlantic climate variation. J. Quat. Sci. Publ. Quat. Res. Assoc. 2005, 20, 655–662. [Google Scholar] [CrossRef]
- González-Pinilla, F.J.; Latorre, C.; Rojas, M.; Houston, J.; Rocuant, M.I.; Maldonado, A.; Santoro, C.M.; Quade, J.; Betancourt, J.L. High-and low-latitude forcings drive Atacama Desert rainfall variations over the past 16,000 years. Sci. Adv. 2021, 7, eabg1333. [Google Scholar]
- Valero-Garcés, B.L.; Grosjean, M.; Schwalb, A.; Geyh, M.; Messerli, B.; Kelts, K. Limnogeology of Laguna Miscanti: Evidence for mid to late Holocene moisture changes in the Atacama Altiplano (Northern Chile). J. Paleolimnol. 1996, 16, 1–21. [Google Scholar]
- Jara, I.A.; Maldonado, A.; de Porras, M.E. Late Holocene dynamics of the south American summer monsoon: New insights from the Andes of northern Chile (21° S). Quat. Sci. Rev. 2020, 246, 106533. [Google Scholar]
- Jara, I.A.; Maldonado, A.; González, L.; Hernández, A.; Sáez, A.; Giralt, S.; Bao, R.; Valero Garcés, B.L. Centennial-scale precipitation anomalies in the southern Altiplano (18° S) suggest an extratropical driver for the South American summer monsoon during the late Holocene. Clim. Past 2019, 15, 1845–1859. [Google Scholar]
- Kock, S.T.; Schittek, K.; Wissel, H.; Vos, H.; Ohlendorf, C.; Schäbitz, F.; Lupo, L.C.; Kulemeyer, J.J.; Lücke, A. Stable oxygen isotope records (δ18O) of a high-Andean cushion peatland in NW Argentina (24° S) imply South American Summer Monsoon related moisture changes during the Late Holocene. Front. Earth Sci. 2019, 7, 45. [Google Scholar]
- Hooper, J.; Marx, S.K.; May, J.-H.; Lupo, L.C.; Kulemeyer, J.J.; Pereira, E.; Seki, O.; Heijnis, H.; Child, D.; Gadd, P. Dust deposition tracks late-Holocene shifts in monsoon activity and the increasing role of human disturbance in the Puna-Altiplano, northwest Argentina. Holocene 2020, 30, 519–536. [Google Scholar] [CrossRef]
- Guédron, S.; Delaere, C.; Fritz, S.C.; Tolu, J.; Sabatier, P.; Devel, A.-L.; Heredia, C.; Vérin, C.; Alves, E.Q.; Baker, P.A. Holocene variations in Lake Titicaca water level and their implications for sociopolitical developments in the central Andes. Proc. Natl. Acad. Sci. USA 2023, 120, e2215882120. [Google Scholar]
- Kanner, L.C.; Burns, S.J.; Cheng, H.; Edwards, R.L.; Vuille, M. High-resolution variability of the South American summer monsoon over the last seven millennia: Insights from a speleothem record from the central Peruvian Andes. Quat. Sci. Rev. 2013, 75, 1–10. [Google Scholar]
- Bird, B.W.; Abbott, M.B.; Rodbell, D.T.; Vuille, M. Holocene tropical South American hydroclimate revealed from a decadally resolved lake sediment δ18O record. Earth Planet. Sci. Lett. 2011, 310, 192–202. [Google Scholar] [CrossRef]
- Jaramillo, D.; Vélez, M.I.; Escobar, J.; Pardo-Trujillo, A.; Vallejo, F.; Villegas, J.C.; Acevedo, A.L.; Curtis, J.; Rincon, H.; Trejos-Tamayo, R. Mid to late holocene dry events in Colombia’s super humid Western Cordillera reveal changes in regional atmospheric circulation. Quat. Sci. Rev. 2021, 261, 106937. [Google Scholar]
- Haug, G.H.; Hughen, K.A.; Sigman, D.M.; Peterson, L.C.; Rohl, U. Southward migration of the intertropical convergence zone through the Holocene. Science 2001, 293, 1304–1308. [Google Scholar] [PubMed]
- Zhu, C.; Zhang, J.; Liu, Z.; Otto-Bliesner, B.L.; He, C.; Brady, E.C.; Tomas, R.; Wen, Q.; Li, Q.; Zhu, C. Antarctic warming during Heinrich Stadial 1 in a transient isotope-enabled deglacial simulation. J. Clim. 2022, 35, 7353–7365. [Google Scholar]
- Orrison, R.; Vuille, M.; Smerdon, J.E.; Apaéstegui, J.; Campos, J.L.P.; Cruz, F.W.; Della Libera, M.E. South American Monsoon variability over the last millennium in paleoclimate records and isotope-enabled climate models. Clim. Past Discuss. 2022, 18, 2045–2062. [Google Scholar]
- Ludwig, P.; Gómez-Navarro, J.J.; Pinto, J.G.; Raible, C.C.; Wagner, S.; Zorita, E. Perspectives of regional paleoclimate modeling. Ann. N. Y. Acad. Sci. 2019, 1436, 54–69. [Google Scholar] [PubMed]
- Cook, K.; Vizy, E. South American climate during the Last Glacial Maximum: Delayed onset of the South American monsoon. J. Geophys. Res. Atmos. 2006, 111, D02110. [Google Scholar]
- Rojas, M.; Arias, P.A.; Flores-Aqueveque, V.; Seth, A.; Vuille, M. The South American monsoon variability over the last millennium in climate models. Clim. Past 2016, 12, 1681–1691. [Google Scholar]
- Funk, C.; Peterson, P.; Landsfeld, M.; Pedreros, D.; Verdin, J.; Shukla, S.; Husak, G.; Rowland, J.; Harrison, L.; Hoell, A.; et al. The climate hazards infrared precipitation with stations—A new environmental record for monitoring extremes. Sci. Data 2015, 2, 150066. [Google Scholar]
- Vera, C.; Higgins, W.; Amador, J.; Ambrizzi, T.; Garreaud, R.; Gochis, D.; Gutzler, D.; Lettenmaier, D.; Marengo, J.; Mechoso, C.R. Toward a unified view of the American monsoon systems. J. Clim. 2006, 19, 4977–5000. [Google Scholar] [CrossRef]
- Romatschke, U.; Houze, R.A., Jr. Extreme summer convection in South America. J. Clim. 2010, 23, 3761–3791. [Google Scholar] [CrossRef]
- Yabra, M.S.; Nicolini, M.; Borque, P.; Skabar, Y.G.; Salio, P. Observational study of the South American low-level jet during the SALLJEX. Int. J. Clim. 2022, 42, 9676–9696. [Google Scholar] [CrossRef]
- Kodama, Y. Large-scale common features of subtropical precipitation zones (the Baiu frontal zone, the SPCZ, and the SACZ) Part I: Characteristics of subtropical frontal zones. J. Meteorol. Soc. Jpn. Ser. II 1992, 70, 813–836. [Google Scholar] [CrossRef]
- Nielsen, D.M.; Belém, A.L.; Marton, E.; Cataldi, M. Dynamics-based regression models for the South Atlantic Convergence Zone. Clim. Dyn. 2019, 52, 5527–5553. [Google Scholar] [CrossRef]
- Lenters, J.; Cook, K.H. On the origin of the Bolivian high and related circulation features of the South American climate. J. Atmospheric Sci. 1997, 54, 656–678. [Google Scholar] [CrossRef]
- Garreaud, R.; Vuille, M.; Clement, A.C. The climate of the Altiplano: Observed current conditions and mechanisms of past changes. Palaeogeogr. Palaeoclimatol. Palaeoecol. 2003, 194, 5–22. [Google Scholar] [CrossRef]
- Vuille, M.; Keimig, F. Interannual variability of summertime convective cloudiness and precipitation in the central Andes derived from ISCCP-B3 data. J. Clim. 2004, 17, 3334–3348. [Google Scholar] [CrossRef]
- Aceituno, P.; Montecinos, A. Circulation anomalies associated with dry and wet periods in the South American Altiplano. In Proceedings of the Fourth International Conference on Southern Hemisphere Meteorology and Oceanography, Hobart, Australia, 29 March–2 April 1993; pp. 330–331. [Google Scholar]
- Segura, H.; Espinoza, J.C.; Junquas, C.; Lebel, T.; Vuille, M.; Garreaud, R. Recent changes in the precipitation-driving processes over the southern tropical Andes/western Amazon. Clim. Dyn. 2020, 54, 2613–2631. [Google Scholar] [CrossRef]
- Sulca, J.; Vuille, M.; Silva, Y.; Takahashi, K. Teleconnections between the Peruvian Central Andes and Northeast Brazil during extreme rainfall events in Austral summer. J. Hydrometeorol. 2016, 17, 499–515. [Google Scholar] [CrossRef]
- Rojas-Murillo, K.; Lupo, A.R.; Garcia, M.; Gilles, J.; Korner, A.; Rivera, M.A. ENSO and PDO related interannual variability in the north and east-central part of the Bolivian Altiplano in South America. Int. J. Clim. 2022, 42, 2413–2439. [Google Scholar] [CrossRef]
- Lavado-Casimiro, W.; Espinoza, J.C. Impactos de El Niño y La Niña en las lluvias del Perú (1965–2007). Rev. Bras. Meteorol. 2014, 29, 171–182. [Google Scholar] [CrossRef]
- Vuille, M.; Bradley, R.S.; Keimig, F. Interannual climate variability in the Central Andes and its relation to tropical Pacific and Atlantic forcing. J. Geophys. Res. Atmos. 2000, 105, 12447–12460. [Google Scholar]
- Garreaud, R. The Andes climate and weather. Adv. Geosci. 2009, 22, 3–11. [Google Scholar]
- Espinoza, J.C.; Marengo, J.A.; Ronchail, J.; Carpio, J.M.; Flores, L.N.; Guyot, J.L. The extreme 2014 flood in south-western Amazon basin: The role of tropical-subtropical South Atlantic SST gradient. Environ. Res. Lett. 2014, 9, 124007. [Google Scholar] [CrossRef]
- Robertson, A.W.; Mechoso, C.R.; Kim, Y.-J. The influence of Atlantic sea surface temperature anomalies on the North Atlantic Oscillation. J. Clim. 2000, 13, 122–138. [Google Scholar]
- Lenters, J.; Cook, K.H. Summertime precipitation variability over South America: Role of the large-scale circulation. Mon. Weather Rev. 1999, 127, 409–431. [Google Scholar] [CrossRef]
- Laureanti, N.C.; Chou, S.C.; Nobre, P.; Curchitser, E. On the relationship between the South Atlantic Convergence Zone and sea surface temperature during Central-East Brazil extreme precipitation events. Dyn. Atmos. Ocean. 2024, 105, 101422. [Google Scholar]
- Segura, H.; Espinoza, J.C.; Junquas, C.; Takahashi, K. Evidencing decadal and interdecadal hydroclimatic variability over the Central Andes. Environ. Res. Lett. 2016, 11, 094016. [Google Scholar]
- Sulca, J.; Vuille, M.; Dong, B. Interdecadal variability of the austral summer precipitation over the Central Andes. Front. Earth Sci. 2022, 10, 954954. [Google Scholar] [CrossRef]
- Seiler, C.; Hutjes, R.W.; Kabat, P. Climate variability and trends in Bolivia. J. Appl. Meteorol. Climatol. 2013, 52, 130–146. [Google Scholar] [CrossRef]
- Grimm, A.M.; Saboia, J.P.J. Interdecadal variability of the South American precipitation in the monsoon season. J. Clim. 2015, 28, 755–775. [Google Scholar]
- Hersbach, H.; Bell, B.; Berrisford, P.; Hirahara, S.; Horányi, A.; Muñoz-Sabater, J.; Nicolas, J.; Peubey, C.; Radu, R.; Schepers, D. The ERA5 global reanalysis. Q. J. R. Meteorol. Soc. 2020, 146, 1999–2049. [Google Scholar] [CrossRef]
- Harrison, S.P.; Bartlein, P.J.; Prentice, I.C. What have we learnt from palaeoclimate simulations? J. Quat. Sci. 2016, 31, 363–385. [Google Scholar] [CrossRef]
- Skamarock, W.C.; Klemp, J.B. A time-split nonhydrostatic atmospheric model for weather research and forecasting applications. J. Comput. Phys. 2008, 227, 3465–3485. [Google Scholar] [CrossRef]
- Birkel, S.; Mayewski, P.; Perry, L.; Seimon, A.; Andrade-Flores, M. Evaluation of reanalysis temperature and precipitationfor the Andean Altiplano and adjacent cordilleras. Earth Space Sci. 2022, 9, e2021EA001934. [Google Scholar] [CrossRef]
- Babaei, M.; Alizadeh, O.; Irannejad, P. Impacts of orography on large-scale atmospheric circulation: Application of a regional climate model. Clim. Dyn. 2021, 57, 1973–1992. [Google Scholar] [CrossRef]
- Schumacher, V.; Fernández, A.; Justino, F.; Comin, A. WRF high resolution dynamical downscaling of precipitation for the Central Andes of Chile and Argentina. Front. Earth Sci. 2020, 8, 328. [Google Scholar] [CrossRef]
- Hong, S.-Y.; Lim, K.-S.S.; Lee, Y.-H.; Ha, J.-C.; Kim, H.-W.; Ham, S.-J.; Dudhia, J. Evaluation of the WRF double-moment 6-class microphysics scheme for precipitating convection. Adv. Meteorol. 2010, 2010, 707253. [Google Scholar] [CrossRef]
- Mlawer, E.J.; Taubman, S.J.; Brown, P.D.; Iacono, M.J.; Clough, S.A. Radiative transfer for inhomogeneous atmospheres: RRTM, a validated correlated-k model for the longwave. J. Geophys. Res. Atmos. 1997, 102, 16663–16682. [Google Scholar] [CrossRef]
- Dudhia, J. Numerical study of convection observed during the winter monsoon experiment using a mesoscale two-dimensional model. J. Atmos. Sci. 1989, 46, 3077–3107. [Google Scholar] [CrossRef]
- Berg, L.K.; Zhong, S. Climatology. Sensitivity of MM5-simulated boundary layer characteristics to turbulence parameterizations. J. Appl. Meteorol. 2005, 44, 1467–1483. [Google Scholar] [CrossRef]
- Huang, M.; Huang, B.; Huang, A.H.-L. Implementation of the 5-layer thermal diffusion scheme in weather research and Forecasting model with Intel many integrated core (MIC) architecture. In High-Performance Computing in Remote Sensing IV; SPIE: Bellingham, DC, USA, 2014; pp. 67–75. [Google Scholar]
- Kain, J.S. The Kain–Fritsch convective parameterization: An update. J. Appl. Meteorol. 2004, 43, 170–181. [Google Scholar] [CrossRef]
- Rauscher, S.A.; Coppola, E.; Piani, C.; Giorgi, F. Resolution effects on regional climate model simulations of seasonal precipitation over Europe. Clim. Dyn. 2010, 35, 685–711. [Google Scholar] [CrossRef]
- Torrez-Rodriguez, L.; Goubanova, K.; Muñoz, C.; Montecinos, A. Evaluation of temperature and precipitation from CORDEX-CORE South America and Eta-RCM regional climate simulations over the complex terrain of Subtropical Chile. Clim. Dyn. 2023, 61, 3195–3221. [Google Scholar] [CrossRef]
- Caldwell, P.; Chin, H.-N.S.; Bader, D.C.; Bala, G.J. Evaluation of a WRF dynamical downscaling simulation over California. Clim. Change 2009, 95, 499–521. [Google Scholar] [CrossRef]
- Chaves, R.R.; Nobre, P.J. Interactions between sea surface temperature over the South Atlantic Ocean and the South Atlantic Convergence Zone. Geophys. Res. Lett. 2004, 31, L03204. [Google Scholar] [CrossRef]
- Martin, L.C.; Blard, P.-H.; Lavé, J.; Condom, T.; Prémaillon, M.; Jomelli, V.; Brunstein, D.; Lupker, M.; Charreau, J.; Mariotti, V.; et al. Lake Tauca highstand (Heinrich Stadial 1a) driven by a southward shift of the Bolivian High. Sci. Adv. 2018, 4, eaar2514. [Google Scholar] [CrossRef]
- de Mendonça Silva, I.; Medeiros, D.M.; Mendes, D.; Mesquita, M.d.S. Intraseasonal and interannual mechanisms of summer rainfall over Northeast Brazil using a hidden Markov model. Clim. Dyn. 2023, 61, 5805–5826. [Google Scholar] [CrossRef]
- Salvatteci, R.; Schneider, R.R.; Blanz, T.; Mollier-Vogel, E.J. Deglacial to Holocene ocean temperatures in the Humboldt Current System as indicated by alkenone paleothermometry. Geophys. Res. Lett. 2019, 46, 281–292. [Google Scholar] [CrossRef]
- Apaéstegui, J.; Cruz, F.W.; Vuille, M.; Fohlmeister, J.; Espinoza, J.C.; Sifeddine, A.; Strikis, N.; Guyot, J.L.; Ventura, R.; Cheng, H. Precipitation changes over the eastern Bolivian Andes inferred from speleothem (δ 18 O) records for the last 1400 years. Earth Planet. Sci. Lett. 2018, 494, 124–134. [Google Scholar] [CrossRef]
- Bird, B.W.; Abbott, M.B.; Vuille, M.; Rodbell, D.T.; Stansell, N.D.; Rosenmeier, M.F. A 2300-year-long annually resolved record of the South American summer monsoon from the Peruvian Andes. Proc. Natl. Acad. Sci. USA 2011, 108, 8583–8588. [Google Scholar] [CrossRef]
- Vuille, M.; Burns, S.; Taylor, B.; Cruz, F.; Bird, B.; Abbott, M.; Kanner, L.; Cheng, H.; Novello, V. A review of the South American monsoon history as recorded in stable isotopic proxies over the past two millennia. Clim. Past 2012, 8, 1309–1321. [Google Scholar]
- Mujica, M.I.; Latorre, C.; Maldonado, A.; González-Silvestre, L.; Pinto, R.; de Pol-Holz, R.; Santoro, C.M. Late Quaternary climate change, relict populations and present-day refugia in the northern Atacama Desert: A case study from Quebrada La Higuera (18° S). J. Biogeogr. 2015, 42, 76–88. [Google Scholar]
- Campos, J.; Cruz, F.; Ambrizzi, T.; Deininger, M.; Vuille, M.; Novello, V.F.; Strikis, N. Coherent South American Monsoon variability during the last millennium revealed through high-resolution proxy records. Geophys. Res. Lett. 2019, 46, 8261–8270. [Google Scholar] [CrossRef]
- Minvielle, M.; Garreaud, R.D. Projecting rainfall changes over the South American Altiplano. J. Clim. 2011, 24, 4577–4583. [Google Scholar] [CrossRef]
- Vera, C.S.; Díaz, L.B.; Saurral, R.I. Influence of anthropogenically-forced global warming and natural climate variability in the rainfall changes observed over the South American Altiplano. Front. Environ. Sci. 2019, 7, 87. [Google Scholar]
- Skamarock, W.C.; Klemp, J.B.; Dudhia, J.; Gill, D.O.; Barker, D.M.; Duda, M.G.; Huang, X.-Y.; Wang, W.; Powers, J.G. A description of the advanced research WRF version 3. NCAR Tech. Note 2008, 475, 113. [Google Scholar]

| DJF Precipitation Anomaly (z-Score) | DJF Nino 3.4 Index (z-Score) | DJF Southeastern Pacific SST Anomaly (Figure 2) | DJF South Atlantic Ocean Dipole Index (SAODI) | |
|---|---|---|---|---|
| 1983/1983 | 2.4 | −0.5 | Warm | 0.5 |
| 1997/1998 | −2.4 | 2.3 | Cold | 0.92 |
| 2003/2004 | 0.23 | 0.4 | Cold | 0.63 |
| 2011/2012 | 1.7 | −0.7 | Warm | −0.68 |
| Simulation Run | Initial Date/Time | Final Date/Time | Spin-Up Time | Timesteps (seconds) | Number of Cycles |
|---|---|---|---|---|---|
| 1983/1984 | 10 November 1983, 09:00 | 10 November 1984, 06:00 | 10 days | 90 | 100 |
| 1997/1998 (control) | 21 October 1997, 18:00 | 21 October 1998, 15:00 | 10 days | 90 | 100 |
| 2003/2004 (control) | 2 May 2003, 15:00 | 2 May 2004, 12:00 | 10 days | 90 | 100 |
| 2011/2012 | 21 June 2011, 09:00 | 21 June 2012, 06:00 | 10 days | 90 | 100 |
Disclaimer/Publisher’s Note: The statements, opinions and data contained in all publications are solely those of the individual author(s) and contributor(s) and not of MDPI and/or the editor(s). MDPI and/or the editor(s) disclaim responsibility for any injury to people or property resulting from any ideas, methods, instructions or products referred to in the content. |
© 2025 by the authors. Licensee MDPI, Basel, Switzerland. This article is an open access article distributed under the terms and conditions of the Creative Commons Attribution (CC BY) license (https://creativecommons.org/licenses/by/4.0/).
Share and Cite
Jara, I.A.; Astudillo, O.; Salinas, P.; Torrez-Rodríguez, L.; Lampe-Huenul, N.; Maldonado, A. Exploring the Causes of Multicentury Hydroclimate Anomalies in the South American Altiplano with an Idealized Climate Modeling Experiment. Atmosphere 2025, 16, 751. https://doi.org/10.3390/atmos16070751
Jara IA, Astudillo O, Salinas P, Torrez-Rodríguez L, Lampe-Huenul N, Maldonado A. Exploring the Causes of Multicentury Hydroclimate Anomalies in the South American Altiplano with an Idealized Climate Modeling Experiment. Atmosphere. 2025; 16(7):751. https://doi.org/10.3390/atmos16070751
Chicago/Turabian StyleJara, Ignacio Alonso, Orlando Astudillo, Pablo Salinas, Limbert Torrez-Rodríguez, Nicolás Lampe-Huenul, and Antonio Maldonado. 2025. "Exploring the Causes of Multicentury Hydroclimate Anomalies in the South American Altiplano with an Idealized Climate Modeling Experiment" Atmosphere 16, no. 7: 751. https://doi.org/10.3390/atmos16070751
APA StyleJara, I. A., Astudillo, O., Salinas, P., Torrez-Rodríguez, L., Lampe-Huenul, N., & Maldonado, A. (2025). Exploring the Causes of Multicentury Hydroclimate Anomalies in the South American Altiplano with an Idealized Climate Modeling Experiment. Atmosphere, 16(7), 751. https://doi.org/10.3390/atmos16070751