Article

Optimizing Vertical Unidirectional Airflow in Cleanrooms: An Integrated Approach to Floor Perforation, Plenum, and Fan Filter Unit Configurations

by
Zonghua Huang
1,
Cheng Zeng
2,*,
Zhichu Wang
2,
Jun Lu
3,*,
Qian Xiang
1,
Xingcheng Huo
1,
Tingdong Tan
1,
Yan Li
4,
Wenmao Feng
4 and
Guitao Zhang
4
1
China Construction Third Bureau First Engineering Co., Ltd., Wuhan 430040, China
2
Energy and Environment Institute, University of Hull, Hull HU6 7RX, UK
3
School of Civil Engineering, Chongqing University, Chongqing 400045, China
4
Chengdu BOE Display Technology Co., Ltd., Chengdu 611731, China
*
Authors to whom correspondence should be addressed.
Atmosphere 2025, 16(6), 632; https://doi.org/10.3390/atmos16060632
Submission received: 17 April 2025 / Revised: 15 May 2025 / Accepted: 16 May 2025 / Published: 22 May 2025
(This article belongs to the Special Issue Feature Papers in Atmospheric Techniques, Instruments, and Modeling)

Abstract

:
Maintaining vertically unidirectional airflow in cleanrooms is crucial for achieving air cleanness and protecting occupants inside, from industrial semiconductor technicians to hospital surgeons and patients. This study investigates airflow inclination and develops optimization strategies for vertical unidirectional flow cleanrooms, with a focus on enhancing airflow verticality and uniformity to reduce airborne contamination. A new dimensionless parameter, K1, is introduced to quantify the impact of lower interlayer airflow velocity on cleanroom airflow inclination, thereby providing a practical metric for design optimization. Key influencing factors, including flooring perforated plate configurations, plenum heights, and FFU (Fan Filter Unit) layout rates, are systematically evaluated. The results indicate that lower perforation rates (e.g., 10%) significantly improve vertical airflow by reducing inclination angles to below 25°, with a non-uniform perforated plate arrangement proving essential to sustain airflow verticality. Moreover, non-uniform perforated plate configurations are particularly effective in designs with low plenum heights (below 1.3 m). In addition, FFU layout rates above 60% are found optimal to provide vertical airflow, consistently achieving inclination angles below 20°. Further changes in FFU layout rate show minor returns on airflow verticality. The study establishes clear design guidelines for airflow optimization and highlights the dual benefits of these configurations in safeguarding occupational health and controlling airborne contamination in cleanrooms.

1. Introduction

Cleanrooms are essential in various industries, including electronics manufacturing, pharmaceuticals, biotechnology, aerospace, and healthcare. These controlled environments are specifically designed to minimize airborne particles, microorganisms, and contaminants, adhering to stringent cleanliness standards. As a result, heating, ventilation, and air conditioning (HVAC) systems are among the most critical components in cleanroom design. Numerous studies focus on HVAC systems in cleanrooms, investigating aspects such as thermal comfort [1,2,3], pressure distribution [4,5], air velocity, and air changes per hour (ACH) [6,7,8]. Among these indicators, the most critical performance indicator for cleanrooms remains their cleanliness level. Defined by the International Organization for Standardization (ISO), cleanrooms are classified based on the number and size of particles permitted with ISO 1 being the cleanest and ISO 9 being the least [9]. To meet the required ISO standards and the safety of occupants, air distribution systems must establish controlled airstream patterns to efficiently contain and remove contaminant particles. To achieve this, there is a list of factors that should be considered, including Fan Filter Units (FFUs), air flow patterns, and cleanroom floor design.
Fan Filter Units (FFUs) are integral to cleanroom air distribution systems. Due to the high ACH required in cleanrooms, traditional designs necessitate that FFUs operate at high external pressures to maintain air circulation. However, this approach increases the risk of cross-contamination from outside air. To address this issue, Lin et al. proposed a recirculation system incorporating a fan dry coil unit (FDCU), which optimizes particle removal and temperature control while maintaining a short air recirculation path. This design reduces the risk of air infiltration caused by negative pressure and achieves system energy savings of 4.3% [10]. Furthermore, Lin et al. developed a ceiling-supply ceiling-return FDCU system, which successfully increased the capture rate of 0.1 μm particles by 50% compared to conventional wall-return systems [11]. To adapt to different designs and requirements of cleanrooms, Li et al. conducted a statistical investigation on multiple supply air outlet sizes and face velocities of FFUs, aiming to achieve cleanroom energy saving while maintaining satisfactory particulate concentration distribution [12]. Permana et al. evaluated multiple distinct FFU designs using a combination method of field measurement and Computational Fluid Dynamics (CFD) simulation studies, highlighting the effectiveness of a centralized FFU configuration of a 12% reduction in temperature variation, and a 15% decrease in particle concentration compared to conventional ceiling designs [13].
In addition to FFUs, efficient air distribution systems also rely on the strategic placement of air inlets and outlets [14]. Eslami et al. analyzed various combinations of three supply air diffuser configurations and three exhaust grille configurations. They found that the arrangement of supply and exhaust openings significantly influences particulate contaminant dispersion in cleanrooms. Vertical and horizontal supply diffusers outperformed central configurations, while horizontally symmetric exhaust grilles demonstrated better ventilation performance than asymmetric and vertically symmetric arrangements [15]. Metwally et al. conducted a simulation-based study of a pharmaceutical cleanroom equipped with 12 air supply ceiling diffusers to determine the optimal exhaust grille arrangement for achieving unidirectional airflow. The configuration with two exhaust grilles on opposite walls proved most effective, resulting in unidirectional airflow with no vortex formation in either vertical or horizontal cross-sections, thereby minimizing particle settlement and dispersion [16].
The other factor is floor design, being essential in cleanroom designs to maintain the uniformity of air velocity distribution, especially for vertical unidirectional flow cleanrooms. As ventilation systems in cleanrooms are often overdesigned to enhance particle removal rates, Khoo et al. conducted an experimental study to determine optimal ACH settings and free area ratio of raised-floor configurations for energy savings while maintaining low particle concentrations. Their findings revealed that both ACH and the free area ratio significantly impact cleanroom cleanliness levels. This insight is particularly valuable for reducing operational costs in cleanrooms with low ACH requirements [17]. Permana et al. conducted a study in Class 1 cleanrooms to investigate the effects of FFU velocities, perforated floor porosity rates, and raised-floor heights on airflow uniformity and the reduction in turbulent kinetic energy. Their findings indicated that while changes in floor porosity had a modest impact, a decrease in FFU velocity combined with an increase in raised-floor height significantly influenced the air deflection angle. This combination has the potential to improve airflow dynamics and minimize turbulence [18].
Apart from cleanroom air flow designs, the measurement of air quality monitoring in cleanroom environments is also important. Key determinants include the strategic placement of sampling points, sampling frequency with respect to occupancy type, and selection of monitoring indices aligned with cleanroom functions. These factors collectively inform the optimization of monitoring and control strategies. Recently, the work from Sofia et al. presents an operational model to define the number of positions of air quality network [19], which could be adopted in cleanroom studies.
Existing research primarily focuses on the configurations of FFUs, the placement of air inlets and outlets, and cleanroom floor designs. However, limited attention is given to the impact of airflow velocity and the inducing effects within the lower interlayer of cleanrooms. To address this gap and achieve optimal vertical unidirectional flow efficiently, this study focuses on the causes and influencing factors of the inducing effect in the lower interlayer. These factors include both uniform and non-uniform perforated plate opening ratios, the arrangement of non-uniform perforated plate opening ratios, and plenum heights. Using simulations, the study evaluates the impacts of three uniform and four non-uniform perforated plate opening ratios, seven plenum heights, FFU layout rate and velocity, along with the critical interaction with the perforated plate opening ratios. More importantly, a dimensionless velocity indicator, K1, as a design guidance indicator, is introduced and evaluated to quantify the inducing effect, defined as the ratio of air velocity below the raised floor to air velocity above the cleanroom perforated plates. These works contribute new knowledge and understanding to the design of clean room air flow. The findings provide valuable insights and practical solutions, contributing to the continuous enhancement of cleanroom standards and practices in the industry.

2. Establishment of the Simulation Model and Evaluation Indicators

2.1. Energy, Mass, and Momentum Equations

The simulation was performed by using the ANSYS Fluent 2023 R2. In this study, the airflow control equations used for the cleanroom airflow simulation are the Reynolds-averaged Navier–Stokes (RANS) equations, while the governing equations includes continuity equation, momentum equation, and energy equation [20], given as follows.
Continuity equation is explained in Equation (1):
ρ t + ρ u = S m
where S m represents the mass source or sink in the flow field, which accounts for the addition or removal of mass within the domain.
Momentum equation is explained in Equation (2):
ρ u t + ρ u u = p + τ + ρ g + F
where k e f f represents the effective thermal conductivity of the fluid and is the sum of the molecular conductivity ( k ) and the turbulent conductivity ( k t ).
Energy equation is explained in Equation (3):
ρ E t + u ρ E + p = k e f f T + j h j J j + S h
The k ε turbulence model which assumes isotropy of turbulent eddies and calculates transport equations for turbulent kinetic energy k and turbulent dissipation rate ε (Equations (4) and (5)) is selected based on the above assumptions [20].
ρ k t + ρ k u = μ t σ k k + G k ρ
ρ ε t + ρ ε u = μ t σ ε ε + C 1 ε k G k C 2 ρ ε 2 / k
The following assumptions are applied for this model:
  • Incompressible Flow: Assumes the fluid density ( ρ ) remains constant throughout the domain. This is valid for cleanroom airflow as the flow speed is low (Mach number < 0.3), and compressibility effects are negligible.
  • Newtonian Fluid: The fluid exhibits constant viscosity ( μ ) with a linear stress–strain relationship.
  • Steady-State Flow: Time-independent flow where all variables (e.g., velocity, pressure, temperature) remain constant with respect to time ( / t = 0 ) from governing equations, assuming equilibrium conditions.
  • No-Slip Boundary Condition: The velocity at solid surfaces (e.g., walls, doors) is zero relative to the surface ( u w a l l = 0 ). This reflects physical reality, as air adheres to stationary surfaces due to viscous effects.
  • Adiabatic Walls: Assumes no heat flux through walls.
  • Negligible Radiation: Radiative heat transfer is ignored, assuming its contribution to the energy balance is insignificant compared to convective and conductive effects.
  • Closed System: The cleanroom is modelled as sealed, with no air infiltration or leakage. This ensures that the airflow distribution is entirely governed by the internal supply and exhaust system.
As this study is to evaluate air flow organization under controlled design parameters, these assumptions are adopted. It is important to acknowledge that they may introduce certain limitations to other studies with different scopes. For instance, the steady-state assumption does not capture transient phenomena such as door openings and personnel movement. The use of the k ε turbulence model may not fully complex recirculation zones. The neglect of thermal radiation and buoyancy effects simplifies the energy equation but may underestimate flow variations with significant internal heat sources.
After applying the assumptions above, the governing equations can be simplified as the continuity equation in Equation (6), simplified momentum equation in Equation (7), and simplified energy equation as Equation (8):
u = 0
ρ u u = p + μ e f f u + ρ g
ρ C p T u = k e f f T
where ( μ e f f = μ + μ t ) which incorporates effective viscosity to account for turbulence.

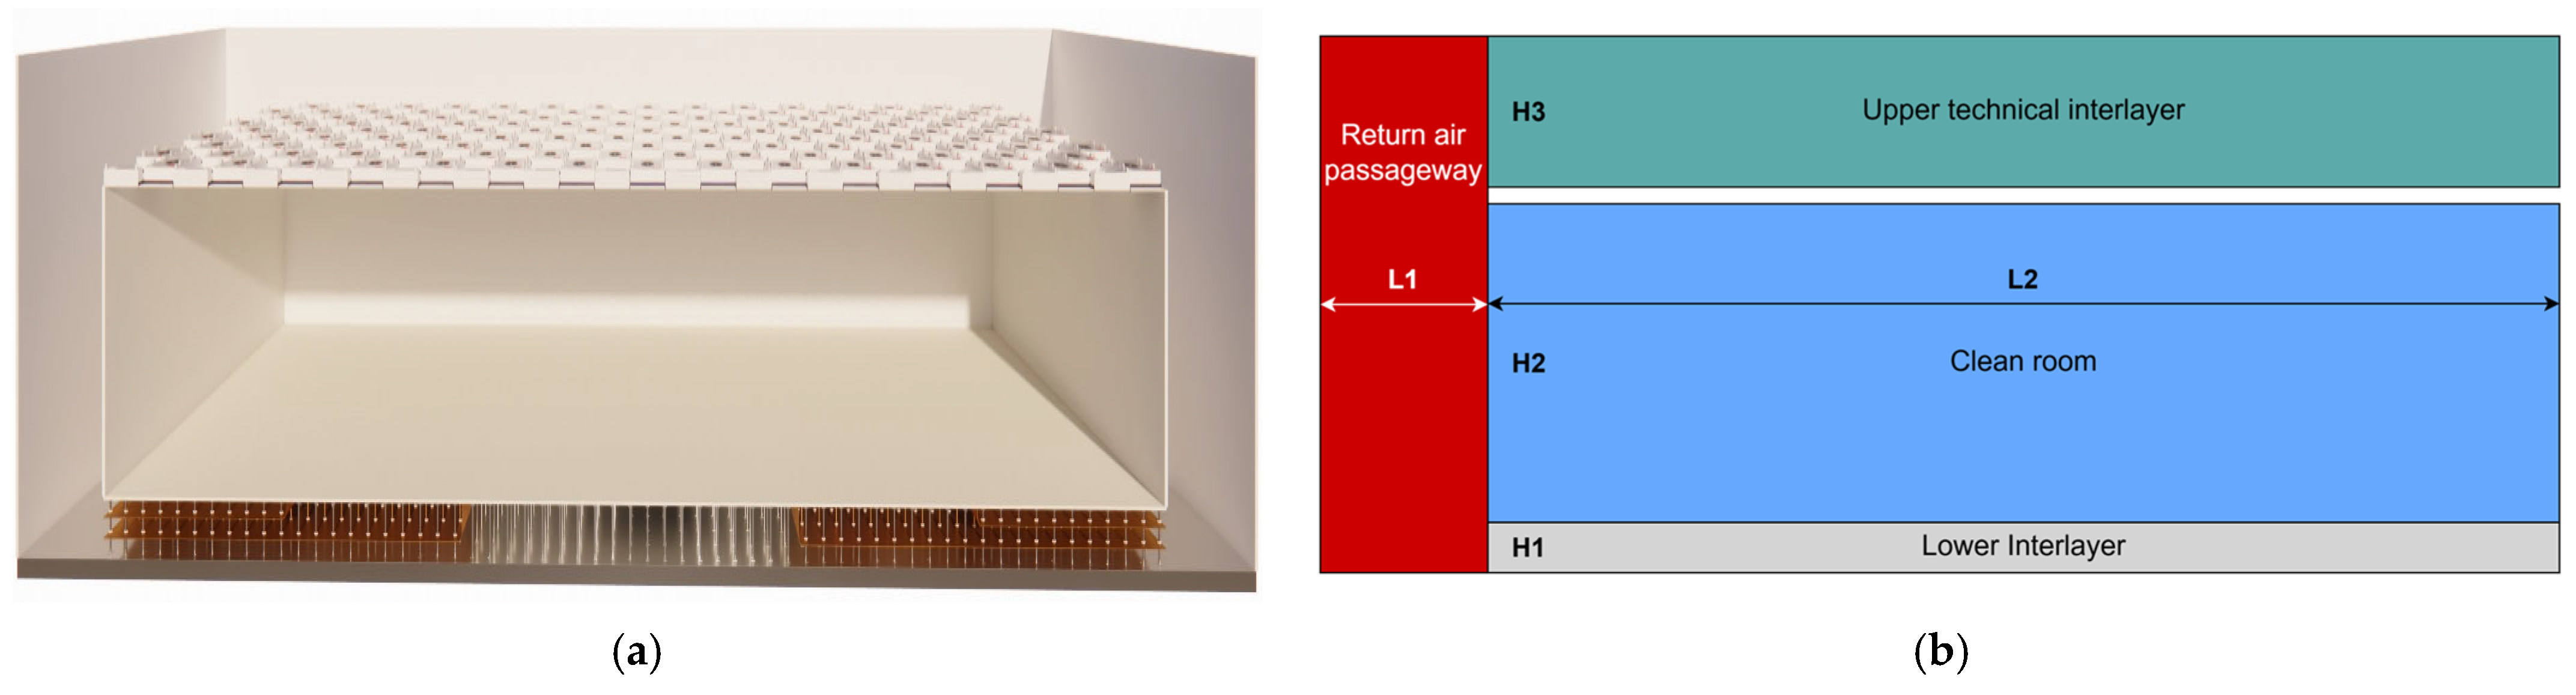
2.2. Cleanroom Geometry Model and Mesh for Simulation

Figure 1 presents the structural diagram of the cleanroom along with dimensions. The width of the return air duct is denoted as L1 of 3 m. The heights of the lower interlayer and upper interlayer are represented as H1 of 0.5 m and H2 of 4.5 m, and H3 of 2.1 m, respectively.
To ensure accurate simulation of airflow and boundary layer characteristics, ANSYS Fluent Meshing was used to generate a high-quality mesh for the computational domain. A combination of tetrahedral and hexahedral elements was employed, with tetrahedral elements used in regions with complex geometries and hexahedral elements in structured regions for numerical stability. The boundary layer mesh thickness growth rate was set to 1.2 to maintain smooth transitions. The final mesh consists of approximately 4.8 million elements, balancing computational cost and accuracy.

2.3. Evaluations of Air Flow Inclination

To evaluate the quality of airflow in a vertical unidirectional cleanroom, the angle between the airflow direction and the gravity direction is selected as the criterion. The formula for calculating the angle between the airflow at a certain location inside cleanroom and the gravity is shown in Equation (9).
θ = arccos v g v
where v g is the vertical velocity component (m/s), and v is the resultant velocity (m/s) representing the magnitude of the total airflow velocity.
Since the airflow in the lower interlayer induces the cleanroom airflow direction, and to fully reflect the impact of the lower interlayer airflow on the airflow direction within the cleanroom, this study introduces a dimensionless parameter K1, which represents the ratio of the flow velocity at a certain location in the lower interlayer to the average velocity at a cross-section 0.1 m above the raised floor, as shown in the following Equation (10).
K 1 = V x V b
where V x represents the air velocity at a certain location in the lower interlayer, and V b represents the average air velocity at a cross-section 0.1 m above the raised floor.

2.4. Model Validation

To validate the accuracy and suitability of the selected numerical simulation model for unidirectional airflow simulation, the model was validated against experimental field measurements conducted in a cleanroom, with results from [19]. This dataset provides velocity measurements at various positions within a cleanroom operating under vertical unidirectional airflow conditions. The experimental conditions used for validation are summarized in Table 1.
Using the model established and applying the same conditions as in the experiment [19], the airflow velocity at various locations across the room was simulated and compared to the experimental measurements. To evaluate the accuracy of the simulation, the relative error between the simulated and experimental data at each point was calculated using Equation (11), and normalized root mean square error (NRMSE) between each pair of data was calculated using Equation (12). These figures, as shown in Table 2, ranging from 0.4% to 7.0% with at 4.4%, demonstrate a good representation of the simulation model.
E r , i = x s i m , i x e x p , i x e x p , i
S e = 1 n i = 1 n x s i m , i x e x p , i x e x p , i 2
where x sim , i and x exp , i   represent the simulated and measured value at node i, respectively.

3. Results

The results section provides a detailed analysis of cleanroom airflow optimization, focusing on the impact of various design and operational factors on airflow inclination and uniformity. Key areas include the evaluation of perforated plate layouts, the role of plenum height, and FFU layout rates. The findings establish practical optimization guidelines for achieving improved airflow verticality.

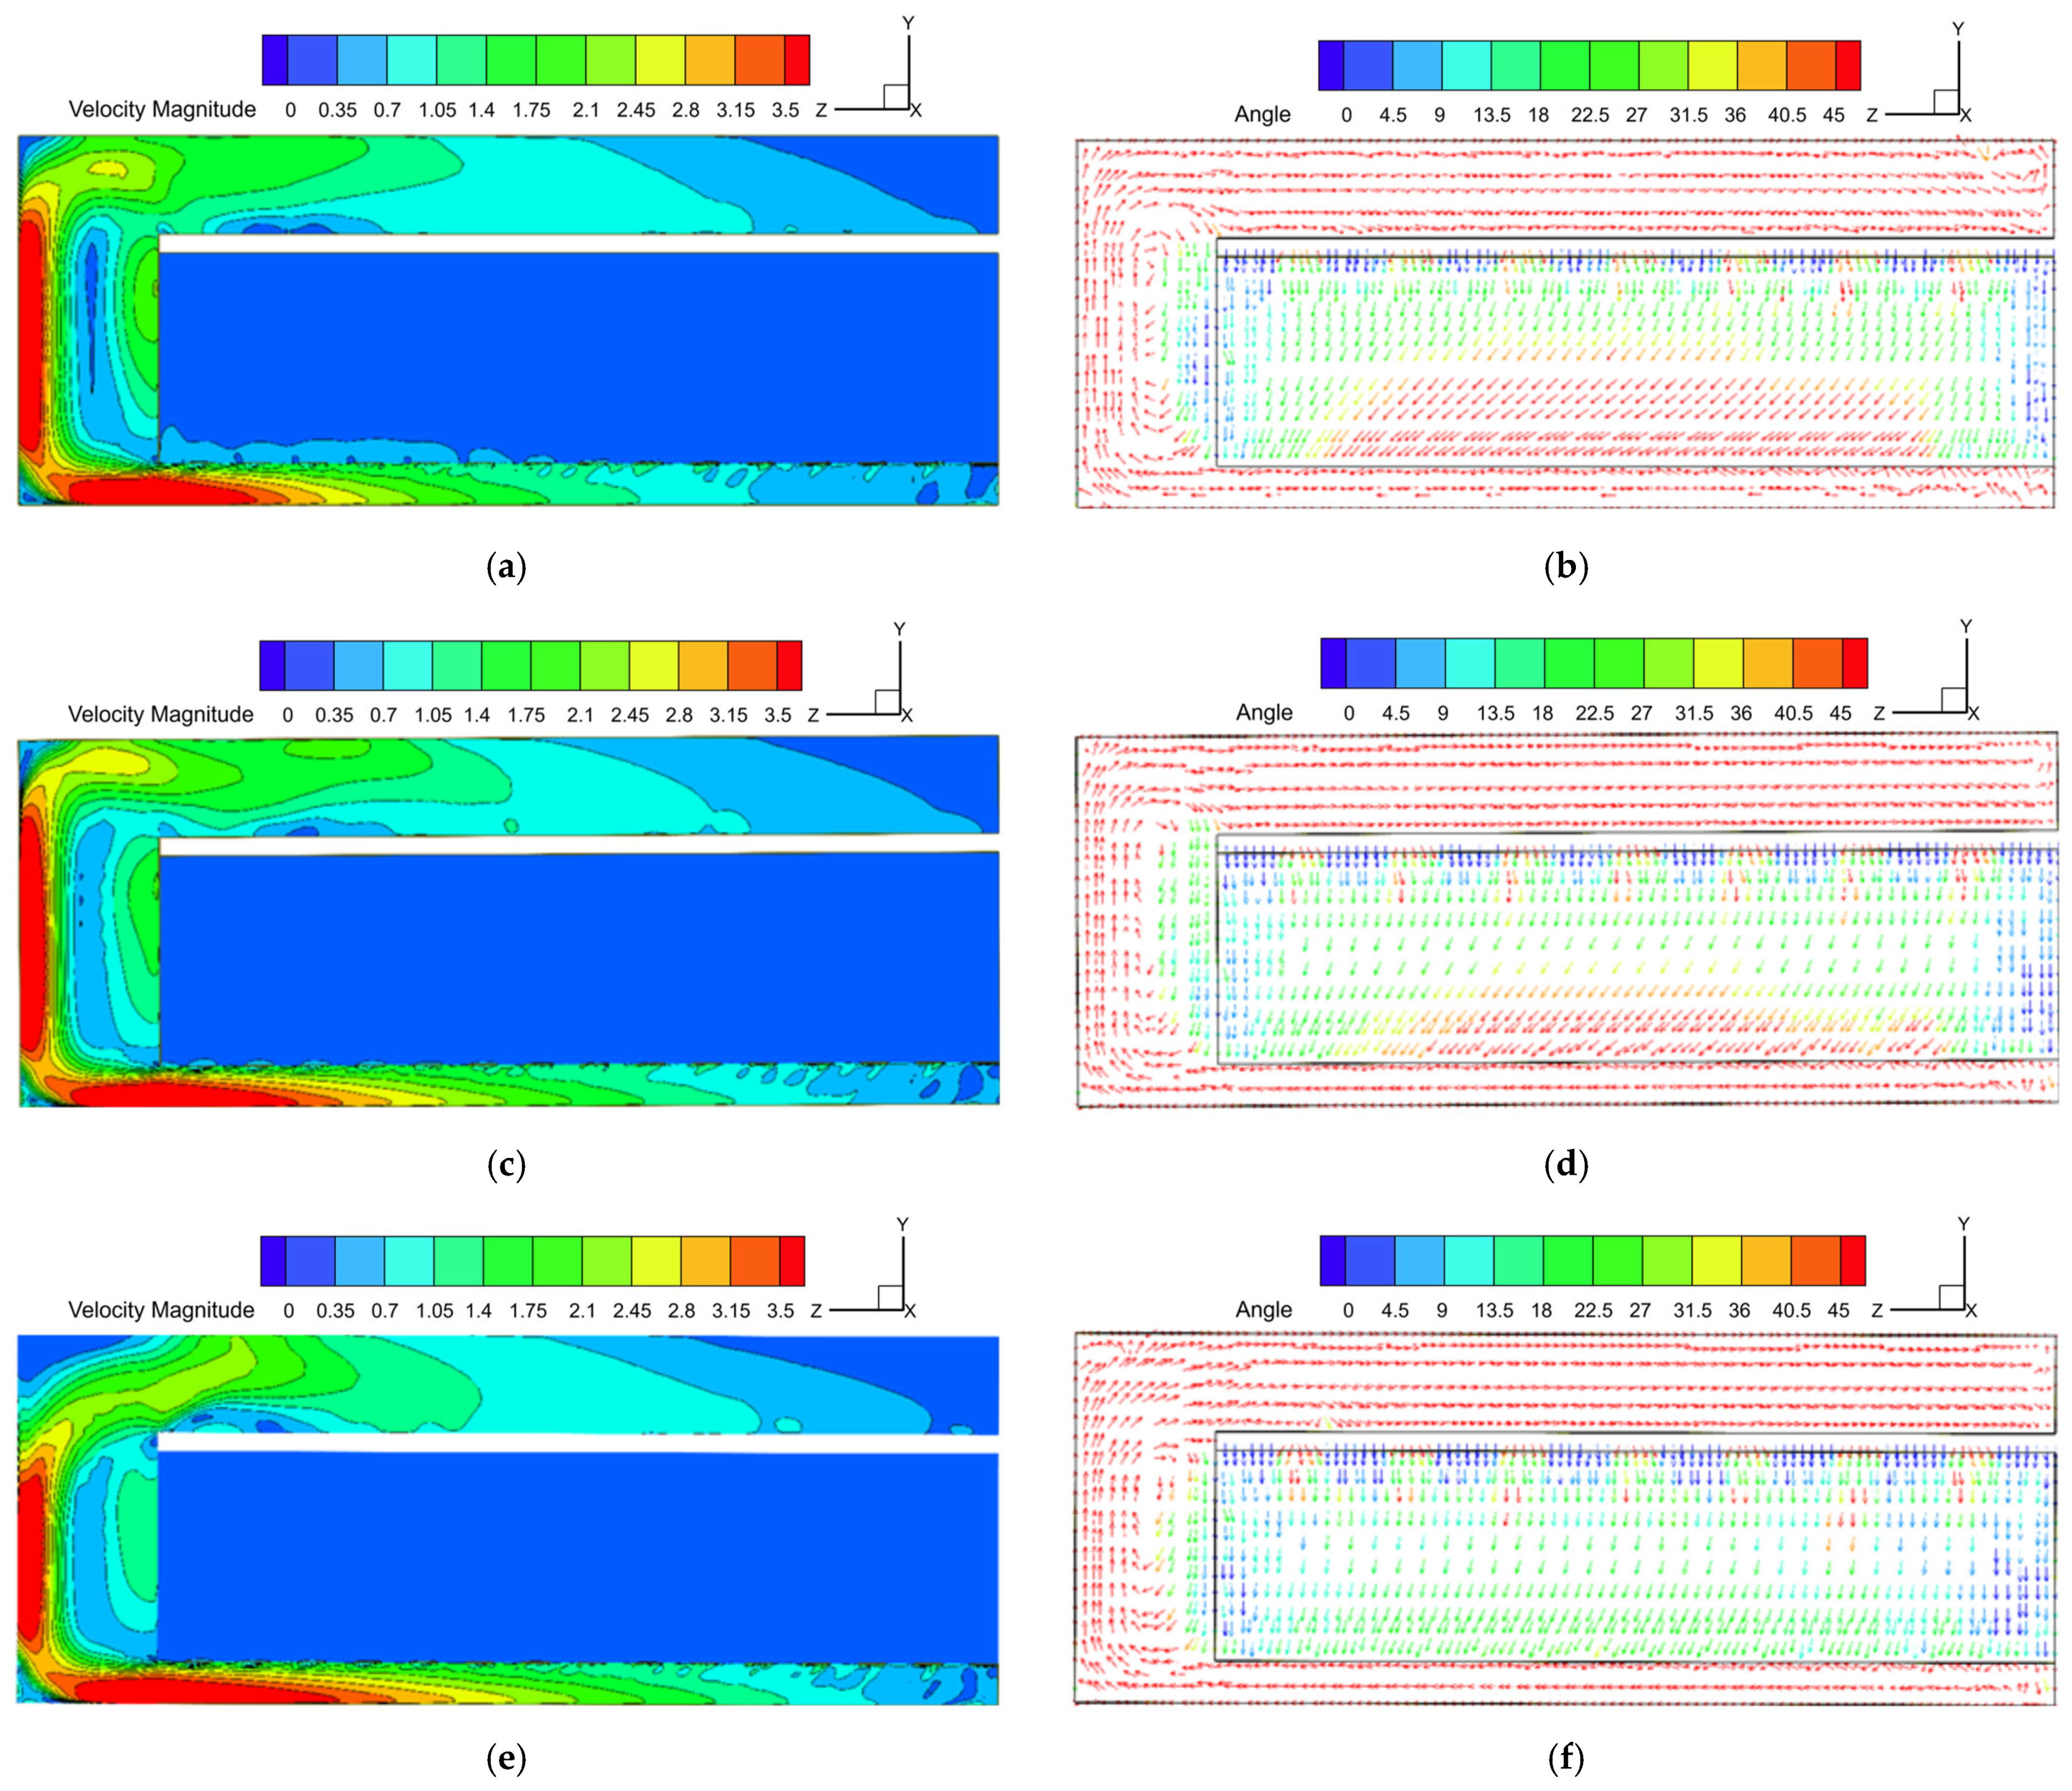
3.1. Impact of Uniform Perforated Plate Opening Ratios on Airflow

The perforation rate of a plate at the lower Interlayer refers to the proportion of its surface area covered by perforations. Plates with lower perforation rates create more resistance, limiting airflow and helping to maintain verticality, while higher perforation rates allow greater airflow but risk compromising vertical airflow control. Investigation has been conducted on how different perforated plate opening ratios, from 25% through 17% down to 10%, affect the verticality of airflow in a cleanroom (see Figure 2). At a 25% opening ratio, low resistance allows excessive horizontal airflow from the lower interlayer, leading to significant inclination angles and uneven velocity distribution, particularly in the central cleanroom area. The velocity contours show high airflow concentration near the bend of return air ducts, leading to uneven distribution. With a 17% opening ratio, verticality improves moderately as resistance increases, reducing horizontal deflection and creating a more balanced airflow. However, moderate horizontal deflection remains in central regions. At a 10% opening ratio, airflow verticality is significantly enhanced, and the velocity distribution becomes highly uniform. The 10% opening ratio achieves the best performance, ensuring most areas maintain verticality within the industry standard of 25°. These results highlight the critical role of perforation rates in controlling airflow distribution and ensuring cleanroom performance.
Table 3 provides a detailed comparison of airflow inclination angles at different heights above the raised floor for various perforation rates. The data reveals a consistent trend where inclination angles decrease with lower perforation rates. For instance, at 2.4 m, the inclination angle for the 10% perforation rate is 26.4°, significantly lower than 35.9° for 25% and 31.6° for 17%. Across all heights, the 10% perforation rate maintains smaller inclination angles, confirming its effectiveness in minimizing turbulence and horizontal airflow effects.
Considering the velocity distribution in the lower interlayer significantly influences the airflow’s inclination angle within the cleanroom, the dimensionless parameter K1 is analyzed, which represents the ratio of the local airflow velocity in the lower interlayer to the average velocity at a cross-section 0.1 m above the raised floor. This parameter quantifies the non-uniformity of velocity distribution and its impact on airflow inclination. As shown in Figure 3, it indicates that at a 25% perforation rate, K1 values are highest, reflecting significant velocity non-uniformity. For a 17% perforation rate, it decreases moderately, demonstrating better uniformity and reduced horizontal effects, although some areas still show noticeable gradients. At a 10% perforation rate, K values are lowest across the lower interlayer, showing highly uniform velocity distribution. These results highlight that lower perforation rates effectively minimize K1, improving airflow verticality and overall cleanroom performance.

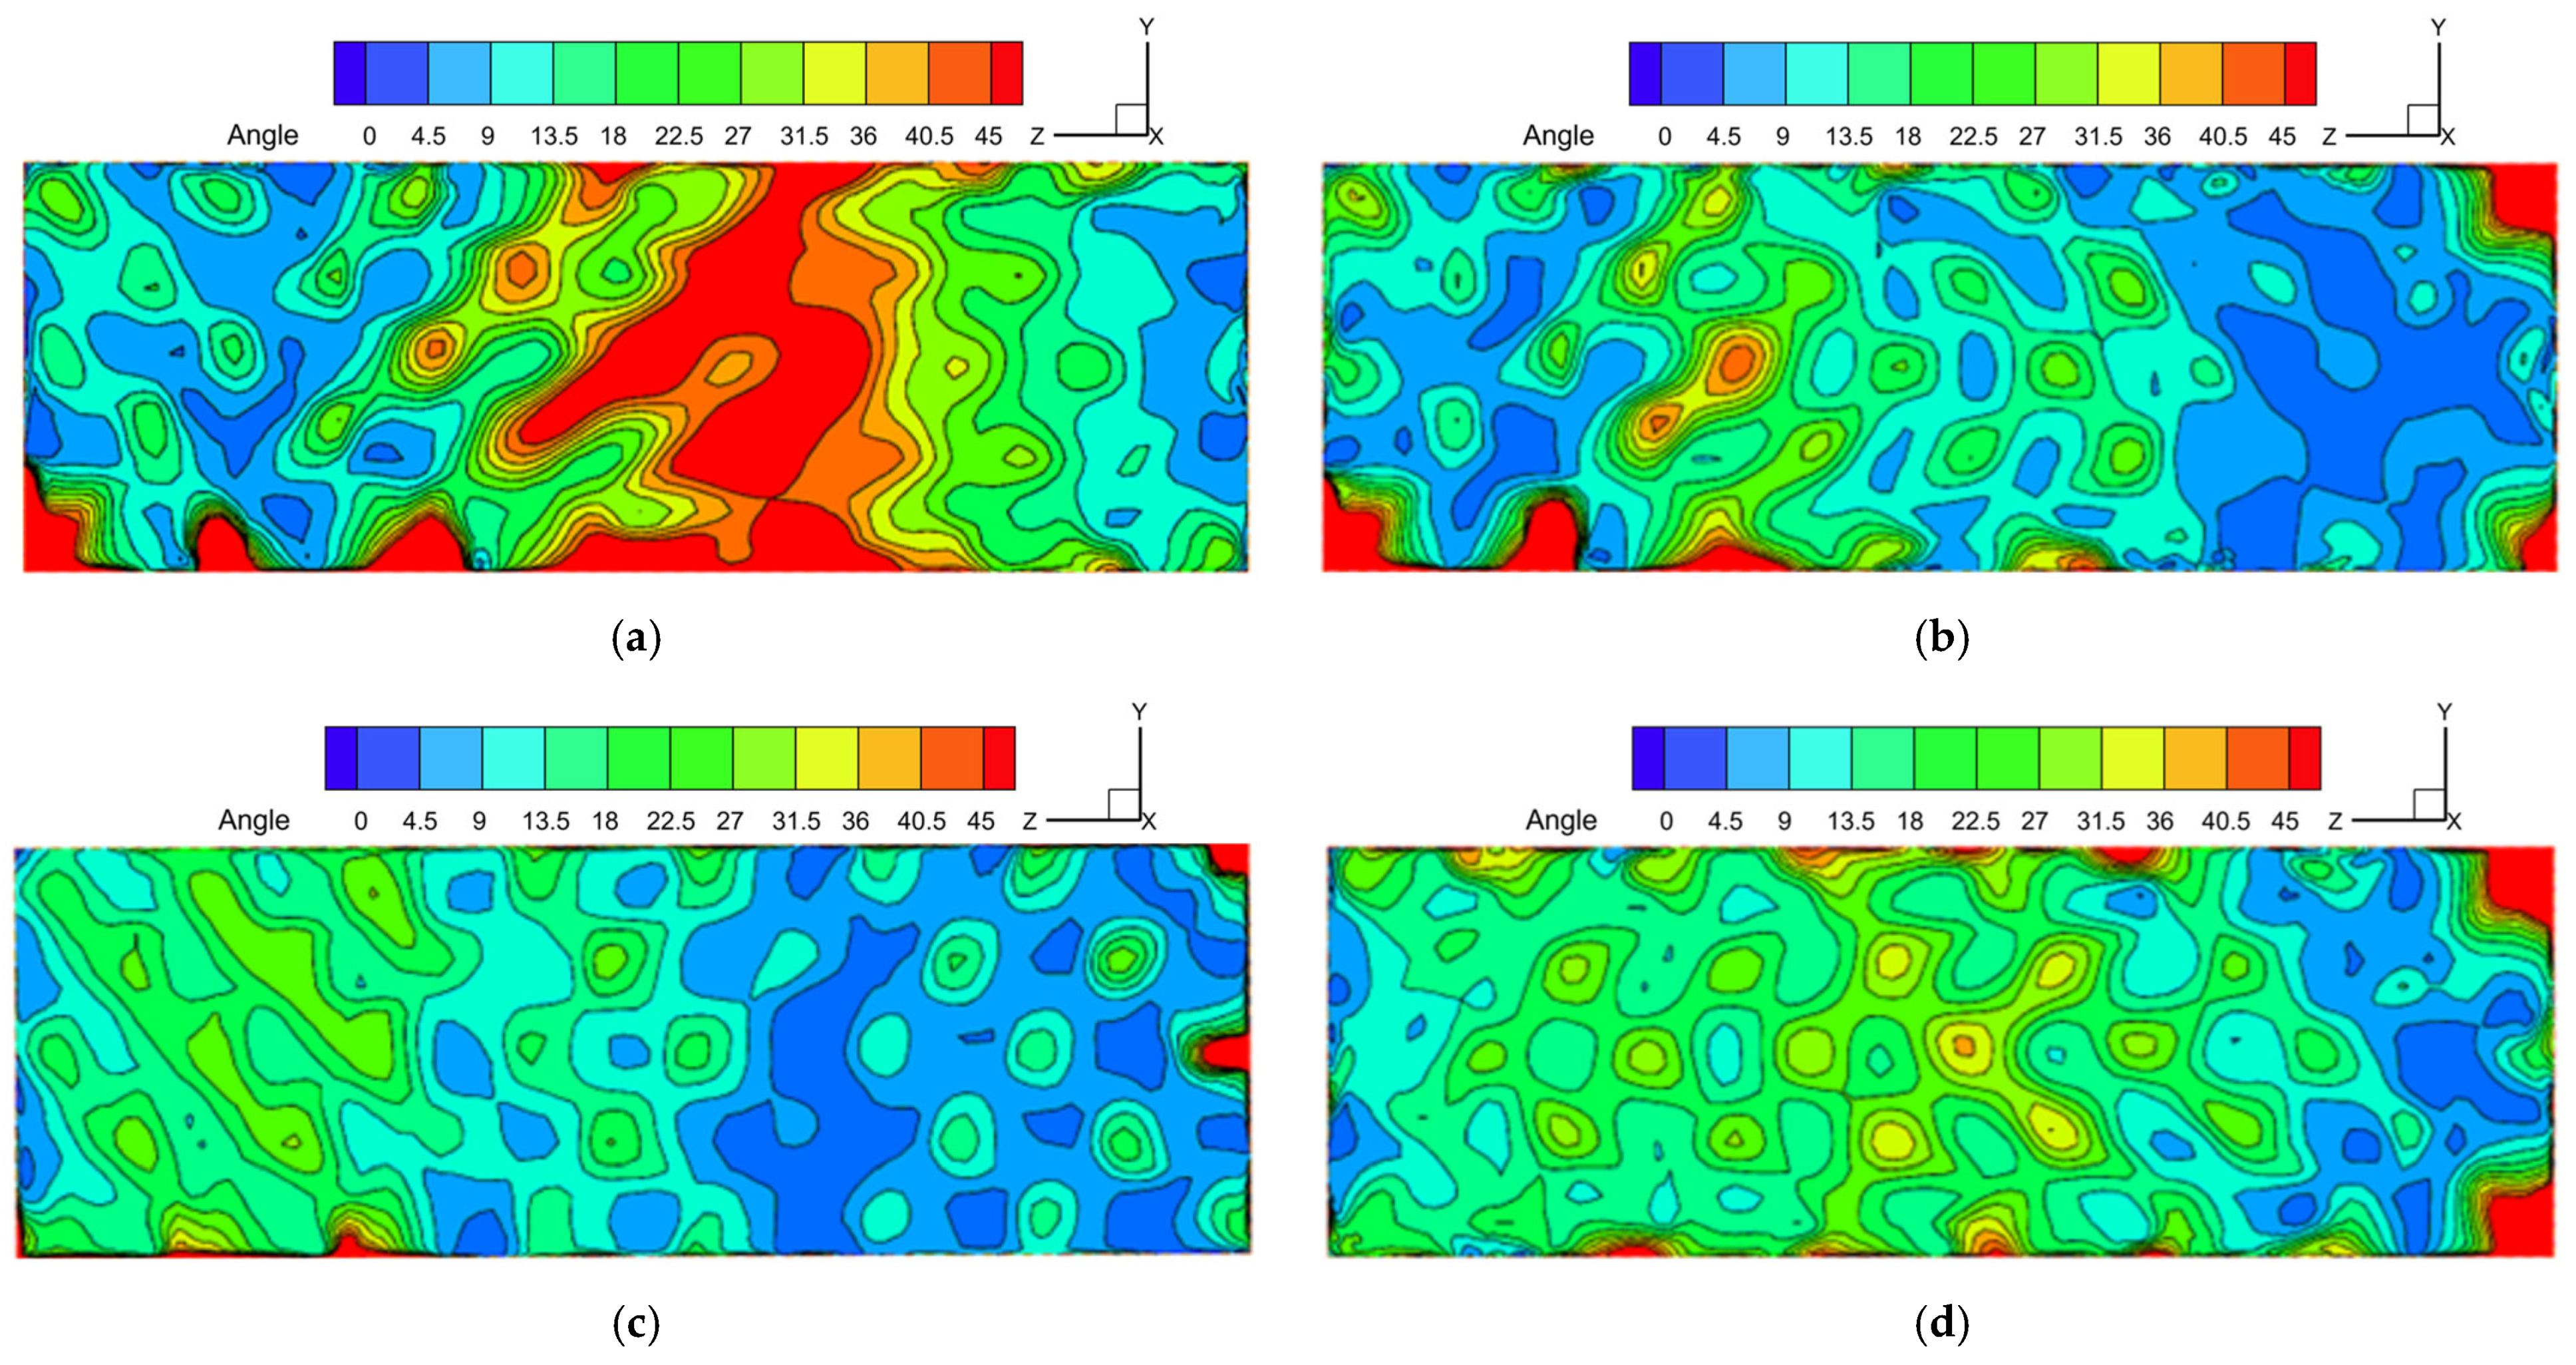
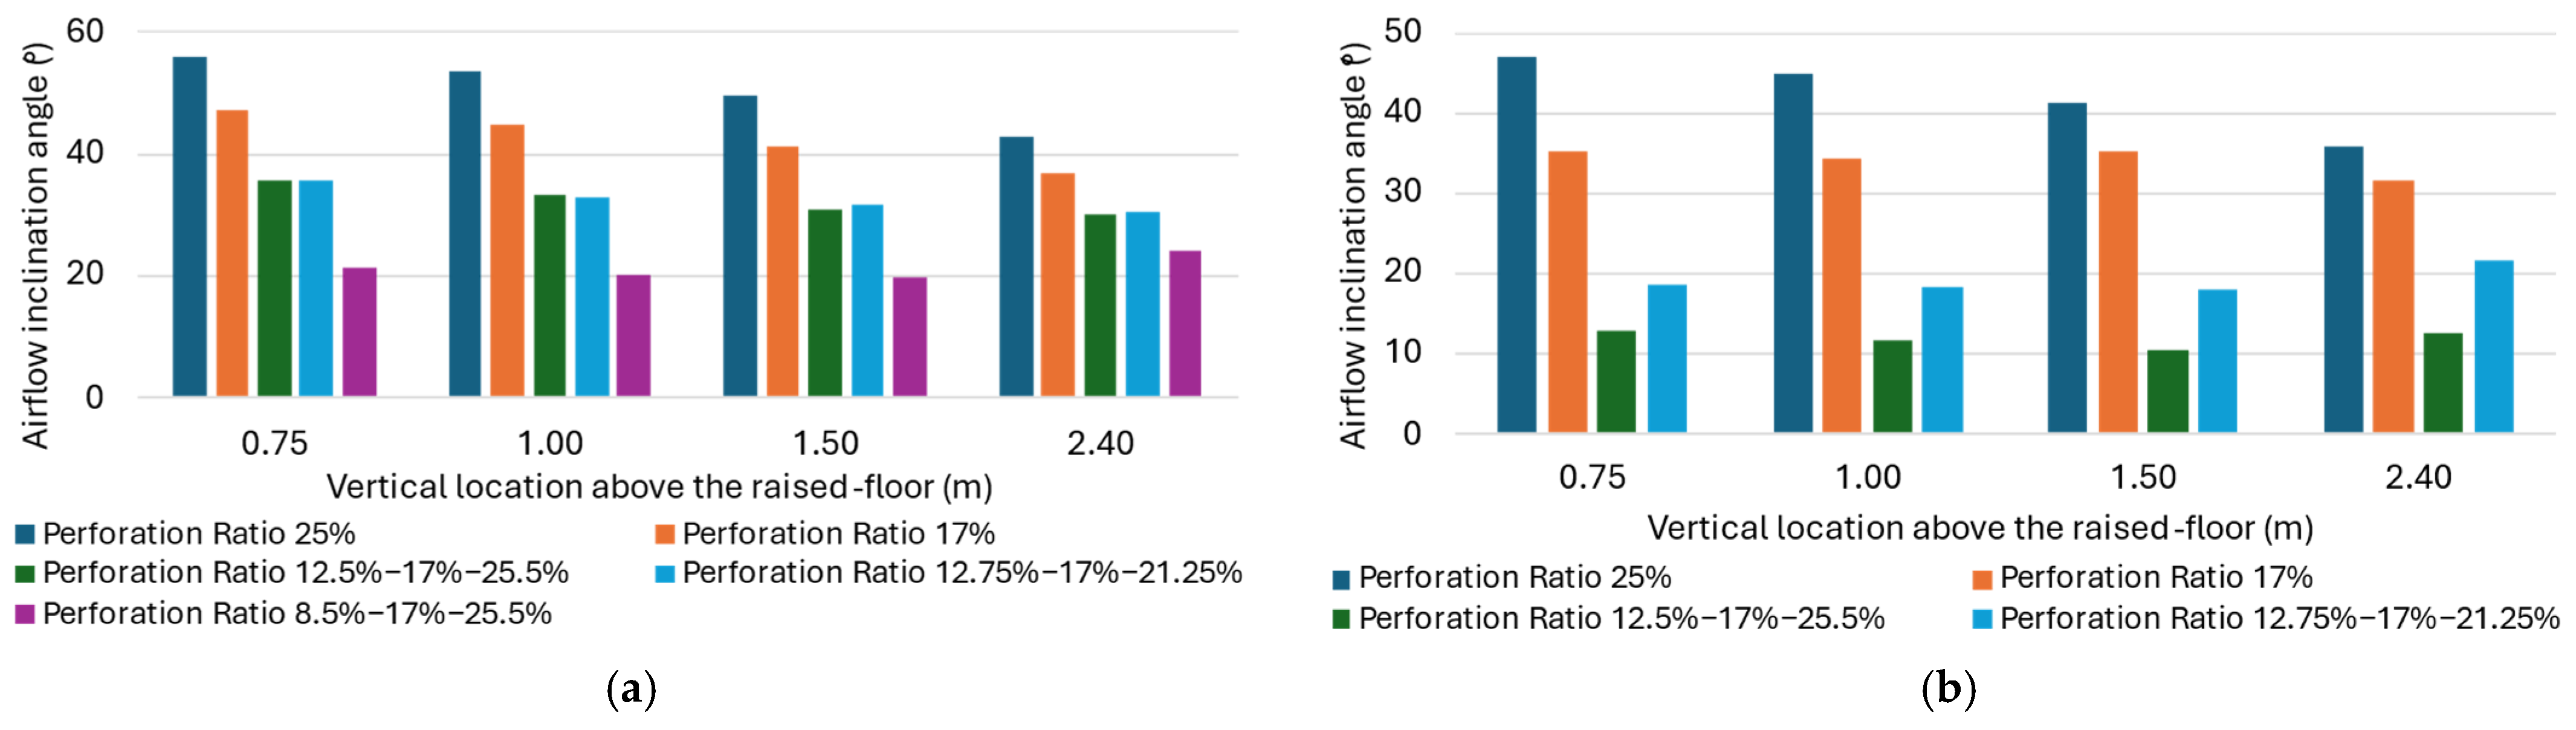
3.2. Impact of Non-Uniform Perforated Plate Opening Ratios Arrangements on Airflow

While a smaller opening ratio enhances airflow verticality by promoting uniform velocity distribution, it also increases airflow resistance, requiring additional fan power. It is interesting to investigate varying the opening ratios across the airflow direction in the lower interlayer to create a pressure gradient that optimizes airflow distribution while reducing energy demands. Furthermore, non-uniform arrangements address the inherent velocity non-uniformity in the lower interlayer caused by return air duct proximity and structural variations. To do this, a list of non-uniform arrangements was investigated including 8% → 12% → 17% (gentle gradients), 8% → 17% → 25% (steeper gradients), 12% → 17% → 21% (moderate gradients), and 12% → 17% → 25% (moderate gradients), to evaluate their impact on airflow inclination, as shown in Figure 4. Quantitative data of inclination angles of airflow are given in Table 4.
The results demonstrate that non-uniform arrangements generally outperform uniform arrangements by reducing inclination angles, particularly at lower heights above the raised floor. For example, at 0.75 m, the inclination angle for a steeper gradient 8.5% → 17% → 25.5% is 13.0°, compared to 35.2° for uniform 17% and 47.1° for 25%. This highlights the effectiveness of a steeper non-uniform gradients in enhancing vertical airflow. The results also show that moderate gradients (such as 12.5% → 17% → 25.5%) provide good improvement in verticality, maintaining inclination angles below 25° across the cleanroom. These findings show the importance of selecting an appropriate non-uniform perforation gradient. Moderate resistance variations, as in 12.5% → 17% → 25.5%, offer the best balance. These results offer guidelines for improving cleanroom performance through perforation arrangements.

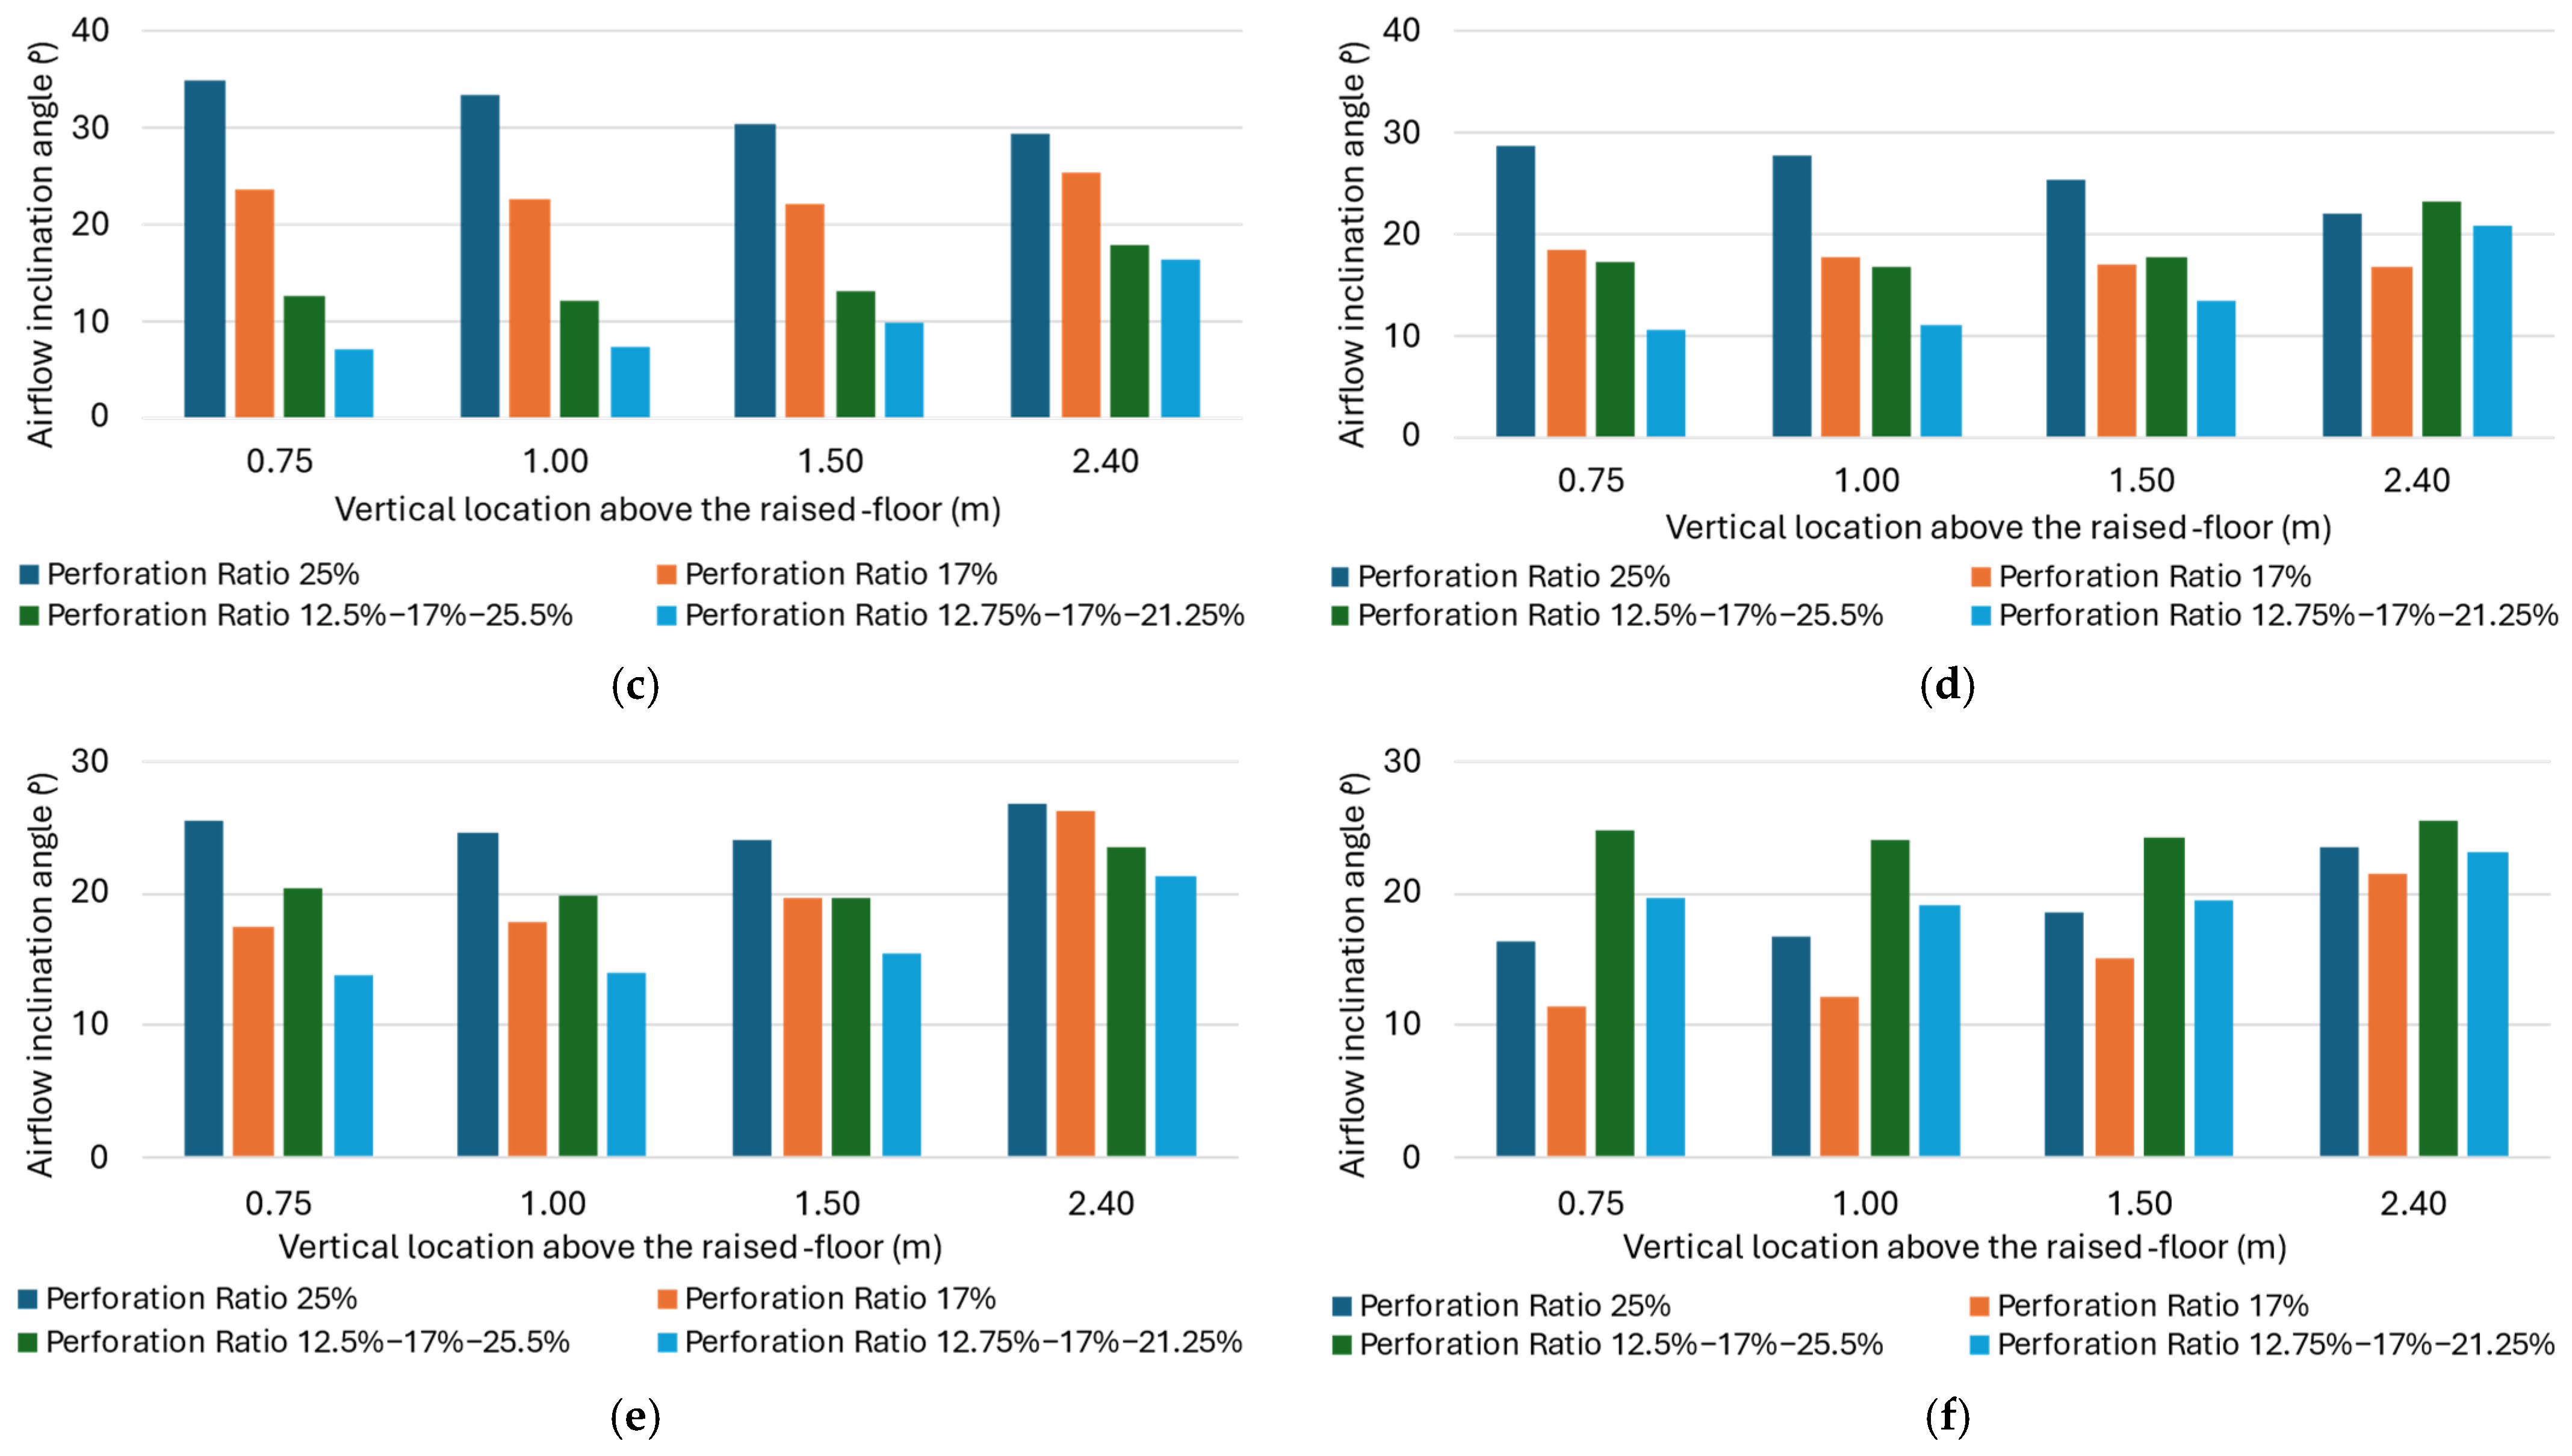
3.3. Impact of Plenum Height on Cleanroom Airflow Organization

Apart from the perforation arrangements, the height of the plenum under the raised floor plays a crucial role in determining the airflow velocity distribution and its induced effects on cleanroom airflow verticality. By analyzing the impact of varying plenum heights, the study offers cleanroom airflow optimization. Investigations have been conducted on the effects of plenum heights ranging from 0.6 m to 3.6 m on the dimensionless parameter K1 and airflow inclination angles. The study also investigates the relationship between plenum height and the perforation layouts (uniform and non-uniform). The results are shown in Figure 5 and Figure 6 and Table 5. The data show that at a low plenum height of 0.6 m, K1 values are high up to 22.9, indicating significant velocity non-uniformity. In a case of low height design, non-uniform perforation layouts, particularly those with steep gradients like 8% → 17% → 25%, show significant improvements in airflow verticality compared to uniform arrangements. With the height increases, the advantage of non-uniform perforation diminishes. For instance, at the design of 1.8 m height, K1 decreases to around 5.5, non-uniform layouts still outperform uniform designs but with diminishing benefits. This indicates that as the plenum height increases, the velocity non-uniformity in the lower interlayer lessens, reducing the reliance on complex non-uniform perforation strategies. At greater plenum heights (e.g., 2.7 m), K1 values fall below 4, and the airflow in the cleanroom becomes largely independent of the lower interlayer velocity. Under these conditions, uniform perforation layouts provide better streamline simplicity.
These findings emphasize the importance of tailoring perforation layouts based on K1 values and design of low plenum heights, with guidance summarized in Table 6.

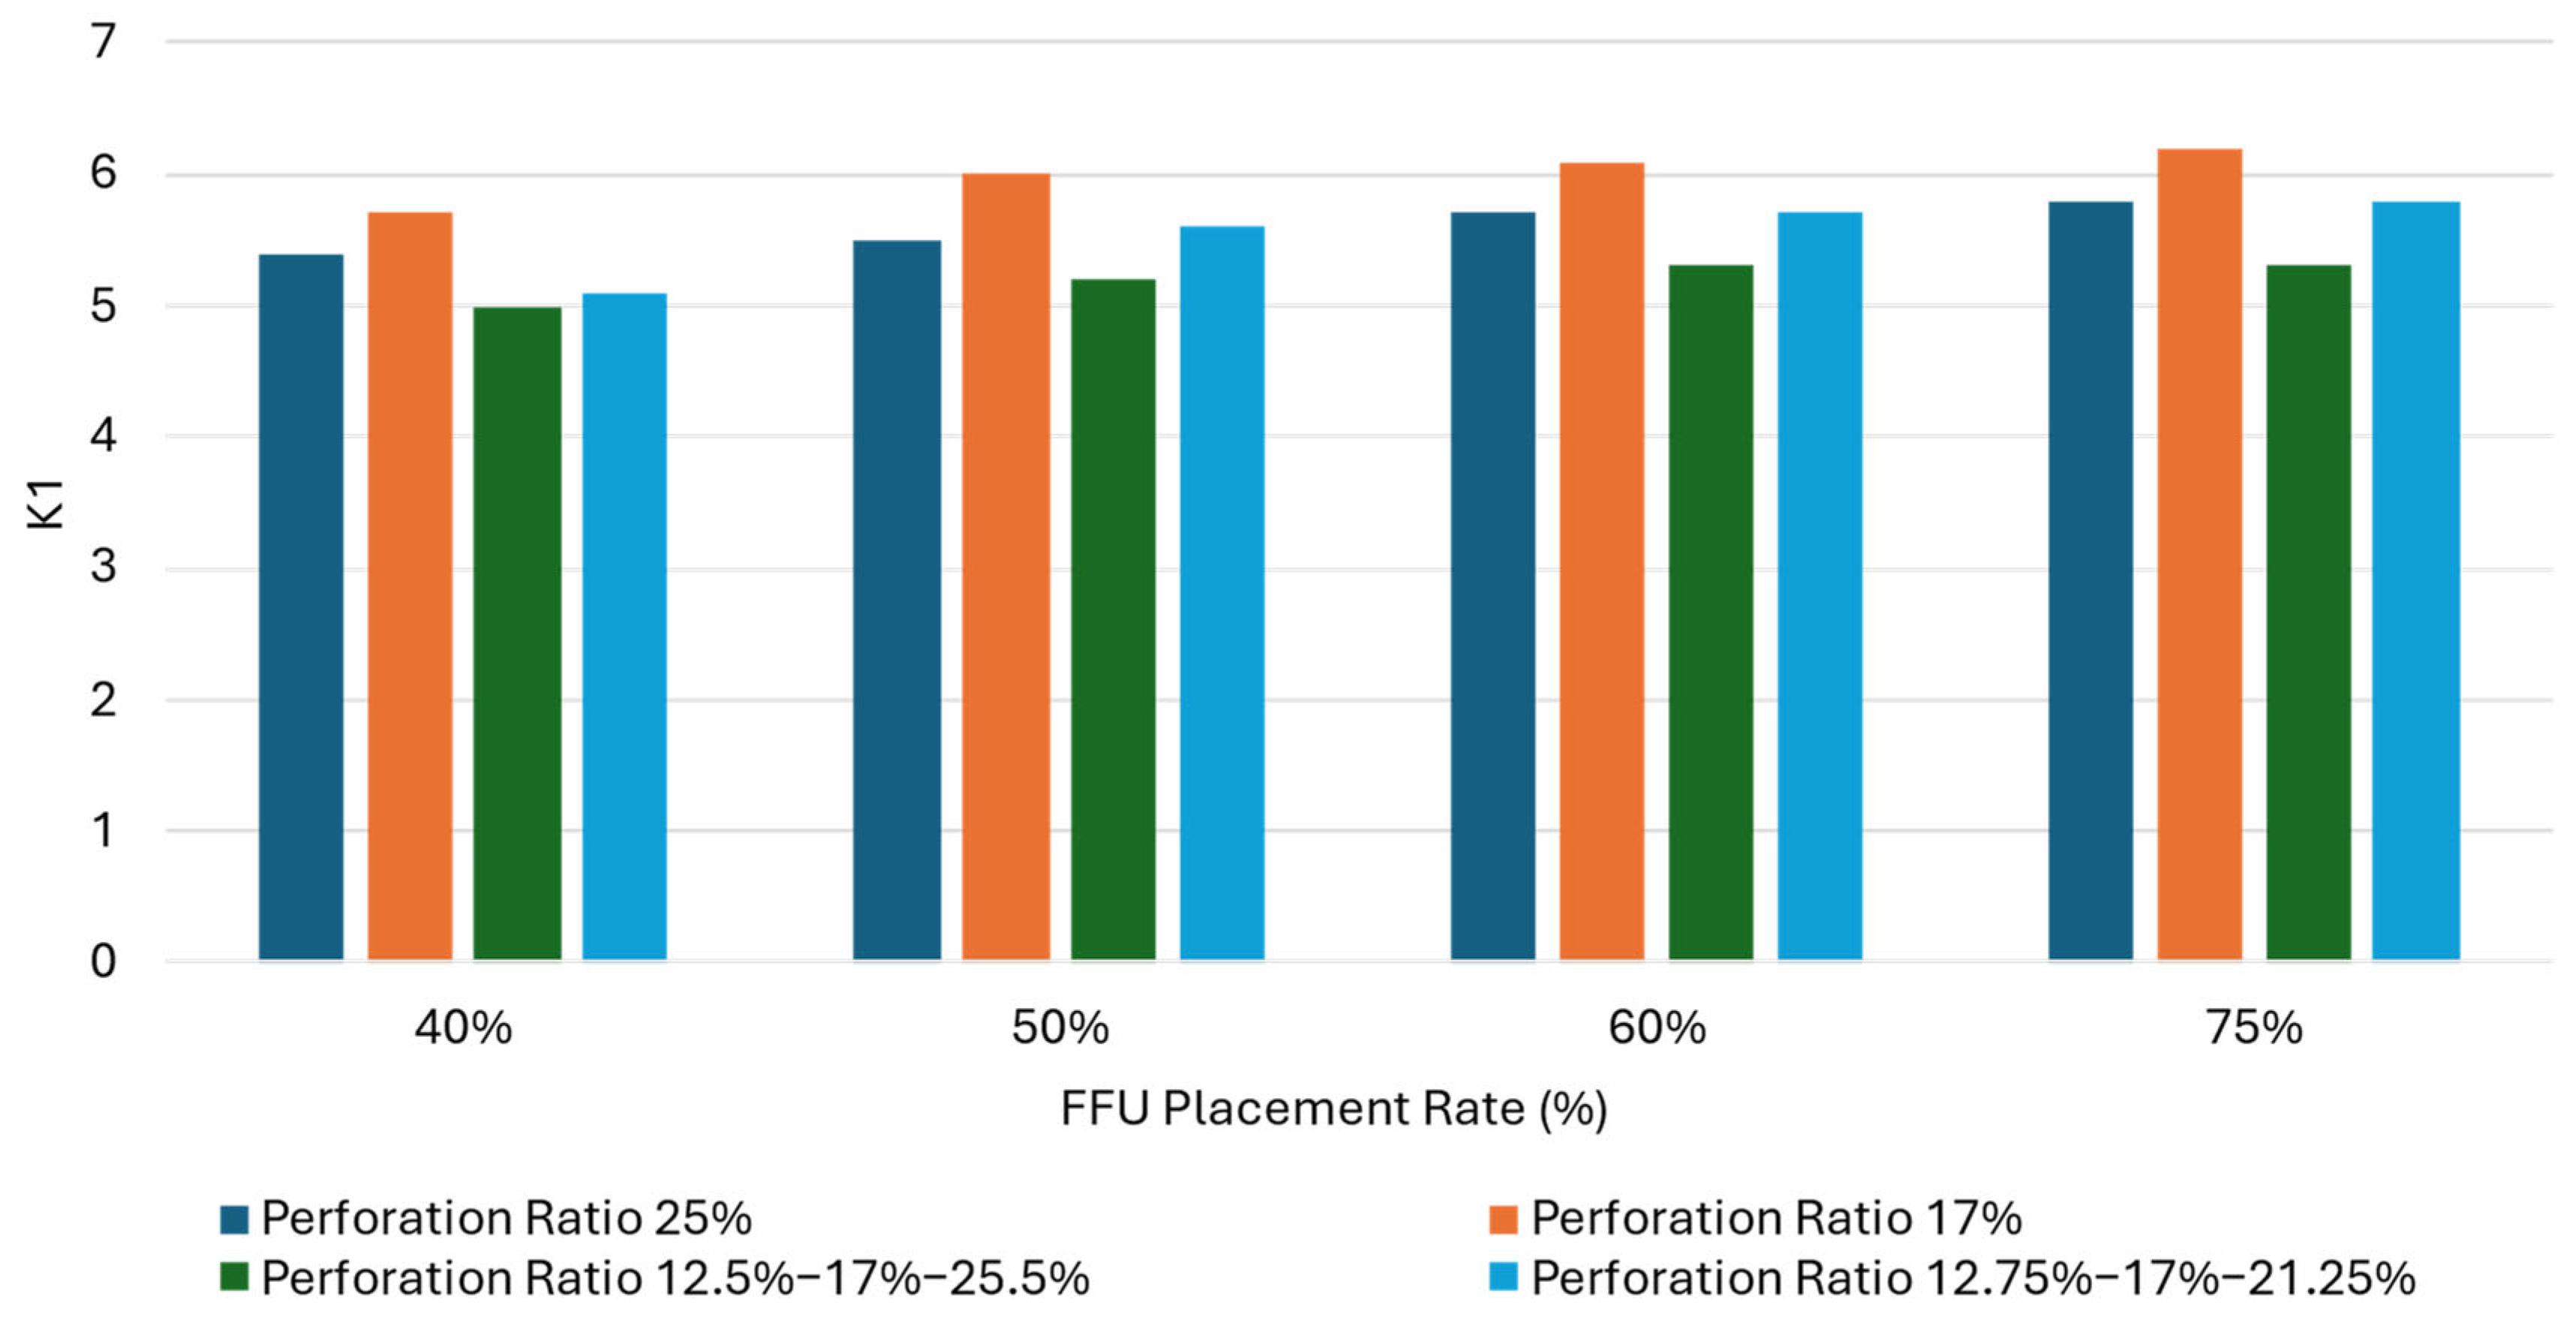
3.4. Influence of FFU Arrangement Rates on Cleanroom Airflow Organisation

The FFU arrangement rate is a critical parameter in cleanroom design, as it determines the volume and uniformity of airflow supplied to the cleanroom. Previous studies (e.g., ISO cleanroom standards) show that higher FFU layout rates enhance particle control and airflow uniformity, but they also increase energy consumption. The rate refers to the percentage of ceiling area covered by FFUs, influencing the airflow volume and distribution in the cleanroom. With the evaluation against dimensionless parameter K1, the study investigates the impact of 40%, 50%, 60%, and 75% FFU arrangement rates on airflow inclination angles. The results are as shown in Figure 7 and Figure 8 and Table 7.
At a 40% FFU layout rate, the results show that the airflow inclination angles range between 23.2° and 39.6°, with limited differences between uniform and non-uniform perforated plate arrangements. The relatively low density of FFUs results in significant velocity non-uniformity. The non-uniform perforated plate layouts, such as 8% → 17% → 25%, provide inclination angles reduction over the uniform configurations. However, the low FFU density limits the effectiveness of perforated plate arrangements in addressing airflow deflection. Increasing the FFU layout rate to 50% leads to noticeable improvements in airflow organization. The inclination angles reduce to a range of 13.9° to 26.8°, indicating enhanced airflow verticality. Non-uniform perforated plate layouts, particularly 8.5% → 17% → 25.5%, further improve verticality over uniform arrangements. At 60% FFU layout rate, the inclination angles consistently below 20° across both uniform and non-uniform perforated plate configurations. Although non-uniform layouts provide slight improvements, the difference between uniform and non-uniform configurations becomes negligible. Further increasing the FFU layout rate from 60% to 75% offers minimal changes. The analysis demonstrates that increasing the FFU layout rate significantly enhances airflow verticality. At low layout rates (40%), non-uniform perforated plates play a crucial role in mitigating velocity non-uniformity, with their impact diminishes as FFU density compensates for non-uniform airflow. The 60% can be an optimal FFU layout rate for achieving optimal airflow verticality but further energy intensity study shall be conducted.

4. Conclusions

This study addresses a critical gap in cleanroom design by focusing on the airflow inclination in cleanrooms. With evaluations on crucial factors such as perforated plate arrangements, plenum heights, and FFU layout rates, this study explores how to optimize airflow in vertical unidirectional flow cleanrooms. A new metric, the dimensionless velocity parameter K1, is also introduced to evaluate the impact of the lower interlayer airflow on verticality.
In terms of the suspended floor perforate plate design, the impact of perforation rate is critical. A lower perforation rates, such as 10%, significantly reduce airflow inclination angles and ensure better verticality, with airflow inclination values below 25°. However, lower perforation rates increase airflow resistance, which can lead to higher energy demands. For cleanrooms with significant velocity non-uniformity, where the value of K1 above 9, non-uniform perforated plate configurations (e.g., 12% → 17% → 25%) are effective in balancing airflow distribution and minimizing inclination.
In terms of the plenum heights, the variation of heights is also critical to the airflow verticality. At low plenum heights below 0.6 m, high K1 values above indicate strong airflow inclination. In this case, non-uniform perforated layouts with steep pressure gradients are necessary to mitigate these effects. Increasing the plenum height reduces the air inclination and the non-uniform perforate plate layouts remain beneficial with plenum heights of 1.3 m or less. With a significant plenum height over 2.7 m, K1 values reduce below 5, and the airflow inclination becomes negligible, where using uniform perforate is sufficient.
The FFU layout rate is also investigated with layout rate varying from 40% to 75%. With a low FFU density of 40%, airflow inclination angles range from 23.2° to 39.6°, and significant velocity non-uniformity persists. The non-uniform perforated layouts contribute to reduce inclination, but the overall effectiveness is limited. A moderate FFU density of 50% is suggested as inclination angles reducing to 13.9–26.8°. Non-uniform layouts continue to provide an edge over uniform ones by further reducing deflection. A higher FFU density of 60% achieves the best airflow organization, with inclination angles consistently below 20° with minimal differences between uniform and non-uniform layouts.

5. Limitations of Current Study and Future Works

This study analyzed airflow inclination in vertical unidirectional cleanrooms by varying perforation rate, plenum height, and FFU layout rate. While the findings provide useful guidance, several limitations remain. The CFD model assumes steady-state, incompressible flow, and uses the standard turbulence model. Radiation, buoyancy, and transient effects were not included. These assumptions simplify the simulation but may limit accuracy in dynamic or thermally active environments. Future work will consider transient simulations, advanced turbulence models, and coupled thermal analysis. In terms of validation, future works can be conducted on broader validation across healthcare or pharmaceutical cleanrooms. In terms of air flow designs, the design space explored was limited to perforation rates of 10–25%, plenum heights up to 2.7 m, and FFU layout rates between 40% and 75%. Future work can expand this scope to include novel perforated floor designs (e.g., multi-tiered plates, directional louvers) and adaptive airflow systems. In terms of operational costs, energy use and sustainability trade-offs also need further study. Lower perforation rates and taller plenums improve airflow verticality but may increase fan energy use. Future research should include fan power modelling, life-cycle assessment, and cost analysis.

Author Contributions

Z.H., C.Z. and Z.W. contributed equally to the publication of this work. The detailed contributions of authors are listed as follows. Conceptualization, Z.H., C.Z. and Z.W.; Data curation, Z.H., W.F. and G.Z.; Formal analysis, Z.H., C.Z., Z.W. and J.L.; Investigation, Z.H., T.T., Y.L., W.F., G.Z. and J.L.; Methodology, Z.H., C.Z., Z.W. and J.L.; Resources, C.Z., X.H., T.T. and Y.L.; Software, Z.H., Q.X. and X.H.; Validation, Z.H., Z.W., Q.X. and X.H.; Writing—original draft, Z.H., C.Z. and Z.W.; Writing—review and editing, C.Z. and Z.W. All authors have read and agreed to the published version of the manuscript.

Funding

This research received no external funding.

Data Availability Statement

Data will be available with reasonable request sent to the corresponding author.

Conflicts of Interest

Zonghua Huang, Qian Xiang, Xingcheng Huo, and Tingdong Tan, are employees of China Construction Third Bureau First Engineering Co., Ltd. The paper reflects the views of the authors and not the company. Yan Li, Wenmao Feng, Guitao Zhang are employees of Chengdu BOE Display Technology Co., Ltd. The paper reflects the views of the authors and not the company.

Abbreviations

The following abbreviations are used in this manuscript:
ACHAir Change Rate per Hour
CFDComputational Fluid Dynamics
DCCDry Cooling Coil
FFUFan Filter Unit
HVACHeating, Ventilation, and Air-Conditioning
ISOInternational Standard of Organization
SIMPLESemi-Implicit Method for Pressure-Linked Equation
ρ Fluid density
u Fluid velocity vector
v g The vertical velocity component
p Static pressure
τ Stress tensor
k Turbulent kinetic energy
ε Turbulent dissipation rate
μ Dynamic viscosity
μ t Turbulent viscosity
μ e f f Effective viscosity ( μ + μ t )
k e f f Effective thermal conductivity ( k + k t )
C p Specific heat capacity at constant pressure
T Temperature
g Gravitational acceleration
S m Mass source term
S h Heat source term
G k Turbulent kinetic energy production term
σ k Turbulent Prandtl number for k
σ ε Turbulent Prandtl number for ε
C μ , C 1 , C 2 Empirical constants in turbulence models
θ The inclination angle of the airflow streamline from the vertical direction

References

  1. Al Beltagy, M.; El Morsi, M.; El Baz, A.; El Assy, A. Simulation of Radiant Cooling Systems in Cleanroom Applications Using Computational Fluid Dynamics. ASHRAE Trans. 2019, 61, 55–66. [Google Scholar]
  2. Jo, M.S.; Shin, J.H.; Kim, W.J.; Jeong, J.W. Energy-Saving Benefits of Adiabatic Humidification in the Air Conditioning Systems of Semiconductor Cleanrooms. Energies 2017, 10, 1774. [Google Scholar] [CrossRef]
  3. He, X.; Karra, S.; Pakseresht, P.; Apte, S.V.; Elghobashi, S. Effect of Heated-Air Blanket on the Dispersion of Squames in an Operating Room. Int. J. Numer. Methods Biomed. Eng. 2018, 34, e2960. [Google Scholar] [CrossRef] [PubMed]
  4. Yamaguchi, T.; Kaga, A.; Kondo, A. Prediction Technique for Pressure Change in Rooms by Using an Equivalent Circuit Network. J. Environ. Eng. 2010, 5, 444–455. [Google Scholar] [CrossRef]
  5. Su, C.L.; Yu, K.T. Evaluation of Differential Pressure Setpoint of Chilled Water Pumps in Cleanroom HVAC Systems for Energy Savings in High-Tech Industries. In Proceedings of the 48th IEEE Industrial & Commercial Power Systems Conference, Louisville, KY, USA, 20–24 May 2012; IEEE: Piscataway, NJ, USA, 2012; pp. 1–9. [Google Scholar] [CrossRef]
  6. Yang, C.; Yang, X.; Zhao, B. The ventilation needed to control thermal plume and particle dispersion from manikins in a unidirectional ventilated protective isolation room. In Building Simulation; Springer: Berlin/Heidelberg, Germany, 2015; Volume 8, pp. 551–565. [Google Scholar] [CrossRef]
  7. Wang, Y.; Li, Y.; Zhou, L. Pressure Gradient Control and Energy-Saving Operation Strategy Study on a Multi-Zone Cleanroom. Procedia Eng. 2015, 121, 1998–2005. [Google Scholar] [CrossRef]
  8. Loomans, M.G.L.C.; Molenaar, P.C.A.; Kort, H.S.M.; Joosten, P.H. Energy Demand Reduction in Pharmaceutical Cleanrooms through Optimization of Ventilation. Energy Build. 2019, 202, 109346. [Google Scholar] [CrossRef]
  9. ISO 14644-1:2015; Cleanrooms and Associated Controlled Environments—Part 1: Classification of Air Cleanliness by Particle Concentration. International Organization for Standardization: Geneva, Switzerland, 2015.
  10. Lin, T.; Hu, S.C.; Xu, T. Developing an Innovative Fan Dry Coil Unit (FDCU) Return System To Improve Energy Efficiency of Environmental Control for Mission Critical Cleanrooms. Energy Build. 2015, 90, 94–105. [Google Scholar] [CrossRef]
  11. Lin, T.; Tung, Y.C.; Hu, S.C.; Lin, C.Y. Effects of the Removal of 0.1 µm Particles in Industrial Cleanrooms with a Fan Dry Coil Unit (FDCU) Return System. Aerosol Air Qual. Res. 2010, 10, 571–580. [Google Scholar] [CrossRef]
  12. Li, H.; Huang, C.; Yi, W.; Li, C. Analysis and Experiments on the Characteristics of Airflow and the Air Cleanliness Protection Region under Fan Filter Units in Cleanrooms. Sustainability 2023, 15, 13268. [Google Scholar] [CrossRef]
  13. Permana, I.; Agharid, A.P.; Singh, N.; Wang, F. Full-Scale Evaluation of FFU Configurations in an Optical Cleanroom Injection Molding for Improving Thermal Performance and Contaminant Removal. Case Stud. Therm. Eng. 2024, 61, 105076. [Google Scholar] [CrossRef]
  14. Bhattacharya, A.; Tak, M.S.N.; Shoai-Naini, S.; Betz, F.; Mousavi, E. A Systematic Literature Review of Cleanroom Ventilation and Air Distribution Systems. Aerosol Air Qual. Res. 2023, 23, 220407. [Google Scholar] [CrossRef]
  15. Eslami, J.; Abbassi, A.; Saidi, M.H.; Bahrami, M. Effect of Supply/Exhaust Diffuser Configurations on the Contaminant Distribution in Ultra Clean Environments: Eulerian and Lagrangian Approaches. Energy Build. 2016, 127, 648–657. [Google Scholar] [CrossRef]
  16. Metwally, H.E.; Khalil, E.E.; Abou Dief, T.E.; AbouZeid, A.E. Air Quality and Flow Regimes at Clean Rooms. In Proceedings of the 2018 Joint Thermophysics and Heat Transfer Conference, Atlanta, GA, USA, 25–29 June 2018; p. 3908. [Google Scholar] [CrossRef]
  17. Khoo, C.Y.; Lee, C.C.; Hu, S.C. An Experimental Study on the Influences of Air Change Rate and Free Area Ratio of Raised-Floor on Cleanroom Particle Concentrations. Build. Environ. 2012, 48, 84–88. [Google Scholar] [CrossRef]
  18. Permana, I.; Agharid, A.P.; Wang, F. Performance Improvement through CFD and Field Measurement in a Unidirectional Airflow Cleanroom for Wafer Manufacture. J. Build. Eng. 2024, 100, 111715. [Google Scholar] [CrossRef]
  19. Sofia, D.; Lotrecchiano, N.; Giuliano, A.; Barletta, D.; Poletto, M. Optimization of Number and Location of Sampling Points of an Air Quality Monitoring Network in an Urban Contest. Chem. Eng. Trans. 2019, 74, 277–282. [Google Scholar] [CrossRef]
  20. Alfonsi, G. Reynolds-Averaged Navier–Stokes Equations for Turbulence Modeling. Appl. Mech. Rev. 2009, 62, 040802. [Google Scholar] [CrossRef]
Figure 1. Schematic diagrams of the modelling cleanroom (a) representation and (b) dimensions.
Atmosphere 16 00632 g001
Figure 2. Airflow velocity contour and flow direction diagram for the varying perforated plate opening ratios from 25% (a,b), to 17% (c,d), through to 10% (e,f).
Atmosphere 16 00632 g002
Figure 3. The dimensionless parameter K1 with respect to the varying perforation opening ratio (a) 25%, (b) 17%, and (c) 10%.
Atmosphere 16 00632 g003
Figure 4. Airflow declination angle above the 0.75 m of non-uniform perforated plate opening ratio arrangements with (a) 8.5% → 12.5% → 17% (gentle gradients), (b) 8.5% → 17% → 25.5% (steeper gradients), (c) 12.75% → 17% → 21.25% (moderate gradients), and (d) 12.5% → 17% → 25.5% (moderate gradients).
Atmosphere 16 00632 g004
Figure 5. Effect of the varying plenum heights and perforation ratios on K1.
Atmosphere 16 00632 g005
Figure 6. Airflow inclination at different vertical locations with varying plenum height of (a) 0.6 m, (b) 0.9 m, (c) 1.3 m, (d) 1.5 m, (e) 1.8 m, and (f) 2.7 m.
Atmosphere 16 00632 g006aAtmosphere 16 00632 g006b
Figure 7. Effect of different FFU placement rates and perforation ratios on K.
Atmosphere 16 00632 g007
Figure 8. Airflow inclination angle with varying FFU placement rates of (a) 40%, (b) 50%, (c) 60%, and (d) 75%.
Atmosphere 16 00632 g008
Table 1. Conditions used for model validation.
ParameterTypeDimensionsValue
Supply Air (FFU)Velocity InletUnit area:
1200 mm × 600 mm
Temperature: 23 °C
Velocity: 2.76 m/s
FFU Arrangement Rate: 60%
Return AirPressure OutletUnit area:
600 mm × 600 mm
Temperature: 26 °C
Pressure: 25 Pa
Perforated FloorUniformly PerforatedUnit area:
600 mm × 600 mm
Perforated Ratio: 25%
Raised FloorWallHeight: 600 mm-
Table 2. Experiment measurement comparing to simulation data.
Measurement Point 1Measurement Point 2Measurement Point 3Measurement Point 4Measurement Point 5NRMSE
Experimental airflow velocity (m/s)2.562.512.512.392.11-
Simulation airflow velocity (m/s)2.742.672.522.352.16-
RMSE7.0%6.4%0.4%1.7%2.4%4.4%
Table 3. Airflow inclination angle in relation to the varying perforation opening ratio.
Perforation Opening RatioAirflow Inclination Angle at the Vertical Location Above the Elevated Floor (m)
0.75 m1 m1.5 m2.4 m
25%47.1°45.0°41.3°35.9°
17%35.2°34.2°35.2°31.6°
10%19.2°18.7°19.4°26.4°
Table 4. Airflow inclination angles at different non-uniform perforation rates.
Non-Uniform Perforated Plate Opening RatioAirflow Inclination Angle at the Vertical Location Above the Elevated Floor (m)
0.75 m1 m1.5 m2.4 m
8% → 12% → 17% (Gentle gradients)25.0°23.9°22.9°25.8°
8% → 17% → 25% (Steeper gradients)14.8°14.8°15.9°21.3°
12% → 17% → 25% (Moderate gradients)13.0°11.5°10.4°12.6°
12% → 17% → 21% (Moderate gradients)18.6°18.0°17.7°23.9°
Table 5. Airflow inclination angles at different vertical height above the floor with varying plenum heights.
Plenum Height (m)Perforation Opening RatioAirflow Inclination Angle at the Vertical Location Above the Elevated FloorK1
0.75 m1.0 m1.5 m2.4 m
0.625%56.1°53.6°49.4°42.9°15.6
17%47.2°44.9°41.4°36.8°19.6
12% → 17% → 25%35.3°33.4°31.0°29.9°22.9
12% → 17% → 21%35.7°33.9°31.7°30.5°19.3
8% → 17% → 25%21.1°20.2°19.6°24.2°24.5
0.925%47.1°45.0°41.3°35.9°11.4
17%35.2°34.2°35.2°31.6°13.8
12% → 17% → 25%12.9°11.5°10.4°12.6°14.0
12% → 17% → 21%18.5°18.3°18.1°21.5°16.2
1.325%34.8°33.3°30.4°29.3°8.2
17%23.5°22.7°22.2°25.3°9.4
12% → 17% → 25%12.5°12.0°13.1°17.9°8.4
12% → 17% → 21%7.1°7.2°9.8°16.3°9.4
1.525%28.7°27.6°25.3°22.0°6.9
17%18.3°17.8°16.9°16.8°7.6
12% → 17% → 25%17.3°16.8°17.6°23.1°6.9
12% → 17% → 21%10.5°10.9°13.3°20.9°7.5
1.825%25.5°24.7°24.1°26.8°5.5
17%17.5°17.9°19.7°26.2°6.0
12% → 17% → 25%20.4°19.8°19.6°23.6°5.2
12% → 17% → 21%13.9°14.0°15.5°21.3°5.6
2.725%16.4°16.8°18.5°23.6°4.0
17%11.4°12.1°15.1°21.6°4.0
12% → 17% → 25%24.8°24.0°24.2°25.6°3.3
12% → 17% → 21%19.6°19.1°19.5°23.2°3.6
Table 6. Design suggestions according to plenum heights and K1.
Plenum HeightsK1Design Suggestions
0.6 m (low)≥9Use non-uniform perforation layouts with steep pressure gradients, such as 8.5%–17%–25.5%, to manage high velocity gradients and reduce airflow inclination. These layouts are essential to counteract the strong induced effects from the lower interlayer.
1.3 m (medium)5–9Non-uniform layouts remain effective but are less critical as the interlayer velocity becomes more balanced. Both non-uniform arrangements and uniform plates with lower perforation rates can achieve acceptable verticality.
2.7 m–3.6 m (high)≤5Uniform perforation layouts are sufficient and preferred. At these heights, airflow from the lower interlayer has minimal impact on cleanroom verticality, and uniform layouts ensure simplicity and energy efficiency without compromising performance.
Table 7. Airflow inclination angles at different vertical height above the floor under various FFU arrangement rates.
FFU Arrangement Rates (%)Perforation Opening RatioAirflow Inclination Angle at the Vertical Location Above the Elevated FloorK1
0.75 m1.0 m1.5 m2.4 m
4025%34.9°34.7°34.6°38.9°5.4
17%30.7°30.9°31.7°38.6°5.7
12% → 17% → 25%27.9°28.28°29.5°38.3°5.0
12% → 17% → 21%23.2°24.6°28.9°39.6°5.1
5025%25.5°24.7°24.1°26.8°5.5
17%17.5°17.9°19.7°26.2°6.0
12% → 17% → 25%20.4°19.8°19.6°23.6°5.2
12% → 17% → 21%13.9°14.0°15.5°21.3°5.6
6025%24.8°23.7°22.1°21.7°5.7
17%15.6°15.1°15.1°19.3°6.1
12% → 17% → 25%19.2°18.3°17.5°18.4°5.3
12% → 17% → 21%13.1°12.6°12.9°15.9°5.7
7525%24.0°23.0°21.1°19.9°5.8
17%14.7°14.4°14.2°16.0°6.2
12% → 17% → 25%18.7°17.8°16.6°16.6°5.3
12% → 17% → 21%12.5°12.1°12.0°13.6°5.8
Disclaimer/Publisher’s Note: The statements, opinions and data contained in all publications are solely those of the individual author(s) and contributor(s) and not of MDPI and/or the editor(s). MDPI and/or the editor(s) disclaim responsibility for any injury to people or property resulting from any ideas, methods, instructions or products referred to in the content.

