Revealing Emission Patterns of Urban Traffic Flows: A Complex Network Theory Perspective
Abstract
1. Introduction
2. Methodologies
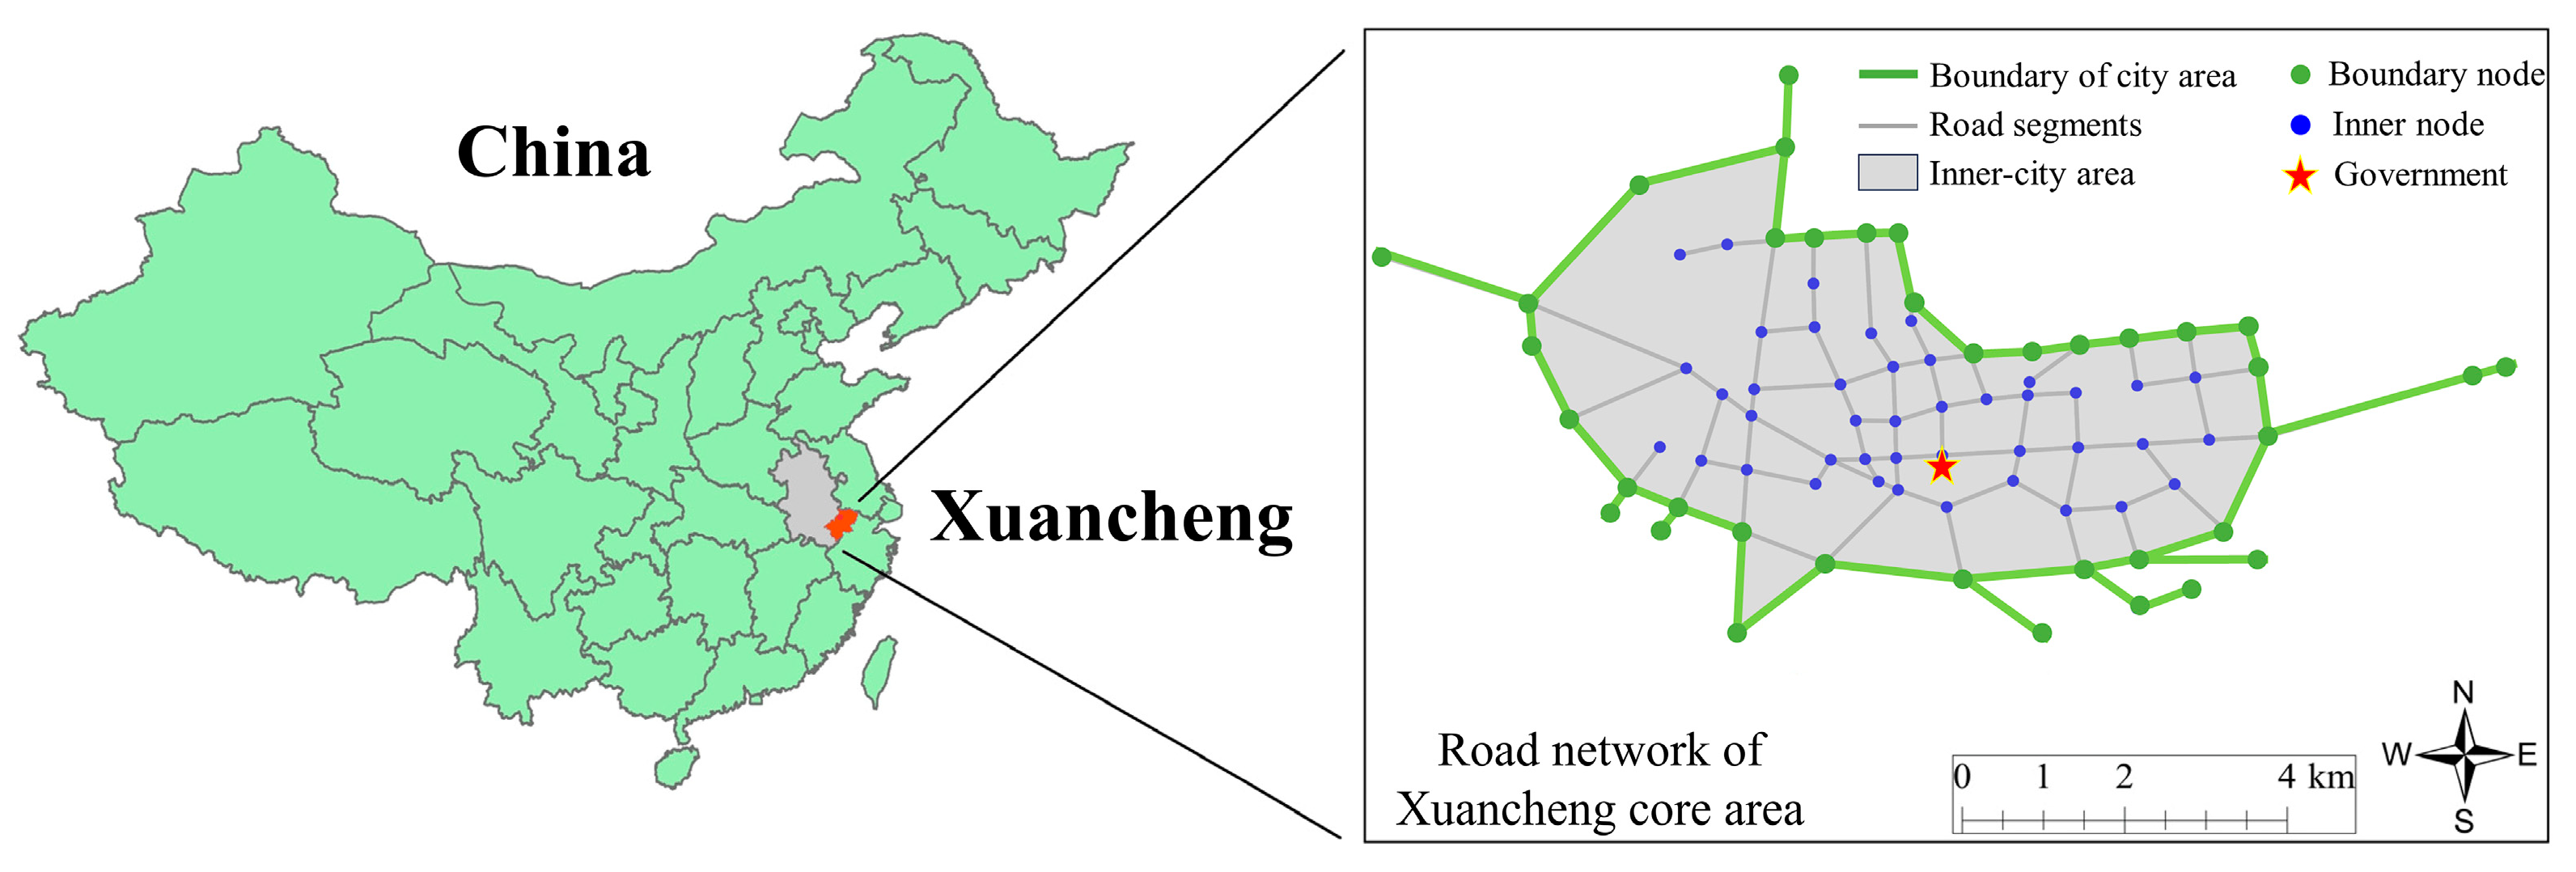
2.1. Study Area and Data Sources
2.2. Vehicle Travel Data Extraction
2.3. Emission Quantification
2.4. Modeling and Characteristic Indicators of the UTEFN
2.4.1. Characteristic Indicators of the UTEFN
- (1)
- Network establishment and edge weight quantification
- (2)
- Node weighted degree
- (3)
- Scaling law of distribution
2.4.2. Structural Indicators of the UTEFN
- (1)
- Global structural indicators
- (2)
- Community structure detection
3. Emission Characteristics
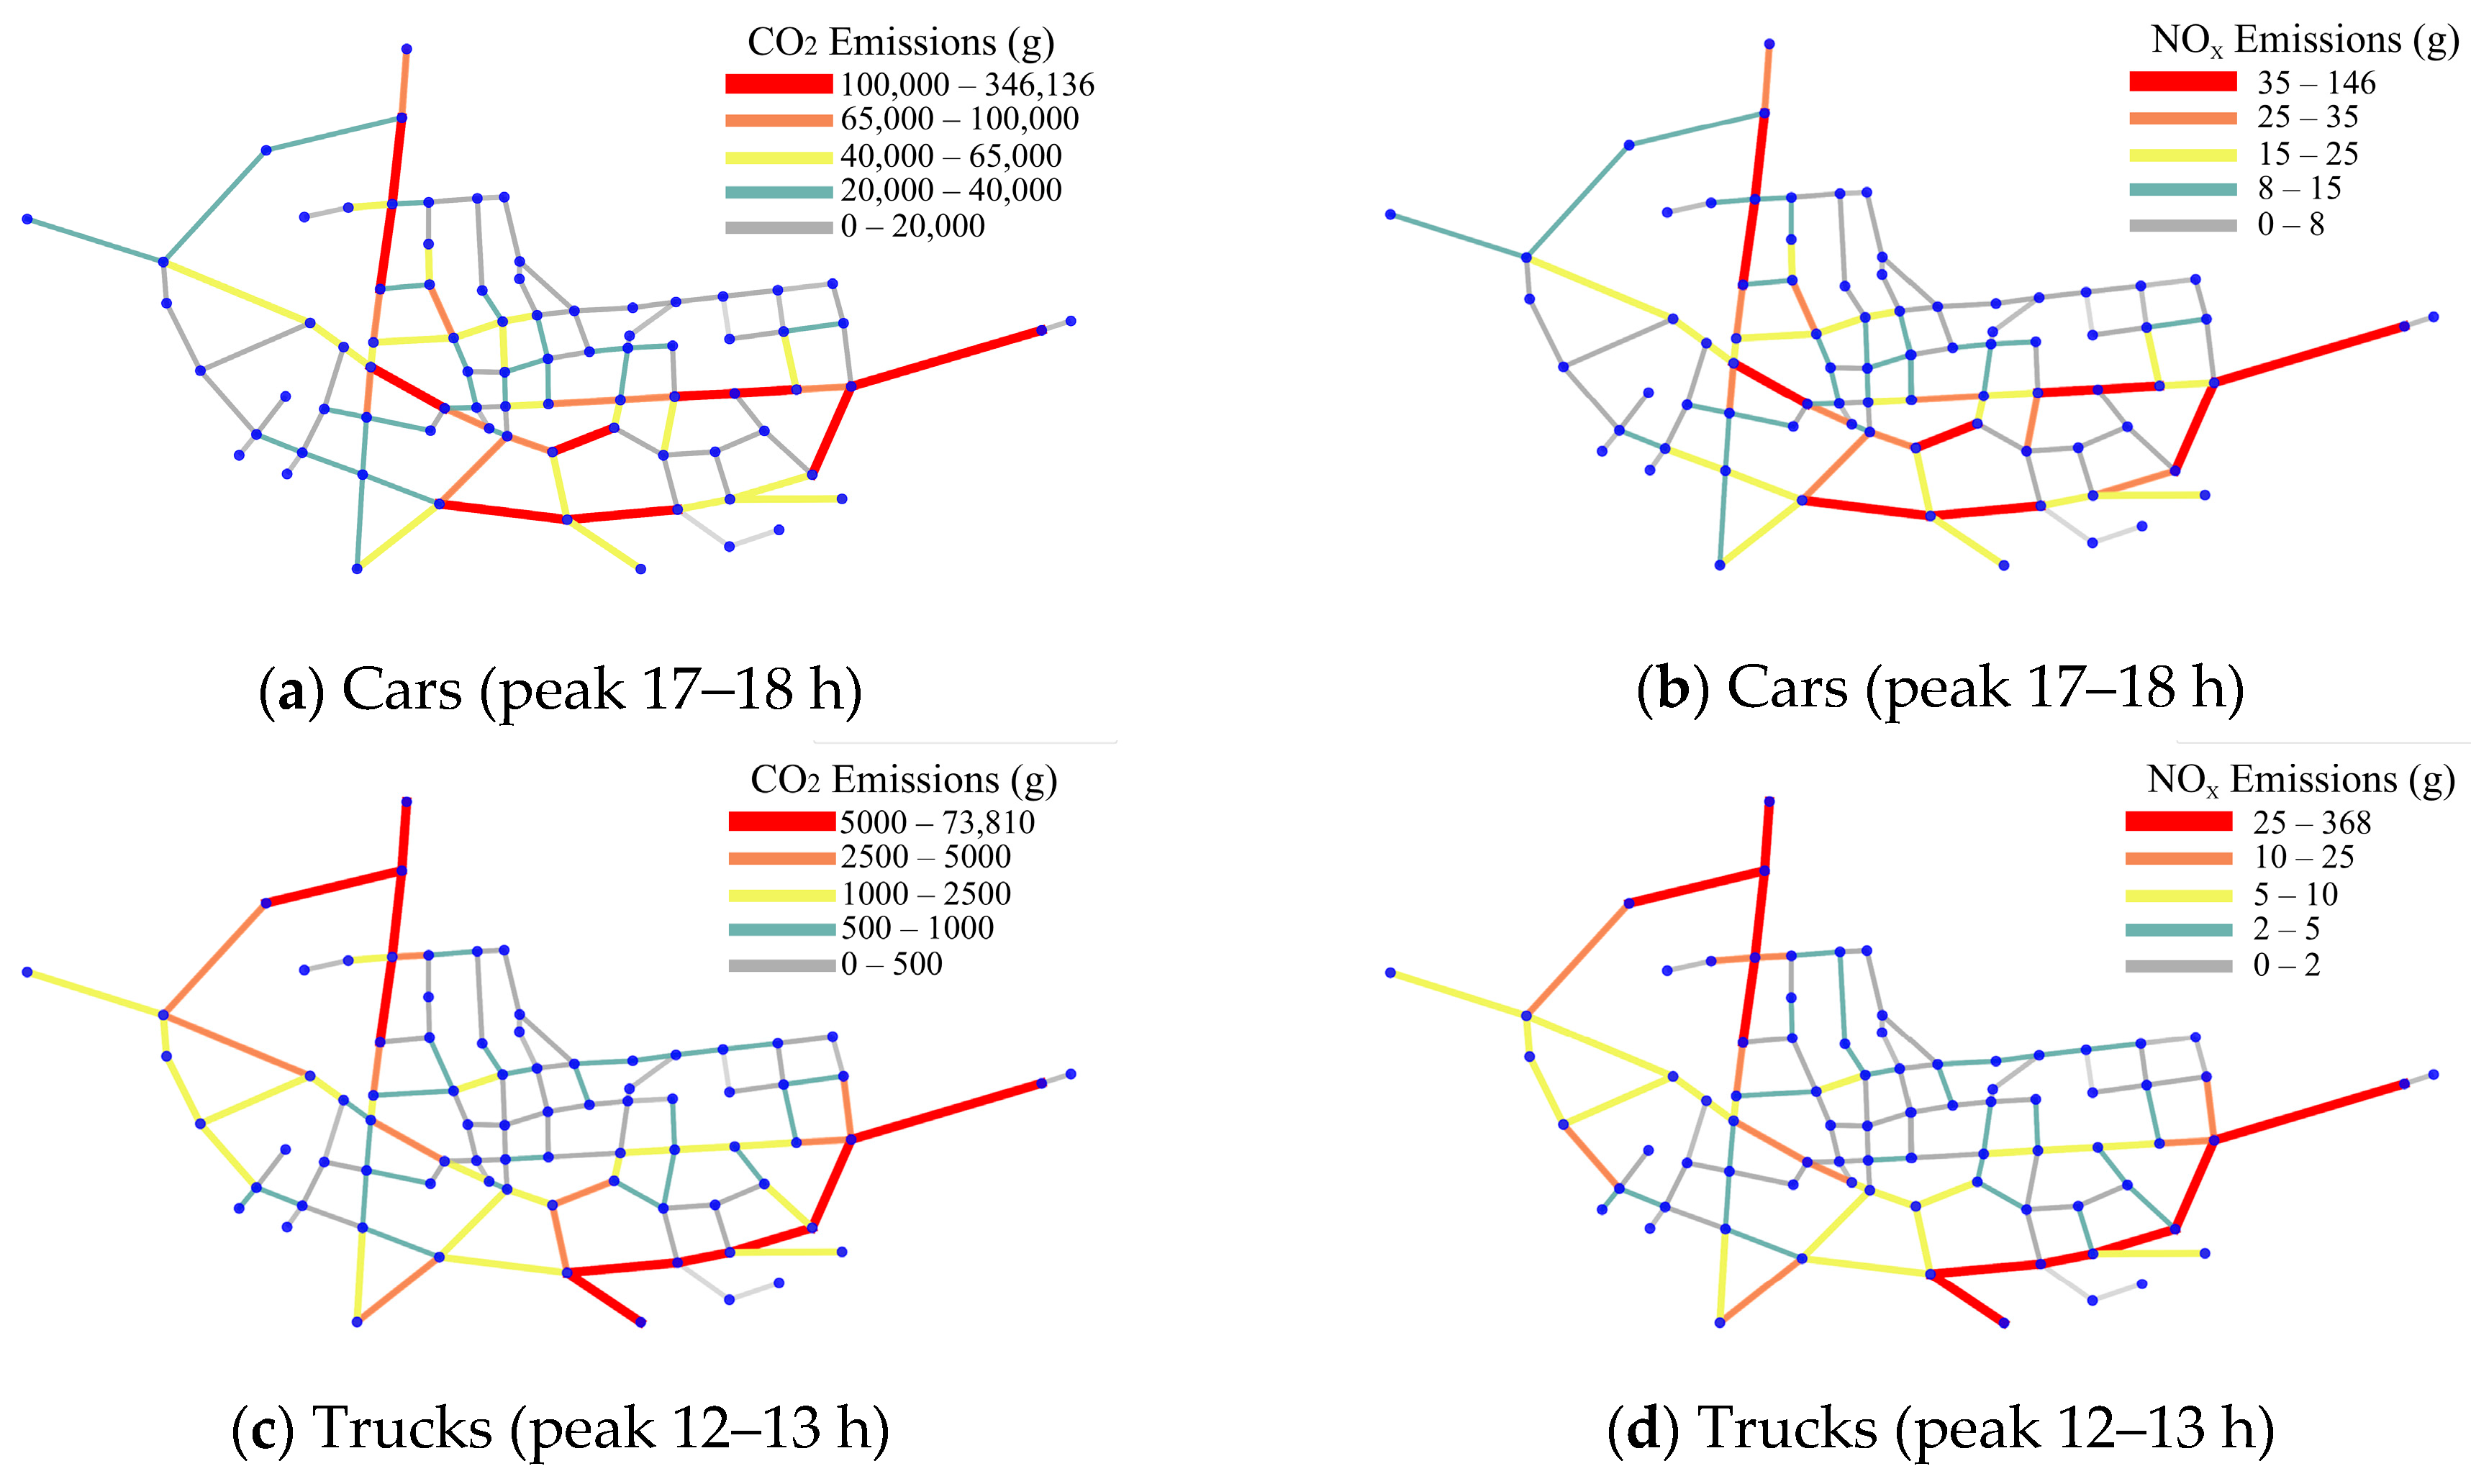
3.1. Emission Characteristics of On-Road Vehicles
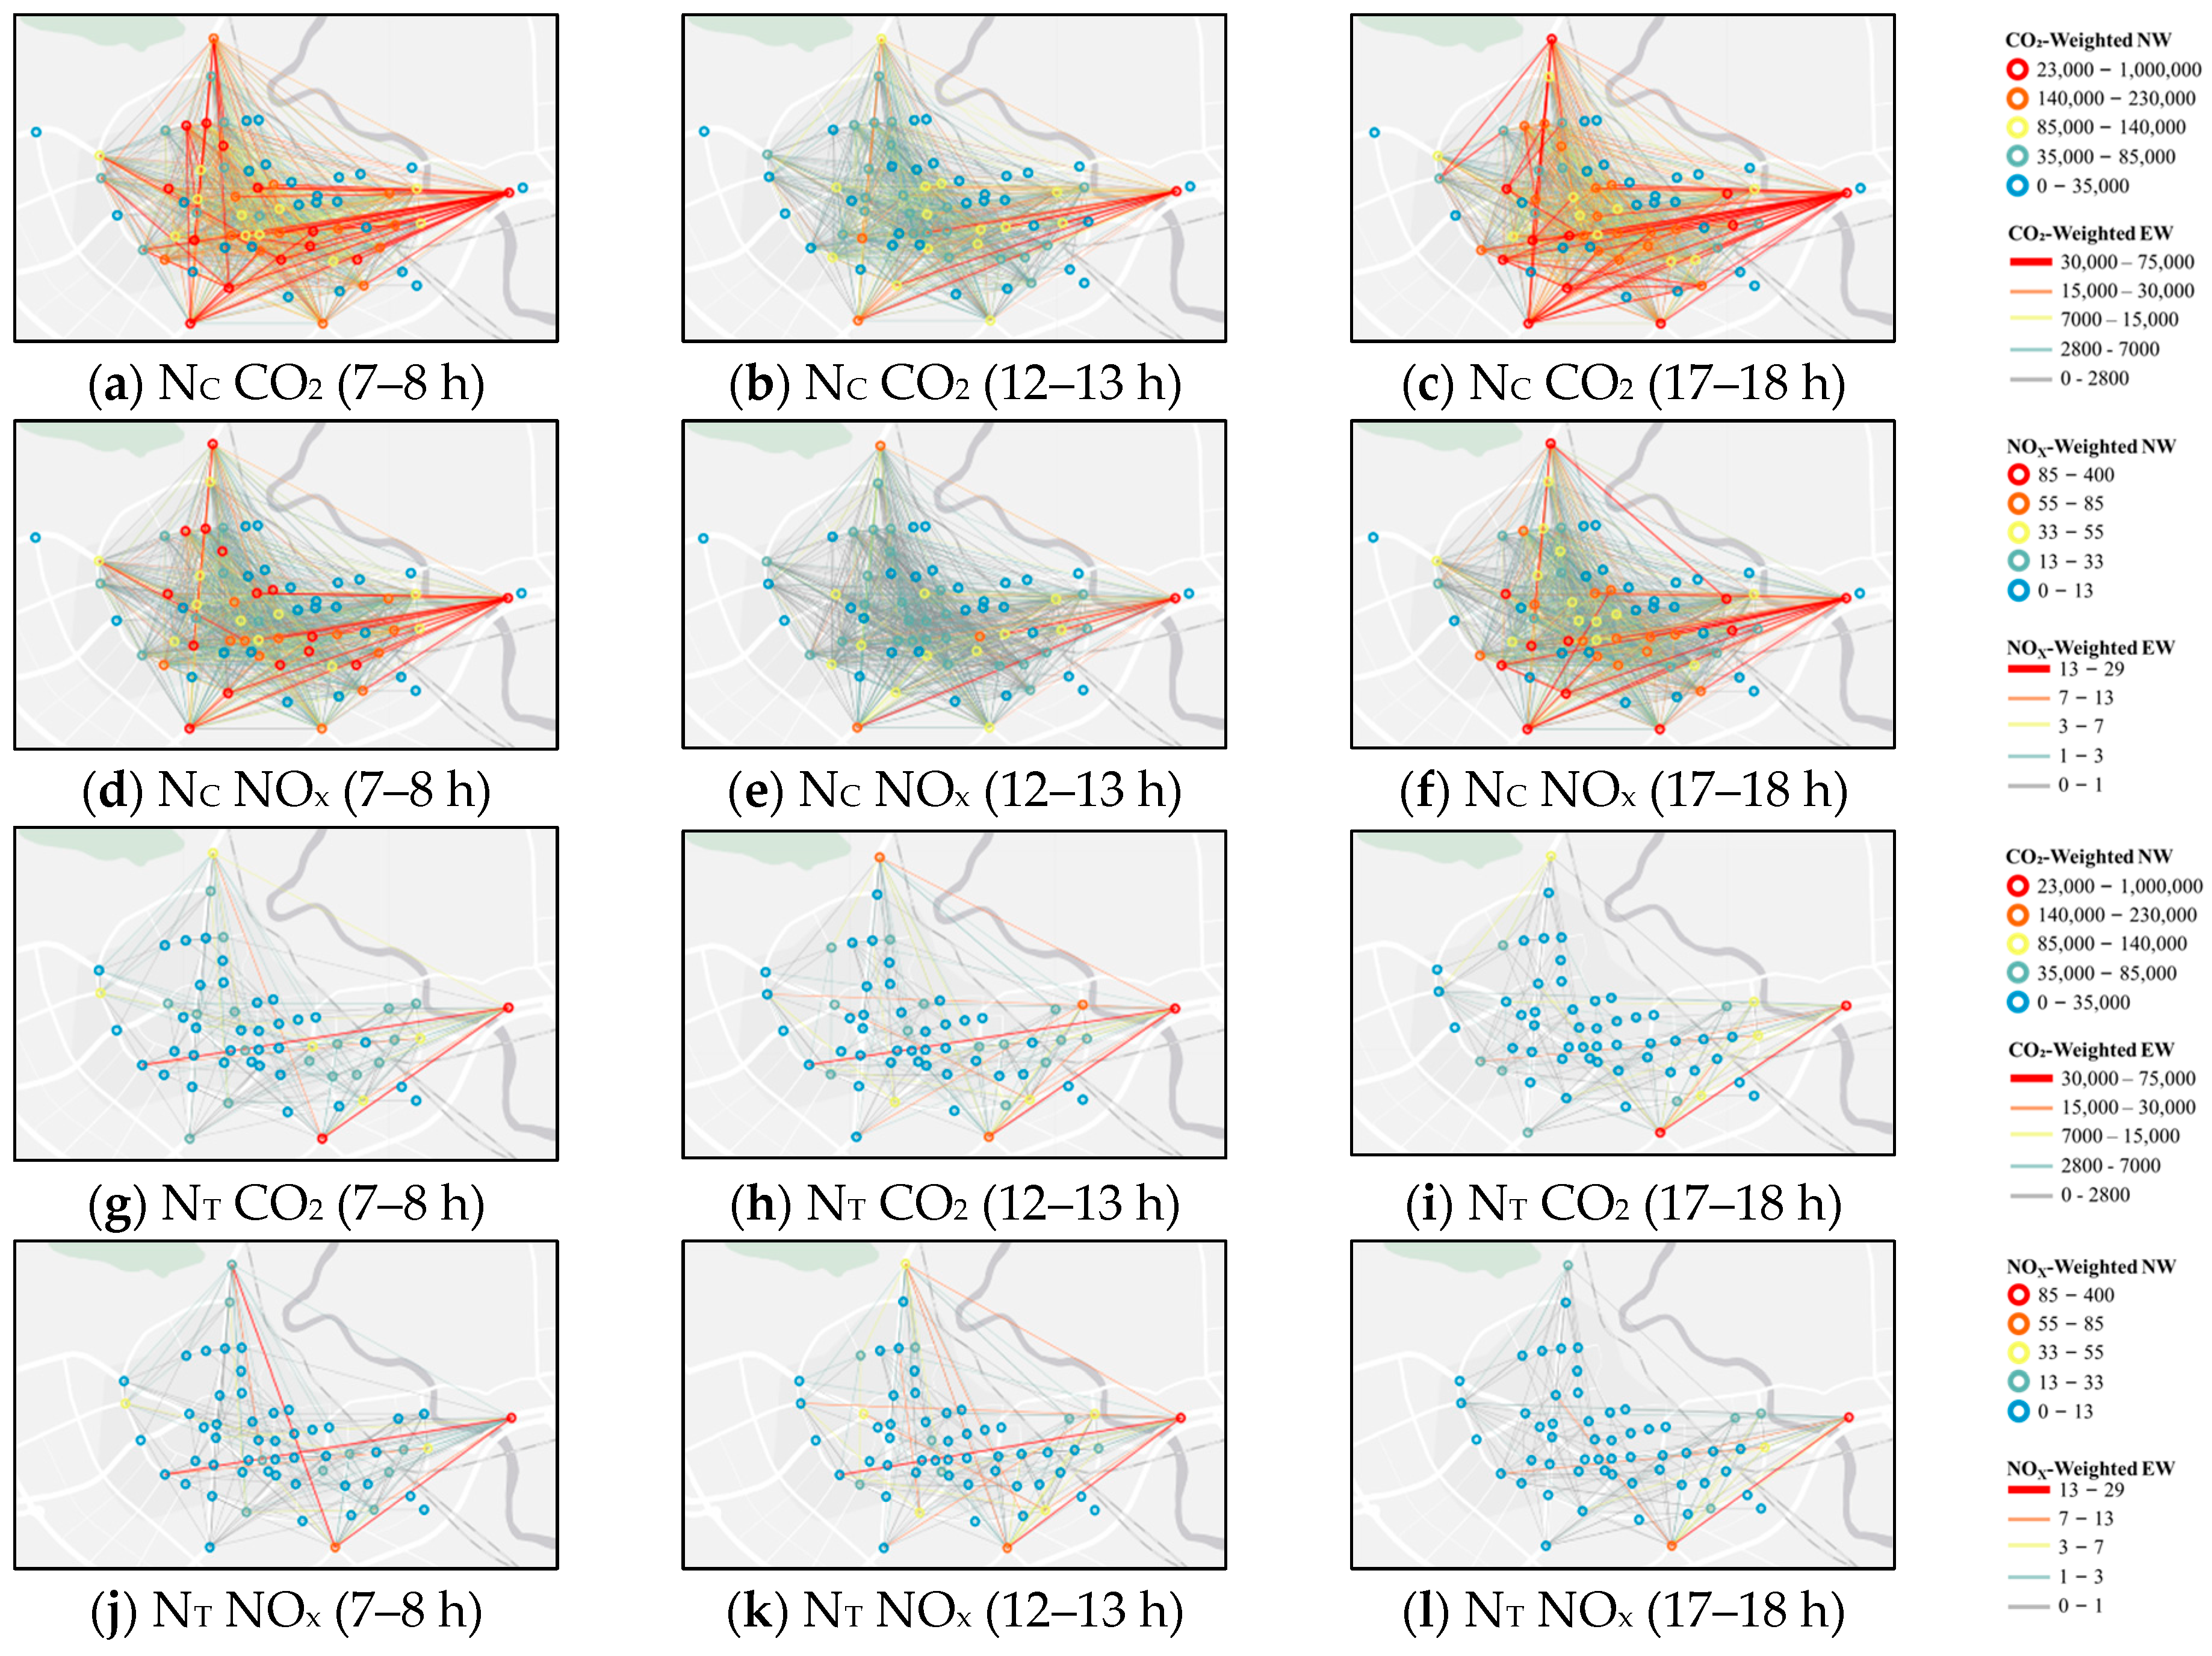
3.2. Emission Characteristics from the Network Perspective
3.2.1. Analysis from the Perspective of Nodes
3.2.2. Analysis from the Perspective of Edges
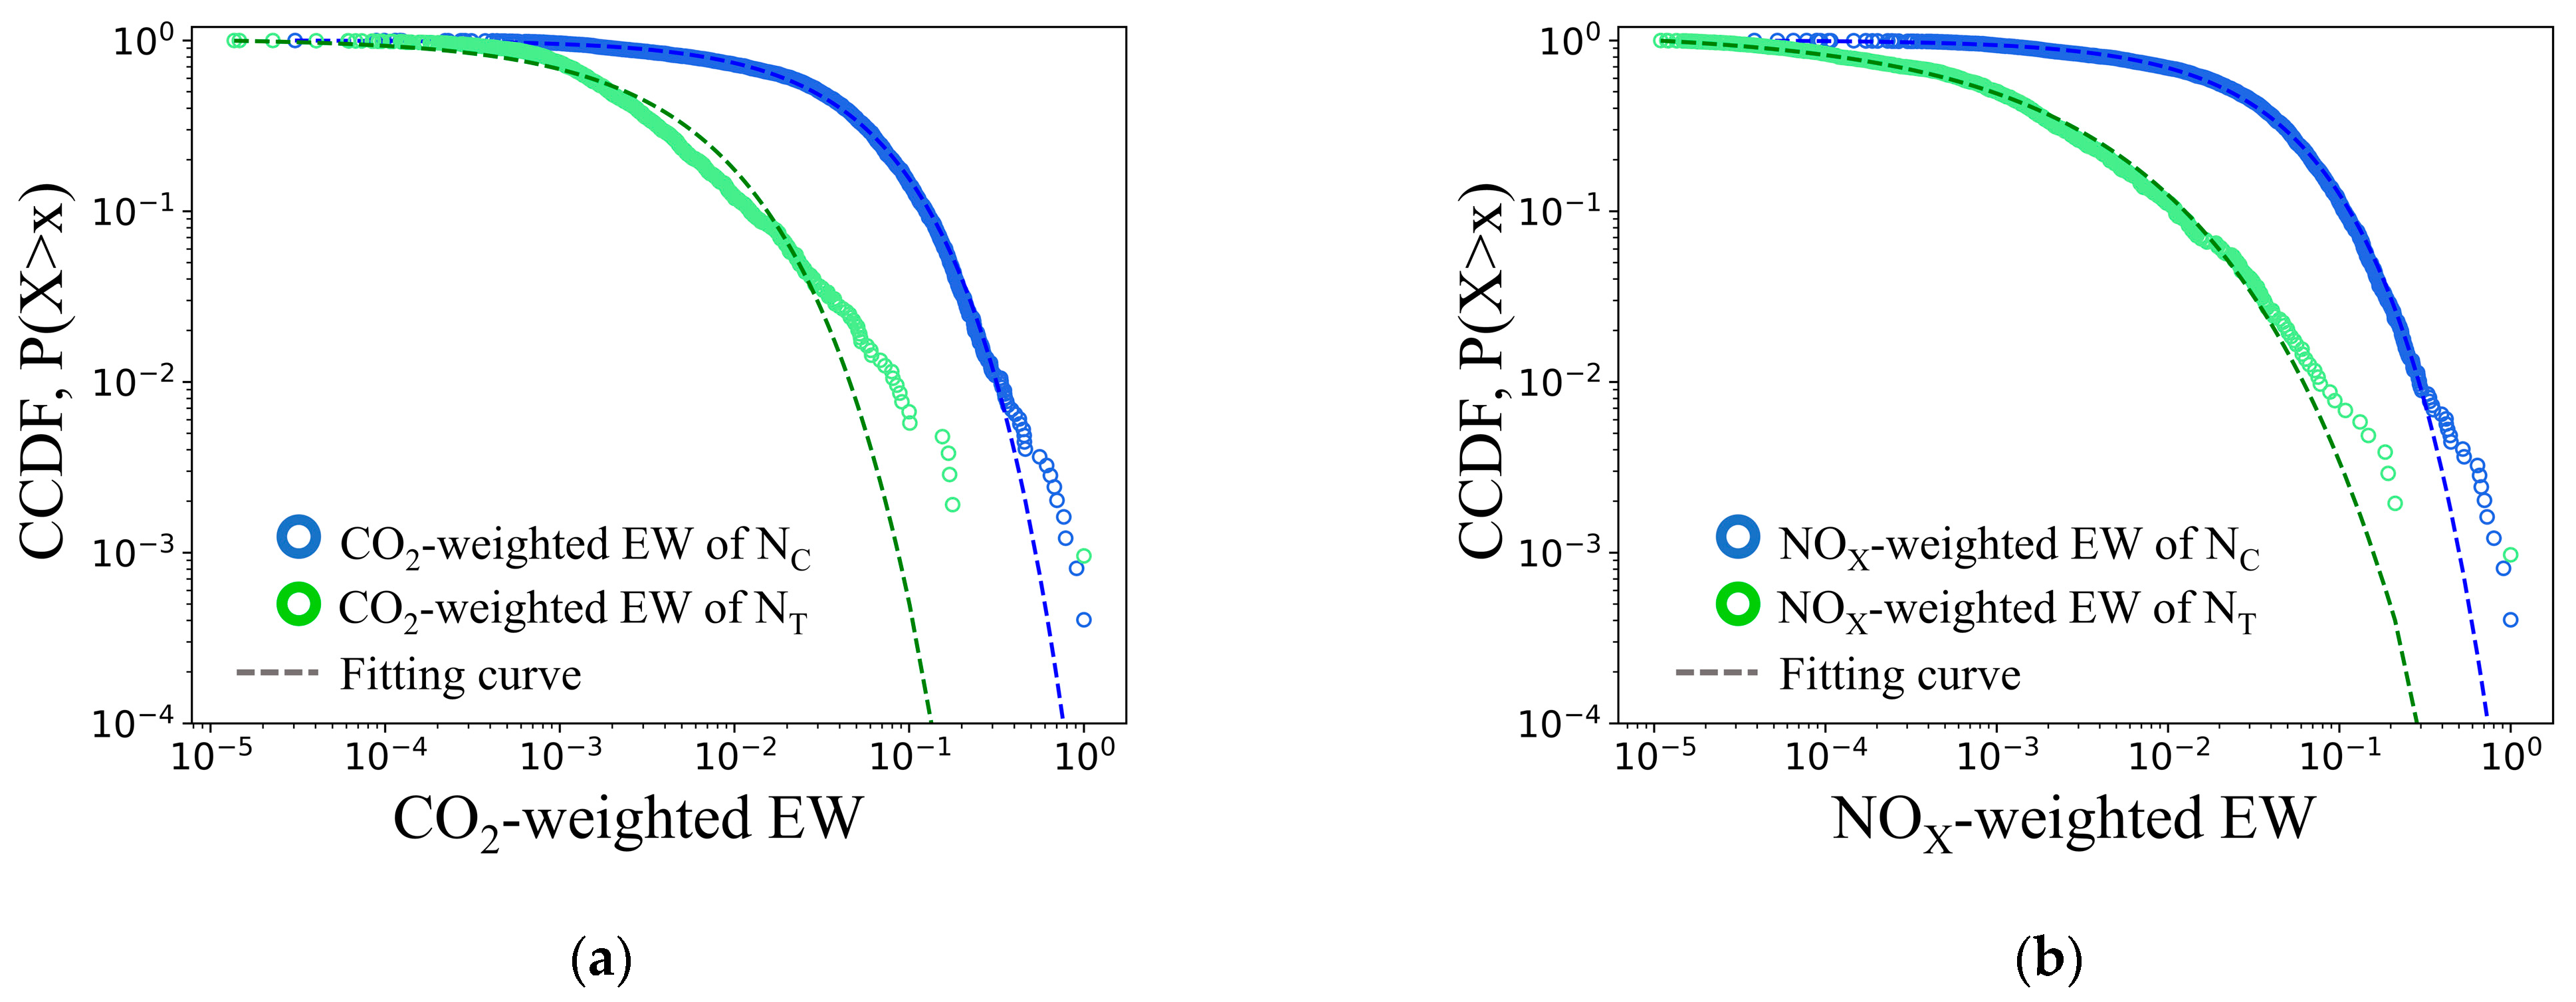
3.2.3. Scaling Laws in the UTEFN
4. Structural Analysis of the UTEFN
4.1. Global Structure of the UTEFN
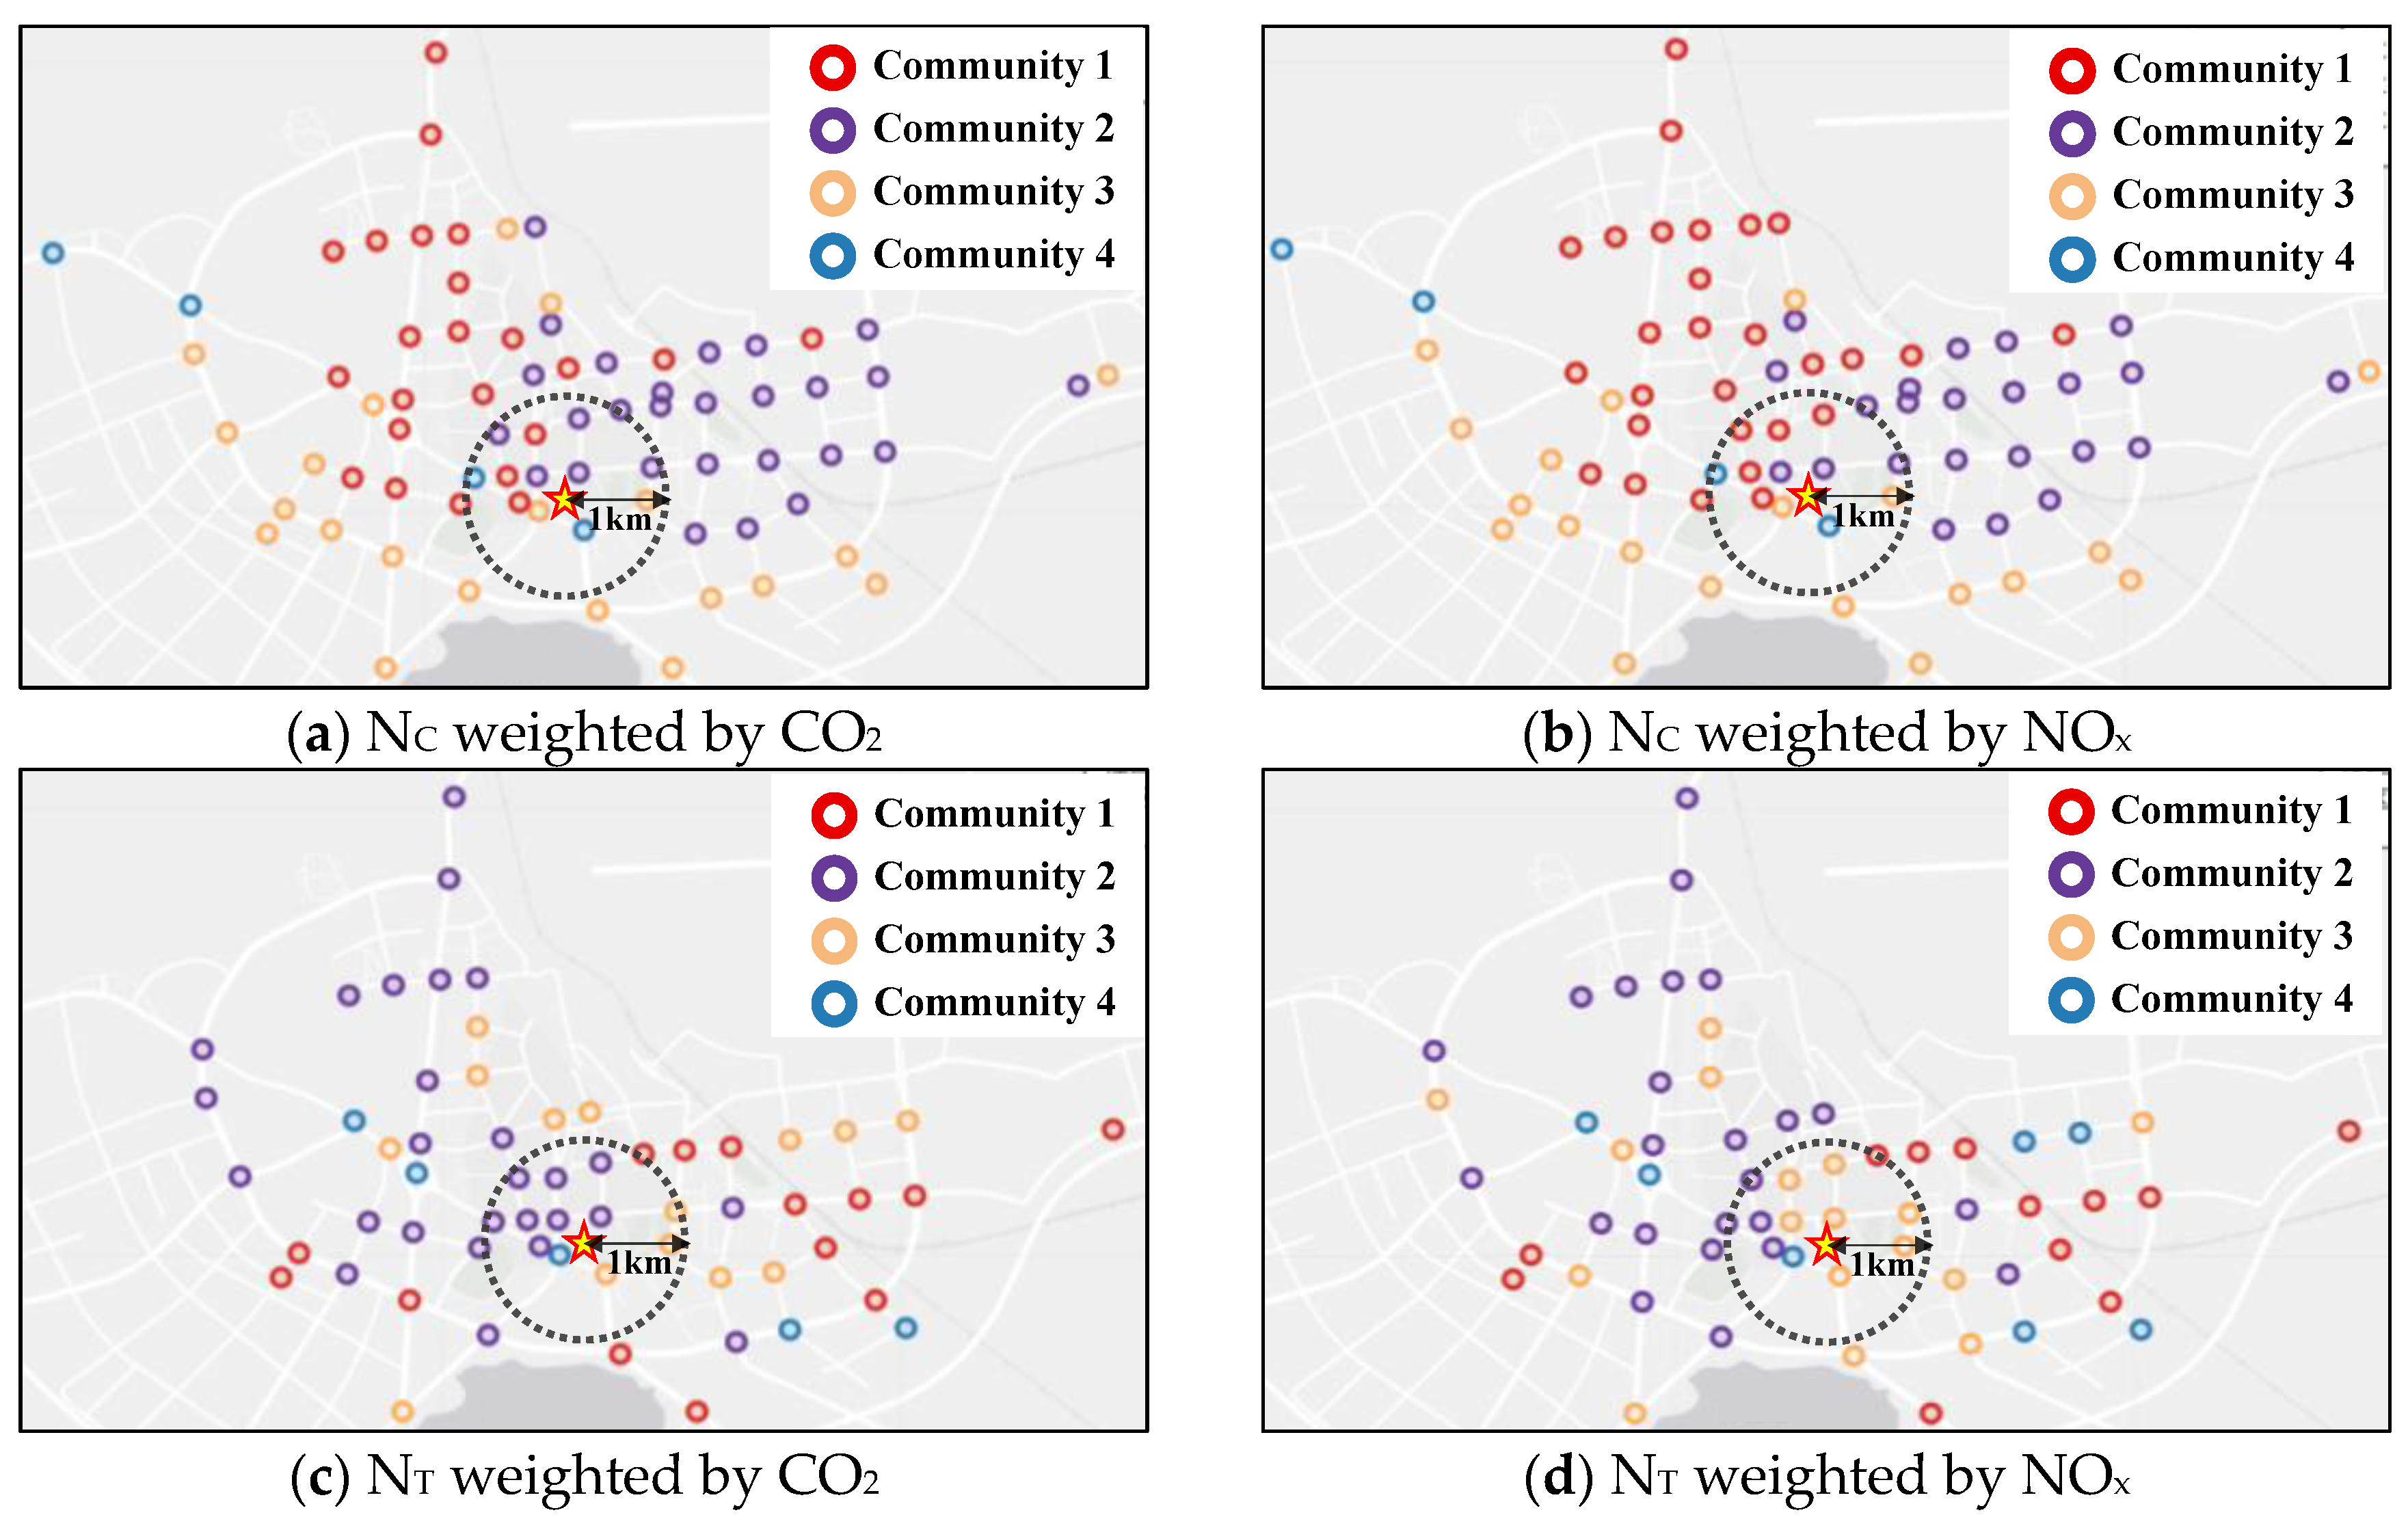
4.2. Structural Analysis of Network Communities
5. Discussion
5.1. Key Findings
5.2. Practical Implications
5.3. Uncertainty Discussion
5.4. Limitations and Future Studies
6. Conclusions
Supplementary Materials
Author Contributions
Funding
Institutional Review Board Statement
Informed Consent Statement
Data Availability Statement
Conflicts of Interest
Abbreviations
| ALPR | Automatic license plate recognition |
| CO2 | Carbon dioxide |
| EW | Edge weight |
| GDP | Gross domestic product |
| GPS | Global Positioning System |
| IVE | International Vehicle Emissions |
| NC | UTEFN for cars |
| NT | UTEFN for trucks |
| NOx | Nitrogen oxides |
| NW | Node weighted degree |
| OD | Origin–destination |
| POIs | Points of interest |
| RFID | Radio-frequency identification |
| UTEFN | Urban Traffic Emission Flow Network |
| VKTs | Vehicle kilometers travelled |
References
- International Energy Agency (IEA). Global CO2 Emissions from Transport by Sub-Sector in the Net Zero Scenario, 2000–2030. Available online: https://www.iea.org/data-and-statistics/charts/global-co2-emissions-from-transport-by-sub-sector-in-the-net-zero-scenario-2000-2030-2 (accessed on 8 May 2025).
- Boogaard, H.; Patton, A.P.; Atkinson, R.W.; Brook, J.R.; Chang, H.H.; Crouse, D.L.; Fussell, J.C.; Hoek, G.; Hoffmann, B.; Kappeler, R.; et al. Long-term exposure to traffic-related air pollution and selected health outcomes: A systematic review and meta-analysis. Environ. Int. 2022, 164, 107262. [Google Scholar] [CrossRef] [PubMed]
- Khreis, H.; Sanchez, K.A.; Foster, M.; Burns, J.; Nieuwenhuijsen, M.J.; Jaikumar, R.; Ramani, T.; Zietsman, J. Urban policy interventions to reduce traffic-related emissions and air pollution: A systematic evidence map. Environ. Int. 2023, 172, 107805. [Google Scholar] [CrossRef] [PubMed]
- Fu, X.; Cheng, J.; Peng, L.; Zhou, M.; Mauzerall, D.L. Co-benefits of transport demand reductions from compact urban development in Chinese cities. Nat. Sustain. 2024, 7, 294–304. [Google Scholar] [CrossRef]
- Deng, X.; Chen, W.; Zhou, Q.; Zheng, Y.; Li, H.; Liao, S.; Biljecki, F. Exploring spatiotemporal pattern and agglomeration of road CO2 emissions in Guangdong, China. Sci. Total Environ. 2023, 871, 162134. [Google Scholar] [CrossRef]
- Cai, H.; Xie, S. Estimation of vehicular emission inventories in China from 1980 to 2005. Atmos. Environ. 2007, 41, 8963–8979. [Google Scholar] [CrossRef]
- Kinnee, E.J.; Touma, J.S.; Mason, R.; Thurman, J.; Beidler, A.; Bailey, C.; Cook, R. Allocation of on road mobile emissions to road segments for air toxics modeling in an urban area. Transp. Res. Part D Transp. Environ. 2004, 9, 139–150. [Google Scholar] [CrossRef]
- Saide, P.; Zah, R.; Osses, M. Spatial disaggregation of traffic emission inventories in large cities using simplified top-down methods. Atmos. Environ. 2009, 43, 4914–4923. [Google Scholar] [CrossRef]
- Liu, Y.; Ma, J.; Li, L.; Lin, X.; Xu, W.; Ding, H. A high temporal-spatial vehicle emission inventory based on detailed hourly traffic data in a medium-sized city of China. Environ. Pollut. 2018, 236, 324–333. [Google Scholar] [CrossRef]
- Zhou, Z.; Tan, Q.; Liu, H.; Deng, Y.; Wu, K.; Lu, C.; Zhou, X. Emission characteristics and high-resolution spatial and temporal distribution of pollutants from motor vehicles in Chengdu, China. Atmos. Pollut. Res. 2019, 10, 749–758. [Google Scholar] [CrossRef]
- Xu, Y.; Liu, Z.; Xue, W.; Yan, G.; Shi, X.; Zhao, D.; Zhang, Y.; Lei, Y.; Wang, J. Identification of on-road vehicle CO2 emission pattern in China: A study based on a high-resolution emission inventory. Resour. Conserv. Recycl. 2021, 175, 105891. [Google Scholar] [CrossRef]
- Lin, C.; Zhou, X.; Wu, D.; Gong, B. Estimation of Emissions at Signalized Intersections Using an Improved MOVES Model with GPS Data. Int. J. Environ. Res. Public Health 2019, 16, 3647. [Google Scholar] [CrossRef]
- Tian, D.; Zhang, J.; Li, B.; Xia, C.; Zhu, Y.; Zhou, C.; Wang, Y.; Liu, X.; Yang, M. Spatial analysis of commuting carbon emissions in main urban area of Beijing: A GPS trajectory-based approach. Ecol. Ind. 2024, 159, 111610. [Google Scholar] [CrossRef]
- Böhm, M.; Nanni, M.; Pappalardo, L. Gross polluters and vehicle emissions reduction. Nat. Sustain. 2022, 5, 699–707. [Google Scholar] [CrossRef]
- Cheng, S.; Zhao, Y.; Zhang, B.; Peng, P.; Lu, F. Structural decomposition of heavy-duty diesel truck emission contribution based on trajectory mining. J. Clean. Prod. 2022, 380, 135172. [Google Scholar] [CrossRef]
- Shang, W.; Chen, Y.; Yu, Q.; Song, X.; Chen, Y.; Ma, X.; Chen, X.; Tan, Z.; Huang, J.; Ochieng, W. Spatio-temporal analysis of carbon footprints for urban public transport systems based on smart card data. Appl. Energy 2023, 352, 121859. [Google Scholar] [CrossRef]
- Cai, Y.; Zeng, X.; Li, W.; He, S.; Feng, Z.; Tan, Z. Managing Uncertainty in Urban Road Traffic Emissions Associated with Vehicle Fleet Composition: From the Perspective of Spatiotemporal Sampling Coverage. Sustainability 2024, 16, 3504. [Google Scholar] [CrossRef]
- Sun, D.; Zhang, K.; Shen, S. Analyzing spatiotemporal traffic line source emissions based on massive didi online car-hailing service data. Transp. Res. Part D Transp. Environ. 2018, 62, 699–714. [Google Scholar] [CrossRef]
- Zhang, S.; Niu, T.; Wu, Y.; Zhang, K.M.; Wallington, T.J.; Xie, Q.; Wu, X.; Xu, H. Fine-grained vehicle emission management using intelligent transportation system data. Environ Pollut. 2018, 241, 1027–1037. [Google Scholar] [CrossRef]
- Rao, W.; Wu, Y.-J.; Xia, J.; Ou, J.; Kluger, R. Origin-destination pattern estimation based on trajectory reconstruction using automatic license plate recognition data. Transp. Res. Part C Emerg. Technol. 2018, 95, 29–46. [Google Scholar] [CrossRef]
- Pereira, G.; Raetzsch, C. From Banal Surveillance to Function Creep: Automated License Plate Recognition (ALPR) in Denmark. Surveill. Soc. 2022, 20, 265–280. [Google Scholar] [CrossRef]
- Luvizon, D.C.; Nassu, B.T.; Minetto, R. A Video-Based System for Vehicle Speed Measurement in Urban Roadways. IEEE Transp. Intell. Transp. 2016, 18, 1393–1404. [Google Scholar] [CrossRef]
- Li, R.; Yang, F.; Liu, Z.; Shang, P.; Wang, H. Effect of taxis on emissions and fuel consumption in a city based on license plate recognition data: A case study in Nanning, China. J. Clean. Prod. 2019, 215, 913–925. [Google Scholar] [CrossRef]
- Dai, Y.; Shi, X.; Huang, Z.; Du, W.; Cheng, J. Proposal of policies based on temporal-spatial dynamic characteristics and co-benefits of CO2 and air pollutants from vehicles in Shanghai, China. J. Environ. Manag. 2024, 351, 119736. [Google Scholar] [CrossRef]
- Teng, W.; Shi, C.; Yu, Y.; Li, Q.; Yang, J. Uncovering the spatiotemporal patterns of traffic-related CO2 emission and carbon neutrality based on car-hailing trajectory data. J. Clean. Prod. 2024, 467, 142925. [Google Scholar] [CrossRef]
- Ren, L.; Guo, X.; Wu, J.; Singh, A.K. Data mining and spatio-temporal characteristics of urban road traffic emissions: A case study in Shijiazhuang, China. PLoS ONE 2023, 18, e0295664. [Google Scholar] [CrossRef] [PubMed]
- Gómez, C.D.; González, C.M.; Osses, M.; Aristizábal, B.H. Spatial and temporal disaggregation of the on-road vehicle emission inventory in a medium-sized Andean city. Comparison of GIS-based top-down methodologies. Atmos. Environ. 2018, 179, 142–155. [Google Scholar] [CrossRef]
- Cheng, S.; Lu, F.; Peng, P. A high-resolution emissions inventory and its spatiotemporal pattern variations for heavy-duty diesel trucks in Beijing, China. J. Clean. Prod. 2020, 250, 119445. [Google Scholar] [CrossRef]
- Deng, F.; Lv, Z.; Qi, L.; Wang, X.; Shi, M.; Liu, H. A big data approach to improving the vehicle emission inventory in China. Nat. Commun. 2020, 11, 2801. [Google Scholar] [CrossRef]
- Tang, J.; McNabola, A.; Misstear, B.; Caulfield, B. An evaluation of the impact of the Dublin Port Tunnel and HGV management strategy on air pollution emissions. Transp. Res. Part D Transp. Environ. 2017, 52, 1–14. [Google Scholar] [CrossRef]
- Faloutsos, M.; Faloutsos, P.; Faloutsos, C. On power-law relationships of the Internet topology. SIGCOMM Comput. Commun. Rev. 1999, 29, 251–262. [Google Scholar] [CrossRef]
- Siganos, G.; Faloutsos, M.; Faloutsos, P.; Faloutsos, C. Power laws and the AS-level Internet topology. IEEE ACM T. Netw. 2003, 11, 514–524. [Google Scholar] [CrossRef]
- Fan, Y.; Khattak, A.J. Urban Form, Individual Spatial Footprints, and Travel: Examination of Space-Use Behavior. Transp. Res. Rec. 2008, 2082, 98–106. [Google Scholar] [CrossRef]
- Central Committee of the Communist Party of China. State Council. Outline of Regional Integration Development Plan for the Yangtze River Delta. 2024. Available online: https://www.gov.cn/zhengce/2019-12/01/content_5457442.htm (accessed on 8 May 2025).
- National Bureau of Statistics, P.R.C. China Statistical Yearbook 2019; China Statistics Press: Beijing, China, 2019. [Google Scholar]
- Cheng, W.; Huang, H.; Liao, S.; Gao, F.; Biljecki, F. Global urban road network patterns: Unveiling multiscale planning paradigms of 144 cities with a novel deep learning approach. Landsc. Urban Plan. 2024, 241, 104901. [Google Scholar] [CrossRef]
- Hadavi, S.; Rai, H.B.; Verlinde, S.; Huang, H.; Macharis, C.; Guns, T. Analyzing passenger and freight vehicle movements from automatic-Number plate recognition camera data. Eur. Transp. Res. Rev. 2020, 12, 37. [Google Scholar] [CrossRef]
- Calculations of Emissions from Road Transport (COPERT). EU. Available online: https://copert.emisia.com (accessed on 8 May 2025).
- MOVES and Mobile Source Emissions Research. USA EPA. Available online: https://www.epa.gov/moves (accessed on 8 May 2025).
- Peng, T.; Gan, M.; Yao, Z.; Yang, X.; Liu, X. Nonlinear impacts of urban built environment on freight emissions. Transp. Res. Part D Transp. Environ. 2024, 134, 104358. [Google Scholar] [CrossRef]
- Mishra, D.; Goyal, P. Estimation of vehicular emissions using dynamic emission factors: A case study of Delhi, India. Atmos. Environ. 2014, 98, 1–7. [Google Scholar] [CrossRef]
- Viteri, R.; Borge, R.; Paredes, M.; Pérez, M.A. A high resolution vehicular emissions inventory for Ecuador using the IVE modelling system. Chemosphere 2023, 315, 137634. [Google Scholar] [CrossRef]
- Yu, Z.; Li, W.; Liu, Y.; Zeng, X.; Zhao, Y.; Chen, K.; Zou, B.; He, J. Quantification and management of urban traffic emissions based on individual vehicle data. J. Clean. Prod. 2021, 328, 129386. [Google Scholar] [CrossRef]
- Zeng, J.; Xiong, Y.; Liu, F.; Ye, J.; Tang, J. Uncovering the spatiotemporal patterns of traffic congestion from large-scale trajectory data: A complex network approach. Phys. A 2022, 604, 127871. [Google Scholar] [CrossRef]
- Lämmer, S.; Gehlsen, B.; Helbing, D. Scaling laws in the spatial structure of urban road networks. Phys. A 2006, 363, 89–95. [Google Scholar] [CrossRef]
- Chen, D.; Shao, Q.; Liu, Z.; Yu, W.; Chen, C.L.P. Ridesourcing Behavior Analysis and Prediction: A Network Perspective. IEEE Trans. Intell. Transp. Syst. 2022, 23, 1274–1283. [Google Scholar] [CrossRef]
- Nakamura, T.; Kiyono, K.; Yoshiuchi, K.; Nakahara, R.; Struzik, Z.R.; Yamamoto, Y. Universal Scaling Law in Human Behavioral Organization. Phys. Rev. Lett. 2007, 99, 138103. [Google Scholar] [CrossRef] [PubMed]
- Clauset, A.; Shalizi, C.R.; Newman, M.E.J. Power-Law Distributions in Empirical Data. SIAM Rev. 2009, 51, 661–703. [Google Scholar] [CrossRef]
- Kello, C.T.; Brown, G.D.A.; Ferrer-i-Cancho, R.; Holden, J.G.; Linkenkaer-Hansen, K.; Rhodes, T.; Van Orden, G.C. Scaling laws in cognitive sciences. Trends Cogn. Sci. 2010, 14, 223–232. [Google Scholar] [CrossRef] [PubMed]
- Fagiolo, G. Clustering in Complex Directed Networks. Phys. Rev. E 2007, 76, 026107. [Google Scholar] [CrossRef]
- Wei, Y.; Song, W.; Xiu, C.; Zhao, Z. The rich-club phenomenon of China’s population flow network during the country’s spring festival. Appl. Geogr. 2018, 96, 77–85. [Google Scholar] [CrossRef]
- Ganesh, B. Analysis of the airport network of India as a complex weighted network. Phys. A 2008, 387, 2972–2980. [Google Scholar] [CrossRef]
- Wang, Y.; Deng, Y.; Ren, F.; Zhu, R.; Wang, P.; Du, T.; Du, Q. Analysing the spatial configuration of urban bus networks based on the geospatial network analysis method. Cities 2020, 96, 102406. [Google Scholar] [CrossRef]
- Zhang, W.; Thill, J.-C. Detecting and visualizing cohesive activity-travel patterns: A network analysis approach. Comput. Environ. Urban Syst. 2017, 66, 117–129. [Google Scholar] [CrossRef]
- Yang, Y.; Jia, B.; Yan, X.; Zhi, D.; Song, D.; Chen, Y.; de Bok, M.; Tavasszy, L.A.; Gao, Z. Uncovering and modeling the hierarchical organization of urban heavy truck flows. Transp. Res. Part E Logist. Transp. Rev. 2023, 179, 103318. [Google Scholar] [CrossRef]
- Liu, X.; Gong, L.; Gong, Y.; Liu, Y. Revealing travel patterns and city structure with taxi trip data. J. Transp. Geogr. 2015, 43, 78–90. [Google Scholar] [CrossRef]
- Lancichinetti, A.; Fortunato, S.; Radicchi, F. Benchmark graphs for testing community detection algorithms. Phys. Rev. E 2008, 78, 046110. [Google Scholar] [CrossRef]
- Yildirimoglu, M.; Kim, J. Identification of communities in urban mobility networks using multi-layer graphs of network traffic. Transp. Res. Part C Emerg. Technol. 2018, 89, 254–267. [Google Scholar] [CrossRef]
- Lu, H.; Halappanavar, M.; Kalyanaraman, A. Parallel heuristics for scalable community detection. Parallel Comput. 2015, 47, 19–37. [Google Scholar] [CrossRef]
- Blondel, V.D.; Guillaume, J.-L.; Lambiotte, R.; Lefebvre, E. Fast unfolding of communities in large networks. J. Stat. Mech. Theory Exp. 2008, 2008, P10008. [Google Scholar] [CrossRef]
- Teng, W.; Zhang, Q.; Guo, Z.; Ying, G.; Zhao, J. Carbon emissions from road transportation in China: From past to the future. Environ. Sci. Pollut. Res. 2024, 31, 48048–48061. [Google Scholar] [CrossRef]
- Tian, X.; Huang, G.; Song, Z.; An, C.; Chen, Z. Impact from the evolution of private vehicle fleet composition on traffic related emissions in the small-medium automotive city. Sci. Total Environ. 2022, 840, 156657. [Google Scholar] [CrossRef]
- Zhu, B.; Hu, S.; Chen, X.; Roncoli, C.; Lee, D.-H. Uncovering driving factors and spatiotemporal patterns of urban passenger car CO2 emissions: A case study in Hangzhou, China. Appl. Energy 2024, 375, 124094. [Google Scholar] [CrossRef]
- Cheng, S.; Zhang, B.; Zhao, Y.; Peng, P.; Lu, F. Multiscale spatiotemporal variations of NOx emissions from heavy duty diesel trucks in the Beijing-Tianjin-Hebei region. Sci. Total Environ. 2023, 854, 158753. [Google Scholar] [CrossRef]
- Choi, H.W.; Frey, H.C. Light duty gasoline vehicle emission factors at high transient and constant speeds for short road segments. Transp. Res. D Transp. Environ. 2009, 14, 610–614. [Google Scholar] [CrossRef]
- Gao, C.; Gao, C.; Song, K.; Xing, Y.; Chen, W. Vehicle emissions inventory in high spatial–temporal resolution and emission reduction strategy in Harbin-Changchun Megalopolis. Process Saf. Environ. Prot. 2020, 138, 236–245. [Google Scholar] [CrossRef]
- Hao, H.; Geng, Y.; Wang, H.; Ouyang, M. Regional disparity of urban passenger transport associated GHG (greenhouse gas) emissions in China: A review. Energy 2014, 68, 783–793. [Google Scholar] [CrossRef]
- Tang, G.; Chao, N.; Wang, Y.; Chen, J. Vehicular emissions in China in 2006 and 2010. J. Environ. Sci. 2016, 48, 179–192. [Google Scholar] [CrossRef]
- Yang, J.; Sun, J. Vehicle path reconstruction using automatic vehicle identification data: An integrated particle filter and path flow estimator. Transp. Res. Part C Emerg. Technol. 2015, 58, 107–126. [Google Scholar] [CrossRef]
- Wang, H.; Chen, C.; Huang, C.; Fu, L. On-Road Vehicle Emission Inventory and Its Uncertainty Analysis for Shanghai, China. Sci. Total Environ. 2008, 398, 60–67. [Google Scholar] [CrossRef]
- Yang, X.; Yao, D.; Xu, R.; Pian, Y.; Liu, S.; Liu, Y. Assessment of full-process VOCs emissions of on-road vehicles considering individual parking behaviors. Transp. Res. D Transp. Environ. 2025, 142, 104678. [Google Scholar] [CrossRef]



| Index | ALPR Location ID | Vehicle ID (Anonymized) | Recording Time |
|---|---|---|---|
| 1 | XC-01 | 964352156 | 30 May 2018/08:00:01 |
| 2 | XC-02 | 964352157 | 30 May 2018/09:00:02 |
| Measure | Symbol | General Implication |
|---|---|---|
| In degree | The number of edges pointing to node . | |
| Out degree | The number of edges from node to other nodes. | |
| Degree | The number of edges that are in contact with node . | |
| Bilateral edges number | The number of nodes for which both an and an exist. | |
| Network density | The network density between nodes in the network is defined as the ratio of the total number of edges to the maximum possible number of edges, which is , where represents the number of nodes in the network. | |
| Clustering coefficient | The clustering coefficient quantifies the level of cohesiveness among the neighbors of a node. In this context, refers to the edge weight matrix, with representing the value on the diagonal corresponding to node . | |
| Average clustering coefficient | The mean value of the clustering coefficient for all nodes in the network, is the total number of nodes in the network. | |
| Average shortest path | The arithmetic mean of the number of edges in the shortest paths between all pairs of nodes. Where represents the shortest path between node and , and is the total number of nodes in the network. | |
| Small-world coefficient | and represent the average clustering coefficient of the UTEFN and an equivalent random network, respectively. and represent the average shortest path length of the UTEFN and an equivalent random network, respectively. |
| EW for CO2 | EW for NOx | |
|---|---|---|
| NC | = 22.06, = 0.79; R2 = 0.997 | = 26.42, = 0.75; R2 = 0.997 |
| NT | = 232.75, = 0.65; R2 = 0.947 | = 499.08, = 0.470; R2 = 0.990 |
| UTEFN | Number of Nodes | Number of Edges | Network Density | Average Shortest Path Length | Average Clustering Coefficient | Small World Metric |
|---|---|---|---|---|---|---|
| NC | 75 | 2470 | 0.44 | 1.46 (1.55 *) | 0.78 (0.455 *) | 1.38 |
| NT | 60 | 1046 | 0.29 | 1.7 (1.78 *) | 0.51 (0.29 *) | 1.83 |
Disclaimer/Publisher’s Note: The statements, opinions and data contained in all publications are solely those of the individual author(s) and contributor(s) and not of MDPI and/or the editor(s). MDPI and/or the editor(s) disclaim responsibility for any injury to people or property resulting from any ideas, methods, instructions or products referred to in the content. |
© 2025 by the authors. Licensee MDPI, Basel, Switzerland. This article is an open access article distributed under the terms and conditions of the Creative Commons Attribution (CC BY) license (https://creativecommons.org/licenses/by/4.0/).
Share and Cite
Feng, Z.; Zeng, X.; Li, W.; Tan, Z.; Liu, Y. Revealing Emission Patterns of Urban Traffic Flows: A Complex Network Theory Perspective. Atmosphere 2025, 16, 594. https://doi.org/10.3390/atmos16050594
Feng Z, Zeng X, Li W, Tan Z, Liu Y. Revealing Emission Patterns of Urban Traffic Flows: A Complex Network Theory Perspective. Atmosphere. 2025; 16(5):594. https://doi.org/10.3390/atmos16050594
Chicago/Turabian StyleFeng, Zedong, Xuelan Zeng, Weichi Li, Zihang Tan, and Yonghong Liu. 2025. "Revealing Emission Patterns of Urban Traffic Flows: A Complex Network Theory Perspective" Atmosphere 16, no. 5: 594. https://doi.org/10.3390/atmos16050594
APA StyleFeng, Z., Zeng, X., Li, W., Tan, Z., & Liu, Y. (2025). Revealing Emission Patterns of Urban Traffic Flows: A Complex Network Theory Perspective. Atmosphere, 16(5), 594. https://doi.org/10.3390/atmos16050594


