Article

Analysis of Volatile Organic Compounds from Compost

by
Shastine K. Berger
1,
Rosario C. Morales
1,
Katherine A. McCown
1,
Kylie C. Wilson
1,
Bertram T. Jobson
2 and
Nancy A. C. Johnston
1,*
1
Physical, Life, Movement, & Sport Sciences Division, Lewis-Clark State College, Lewiston, ID 83501, USA
2
Department of Civil and Environmental Engineering, Washington State University, Pullman, WA 99164, USA
*
Author to whom correspondence should be addressed.
Atmosphere 2025, 16(5), 591; https://doi.org/10.3390/atmos16050591
Submission received: 1 April 2025 / Revised: 8 May 2025 / Accepted: 11 May 2025 / Published: 14 May 2025
(This article belongs to the Section Biosphere/Hydrosphere/Land–Atmosphere Interactions)

Abstract

:
Many US states have adopted regulations to divert food waste from landfills to composts. While this may lower greenhouse emissions from landfills, volatile organic compound (VOC) emissions from compost may contain hazardous air pollutants or produce odors, posing potential public health concerns. Effective methods to analyze speciated VOCs in compost are needed to better understand VOC source generation. Here, a two-component compost sampling method was developed and employed consisting of a chilled impinger and pump apparatus to trap water-soluble VOCs, and dual sorbent tubes to capture hydrophobic VOCs in yard and food/yard waste compost. VOCs were measured via headspace gas chromatography with flame ionization detection (HS-GC-FID) and thermal desorption–gas chromatography–mass spectrometry (TD-GC-MS). Overall, there was higher VOC generation within higher-temperature compost piles, with concentrations ranging up to 27,000 ppm for ethanol and 3500 ppm for methanol. Alpha-pinene and D-limonene were seen in these piles with concentrations over 1600 ppb. Methanol and ethanol were more than one thousand times as concentrated in mixed food/yard waste than yard waste alone, while terpenes were seen in slightly higher concentrations for yard waste than the mixed food/yard waste. Methanol was observed to be higher than permissible indoor levels and may pose potential health risks.

1. Introduction

Compost is used vastly within the agricultural industry, where it acts as fertilizer and soil amendments [1]. It is a more efficient way to decompose organic waste due to its aerobic properties and is growing in usage [2]. Many municipal facilities are turning to composting due to the aerobic decomposition present in comparison to anaerobic decomposition found in landfills, where methane gas emissions are found [3]. Greenhouse gases, including methane and carbon dioxide, are emissions of concern for landfills and composting due to their influence on global warming [4]. Multiple US states have banned commercial food waste from landfills to help reduce waste as well as greenhouse gases, with limited success [5]. Other strategies to reduce greenhouse gas emissions include the use of livestock manure [6], biofilters [7], and microbes [8]. Similarly, methods have been utilized to determine the factors affecting emissions from compost and their potential for ozone (smog) formation [9]. There have been a variety of studies determining the major gas emissions at landfill and compost facilities, most of which are emitted from landfills [10,11]. The difference in emissions between the facilities is due to the different types of decomposition processes [12]. As previously mentioned, compost facilities use aerobic decomposition, while landfills rely on anaerobic decomposition [10]. Greenhouse gases are known to come from compost due to the degradative process it goes through [13]; however, there are a variety of other compounds that are emitted from compost, such as volatile organic compounds (VOCs) [14].
Disadvantages of composting include the production of odorous emissions of VOCs [15,16,17]. VOCs are carbon-containing compounds with a range of volatility, or the ability to evaporate from the liquid to gas phase. VOC emissions are influenced by a variety of factors, including moisture levels, oxygen content, compost composition, and temperature [18]. Some VOCs are classified as air toxics by the US Environmental Protection Agency (EPA) [19] and may cause possible health risks to humans or environmental damage in high enough concentrations [11,20]. The US Occupational Safety and Health Administration (OSHA) regulates work-related chemical exposures, setting permissible exposure limits (PELs) for several air pollutants [21]. Due to environmental and health concerns, several municipalities have regulations on VOC emissions from compost facilities, or the facilities require air permits. In a recent review of the field by Nordahl et al. [22], VOC emission factors from compost were reported to range from 6 × 10⁻⁵ to 1.7 × 10⁻³ kg VOC/kg of wet feedstock. However, there is still a general lack of data on speciated VOC emissions from compost due to the time-consuming and expensive sampling and analysis protocols.
Some methods commonly used to study compost emissions include the simulation of compost facilities using digestion systems [23] and environmental flux chambers [9]. The digestion chambers use a filtration system for air entering the compost chamber, and samples collected via canisters or charcoal/sorbent tubes [23,24]. Environmental flux chambers are placed directly on top of compost piles with different aeration patterns, analyzing total VOC emissions in a given compound group, such as alcohols, acids, and hydrocarbons [9]. After collection of the VOCs, gas chromatography, mass spectrometry, and greenhouse gas analyzers are typically used to identify VOCs and greenhouse gas composition [9,13,25,26]. One problematic issue with these methods is their lack of tolerance for humid compost environments. A method developed to overcome this is described by South Coast Air Quality Management District (SCAQMD) Method 25.3, which uses a water impinger to capture moisture and water-soluble VOCs, while hydrocarbons like monoterpenes are captured in a SUMMA canister for analysis [27]. The analysis of water-soluble VOCs by this method is often omitted, as the focus is on the total VOCs collected after the impinger water collection stage. A more comprehensive method that allows for the measurement of both water-soluble and insoluble VOCs would be useful.
The purpose of this study was two-fold. The first goal was to develop a dual sampling and instrumental method to measure speciated VOCs in compost. The second goal was to compare compost VOC concentrations from two different sources, yard waste and mixed food/yard waste. The technique used a water impinger to remove humidity from the sampling line by capturing water-soluble VOCs. The impinger was coupled with a sorbent tube to capture the remaining water-insoluble VOCs. Two chromatographic methods were used (headspace gas chromatography and thermal desorption–gas chromatography–mass spectrometry) to analyze VOCs captured from compost. Yard waste and mixed food/yard waste compost piles were constructed. Several variables were measured when sampling from the piles, including temperature, age, and compositions. A total of 119 VOCs were analyzed and captured during the aging process of controlled compost piles, including alcohols, monoterpenes, sulfides, and hydrocarbons.

2. Materials and Methods

2.1. Overview

Compost piles were built specifically for research purposes at the Washington State University Compost Facility (WSU CF) in Pullman, WA, USA. Two main composition types (yard waste and mixed food/yard waste) were sampled in duplicate for up to 21 days, totaling 90 samples. Soil probes were inserted into the compost pile to withdraw air through a water impinger and then through a sorbent tube. The water and air samples were analyzed via headspace gas chromatography (HS-GC) and thermal desorption–gas chromatography–mass spectroscopy (TD-GC-MS), respectively. This method of sampling and analysis was tested for efficacy and to characterize compost at the WSU CF.

2.2. Compost Setup

Over the course of two separate compost trials, 19 July 2022–22 July 2022 and 31 August 2022–14 September 2022, different compost compositions were analyzed. The compost material makeup included food plus yard waste (FY) in trial B, while the trial A series consisted strictly of yard waste (YW) (Table 1). During the analysis of the different compost piles, the temperatures were monitored. Pile 1 was a controlled pile with lower temperatures, and Pile 2 had naturally higher temperatures. The piles were controlled by the addition of insulation (a tarp) to prevent heat from escaping.

2.3. Sampling Design

Two different types of samples were taken via pumped air from the compost pile: water-soluble compounds condensed using an impinger, and subsequent water-insoluble compounds collected using a sorbent tube. The water impinger system contained 5.00 mL of deionized water pipetted into a 10.00 mL headspace vial, nested inside a Savillex (Eden Prairie, MN, USA) Teflon impinger. Markes International, Inc. (Sacramento, CA, USA) Tenax®TA-Sulficarb dual sorbent tubes (3.5″/89 mm length, ¼″/6.4 mm outer diameter, and 5 mm inner diameter, stainless steel, inert-coated) were utilized for sampling via adsorption.
Teflon tubing (¼–½″ outer diameter) attached to a Gillian Air pump (Sensidyne, LP., St. Petersburg, FL, USA) connected both the sorbent tube and the impinger to the compost pile or sampler. A Markes International, Inc. Soil Probe (12″/304.8 mm length) was used with some samples, while the other samples contained a Teflon tube placed directly in the compost pile. Figure 1 shows the sampling apparatus.
Samples were collected within compost piles built in the summer/fall of 2022 at the WSU CF in Pullman, WA, USA. The focus was on two piles built for the concurrent research conducted to compare the different factors that affect VOC emissions from compost (Table 1). Two locations (top and side of each pile) were analyzed with one impinger aqueous sample and duplicate sorbent tube air samples, in both yard waste (YW) compost (n = 40) and mixed food/yard (FY) waste (n = 50) [28]. Samples were taken beginning on day five and repeated in various increments after a new pile was made. Details of the compost piles are in Table 1. The side compost location had a ½″ Teflon tube that was inserted four feet into the side of the pile with a ½″/12.7 mm to ⅛″/3.18 mm adapter to access the middle of the pile. A total of 0.5–2.6 L of air was bubbled into the water samples and 0.05–0.59 L into the air samples. When the sample location was not in use, copper tubing was inserted into the Teflon tubing to prevent the tube from collapsing due to the high temperatures of the compost pile. The top compost location had a soil probe that was inserted one foot into the top of the pile after the matured layer was scraped off. While sampling occurred, a variety of field data were recorded, including weather conditions, time of sampling, location on pile, flow rate, sample duration, temperature of the pile, and pile reference number. The experiments were repeated using compost of yard waste and mixed food/yard waste.

2.4. Analytical Protocols

The samples were capped and transported back to the lab. A Markes International Unity 2 thermal desorption and Agilent (Santa Clara, CA, USA) 7280 gas chromatography–5977E mass spectrometer (TD-GC-MS) was used to analyze the air component, and an Agilent 7697 headspace 7890 gas chromatograph with flame ionization detector (HS-GC-FID) was used to analyze the water component (Table 2). Prior to sampling, the sorbent tubes were conditioned in a heated oven (100 °C for 30 min, 200 °C for 75 min) with 100 mL/min nitrogen flow through the tube. The sorbent tubes were blanked using TD-GC-MS with the same method used for analysis. The minimal residue left on the blank tubes was subtracted (average of blanks) from the respective amounts of VOCs measured.
The aqueous samples required the addition of 0.50 g of sodium sulfate (Fisher Scientific, Waltham, MA, USA) to release the trapped gases back into the headspace of the vials. These samples were then analyzed using HS-GC-FID. The sorbent tubes were purged with nitrogen (100 mL/min for 6 min) after sampling and then analyzed using TD-GC-MS with a method adapted from United States Environmental Protection Agency Method TO-17 [29] and summarized by Scott et al. [30] and Dickinson et al. [31]. The instrumentation parameters are listed in Table 2, and further chromatographic details in Tables S1 and S2.

2.5. Calibration

To verify accuracy and to adjust for instrument drift, each instrument was initially calibrated with five levels, and upon each sample batch analysis. If a calibration check was outside of the 80–120% recovery range, the system was recalibrated. HS-GC-FID standards were created using pure liquid VOCs (Fisher Scientific) diluted with deionized water in volumetric proportions, with concentrations ranging from 0.2 μL/L to 200 μL/L. These mixtures (5 mL) were then analyzed using HS-GC-FID after the addition of 0.50 g of sodium sulfate in a 10 mL headspace vial. Similarly, liquid standards for TD-GC-MS were created using 100 μL/L in GC-MS grade methanol (Fisher Scientific) and 0.5 µL injection, resulting in 0.7–30 ng VOCs spiked into the sorbent tube. In addition, prepared standard mixes were purchased and utilized: Airgas (Radnor, PA, USA) TO-65 Component Mix 1 ppm in nitrogen, Airgas Ozone Precursor/PAMS Mix 1 ppm in nitrogen, and SPEX Certi-Prep (Staffordshire, UK) CAN-TERP-MIX2 100 ug/mL in methanol. The amount of gas standards injected ranged from 0.5 nL to 3 nL. Gas and liquid standards were injected separately into the sorbent tubes for calibration. The lower limit of detection (LLOD) and upper limit of detection (ULOD) were determined for each VOC and technique (Supplementary Tables S1 and S2). To adjust for highly concentrated samples, the inlet was split with various ratios to dilute samples. When standards were run without the split, the sample concentrations were multiplied by the inverse dilution factor or multiplier (M). If the sample concentration was above the ULOD, it was replaced with the ULOD value. Non-detects were labeled (ND).

2.6. Data Processing

Following HS-GC-FID and TD-GC-MS analysis, gas phase VOC concentrations ( C H S , g   o r   C T D , g )   were calculated from peak area to aqueous concentration ( C H S , a q   ) or gas amount (nL), respectively, and then converted to parts per billion (ppb) by volume in the original compost air sample (Equations (1) and (2)). Variables include V a q , the volume of the water used in the impinger (0.005 L), d l , the liquid density of the VOC (as standards were prepared from liquid phase by volume), the molar volume of a gas at 25 °C and 1 atm, or 24.45 nL/nmole, the molecular weight of the VOC in ng/nmole, the volume of air pumped through the impinger or sorbent tube ( V a i r ) , and the inverse dilution factor, M. For eight analytes in Table 3, the total concentration ( C T o t )   was calculated by summing both C H S , g p p b and C T D , g p p b , as shown in Equation (3). Equation (3) was also used to calculate the percent recovery of the impinger (see next section).
C H S , g p p b = [ C H S , a q μ L L C H S , a q , b l a n k μ L L ] · V a q   L · d l m g μ L · 10 6 n g m g · 24.45   n L / n m o l e M W   n g / n m o l e · 1 V a i r ( L )
C T D , g p p b = [ n L · M ] n L   ( b l a n k ) V a i r ( L ) = n L L
( C T o t ) = C H S , g p p b + C T D , g p p b

2.7. Sampling Method Validation and Recovery

Sampling through this dual method was confirmed through percent of analytes captured in the impinger compared to the total analyte measured. The concentration of an analyte in the water sample through HS-GC-FID analysis was compared to the same analyte concentration in the air sample plus the water sample, and a percent recovery was calculated using Equation (4) below:
%   R e c o v e r y I m p i n g e r = C H S , g p p b · 100 C T o t p p b
In addition, experiments were run with the use of ice and no ice on the entry of the Teflon tubing into the impinger system to determine optimal recovery conditions.

3. Results and Discussion

One hundred nineteen compounds were analyzed using TD-GC-MS, and fifteen compounds were analyzed using HS-GC-FID. Supplemental Figure S1 displays the chromatograms of the different instrumental methods and selected compounds. The full data set is available in Mendeley Data [27].

3.1. Sampling Method Validation

The study used a methodology to capture water-soluble VOCs from air in a water impinger trap and prevent the escape of those compounds into the air samples. Table 3 depicts the percent recovery for each water-soluble compound measured using both HS-GC-FID and TD-GC-MS. The percent recovery for water-soluble alcohols ranged between 99 and 100%; thus, the impinger method was effective at capturing these compounds. Likewise, the impinger allowed water-insoluble compounds like terpenes to pass (7–48% recovery) and were subsequently caught by the sorbent tube, with a percent recovery of 52–92% (Table 3). Note that this percent recovery is of compounds collected through compost sampling, not spiked or purposefully injected. This represented a distribution or partitioning of the VOCs sampled and analyzed with both analytical systems. The use of ice around the Teflon tubing prior to and around the impinger system showed better recovery of most water-soluble VOCs and was used in all sampling (Supplemental Figure S2). Most water-soluble VOCs had higher concentrations when the ice was utilized compared to when it was not, including methanol, benzaldehyde, acetone, isopropanol, eucalyptol, and guaiacol (Supplemental Figure S2). Ethanol, ethyl acetate, and butanol decreased with the extra ice, but the increased VOCs outweighed these, and thus, the ice was utilized in all sampling.

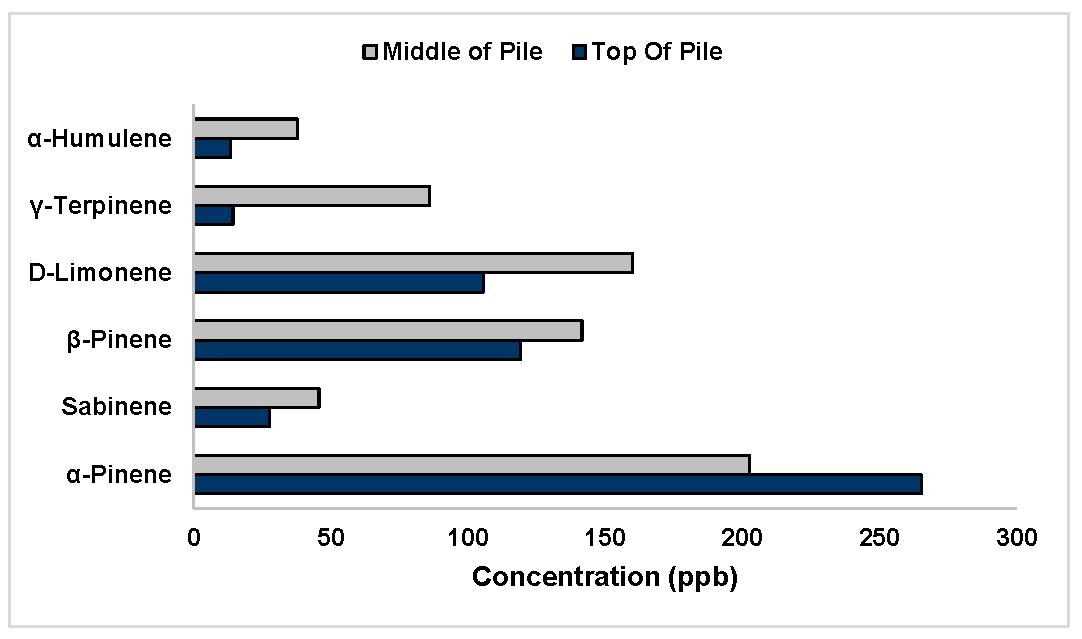
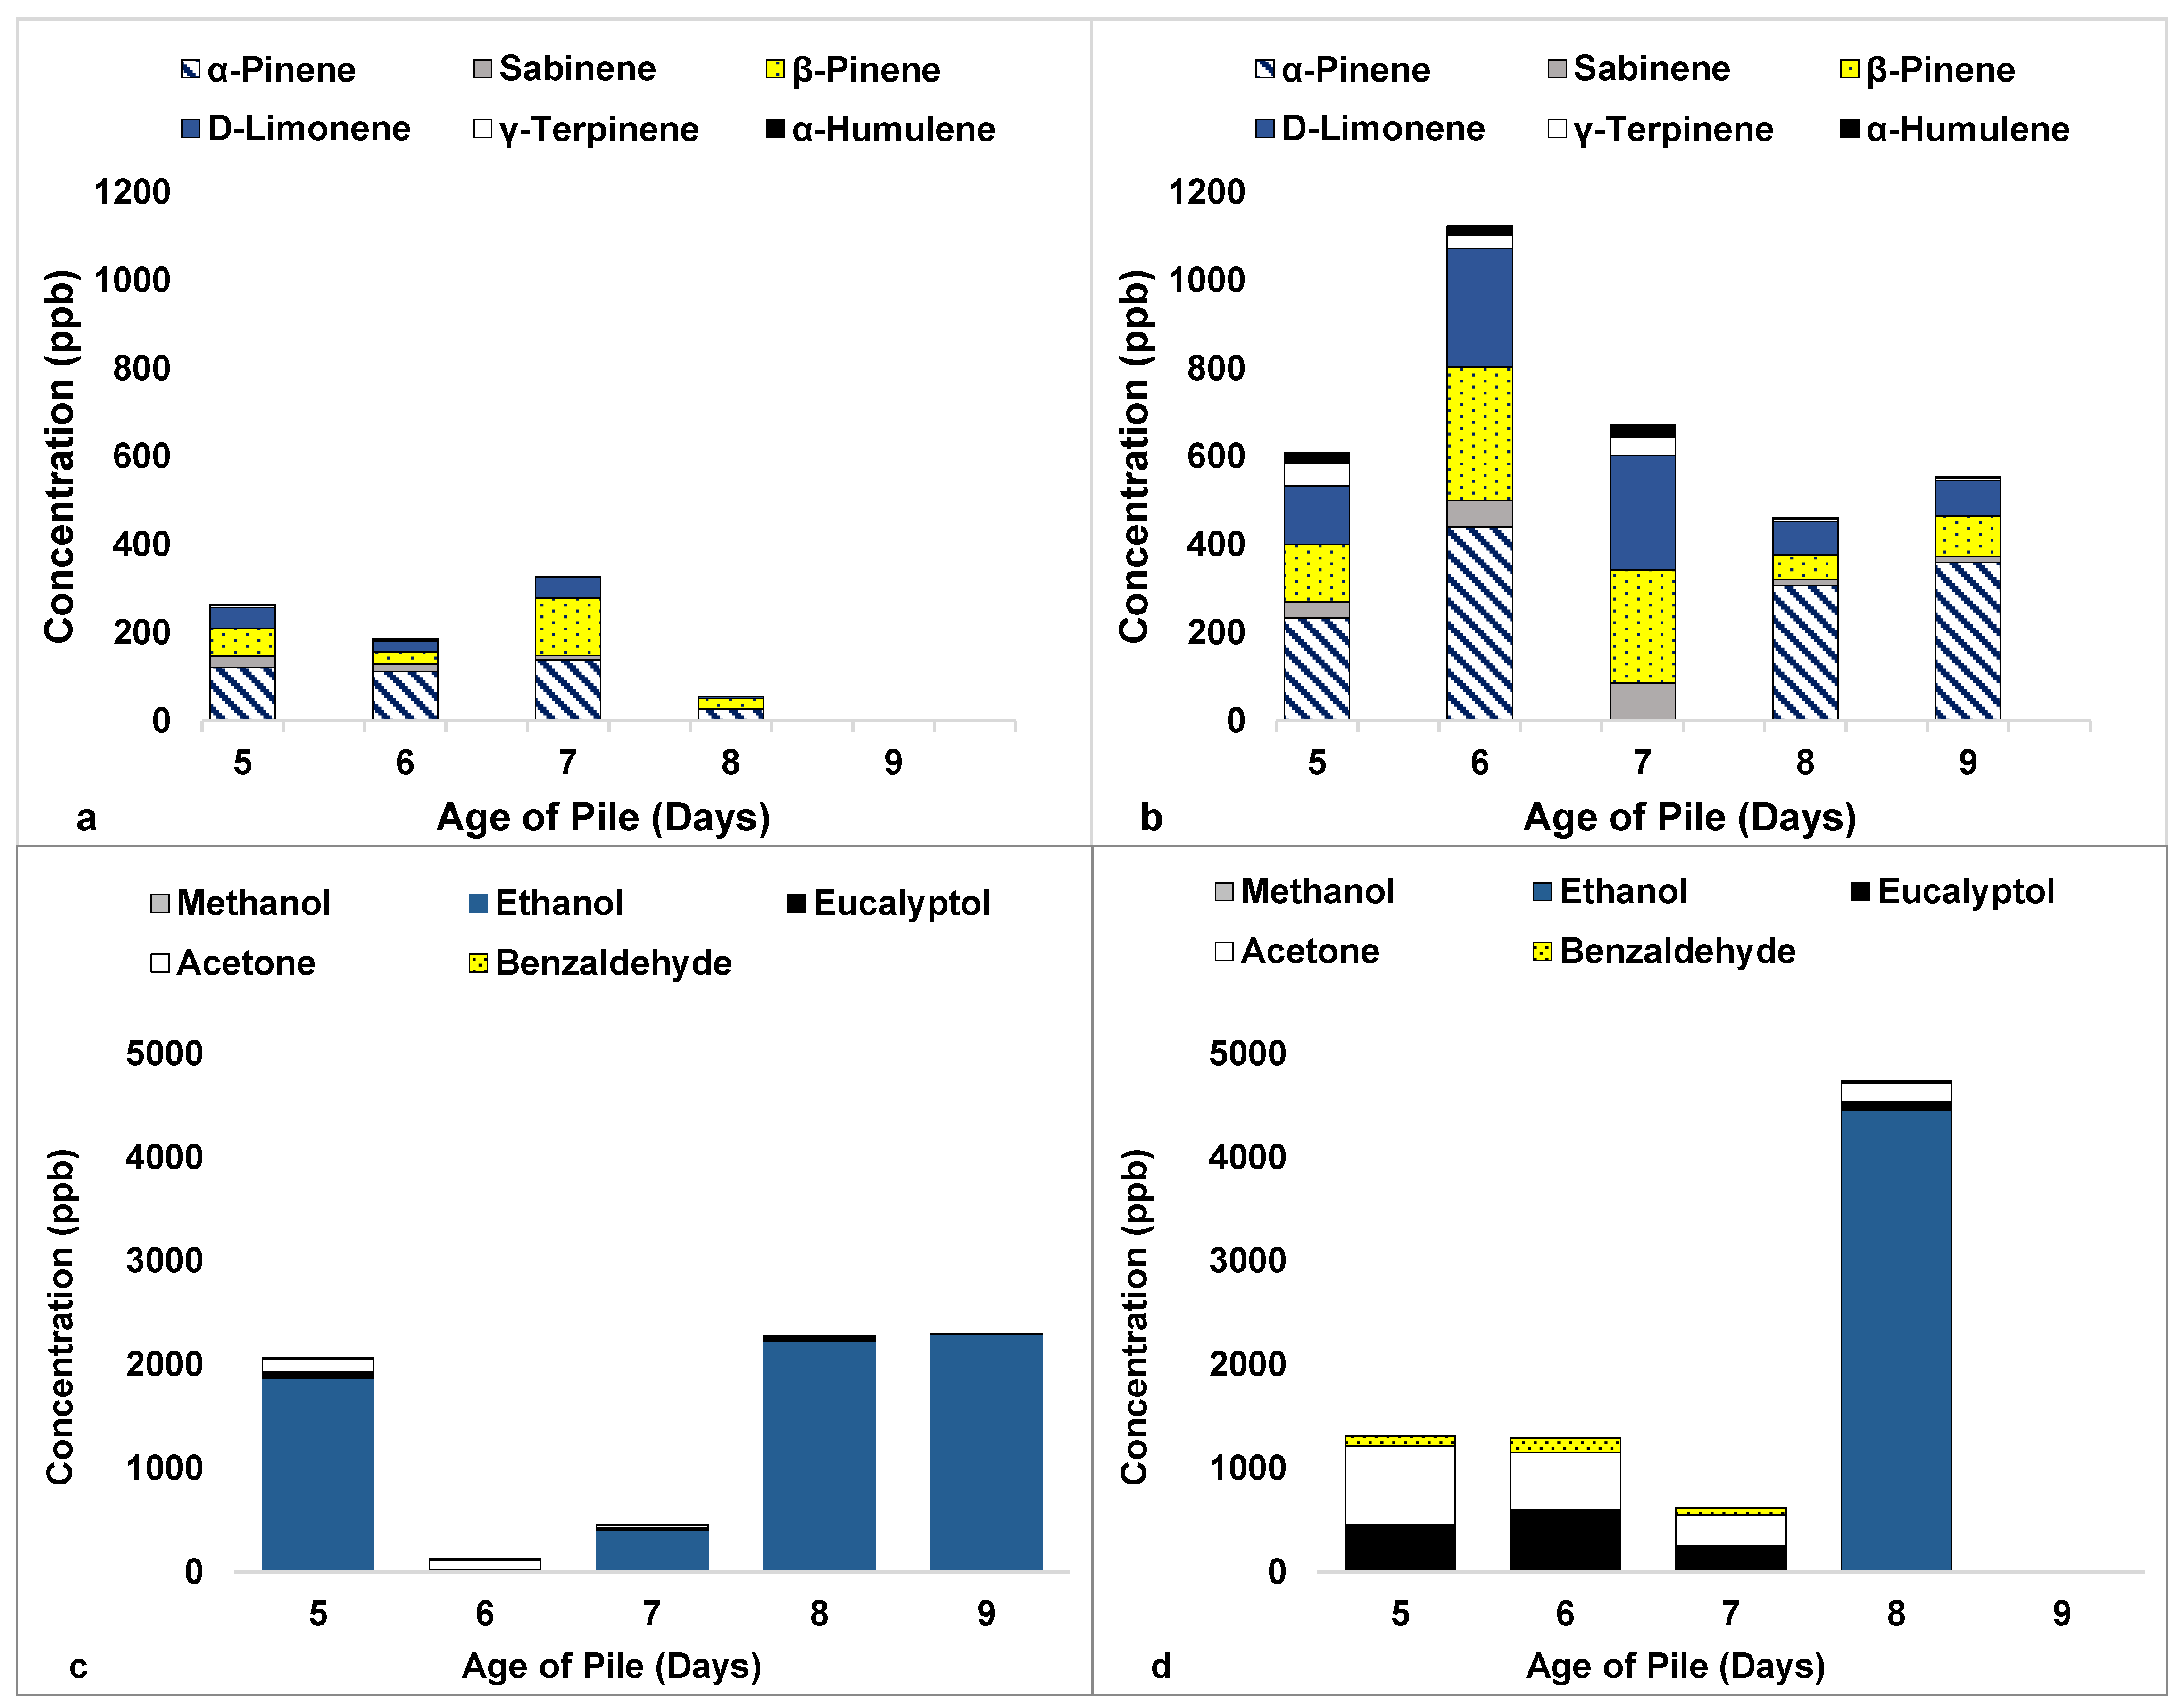
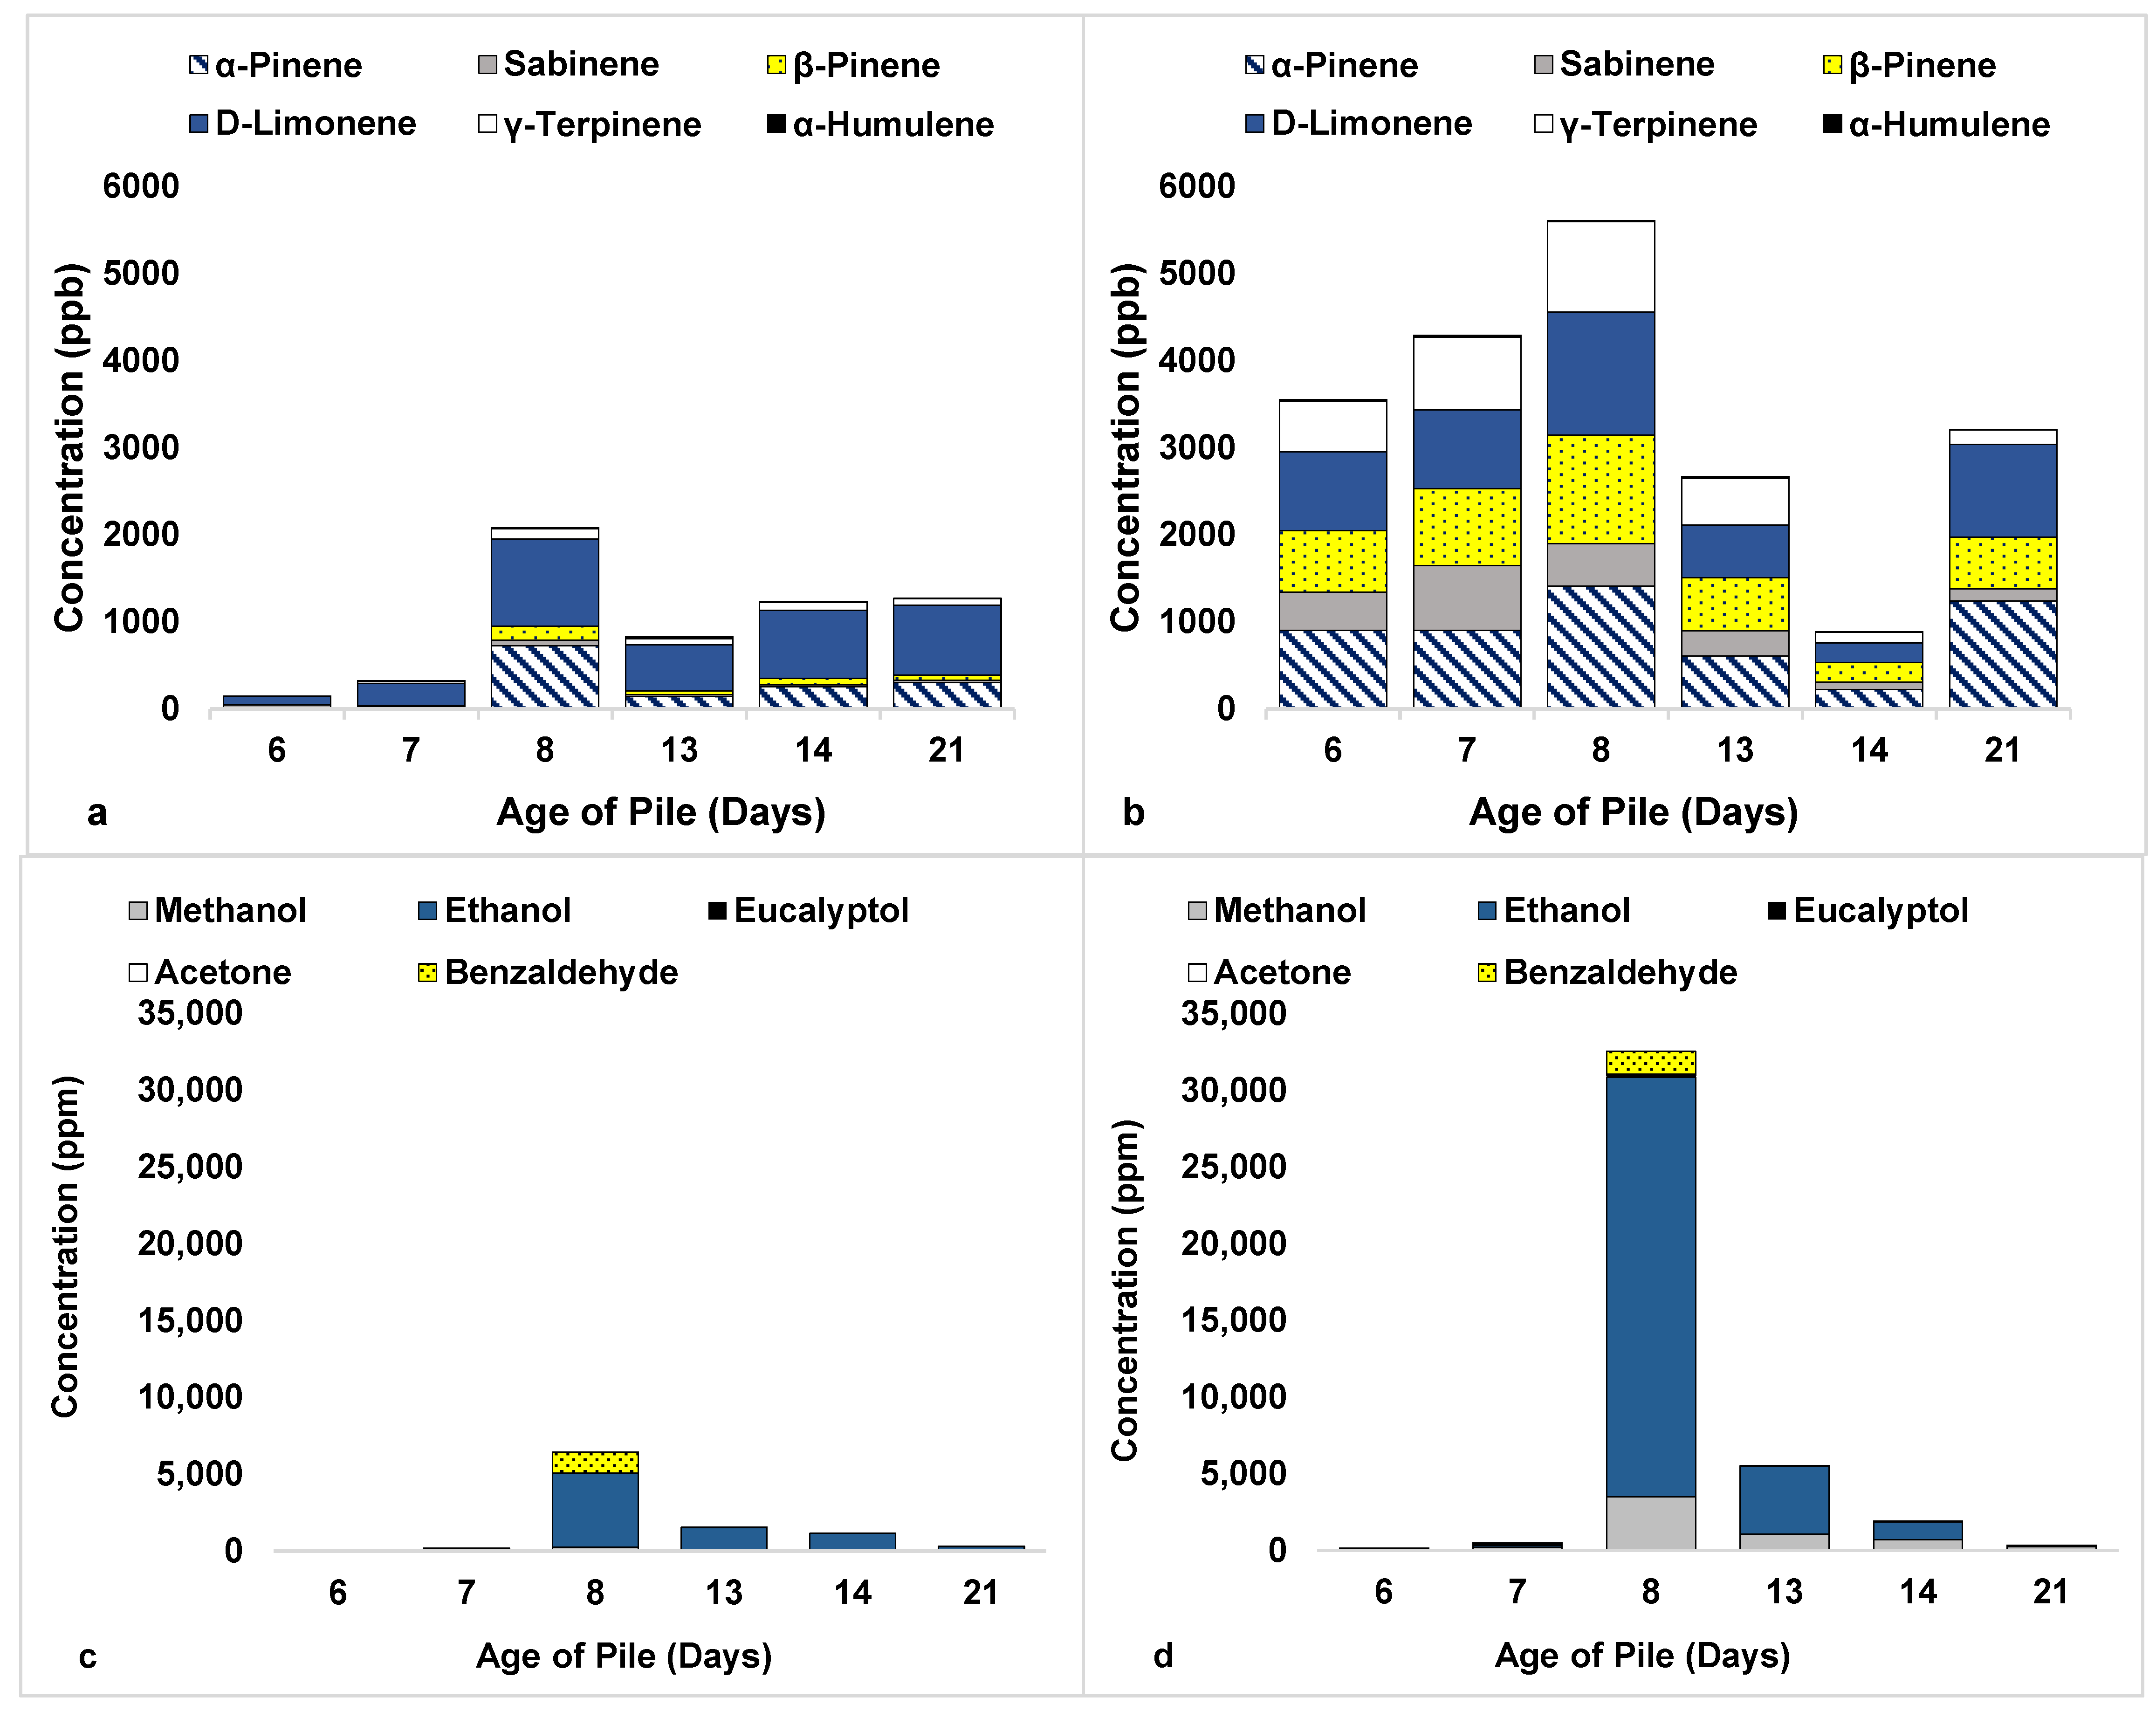
3.2. Compost Experiments

The temperature profiles of the compost piles are shown in Figure 2. For the yard waste (Exp A), pile 1 peaked on day 5, while pile 2 peaked on day 2. Pile 2 had higher temperatures (up to 77.8 °C) sustained over about 10 days compared to pile 1, even though pile 1 initially started at a higher temperature (67.7 °C). For the mixed food/yard waste (Exp B), pile 1 temperatures peaked on days 5 and 10 (72.9 °C and 75.8 °C, respectively), while pile 2 peaked on day 12 (73.0 °C). On average, yard waste temperatures were 45.8 °C and 59.5 °C, and mixed food/yard waste temperatures were 44.9 °C and 60.9 °C, with pile 1 having a lower temperature than pile 2. For ease of reference, pile 1 will be called low-temperature and pile 2 high-temperature for each experiment.
The position of the sampling on the pile did affect the amounts of VOCs collected (Figure 3), with higher concentrations in the middle of the pile vs. the top for terpenes. This was the opposite of the chimney effect that was seen by Büyüksönmez [24]. Figure 4a,b displays the terpene emissions, which are significantly higher in the pile with a higher temperature, leading to concentrations over 1100 ppb in comparison to 300 ppb in the low-temperature pile. There was a decreasing trend after day 7 for the low-temperature pile and day 6 for the high-temperature pile. Water-soluble emissions were also captured during this experiment and are displayed in Figure 4c,d. Concentrations up to 2000 ppb were emitted from the low-temperature pile. Ethanol was the most abundant water-soluble VOC measured in the yard waste, followed by acetone, with emissions still spiking through day 9.
In experiment B, the composition within the piles changed from strictly yard waste (YW) to a mixture of food and yard waste (FY). The terpenes were seen at higher levels compared to the yard waste compost piles, with concentrations reaching up to 2000 ppb for the low-temperature pile and 5500 ppb for the high-temperature pile (Figure 5a,b). Both piles peaked in terpene concentrations on day 8, but had a moderate increase on day 21, or towards the end of the experiment. The mixed food/yard waste piles displayed much higher levels of alcohols, with concentrations reaching upwards of 32,000 ppm for the high-temperature pile and over 7000 ppb for the low-temperature pile (Figure 5c,d). Ethanol was again the most abundant compound in these emissions. A spike of emissions was seen on day 8 in both the low- and high-temperature piles.
A comparison of the emissions from each pile type is shown in Figure 6. For overall terpene emissions, higher levels were seen in the YW pile with concentrations as high as 1600 ppb in comparison to 1250 ppb for FY piles (Figure 6a). Alcohols were seen to have a much higher emission with the FY piles, with concentrations reaching 10,000 ppm, while the YW pile reached 2100 ppb (Figure 6b,c).
The composition, temperature, and age of the pile displayed a variety of trends in terms of the VOC emissions. Mixed food/yard (FY) waste especially showed higher levels of ethanol compared to yard waste alone, with ppm vs. ppb levels. The age of the piles had an overall decreasing trend of emissions once peak emissions were reached, with alpha-pinene and ethanol being the most abundant compounds throughout the experiments. The temperature of the compost pile influenced alcohol and terpene emissions, with the higher-temperature piles leading to an increase in emissions compared to the lower-temperature piles. Hazardous air pollutants were not generally elevated, except methanol and acetone (maximum observed values were 3812 ppm and 98 ppm, respectively). Methanol exceeded the permissible exposure limit for an 8 h time-weighted average (PEL-TWA) of 200 ppm [21]. Since these observations were made inside the piles, and not in the surrounding environment, direct health risk was not calculated, but composting did generate these hazardous gases.

3.3. Comparison to Other Studies

A couple of other similar studies measured the flux of various VOCs using similar GC-MS methods. These are summarized in Table 4. Büyüksönmez and Evans [26] measured terpenes in green waste (grass, wood, and prunings) using coconut shell sorbent material and GC-MS analysis. Alpha-pinene was the main contributor to compost emissions, ranging from 10–153 mg/kg dry weight of compost. They detected five other major terpenes: D-limonene, beta-pinene, beta-myrcene, 3-carene, and camphene. The emissions of terpenes over time from composting were fairly constant from a couple of days old to over 40 days old. The current study also detected D-limonene and beta-pinene in yard waste, with D-limonene also increasing in mixed food/yard waste. A second study by Büyüksönmez [25] utilized the SCAQMD method 25.3 and a Tenax sorbent trap to convert VOCs to total non-methane/ethane VOC signals by oxidizing to carbon dioxide and then methane. The total VOCs in green and food waste were measured via FID-GC, with food waste having more total emissions. More VOC emissions were observed in mixed food/yard waste compared to green/yard waste in the current study, measuring speciated, not total, VOCs.
Kumar et al. [9] utilized an analysis similar to the current study, measuring speciated VOCs in green waste using canisters and GC-MS, as well as measuring the water trap condensate via GC-MS. Their results indicate alcohols as the major contributor of VOC flux, followed by a lesser extent of acids and biogenic VOCs. The current study shows that alcohols are up to ten times more concentrated than terpenes in yard waste emissions, and even an order of magnitude larger for mixed food/yard waste. The current study is an important comparison of both the method and results of Kumar et al. [9], with a focus on the internal concentrations of the compost pile rather than emitted fluxes.
Gonzalez et al. [32] studied greenhouse gases and speciated VOCs using air sampling bags and sorbent tubes on benchtop sewage sludge-based compost. They used TD-GC-MS analysis and observed terpenes, especially alpha-pinene, in the compost emissions, up to 13,299 ppb on day 2, with a large drop to 12.8 ppb on day 11 [32]. Eucalyptol was also observed to be almost as high on day 2, at 13,604 ppb [12]. Comparatively, less Pinene and eucalyptol in both YW and FY compost were observed in the current study, with YW releasing more of these than FY, with measurable levels even up to day 21 (Figure 4 and Figure 5).
Biasioli et al. [33] measured speciated VOCs, including dimethyl sulfide, methanethiol, acetic acid, and acetaldehyde, ranging from 10 to 200 ppb in compost piles, using proton transfer reaction–mass spectrometry (PTR-MS). They utilized air sampling bags to collect the compost, followed by PTR-MS analysis. The current study observed values higher than 200 ppb for many VOCs, but observed only 0.7 ppb dimethyl sulfide, for example.

3.4. Advantages and Limitations

The sampling and analytical techniques of this study show the effective capture of both water-soluble and insoluble VOCs in compost pile emissions. Alcohols, in particular, are 99–100% recovered in the aqueous impinger. Advantages of this method are speciated VOC characterization, decreased exposure of sensitive equipment to humidity, the timeliness and simplicity of the sampling method, and the lower cost compared to canisters and on-line sampling/analysis. A disadvantage of chromatographic analysis is that it can be time-consuming. Limitations of the data presented here include the unique compost piles built at WSU CF, which may not represent all types of yard and food/yard waste compost. Daily sampling of compost piles was not completed due to budgetary and time constraints. Seasonal differences were not accounted for, as the internal pile, not the external one, was sampled. Overall, the characterization was successful at comparing composition, temperature, and age factors that can influence compost emissions, while also verifying the dual-sampling and analytical methods.

4. Conclusions

The developed methodology, which combined water and air analysis of VOC emissions from compost, was successful. Using a cold impinger apparatus, water-soluble compounds were effectively captured with a high percent recovery between 99 and 100%. This technique allowed for removal of moisture interference in subsequent sorbent tube capture of the remaining water-insoluble VOCs.
Two types of compost were analyzed for VOCs (yard waste and food/yard waste) to determine differences in composition and generation of VOCs. Both types emitted a variety of VOCs, including terpenes (alpha- and beta-pinene, D-limonene, gamma-terpinene, sabinene, and alpha-humulene) and alcohols (methanol, ethanol, eucalyptol, acetone, and benzaldehyde). Food/yard waste compost produced ethanol up to 27,400 ppm. The highest emissions seen in the timed trials were alpha-pinene and D-limonene of the terpenes, and ethanol and methanol of the alcohols, both between days 7 and 8. Overall, higher emissions were seen at higher temperatures. The composition of the pile influenced the emissions seen with more alcohols produced in the mixed food/yard waste versus yard waste, and terpenes were more present in the yard waste pile. The location of sampling in the pile also affected VOCs, with more concentrated VOCs towards the middle (versus the top) of the pile.
The applications of this study include air pollution monitoring, VOC emission factors, and regulatory standards. Food/yard waste, for example, had elevated alcohol emissions within the pile. These emissions can be remediated by the use of biofilters, control of temperature or aeration, and/or other variables. In addition, VOC speciation of compost emissions can be utilized in the exposure assessment of compost facility workers and nearby residential communities, and subsequent health risks from compost emissions.

Supplementary Materials

The following supporting information can be downloaded at https://www.mdpi.com/article/10.3390/atmos16050591/s1: Table S1: Overview of Volatile Organic Compound (VOC) information for Headspace-Gas Chromatography analytical method; Table S2: Overview of Volatile Organic Compound (VOC) information for Thermal Desorption-Gas Chromatography-Mass Spectrometry analytical method; Figure S1: Annotated chromatograms of alcohol standard from the HS-GC-FID and terpene standard from the TD-GC-MS; Figure S2: Duplicate trials conducted with Teflon tubing in no ice, and ice prior to the impinger in ice bath.

Author Contributions

Conceptualization, B.T.J. and N.A.C.J.; methodology, S.K.B., R.C.M., K.A.M., K.C.W., B.T.J. and N.A.C.J.; validation, S.K.B., R.C.M., K.A.M., K.C.W. and N.A.C.J.; formal analysis, S.K.B., R.C.M., K.A.M., K.C.W. and N.A.C.J.; investigation, S.K.B., R.C.M., K.A.M., K.C.W., B.T.J. and N.A.C.J.; resources, B.T.J. and N.A.C.J.; data curation, S.K.B., R.C.M., K.A.M., K.C.W. and N.A.C.J.; writing—original draft preparation, S.K.B., R.C.M. and N.A.C.J.; writing—review and editing, S.K.B., R.C.M., K.A.M., K.C.W., B.T.J. and N.A.C.J.; visualization, S.K.B., R.C.M., K.A.M., K.C.W., B.T.J. and N.A.C.J.; supervision, N.A.C.J.; project administration, B.T.J. and N.A.C.J.; funding acquisition, B.T.J. and N.A.C.J. All authors have read and agreed to the published version of the manuscript.

Funding

The project described was supported by an Institutional Development Award (IDeA) from the National Institute of General Medical Sciences of the National Institutes of Health under Grant #P20GM103408, the National Science Foundation’s REU program under grant number AGS-1757711, and the Idaho State Board of Education Higher Education Research Council.

Institutional Review Board Statement

Not applicable.

Informed Consent Statement

Not applicable.

Data Availability Statement

The original data presented in the study are openly available in Mendeley Data at doi: 10.17632/9t9d6f4kjc.2.

Acknowledgments

Thank you to Lewis-Clark State College for support, as well as Washington State University Compost Facility.

Conflicts of Interest

The authors declare no conflicts of interest. The funders had no role in the design of the study; in the collection, analyses, or interpretation of data; in the writing of the manuscript; or in the decision to publish the results.

Abbreviations

The following abbreviations are used in this manuscript:
VOCVolatile organic compound
TD-GC-MSThermal desorption–gas chromatography–mass spectrometry
HS-GCFIDHeadspace gas chromatography–flame ionization detection
US EPAUnited States Environmental Protection Agency
SCAQMDSouth Coast Air Quality Management District
YWYard waste
FYCombined food-yard waste
EPAEnvironmental Protection Agency
OSHAOccupational Safety and Health Administration
PELPermissible exposure limit
TWATime-weighted average
WSU CFWashington State University Compost Facility
ppmParts per million
ppbParts per billion

References

  1. Ho, T.T.K.; Tra, V.T.; Le, T.H.; Nguyen, N.K.Q.; Tran, C.S.; Nguyen, P.T.; Vo, T.D.H.; Thai, V.N.; Bui, X.T. Compost to improve sustainable soil cultivation and crop productivity. Case Stud. Chem. Environ. Eng. 2022, 6, 100211. [Google Scholar] [CrossRef]
  2. Stentiford, E.I. Composting Control: Principles and Practice. In The Science of Composting; Springer: Dordrecht, The Netherlands, 1996; pp. 49–59. [Google Scholar] [CrossRef]
  3. Abduli, M.A.; Naghib, A.; Yonesi, M.; Akbari, A. Life cycle assessment (LCA) of solid waste management strategies in Tehran: Landfill and composting plus landfill. Environ. Monit. Assess. 2011, 178, 487–498. [Google Scholar] [CrossRef]
  4. Sánchez, A.; Artola, A.; Font, X.; Gea, T.; Barrena, R.; Gabriel, D.; Sánchez-Monedero, M.Á.; Roig, A.; Cayuela, M.L.; Mondini, C. Greenhouse gas emissions from organic waste composting. Environ. Chem. Lett. 2015, 13, 223–238. [Google Scholar] [CrossRef]
  5. Anglou, F.Z.; Sanders, R.E.; Stamatopoulos, I. Of the first five US states with food waste bans, Massachusetts alone has reduced landfill waste. Science 2024, 385, 1236–1240. [Google Scholar] [CrossRef]
  6. Chen, M.; Huang, Y.; Liu, H.; Xie, S.; Abbas, F. Impact of different nitrogen source on the compost quality and greenhouse gas emissions during composting of garden waste. Process Saf. Environ. Prot. 2019, 124, 326–335. [Google Scholar] [CrossRef]
  7. Limbri, H.; Gunawan, C.; Thomas, T.; Smith, A.; Scott, J.; Rosche, B. Coal-packed methane biofilter for mitigation of green house gas emissions from coal mine ventilation air. PLoS ONE 2014, 9, e94641. [Google Scholar] [CrossRef] [PubMed]
  8. Dang, C.; Wu, Z.; Zhang, M.; Li, X.; Sun, Y.; Wu, R.; Zheng, Y.; Xia, Y. Microorganisms as bio-filters to mitigate greenhouse gas emissions from high-altitude permafrost revealed by nanopore-based metagenomics. IMeta 2022, 1, e24. [Google Scholar] [CrossRef]
  9. Kumar, A.; Alaimo, C.P.; Horowitz, R.; Mitloehner, F.M.; Kleeman, M.J.; Green, P.G. Volatile organic compound emissions from green waste composting: Characterization and ozone formation. Atmos. Environ. 2011, 45, 1841–1848. [Google Scholar] [CrossRef]
  10. Lou, X.F.; Nair, J. The impact of landfilling and composting on greenhouse gas emissions—A review. Bioresour. Technol. 2009, 100, 3792–3798. [Google Scholar] [CrossRef]
  11. Zheng, G.; Liu, J.; Shao, Z.; Chen, T. Emission characteristics and health risk assessment of VOCs from a food waste anaerobic digestion plant: A case study of Suzhou, China. Environ. Pollut. 2020, 257, 113546. [Google Scholar] [CrossRef]
  12. Nair, A.T.; Senthilnathan, J.; Nagendra, S.M.S. Emerging perspectives on VOC emissions from landfill sites: Impact on tropospheric chemistry and local air quality. Process Saf. Environ. Prot. 2019, 121, 143–154. [Google Scholar] [CrossRef]
  13. Andersen, J.K.; Boldrin, A.; Samuelsson, J.; Christensen, T.H.; Scheutz, C. Quantification of Greenhouse Gas Emissions from Windrow Composting of Garden Waste. J. Environ. Qual. 2010, 39, 713–724. [Google Scholar] [CrossRef]
  14. Pagans, E.; Font, X.; Sánchez, A. Emission of volatile organic compounds from composting of different solid wastes: Abatement by biofiltration. J. Hazard. Mater. 2006, 131, 179–186. [Google Scholar] [CrossRef]
  15. Van Durme, G.P.; McNamara, B.F.; McGinley, C.M. Bench-Scale Removal of Odor and Volatile Organic Compounds at a Composting Facility. Water Environ. Res. 1992, 64, 19–27. Available online: https://www-jstor-org.uidaho.idm.oclc.org/stable/25044110?sid=primo (accessed on 2 February 2025). [CrossRef]
  16. Müller, T.; Thißen, R.; Braun, S.; Dott, W.; Fischer, G. (M)VOC and composting facilities: Part 1: (M)VOC emissions from municipal biowaste and plant refuse. Environ. Sci. Pollut. Res. 2004, 11, 91–97. [Google Scholar] [CrossRef]
  17. Schiavon, M.; Martini, L.M.; Corrà, C.; Scapinello, M.; Coller, G.; Tosi, P.; Ragazzi, M. Characterization of volatile organic compounds (VOCs) released by the composting of different waste matrices. Environ. Pollut. 2017, 231, 845–853. [Google Scholar] [CrossRef] [PubMed]
  18. Akdeniz, N.; Koziel, J.A.; Ahn, H.K.; Glanville, T.D.; Crawford, B.P.; Raman, D.R. Laboratory scale evaluation of volatile organic compound emissions as indication of swine carcass degradation inside biosecure composting units. Bioresour. Technol. 2010, 101, 71–78. [Google Scholar] [CrossRef] [PubMed]
  19. US EPA. (n.d.). Initial List of Hazardous Air Pollutants with Modifications|US EPA. Available online: https://www.epa.gov/haps/initial-list-hazardous-air-pollutants-modifications (accessed on 7 May 2025).
  20. Srinivasan, S.; Divahar, R. Nature Environment and Pollution Technology An International Quarterly Scientific Journal Odor Emissions from Municipal Solid Waste Open Dumps Constituting Health Problems Due to their Composition, Ecological Impacts and Potential Health Risks. Nat. Environ. Pollut. Technol. 2025, 24, 1–10. [Google Scholar] [CrossRef]
  21. US OSHA. (n.d.). TABLE Z-1—TABLE Z-1 Limits for Air Contaminants|Occupational Safety and Health Administration. Available online: https://www.osha.gov/laws-regs/regulations/standardnumber/1910/1910.1000TABLEZ1 (accessed on 7 May 2025).
  22. Nordahl, S.L.; Preble, C.v.; Kirchstetter, T.W.; Scown, C.D. Greenhouse Gas and Air Pollutant Emissions from Composting. Environ. Sci. Technol. 2023, 57, 2235–2247. [Google Scholar] [CrossRef]
  23. Ham, R.K.; Komilis, D. A Laboratory Study to Investigate Gaseous Emissions and Solids Decomposition During Composting of Municipal Solid Wastes; US EPA Report; United States Environmental Protection Agency, Office of Research and Development: Washington, DC, USA, 2003.
  24. Bhattacharya, S.S.; Kim, K.H.; Ullah, M.A.; Goswami, L.; Sahariah, B.; Bhattacharyya, P.; Cho, S.B.; Hwang, O.H. The effects of composting approaches on the emissions of anthropogenic volatile organic compounds: A comparison between vermicomposting and general aerobic composting. Environ. Pollut. 2016, 208, 600–607. [Google Scholar] [CrossRef]
  25. Büyüksönmez, F. Full-Scale VOC Emissions from Green And Food Waste Windrow Composting [Article]. Compost Sci. Util. 2012, 20, 57–62. [Google Scholar] [CrossRef]
  26. Büyüksönmez, F.; Evans, J. Biogenic emissions from green waste and comparison to the emissions resulting from composting. Part II. Volatile organic compounds (VOCs) [Article]. Compost Sci. Util. 2007, 15, 191–199. [Google Scholar] [CrossRef]
  27. South Coast Air Quality Management District. Method 25.3 Determination of Low Concentration Non-Methane Non-Ethane Organic Compound Emissions from Clean Fueled Combustion Sources Monitoring and Engineering Branch Monitoring and Analysis. 2000. Available online: http://www.aqmd.gov/docs/default-source/laboratory-procedures/methods-procedures/stm-025-3.pdf (accessed on 30 November 2024).
  28. Johnston, N. LCSC VOC Compost Dataset 2022; V2; Mendeley Data: London, UK, 2025. [Google Scholar]
  29. US EPA. Compendium Method TO-17 Determination of Volatile Organic Compounds in Ambient Air Using Active Sampling Onto Sorbent Tubes. 1999. Available online: https://www.epa.gov/sites/default/files/2019-11/documents/to-17r.pdf (accessed on 15 March 2022).
  30. Scott, P.S.; Andrew, J.P.; Bundy, B.A.; Grimm, B.K.; Hamann, M.A.; Ketcherside, D.T.; Li, J.; Manangquil, M.Y.; Nuñez, L.A.; Pittman, D.L.; et al. Observations of volatile organic and sulfur compounds in ambient air and health risk assessment near a paper mill in rural Idaho, U.S.A. Atmos. Pollut. Res. 2020, 11, 1870–1881. [Google Scholar] [CrossRef] [PubMed]
  31. Dickinson, G.N.; Miller, D.D.; Bajracharya, A.; Bruchard, W.; Durbin, T.A.; McGarry, J.K.P.; Moser, E.P.; Nuñez, L.A.; Pukkila, E.J.; Scott, P.S.; et al. Health Risk Implications of Volatile Organic Compounds in Wildfire Smoke During the 2019 FIREX-AQ Campaign and Beyond. GeoHealth 2022, 6, e2021GH000546. [Google Scholar] [CrossRef]
  32. González, D.; Guerra, N.; Colón, J.; Gabriel, D.; Ponsá, S.; Sánchez, A. Characterization of the Gaseous and Odour Emissions from the Composting of Conventional Sewage Sludge. Atmosphere 2020, 11, 211. [Google Scholar] [CrossRef]
  33. Biasioli, F.; Aprea, E.; Gasperi, F.; Mä, T.D.; Biasioli, A.F. Measuring odour emission and biofilter efficiency in composting plants by proton transfer reaction-mass spectrometry. Water Sci. Technol. 2009, 59, 1263–1269. [Google Scholar] [CrossRef]
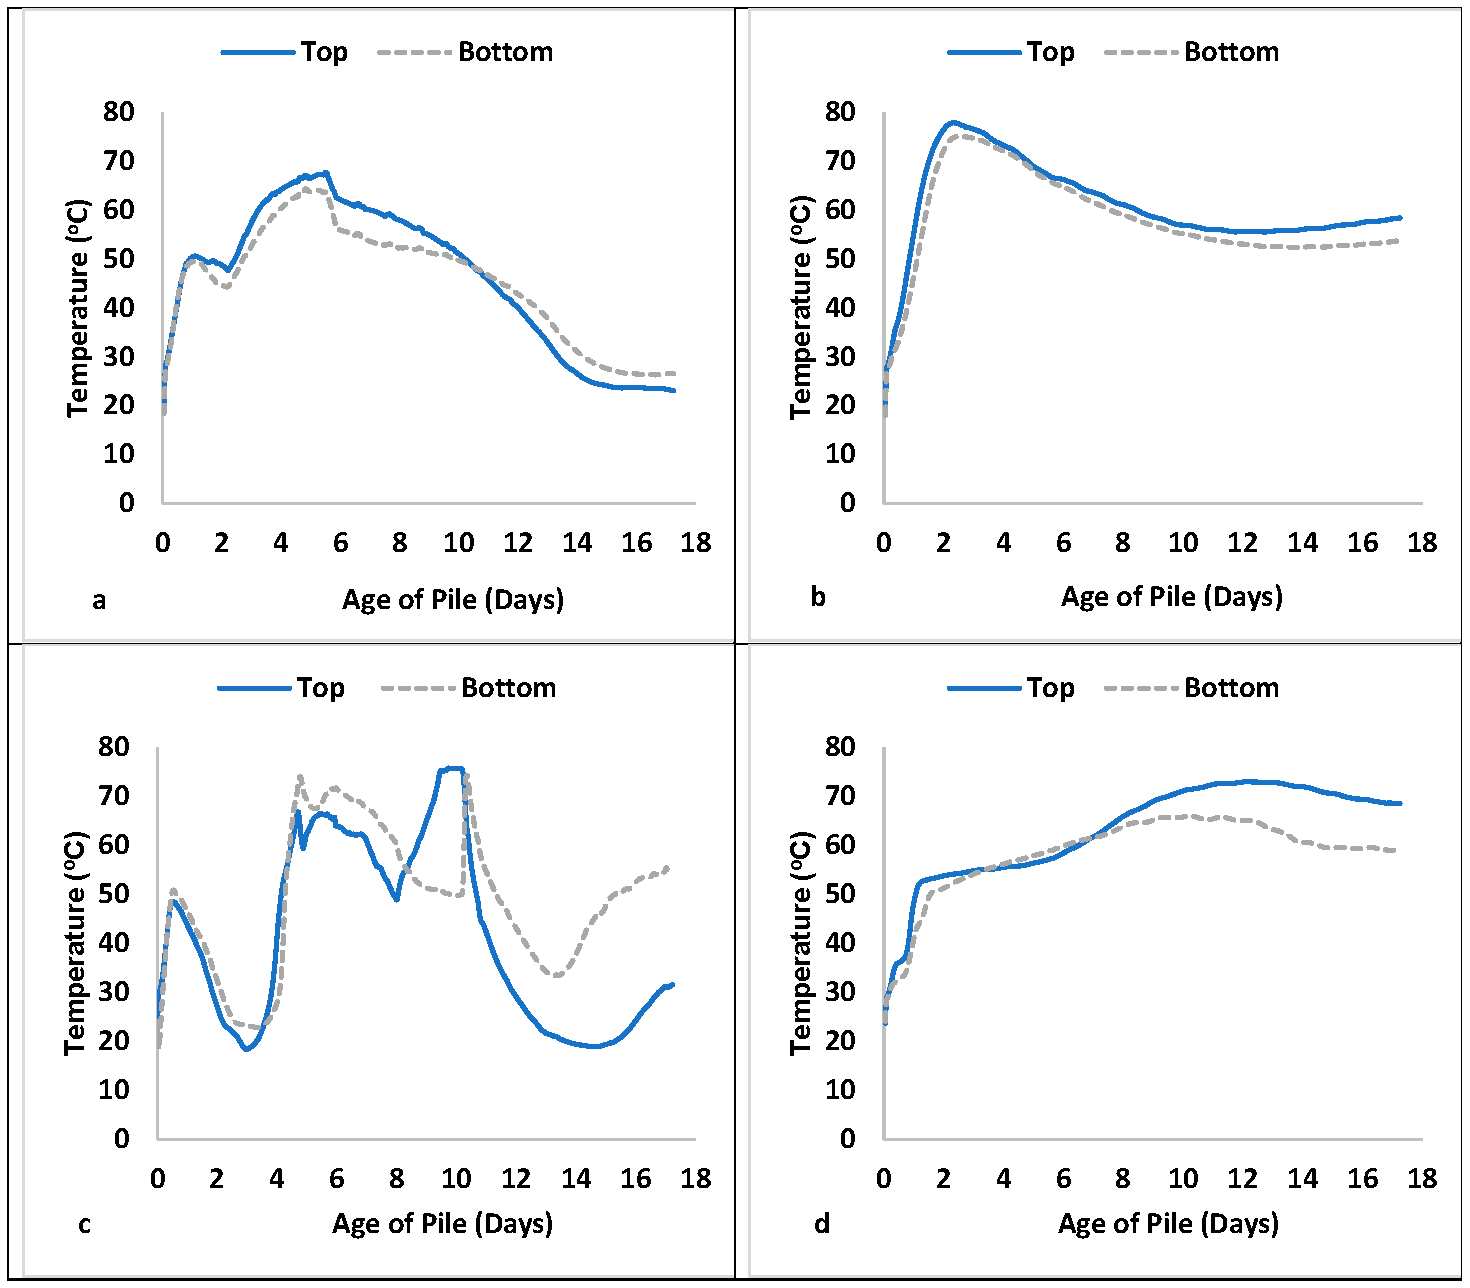
Figure 1. Schematic of the compost sampling setup used for simultaneous collection of air- and water-soluble analytes. (1) Stainless steel soil probe inserted into the (2) compost pile enables sampling of emitted volatiles. The air is pulled sequentially through (3) a cooler containing ice, (4) a 10 mL collection tube housed within a Teflon impinger submerged in an ice bath (for water-soluble compounds), and (5) a dual bed sorbent tube with Tenax-TA and Sulficarb (for water-insoluble compounds), while being drawn into the (6) Gilian™ air sampling pump. Components 16 are connected via Teflon tubing, with blue arrows indicating the direction of airflow. A support stand (7) secures the air pump and sorbent tube in place throughout the sampling process. Created in BioRender. McCown, K. (2025) https://BioRender.com/kf03yvd.
Atmosphere 16 00591 g001
Figure 2. Average temperature profiles of the compost piles studied, from probes located on the top and bottom of piles. (a) Yard waste (YW), low-temperature compost; (b) YW, high-temperature compost; (c) mixed food/yard waste (FY), low-temperature compost; (d) FY, high temperature.
Atmosphere 16 00591 g002
Figure 3. Comparison of emissions at two sampling locations: the middle and top of the piles. The middle of the pile showed overall higher concentrations, with the exception of alpha-pinene. Results are from the thermal desorption–gas chromatography–mass spectrometry (TD-GC-MS) method and yard waste, high-temperature experiment (Exp A, YW, Pile 2).
Atmosphere 16 00591 g003
Figure 4. Terpene emissions over time from (a) yard waste (YW), low-temperature compost pile, and (b) YW, high-temperature compost pile, via TD-GC-MS analysis (water-insoluble). Alcohol and other VOC emissions over five consecutive days from (c) YW, low-temperature compost pile (d) YW, high-temperature compost pile, via HS-GC analysis (water soluble).
Atmosphere 16 00591 g004
Figure 5. Terpene emissions over time from (a) food/yard waste (FY), low-temperature compost pile, (b) FY, high-temperature compost pile, via TD-GC-MS analysis (water-insoluble). Alcohol and VOC emissions over time from (c) FY, low-temperature compost pile, and (d) FY, high-temperature compost pile, via HS-GC analysis (water-soluble).
Atmosphere 16 00591 g005
Figure 6. Range in emissions of alcohols, terpenes, and other VOC emissions among different types of compost over the course of the study (a) via TD-GC-MS analysis (water insoluble); (b,c) via HS-GC analysis (water soluble).
Atmosphere 16 00591 g006
Table 1. Compost pile conditions.
ExperimentPile Build Date/Time (PDT)Feed Stock/CompositionPile 1 Temperature ProfilePile 2 Temperature ProfilePile 1 AerationPile 2 AerationPile Cover
A13 July 2022 12:00Yard Waste (1)Low High NegativeNegativeNo
B26 August 2022 15:00Mixed Food/Yard Waste (2,3)LowHighNegativeNegativeYes, screened fines from A piles
(1) Whitman County ground green waste, ground in summer, and remnants of the ground pile 1 month later. (2) New Whitman County, summer-collected green waste was ground by Cannon Hill at the Whitman County Transfer site in August 2022 and trucked by WSU to the WSU Compost Yard. (3) Includes ground wood waste material from the Asotin landfill.
Table 2. Summary of dual sampling and analytical methods.
Target CompoundsWater-Insoluble VOCs
(Hydrocarbons, Terpenes)
Water-Soluble VOCs
(Alcohols, Aldehydes, Ketones)
Sample TypeDual Sorbent Tube (gas phase)Impinger (aqueous)
InstrumentMarkes International Unity 2 Thermal Desorption Unit (TD)/Agilent 7820 Gas Chromatograph/5977 Mass Spectrometer (GCMS)Agilent 7697 HeadSpace/7890 Gas Chromatograph (GC-FID)
Carrier GasUltra-high purity helium, 1.5 mL/minUltra-high purity helium, 1 mL/min
Split RatioVaried (split-less to 1:89)Varied 1:2–1:100
Column Agilent DB-624, 60 m, 0.32 mm ID, 1.8 µm thicknessJ&W DB-624, 30 m, 0.32 mm ID, 1.8 µm thickness
Temperature (°C) ProgrammingTD
Pre-purge 2 min, Cold trap −5 °C
Tube desorption: 50 °C for 5 min then 200 °C for 10 min
Cold trap desorption 250 °C for 10 min
GC
40 °C hold 2 min
Ramp1—40–195 °C
Ramp2—195–250 °C, hold 2 min
MS
230 °C source
150 °C quadruple
HS
70 °C
80 °C
200 °C transfer line
GC
40 °C to 195 °C
Ramp—10 °C/min
FID 250 °C
DetectorQuadruple Electron Ionization
Mass Spectrometer
45–300 amu/z
Voltage = 1801 volts
Flame Ionization Detector with
ultra-high purity hydrogen/zero air fuel
Table 3. Example of distribution of overlapping compounds between the aqueous (HS-GC-FID) and gas (TD-GC-MS) phases and techniques, as well as mean percent recovery of the impinger (see Equation (4)). Total concentration reflects the sum of both phases.
CompoundHS-GC-FID Concentration (ppb)TD-GC-MS Concentration (ppb)Total Concentration (ppb)Percent Recovery (%) ImpingerMean Percent Recovery (%) Impinger
Ethanol548,0802155550,2359999.0
Guaiacol66,950066,950100100.0
Eucalyptol50,4821950,5019999.9
1-Butanol5490549100100.0
Isopropanol35,05213035,1829999.5
D-limonene141389,86391,2761.548.3
alpha-Pinene2081413162112.87.7
beta-Pinene4641345910.031.6
Table 4. Comparison of the current study with other VOC compost studies.
StudyCompost TypeSampling/Analytical TechniqueGases MeasuredObservations
(Maximum or Ranges)
Current studyYard and food/yard wasteImpinger water trap/HS-GC-FID, Tenax sorbent/TD-GC-MSMethanol
Ethanol
Alpha-pinene
Beta-pinene
D-limonene
3800 ppm
27,400 ppm
1638 ppb
1637 ppb
1750 ppb
Büyüksönmez and Evans [26]Green waste Coconut shell sorbent/GC-MS Alpha-pinene
Beta-pinene
D-limonene
10–153 mg/kg
1–49 mg/kg
0.1–58 mg/kg
Büyüksönmez [25]Green and food wasteSCAQMD method 25.3/Tenax sorbent/GC-FIDTotal non-methane/ethane
VOC
2–40 ppm
Kumar et al. [9]Green wasteWater trap, canisters, GC-MSSpeciated VOCs, alcohols, terpenes, acids2.6–13 mg/m2/min
Gonzalez et al. [32]Benchtop sewage-sludge Air bags/sorbent tubes/TD-GC-MSAlpha-pinene
Beta-pinene
D-limonene
Eucalyptol
13,299 ppb
6390 ppb
5490 ppb
13,605 ppb
Biasioli et al. [33]Compost piles with and without biofilterAir bags, proton transfer reaction–mass spectrometryDimethyl sulfide
methanethiol
acetic acid
acetaldehyde
20 ppb
10 ppb
100 ppb
200 ppb
Disclaimer/Publisher’s Note: The statements, opinions and data contained in all publications are solely those of the individual author(s) and contributor(s) and not of MDPI and/or the editor(s). MDPI and/or the editor(s) disclaim responsibility for any injury to people or property resulting from any ideas, methods, instructions or products referred to in the content.

