3.2. Criteria for Eligible Data for the Road-Suspended Dust and Texture Factors
The road dust emission measurement system quantifies the sL values at the site and records dust concentrations at 1 s intervals using DustTrak equipment via a mobile laboratory on pavements, correlating these values with the sL data. The effect of sL (dust inhalation due to the vacuum cleaner) could influence the data when measuring, potentially introducing measurements outside the device’s range and affecting the correlation analysis. To mitigate these factors and select valid data, a well-defined data processing criterion is essential.
Table 1 presents the suspended dust values measured five times before and after sL sampling at speeds of 30–50 km/h to minimize measurement errors. The average resuspended dust value before sL collection was 35.4, 52.8, and 77 μg/m
3, while after sL collection, the average values decreased by 88.35% to 10.3, 12.8, and 17.2 μg/m
3, respectively. The average reduction rate of road-suspended dust was 74.8%. Therefore, measuring suspended dust after sL collection may introduce limitations when determining dust concentrations based on sL. To summarize, the data acquisition process incorporates four key components aimed at minimizing the loss of sL data, as follows:
Suspended Dust Measurement: The section is initially measured for background dust concentration before the sL measurement. If the difference between the background dust concentration and the suspended dust concentration is negative, it is attributed to the influence of surrounding vehicles and excluded from the data.
sL Measurement: subsequently, the sL value is measured to determine the amount of dust per unit area within the section.
Road Surface Texture Measurement: after the dust collection process, the road surface texture depth and wavelength are measured to evaluate the texture of the road surface with a clean status of texture depth and distance of aggregate.
For silt loading (sL), dust collection was carried out over a 3 m section using an advanced sampling technique, with the aim of correlating suspended dust concentrations with specific sL values. This 3 m length corresponds to 10 consecutive measurements, each covering 0.3 m, which is consistent with the inlet length of industrial vacuum cleaners employed by the EPA. It is recommended to perform at least 10 measurements to improve the reliability of the dust collection process [
23,
24]. During texture measurement, the average wavelength was determined by evaluating aggregate exposure using specialized equipment across various asphalt pavement types. Furthermore, the average road surface texture depth was measured using the Sand Patch Test (SPT) method. To ensure thorough data collection, approximately 100 data points were recorded along a 100 m section, with the front and rear sections separated to minimize the influence of continuous road segments throughout the entire length. The step is described in
Figure 6.
3.3. Average Texture Depth and Wavelength on Different Type of Asphalt Pavement
The average wavelength was determined by analyzing aggregate exposure using specialized measurement equipment, while the mean texture depth (MTD) was assessed through the Sand Patch Test (SPT) method. As presented in
Table 2, the average wavelength for Hot Mix Asphalt (HMA) pavement at Site C was 3.854 mm, whereas Sites D and E exhibited comparable values of 4.291 mm and 4.391 mm, respectively. The corresponding MTD values were 0.63 mm, 0.99 mm, and 0.8 mm, indicating variations in surface texture characteristics. For porous pavement (PP), the average wavelength measured 4.6 mm, with an MTD of 1.71 mm, signifying a relatively deeper surface texture. In contrast, HMA at the same location demonstrated a significantly lower MTD of 0.45 mm. At Site B, the average wavelength remained consistent at 3.4 mm across all pavement types. However, while HMA exhibited an MTD of 0.5 mm, asphalt grooving pavement—both longitudinal and transverse—demonstrated a notably higher MTD of 1.01 mm, suggesting an enhanced surface macrotexture due to the grooving process.
These findings underscore the influence of pavement type and surface treatment on texture depth, which is a critical factor in skid resistance and surface drainage performance. The results further reinforce this, as variations in MTD were observed even among HMA pavements, indicating differences in surface deterioration and wear progression depending on site-specific conditions and material properties.
The measurement of road-suspended dust was conducted using a mobile laboratory, assessing dust emission factors for both porous pavement (PP) and Hot Mix Asphalt (HMA) pavement over a 150 m section at Site A. The TRAKER-based method, employing an inlet-equipped system, measured road dust concentrations at a driving speed of 50 km/h. Described in
Table 3, among the sites, Site D exhibited the highest road dust load, with an sL value of 0.224.26 g/m
2 and an average PM
10 content of 6.82%, indicating a significant accumulation of dust. This site, located on a university road without active cleaning measures, depends entirely on natural environmental factors (e.g., rain, snow) for dust removal, which contributes to the elevated dust levels. In contrast, Site C recorded the lowest sL value of 0.0484 g/m
2 and the lowest PM₁₀ content, reflecting minimal suspended dust concentration under the same driving conditions.
At Site A, where both porous pavement (PP) and Hot Mix Asphalt (HMA) were evaluated, significant differences were observed. The PP pavement exhibited a higher sL value of 0.1121 g/m2 compared to 0.062 g/m2 for HMA. Despite this higher road dust load, the PM₁₀ content of PP (4.28%) was notably lower than that of HMA (15.84%), suggesting that PP retains larger particles within its surface voids, which reduces the resuspension of fine particulate matter. At Site B, where HMA and asphalt grooving pavements were compared, variations in dust emissions based on surface treatment were evident. The sL value for HMA was 0.0199 g/m2, while asphalt grooving (horizontal) recorded 0.1113 g/m2, and asphalt grooving (longitudinal) recorded the highest at 0.1671 g/m2. Despite these differences in sL values, the PM10 content remained relatively low across all pavement types, ranging from 3.21% to 5.69%, suggesting that the majority of suspended material consisted of larger particles that are less likely to become airborne.
Deeper surface textures are associated with increased road wear, contributing to higher dust loads and greater suspended dust generation. Sites C through to E exhibited similar trends, where variations in sL values and PM10 content suggest that road conditions, maintenance practices, and environmental exposure significantly influence dust accumulation and resuspension. For sL measurements, dust collection was conducted over a 3 m section using an enhanced sampling technique to ensure accurate correlation with suspended dust concentrations. Texture data were recorded at 3 m intervals over a 100 m section, with separate measurements for the front and rear to minimize the influence of continuous road segments. This method was applied consistently across the full 150 m test sections for both PP and HMA pavements.
Additionally, background dust concentrations were recorded at the nearest observatory during measurements to account for ambient environmental conditions. Across all sites, background dust levels exhibited minor fluctuations, with TR values ranging from 61.47 μg/m3 to 70.3 μg/m3 and OB values between 61 μg/m3 and 66.75 μg/m3. These background measurements suggest that site-specific road dust variations are predominantly influenced by pavement type and road maintenance conditions, rather than external environmental factors alone. These findings underscore the significant impact of pavement type and surface treatment on road dust emissions, highlighting the need for targeted maintenance strategies aimed at mitigating particulate matter resuspension and improving air quality in urban environments.
3.4. Analysis of Dust Generation Based on Mean Texture Depth
For the same pavement type of HMA, the relationship between sL, MTD, and suspended dust exhibits a positive correlation, suggesting that higher MTD levels result in a greater accumulation of sL on the surface, which subsequently leads to an increase in suspended dust levels in the air (
Figure 7). Upon analyzing the concentration of suspended dust for HMA, it was found that although the MTD value was lower compared to other asphalt pavements, the suspended dust concentration was higher. This is attributed to the smoothness of the HMA surface, which allows dust (dust load) particles to be easily suspended in the air with minimal resistance. Additionally, this phenomenon is influenced by driving speed, as higher speeds generate stronger air turbulence, enhancing the suspension of dust particles.
To quantify the concentration of suspended dust in relation to texture characteristics, the variation in suspended dust concentration across different grades was analyzed, as presented in
Table 4. By identifying the suspended dust concentration based on these influencing factors, the relationship between macrotexture depth (MTD) and suspended dust was quantified. MTD management strategies for controlling suspended dust were proposed, assuming a constant dust concentration for a given MTD. The analysis categorized MTD values into high, middle, and low groups to assess the impact of road texture on suspended dust. Thus, the change in suspended dust concentration generated according to each grade was analyzed by classifying MTD into high, middle, and low categories. As shown in
Table 4, MTD values were classified as low (≤0.7 mm), middle (0.7–1.1 mm), and high (≥1.1 mm). For sL, the high and middle dust loads were classified using urban roads and 1 g/m
2 in Incheon, based on a threshold of 0.05 g/m
2 in accordance with the dust load levels observed in city center areas [
25].
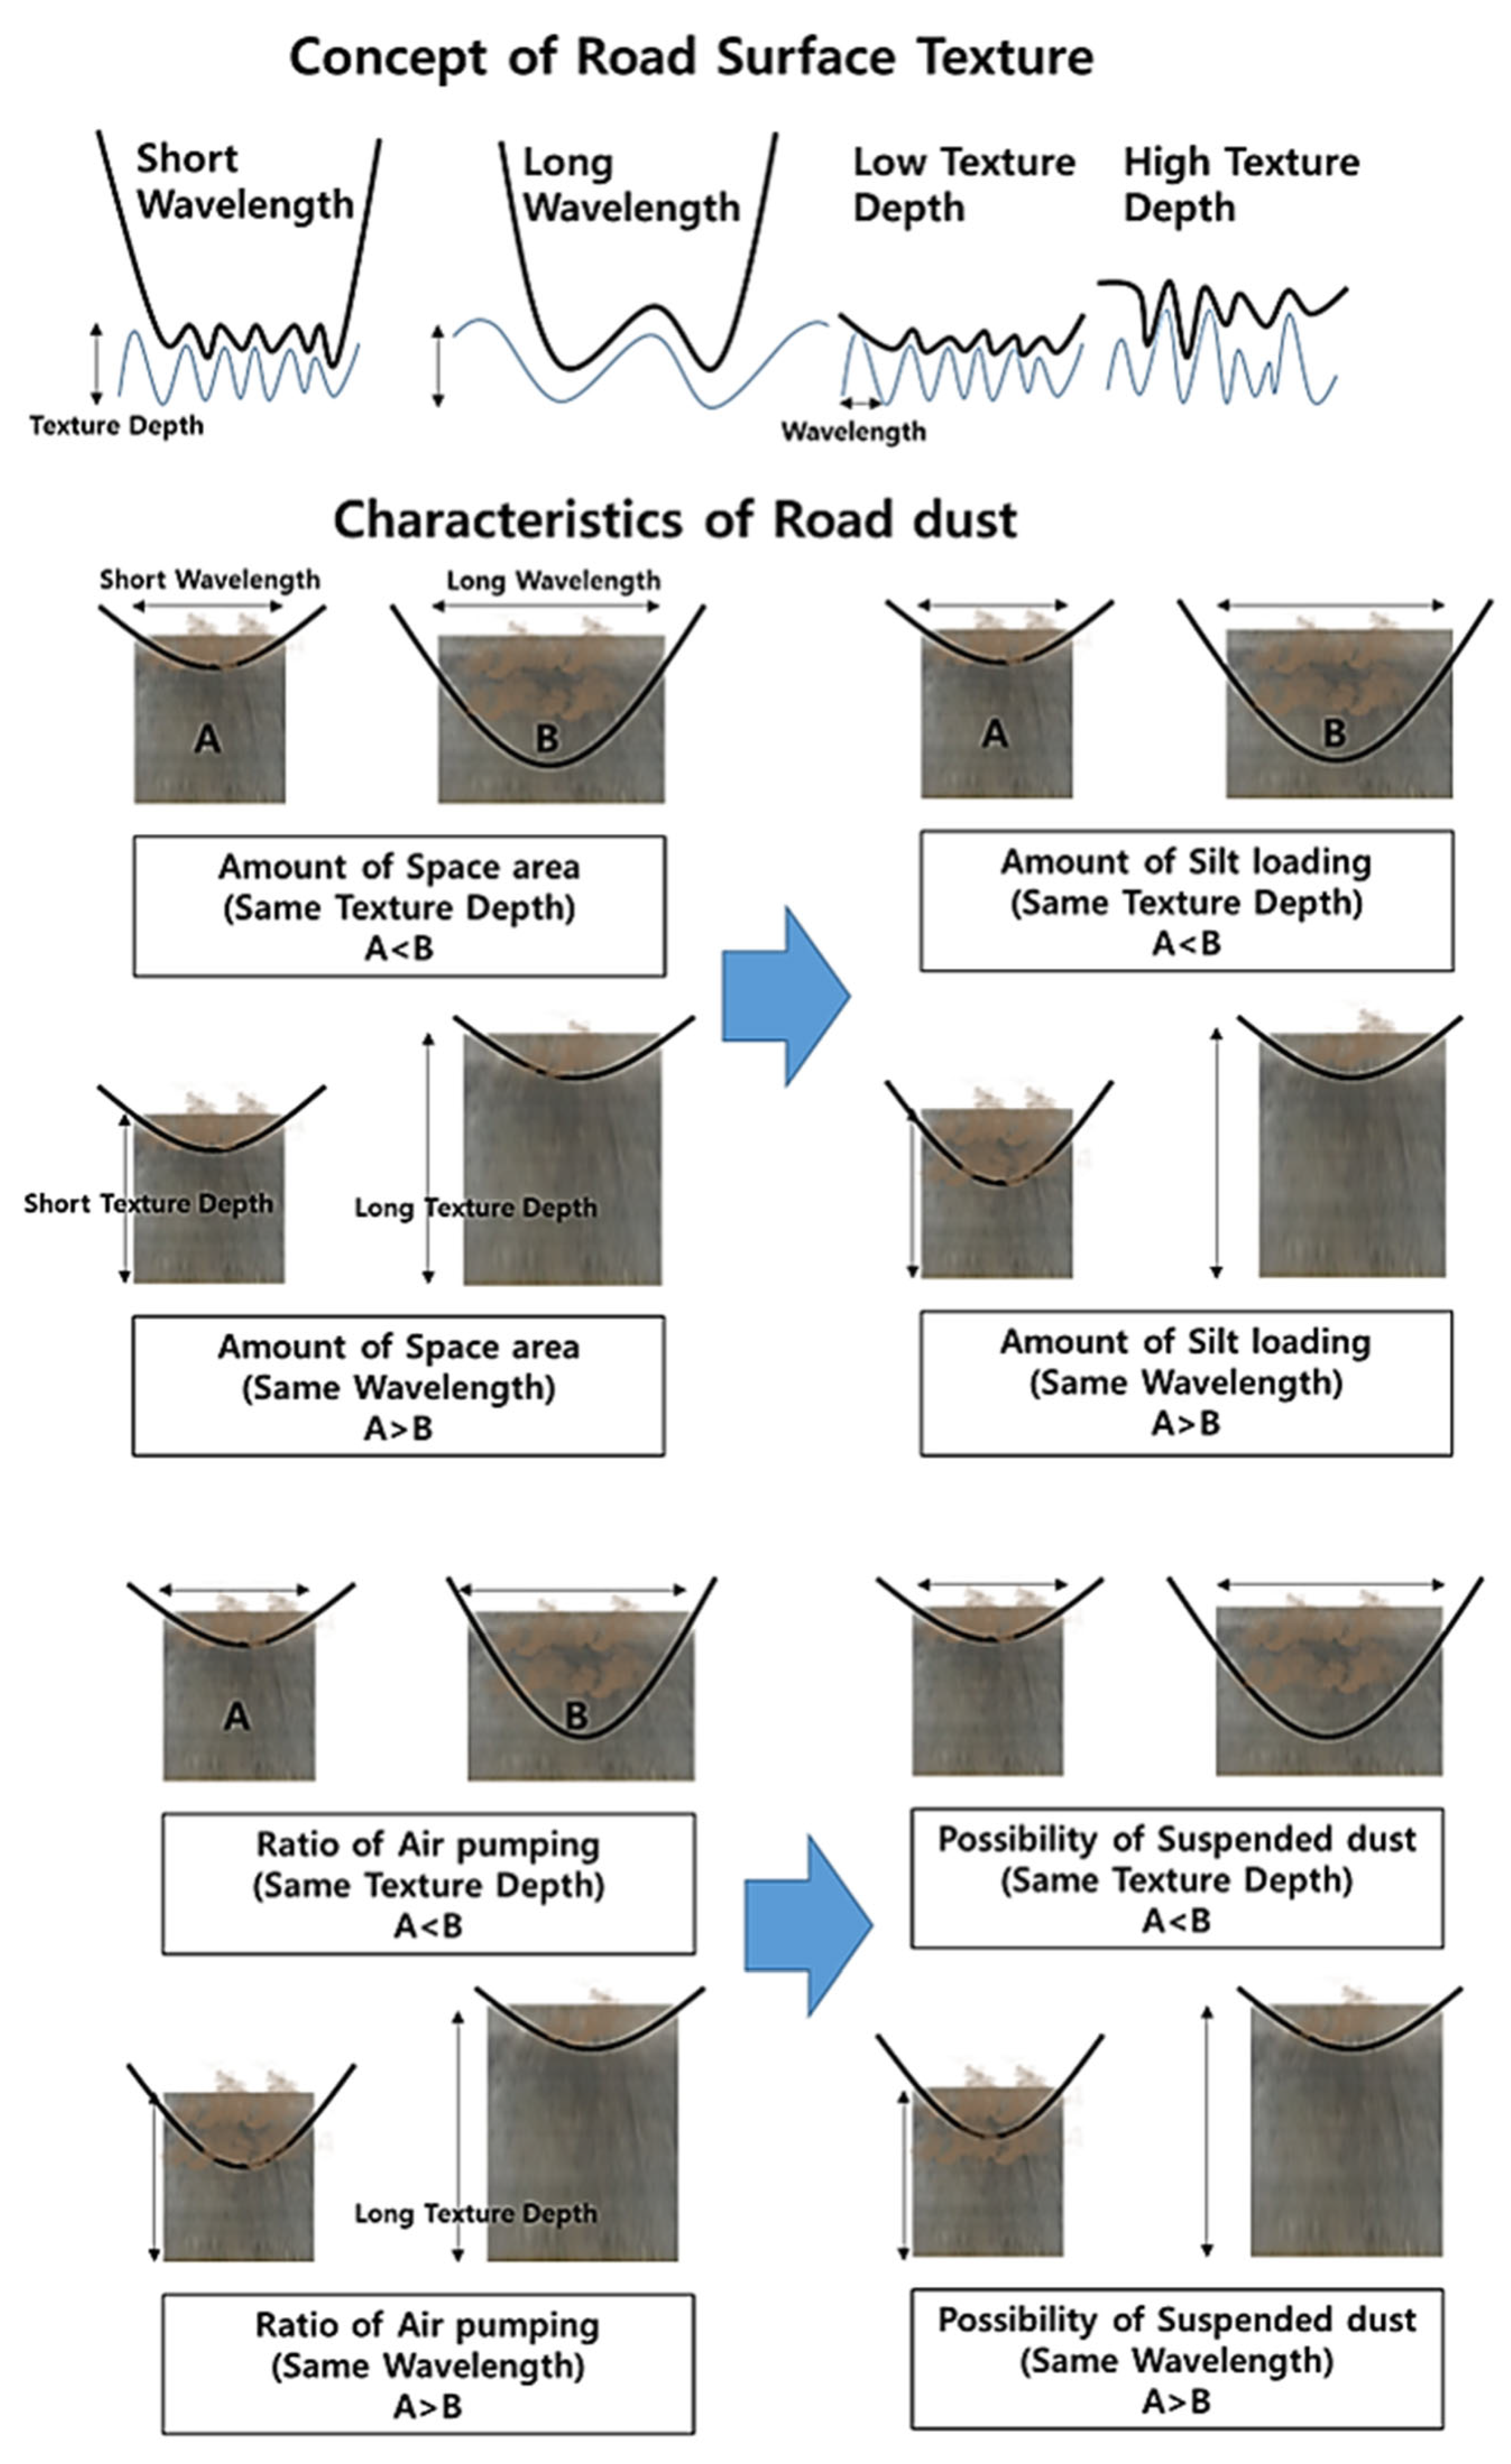
By identifying the concentration of suspended dust based on these divided influencing factors, the relationship between MTD and suspended dust was quantified, and MTD management measures were suggested, assuming the dust concentration remains constant for a given MTD. In the case of asphalt pavement, where there are no predefined grooves like those in asphalt pavement, the wavelength was divided into cases of 4 or more and cases of 4 or fewer.
3.5. Relationship Between Mean Texture Depth with Road-Suspended Dust
The suspended dust generation mechanism related to surface texture occurs when the tires rub against the road surface, making contact with the peak levels of the texture [
26,
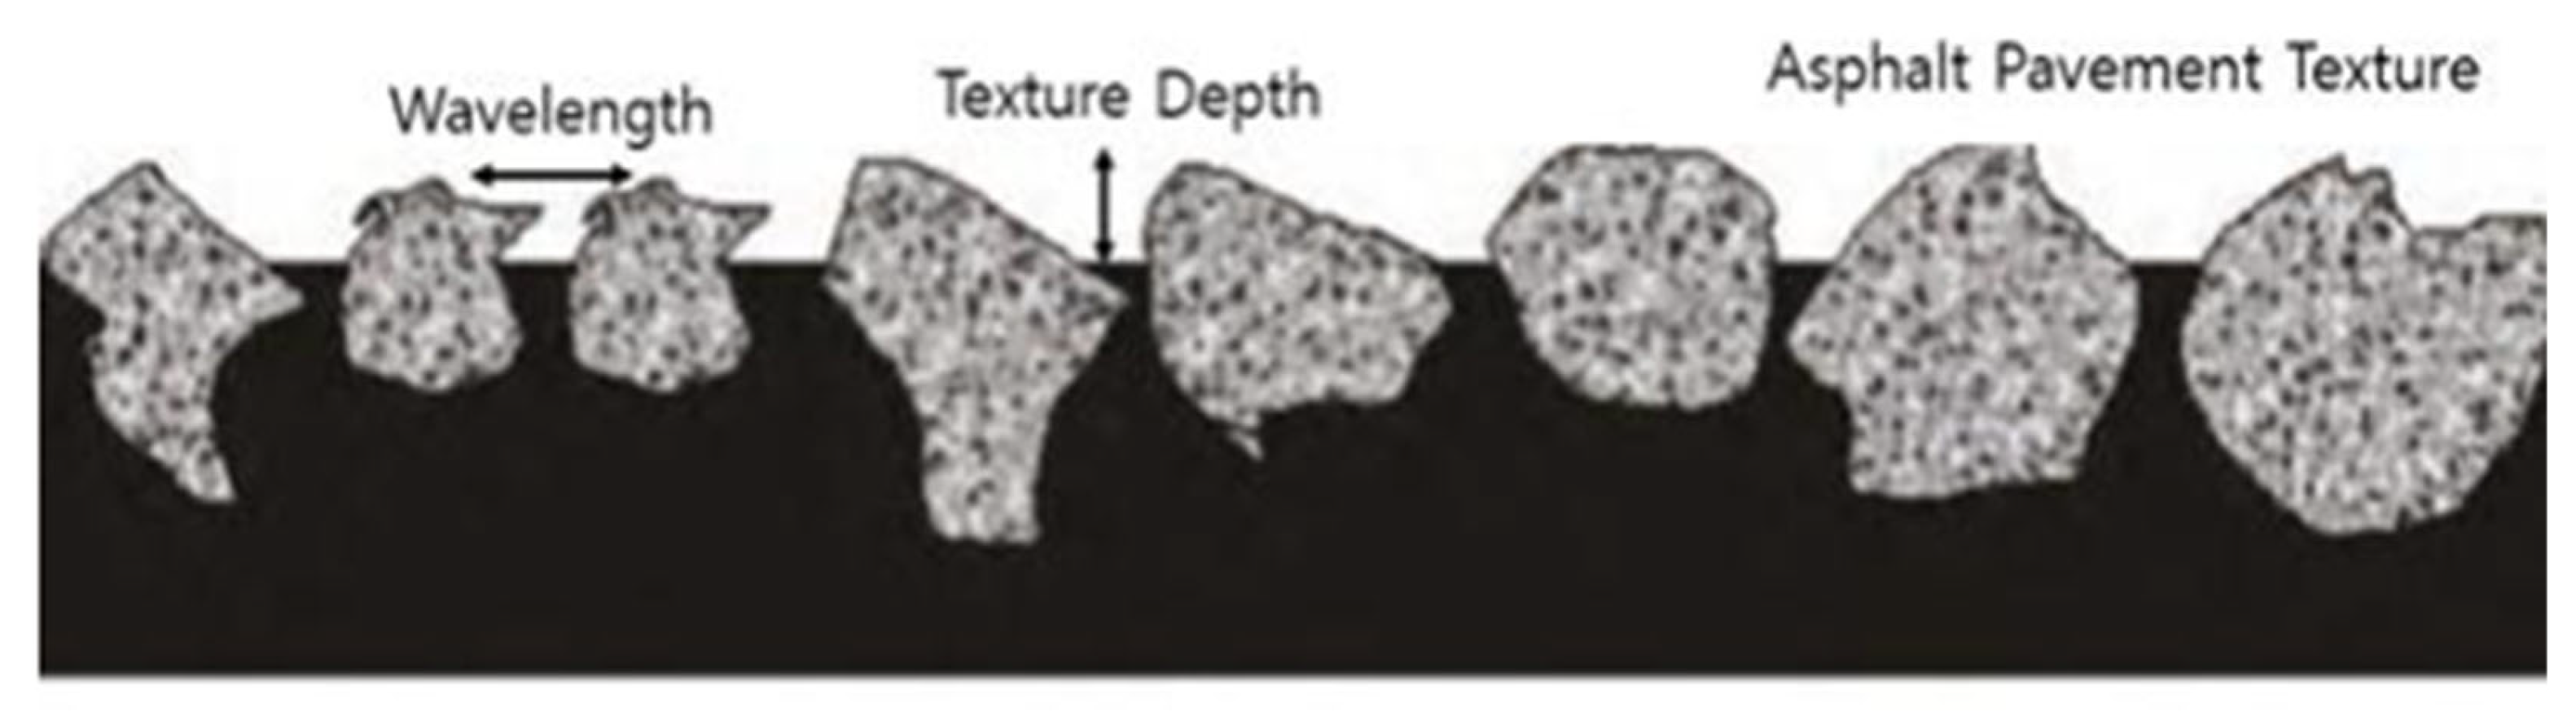
27]. This results in dust particles becoming suspended in the air. To better understand this phenomenon, an additional analysis was performed on the wavelength of the road surface, providing a more quantitative measure of how the tires interact with the peak levels. The results of this analysis, which examined the relationship between MTD, wavelength, and suspended dust concentration, indicated that both the MTD and wavelength are influenced by the aggregate particle size and distance. The patterns observed further support this conclusion, demonstrating the role of aggregate size in determining the texture of the road surface and its impact on dust suspension.
To analyze the correlation between suspended dust concentration and MTD for different asphalt pavement series, the change in suspended dust concentration across each grade was first examined by categorizing MTD values into high, middle, and low ranges. These grades were specifically designed to assess the concentration of suspended dust generated by the high phase of MTD, similar to the levels of PM10 content and sL. As shown in
Figure 8, the suspended dust concentration generated at MTD values between 0.7 mm and 0.9 mm and those between 0.9 mm and 1.1 mm was comparable. This similarity led to the conclusion that MTD values in the range of 0.7 mm to 1.1 mm correspond to a similar level of suspended dust generation. Consequently, the analysis was conducted by dividing the MTD stages into two categories: 0.7 mm and 1.1 mm.
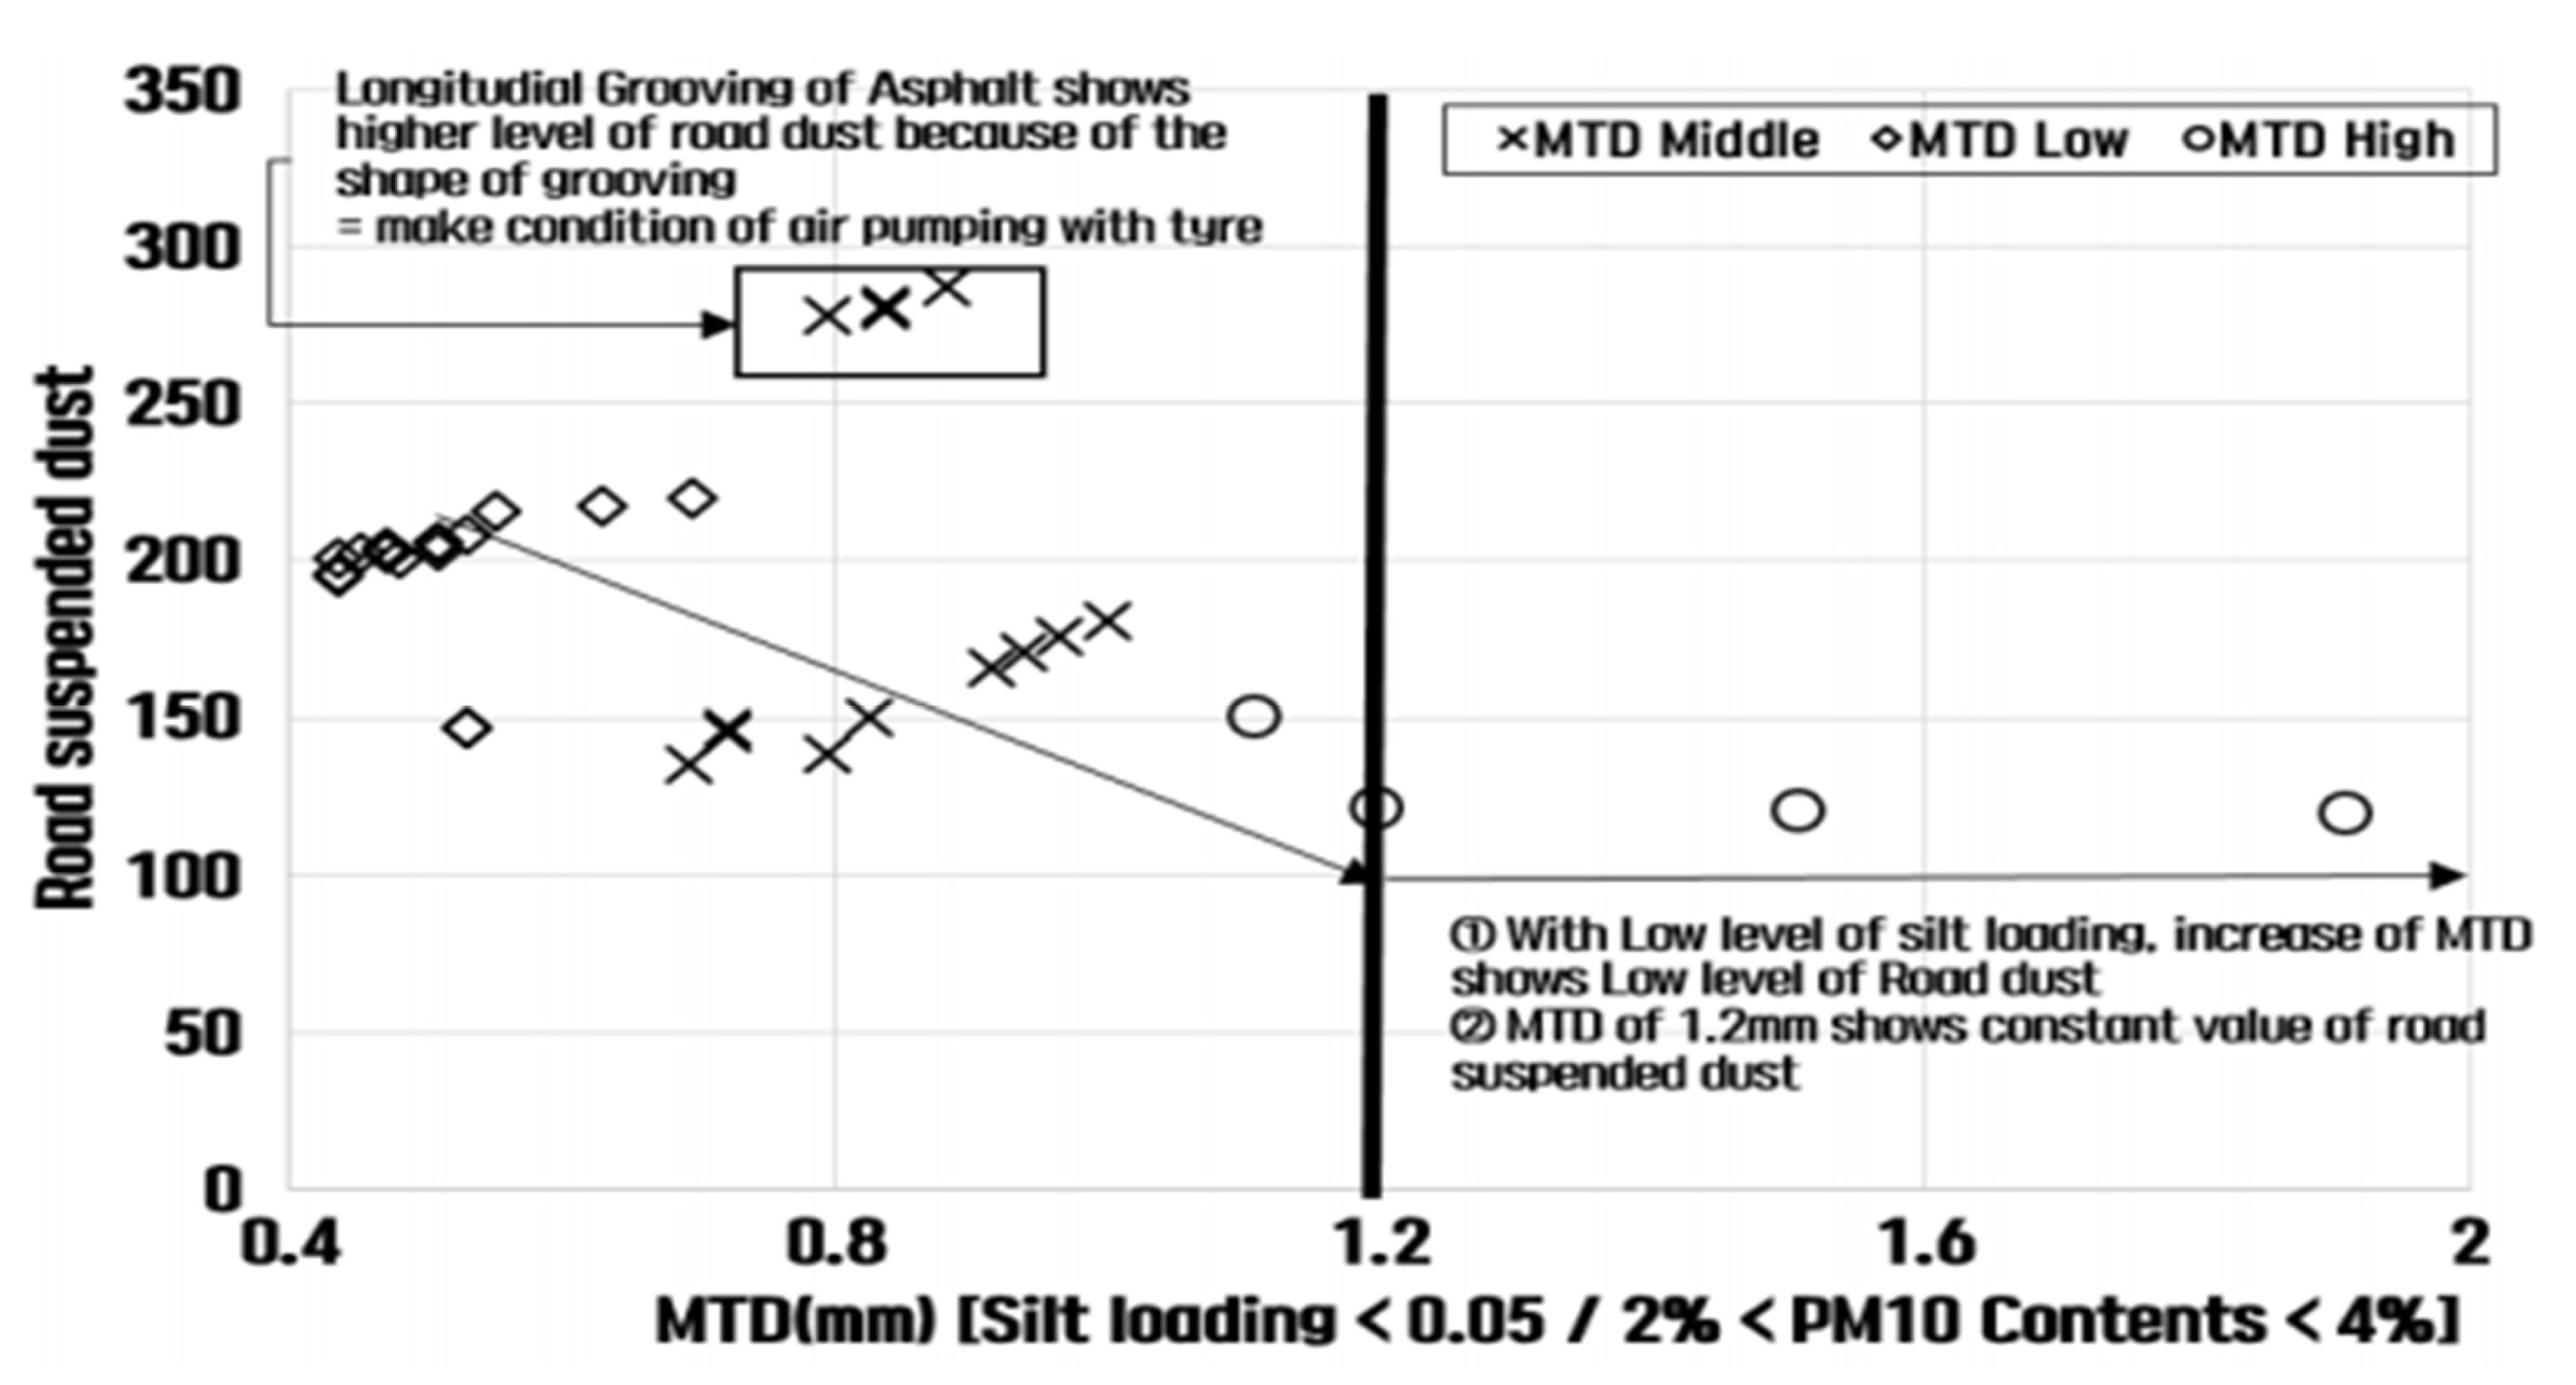
Figure 9 presents the results of analyzing suspended dust concentration according to MTD at low, middle, and high grades of sL. The analysis aims to identify whether an inflection point occurs when MTD surpasses a certain threshold, which would suggest that the suspended dust concentration stabilizes as sL reaches a level where it no longer becomes airborne with increasing texture depth. Managing texture depth in relation to suspended dust concentration is crucial for controlling dust levels effectively. The suspended dust concentration corresponding to low dust loads (sL of 0.05 g/m
2 or less) is illustrated. The analysis reveals that, with lower MTD values, suspended dust concentration is higher. Specifically, the longitudinal grooving of asphalt pavement displayed the highest suspended dust concentration in the medium short term. This is attributed to the air pumping caused by the grooving shape when tires make contact with the road surface, resulting in higher suspension levels. Furthermore, it was observed that as MTD increased, the suspended dust concentration gradually decreased.
However, once the MTD reached 1.2 mm, the concentration of suspended dust remained constant, suggesting that a texture depth of 1.2 mm or more is sufficient to maintain suspended dust at a stable level during tire–road contact. As the MTD increased, the concentration of road-suspended dust tended to decrease. At this time, depending on the type of pavement, HMA, asphalt grooving, and PP appeared lower than the MTD value presented above, the higher the suspended dust concentration, and in the case of PP, the suspended dust concentration was relatively low due to the voids [
28,
29]. So, the concentration of dust in the asphalt section is judged to have a statistically clear correlation. The suspended dust generation mechanism according to this road surface organization is judged to cause tire deformation on the road surface momentarily as the tires rotate with the peak level existing on the road surface, resulting in suspended dust caused by the tires. Therefore, in the case of the same pavement conditions, the higher the peak level of the MTD, the more dust can be suspended on the road surface, increasing the dust concentration. Since the peak level of the road surface texture increases as the MTD increases, it is judged that management is necessary to reduce dust of suspension.
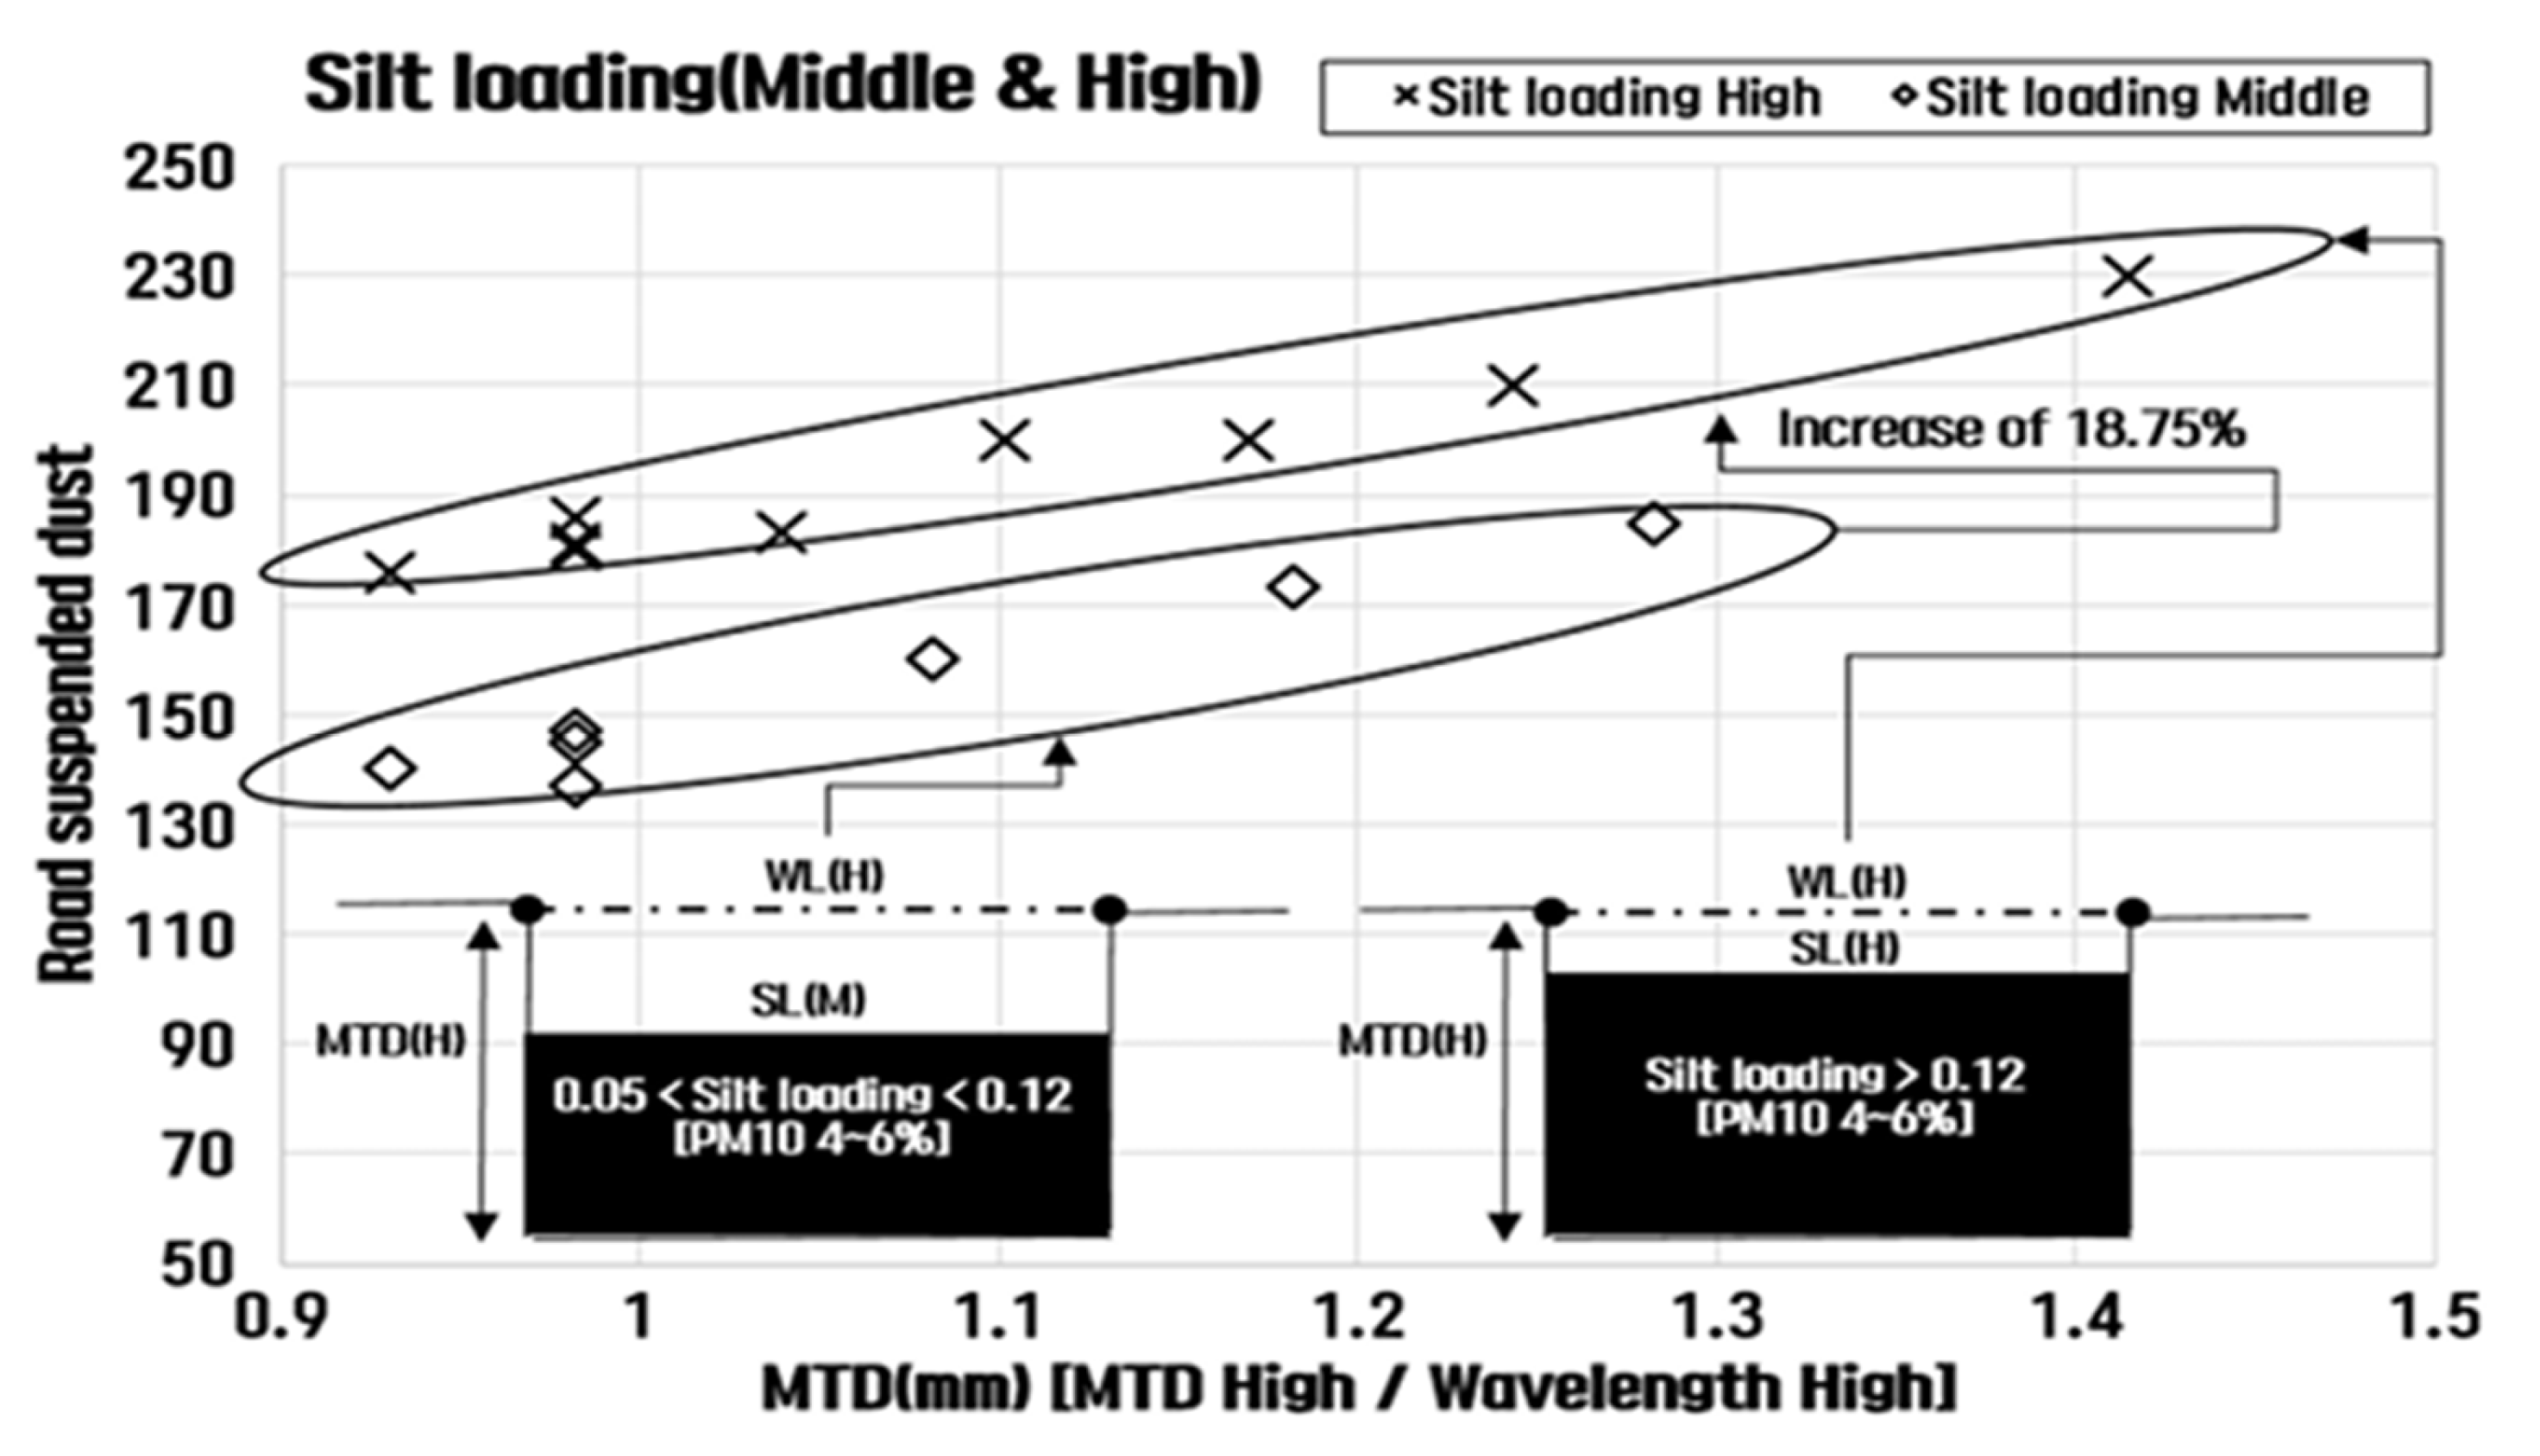
Figure 10 presents the analysis of suspended dust concentration according to sL during the MTD stage. The results show no significant difference in dust concentration between the low sL value and the middle stage. It is observed that the sL level, ranging from 0 to 0.12 g/m
2, tends to accumulate and remain stable within the MTD range of 0.7 to 1.1 mm. However, when the sL level exceeds 0.12 g/m
2, the concentration of suspended dust increases. This suggests that dust levels can be controlled by maintaining a slightly deeper MTD, which helps to manage the amount of suspended dust in the air effectively.
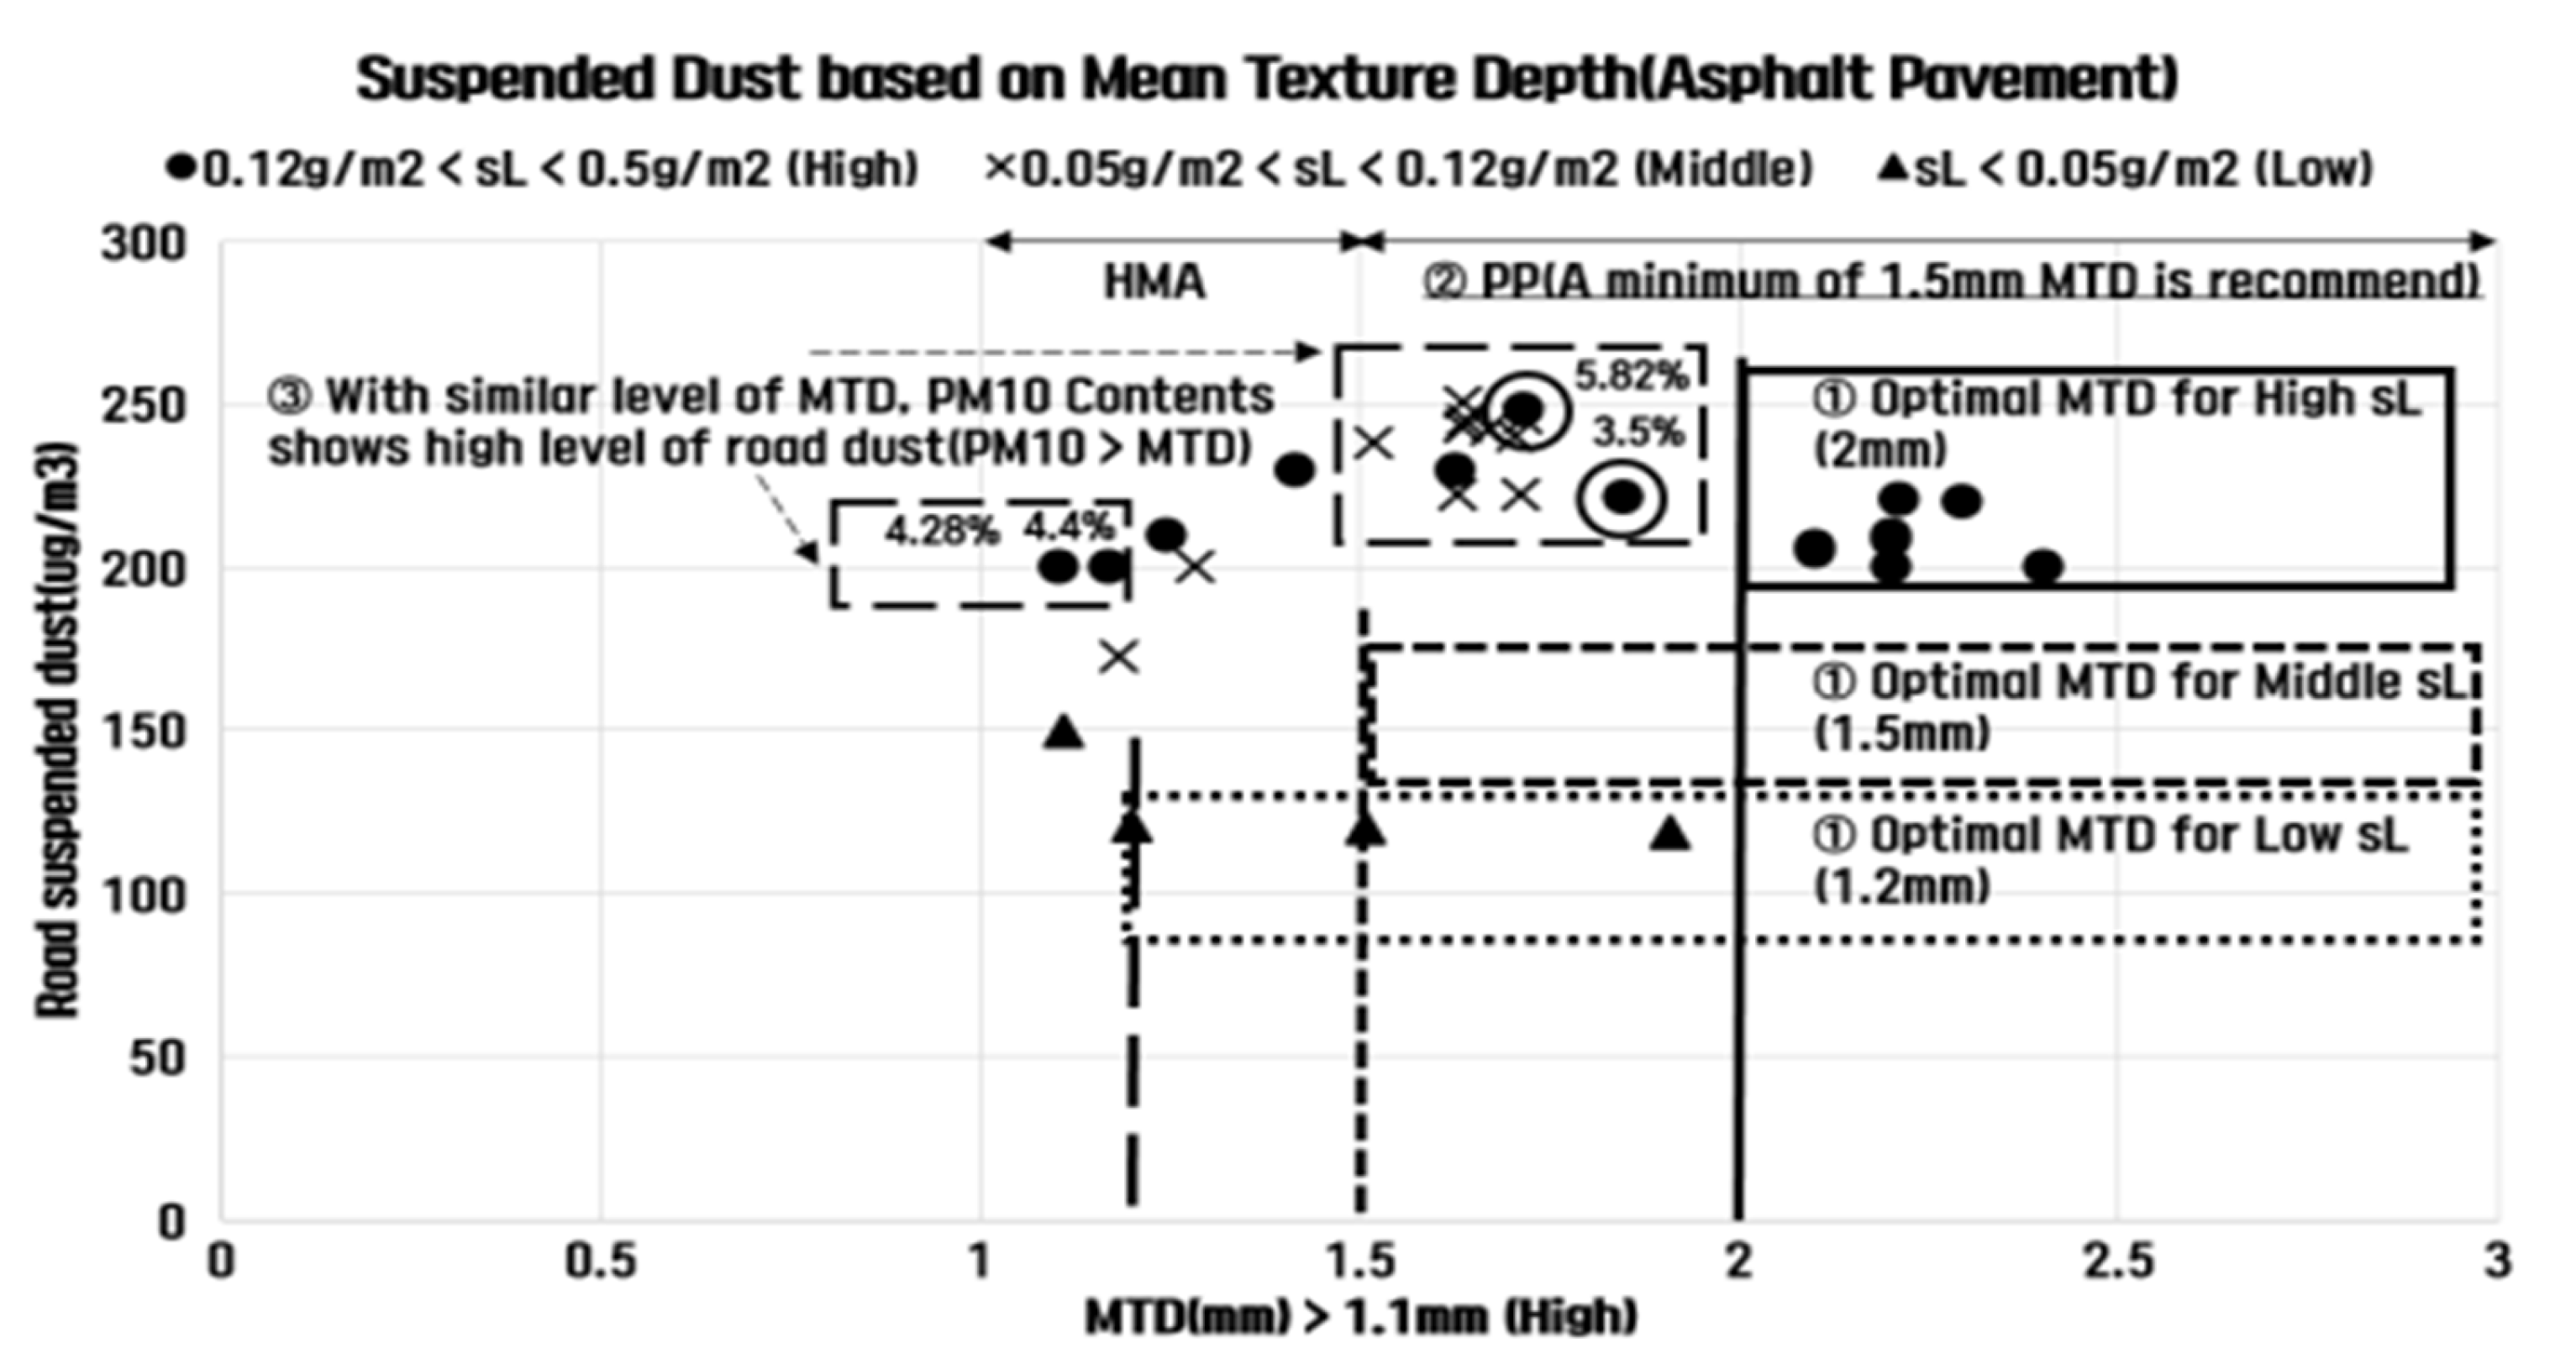
As shown in
Figure 11, the suspended dust concentration increased with sL during the MTD phase, but as sL continued to rise, the MTD value appeared to stabilize the dust concentration. This finding was evaluated as indicating the optimal MTD for managing suspended dust. Specifically, it was observed that road dust concentration remained constant at MTD values of 1.2 mm in the lower sL section, 1.5 mm in the middle section, and 2 mm in the high section. The elevated MTD sections were associated with porous pavement on asphalt pavement, suggesting that an MTD value of at least 1.5 mm is necessary for effective road dust management. Additionally, when examining HMA pavement, it was found that the concentration of suspended dust, particularly at higher PM10 content levels, was more significant [
24]. Therefore, PM10 content may be considered a more valid factor than MTD when determining the concentration of suspended dust on the road. The results of correlation analysis, based on data from mobile laboratories measuring road dust while driving at 50 km/h under fixed conditions in the asphalt pavement section, further supported these conclusions.
The relationship between MTD and the wavelength cycle is evident, as both road surface texture depth and wavelength are influenced by changes in aggregate particle size and its distance [
30,
31], as observed in previous studies. This suggests that aggregate particle size plays a significant role in determining the road surface texture and, consequently, the suspended dust concentration [
30]. It can be concluded that the impact of aggregate particle size is more pronounced in asphalt pavement, with smaller maximum aggregate dimensions contributing to lower suspended dust levels. Further analysis revealed that lower MTD values, combined with higher wavelengths, result in higher suspended dust concentrations. However, the instantaneous suspension of dust caused by tire–pavement interactions and its relationship with MTD remains challenging to quantify due to the complexity of the dust resuspension mechanism. Therefore, the relationship between suspended dust and wavelength was evaluated by examining cases where the wavelength’s influence varied according to the grading of MTD and sL values. This analysis helps better understand the interplay between these factors and their impact on dust generation.
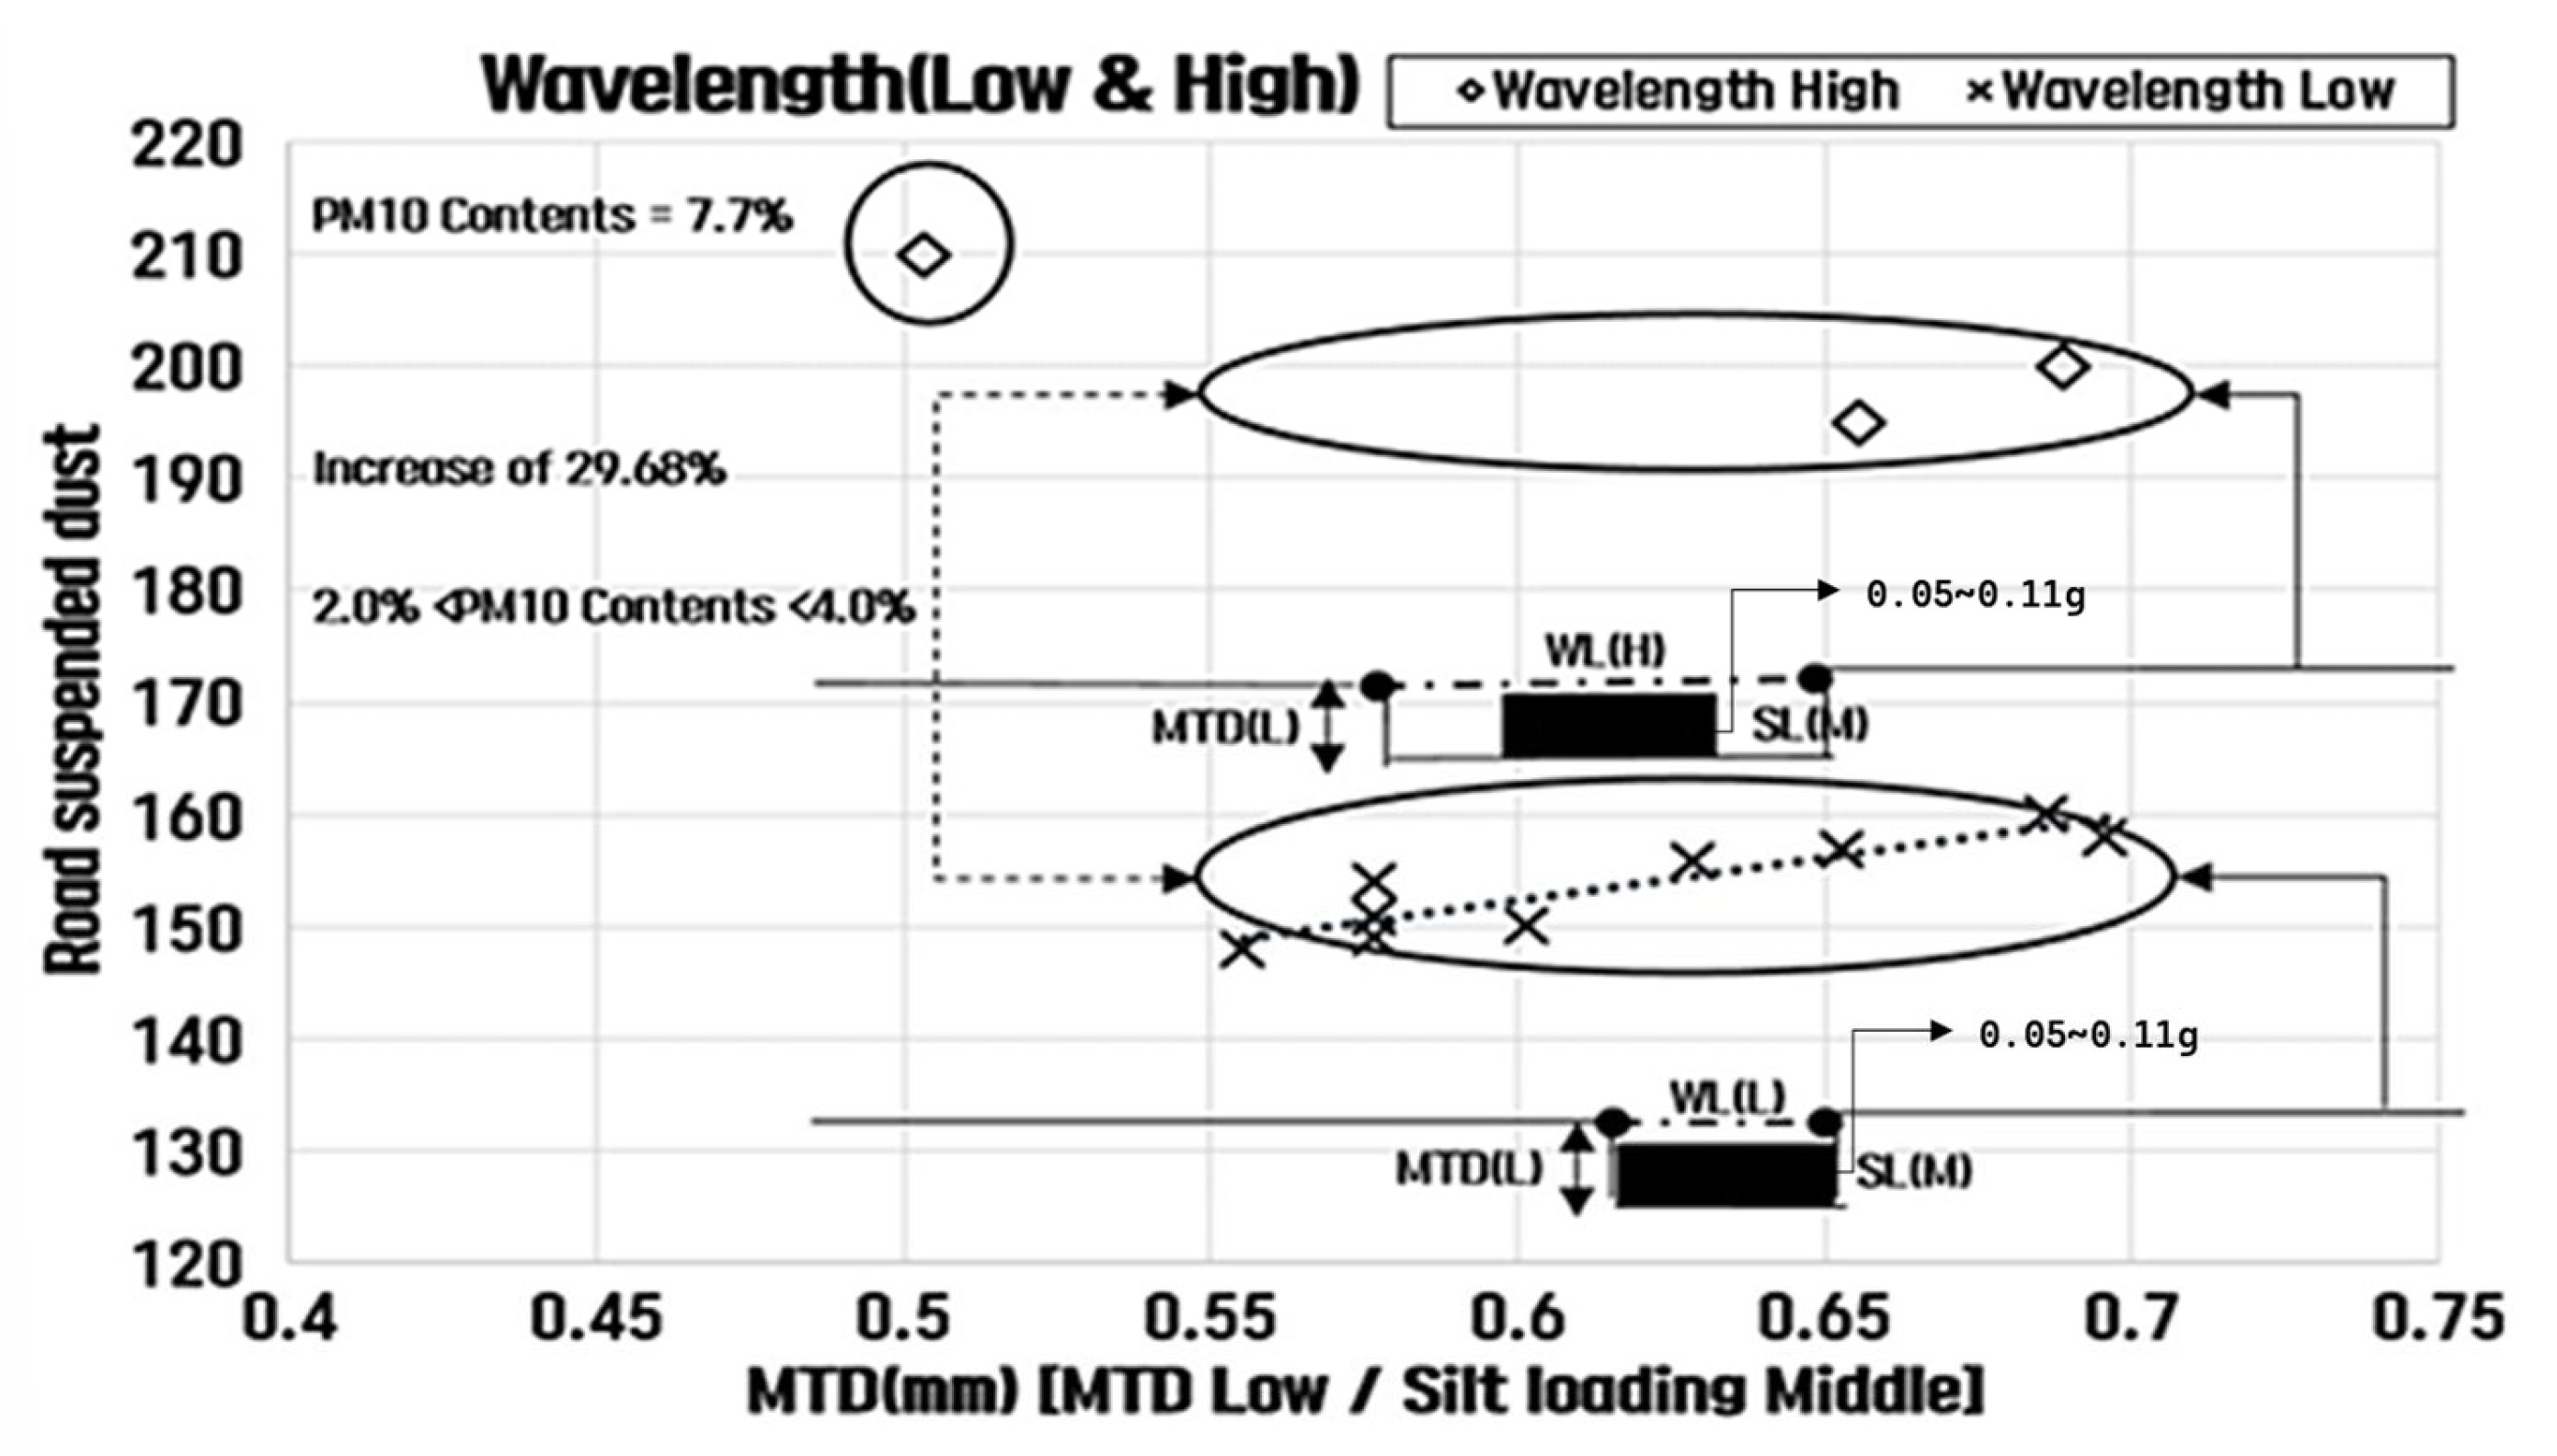
As shown in
Figure 12, when the sL is low, the suspended dust concentration at the same level of PM10 content is approximately 40% lower at the low MTD compared to the middle MTD. Generally, when the MTD is low, HMA pavement is the most representative, meaning that at low MTD values and high PM10 content, suspended dust concentrations tend to be the highest. This suggests that smoother surfaces with lower texture depth (such as HMA) are more prone to dust suspension, especially when high concentrations of fine particulate matter (PM10) are present.
As a result of analyzing the concentration of suspended dust at the middle level of MTD described in
Figure 13, it was found that the sL deposited in the range of 0.05–0.08 g/m
2 resulted in a moderate level of suspended dust, while at higher sL levels (0.08–0.12 g/m
2), the concentration of suspended dust was significantly higher. Furthermore, the group of sL values showed a clear distinction in suspended dust levels, with values under 0.1 g/m
2 exhibiting lower dust concentrations, while values exceeding 0.1 g/m
2 were associated with higher suspended dust levels. This indicates that higher sL levels contribute to greater suspended dust emissions, further emphasizing the need for managing both texture depth and dust load for effective dust control.
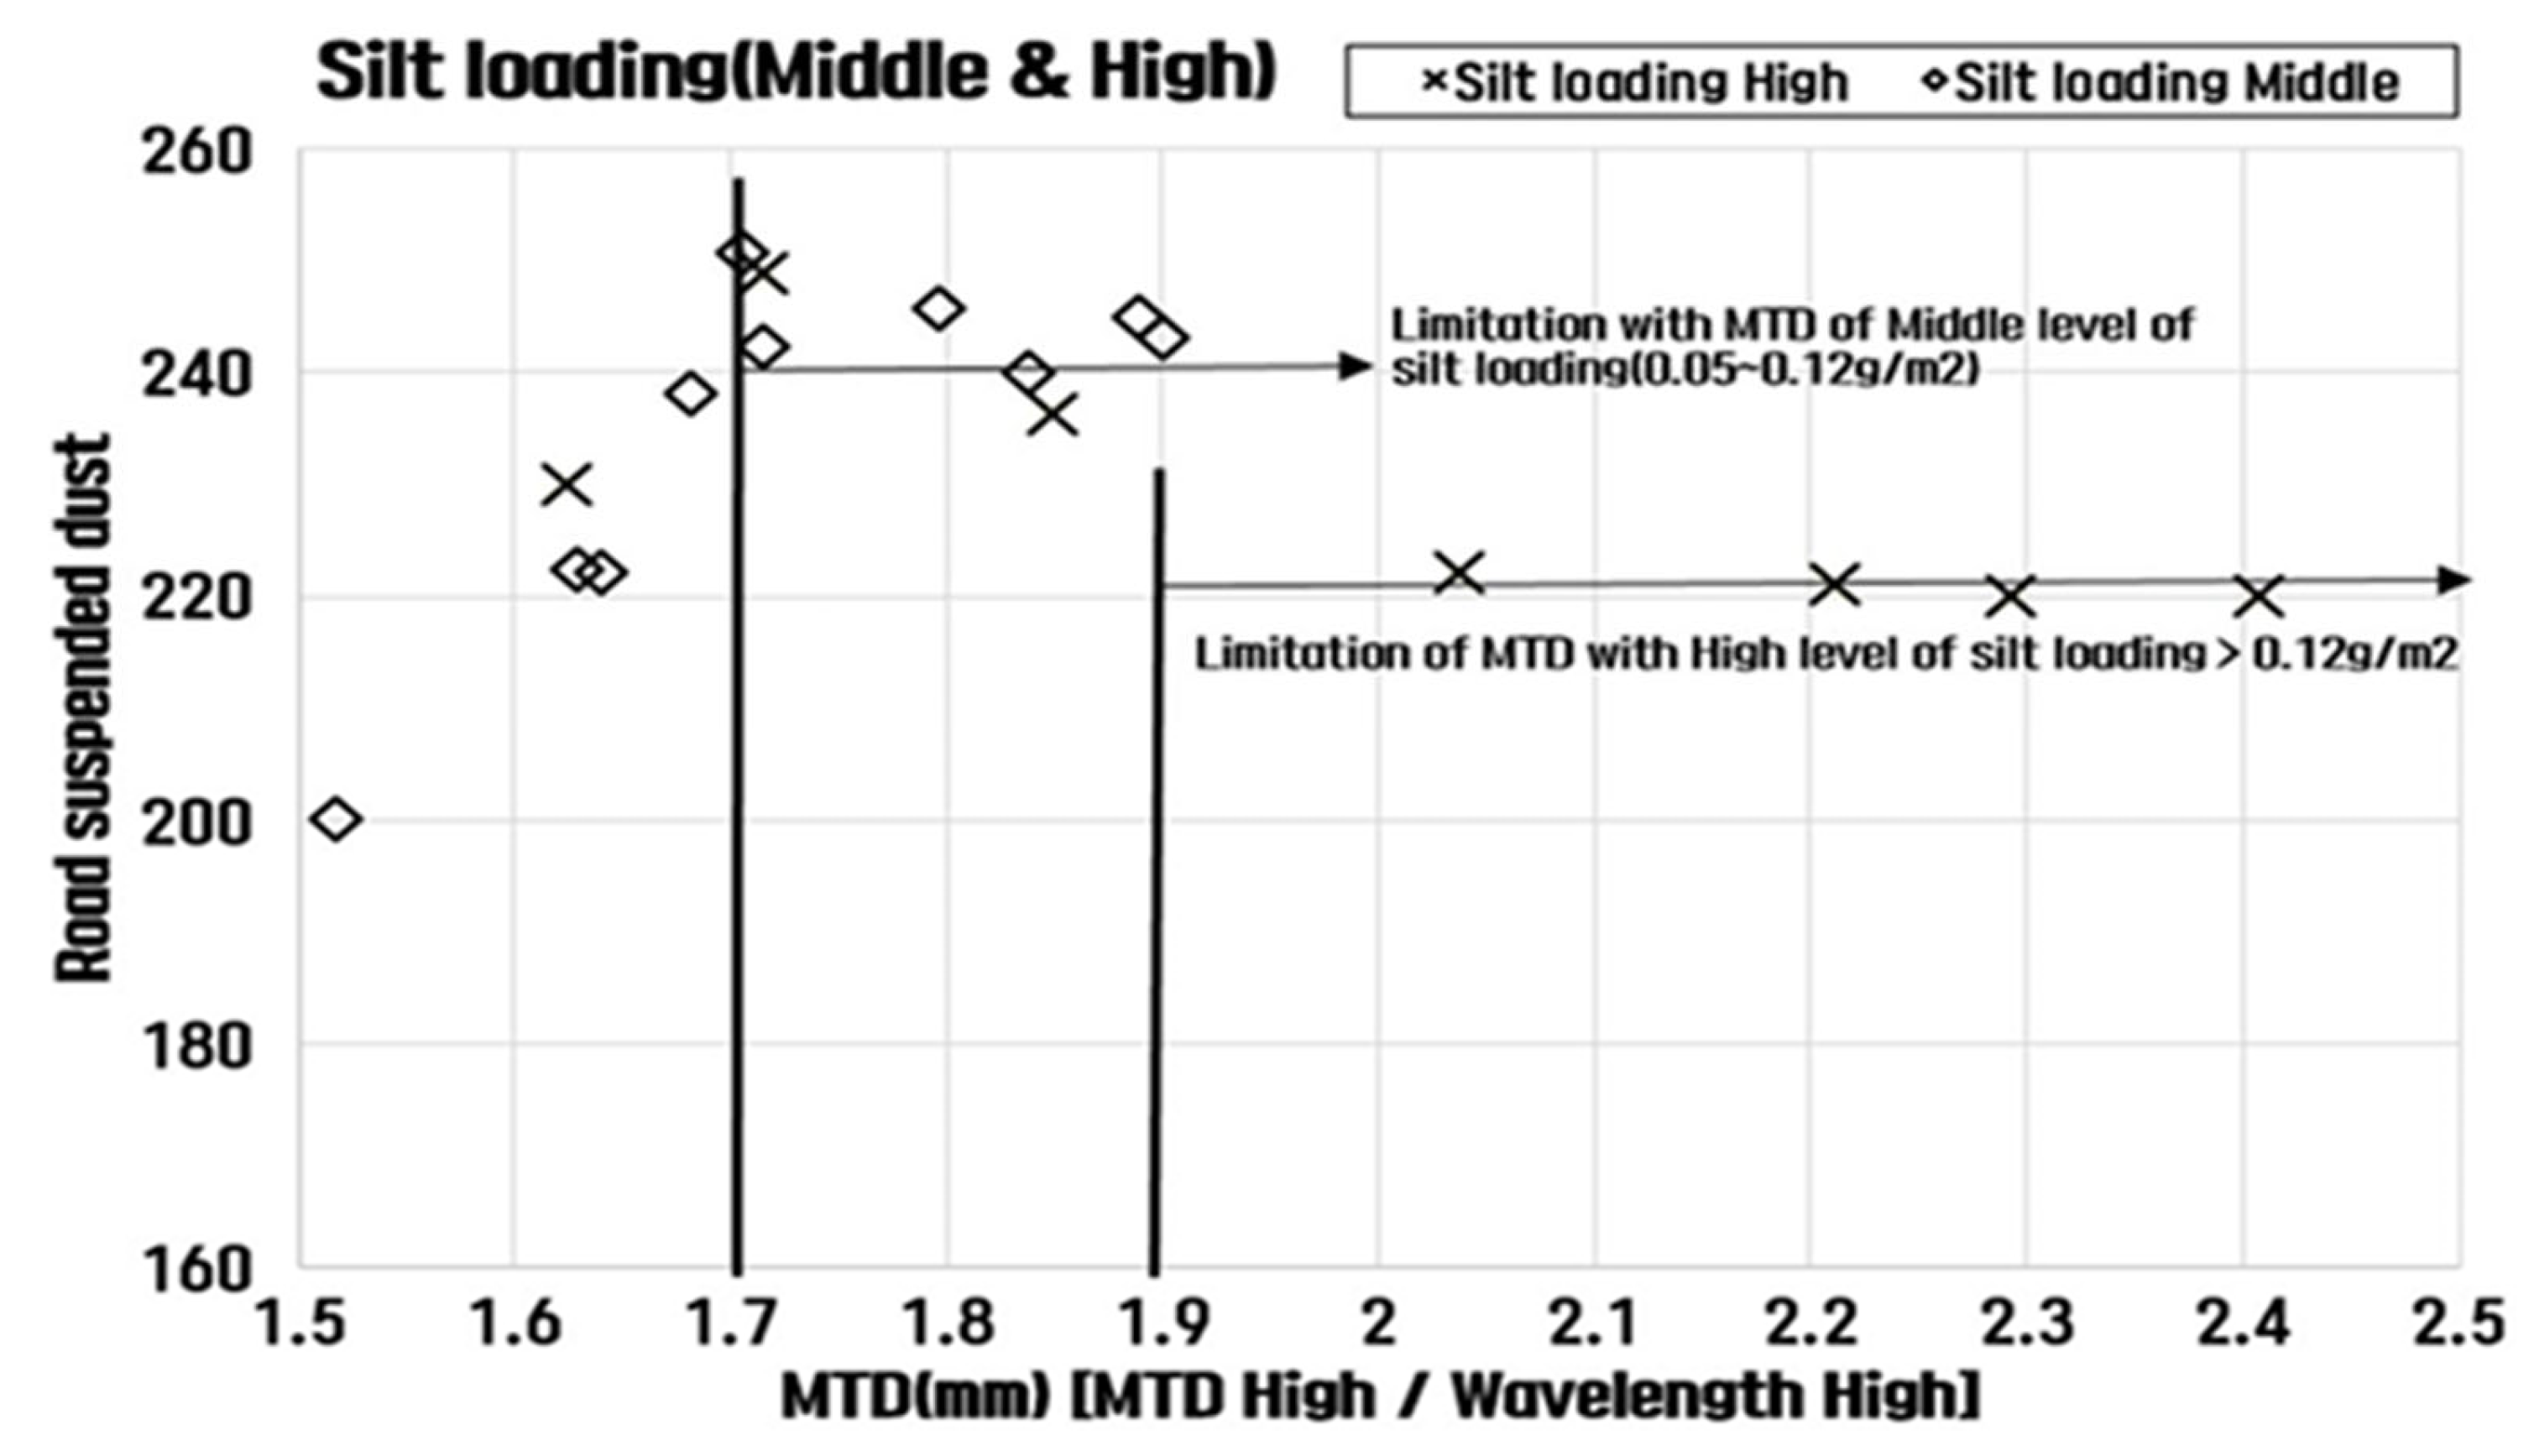
At the highest level of MTD, exceeding 1.7 mm, the concentration of road-suspended dust remained constant regardless of further increases in MTD values. This suggests that an MTD depth of 1.7 mm is sufficient to prevent dust from becoming airborne, even when the sL is at a middle level. The deep texture created by an MTD greater than 1.7 mm effectively traps dust particles on the surface, limiting their suspension in the air. Therefore, managing road-suspended dust in areas with a high sL can be achieved by optimizing MTD, using a deeper texture depth to reduce the release of suspended dust. Furthermore, with respect to sL, an MTD of 1.7 mm was found to effectively manage middle-level sL values, while an MTD of 1.9 mm was capable of accommodating higher sL values, up to 0.12 g/m
2. Although the measurement value of sL remained below 0.2 g/m
2, it did not reach the highest threshold of sL. Nevertheless, these results suggest that increasing MTD can serve as an effective method for suppressing the suspension of road dust in the air, providing a practical approach for managing road dust emissions by controlling the texture depth (
Figure 14).
3.6. Relationship Between Wavelegnth with Road-Suspended Dust
The analysis of suspended dust generation due to road surface texture revealed that the mechanism is closely linked to the interaction between the tires and the peak levels of the road surface during rotation [
13,
18]. In this context, a further examination of the road surface’s wavelength cycle was conducted to quantify how these interactions contribute to suspended dust generation. The analysis, which examined the correlation between MTD, wavelength, and suspended dust concentration, found that MTD and wavelength cycles are influenced by aggregate particle size. This relationship is evident in the patterns observed in asphalt pavement, where the two factors are correlated. It was determined that a smaller maximum aggregate size in asphalt pavement tends to reduce suspended dust. Furthermore, the analysis indicated that lower MTD values and higher wavelengths are associated with higher suspended dust concentrations.
However, capturing the exact relationship between suspended dust caused by air pumping and MTD remains challenging. Despite this, evaluating the relationship between suspended dust and wavelength based on the rating of MTD and sL provides valuable insight into how surface texture and road conditions affect dust suspension. This underscores the need for further research to understand the nuanced interactions between these factors and their role in road dust management. However, when the sL value shows a high dust load, minimizing the wavelength is crucial for reducing the suspended dust concentration (
Figure 15). This highlights the importance of controlling the surface texture to manage road dust, supporting the relationship between surface texture and road noise [
7,
13]. By minimizing the gap between aggregates, the peak level can be reduced, thus minimizing the wavelength of asphalt pavement. This method could effectively help manage suspended dust in areas with a high dust load, such as industrial zones.
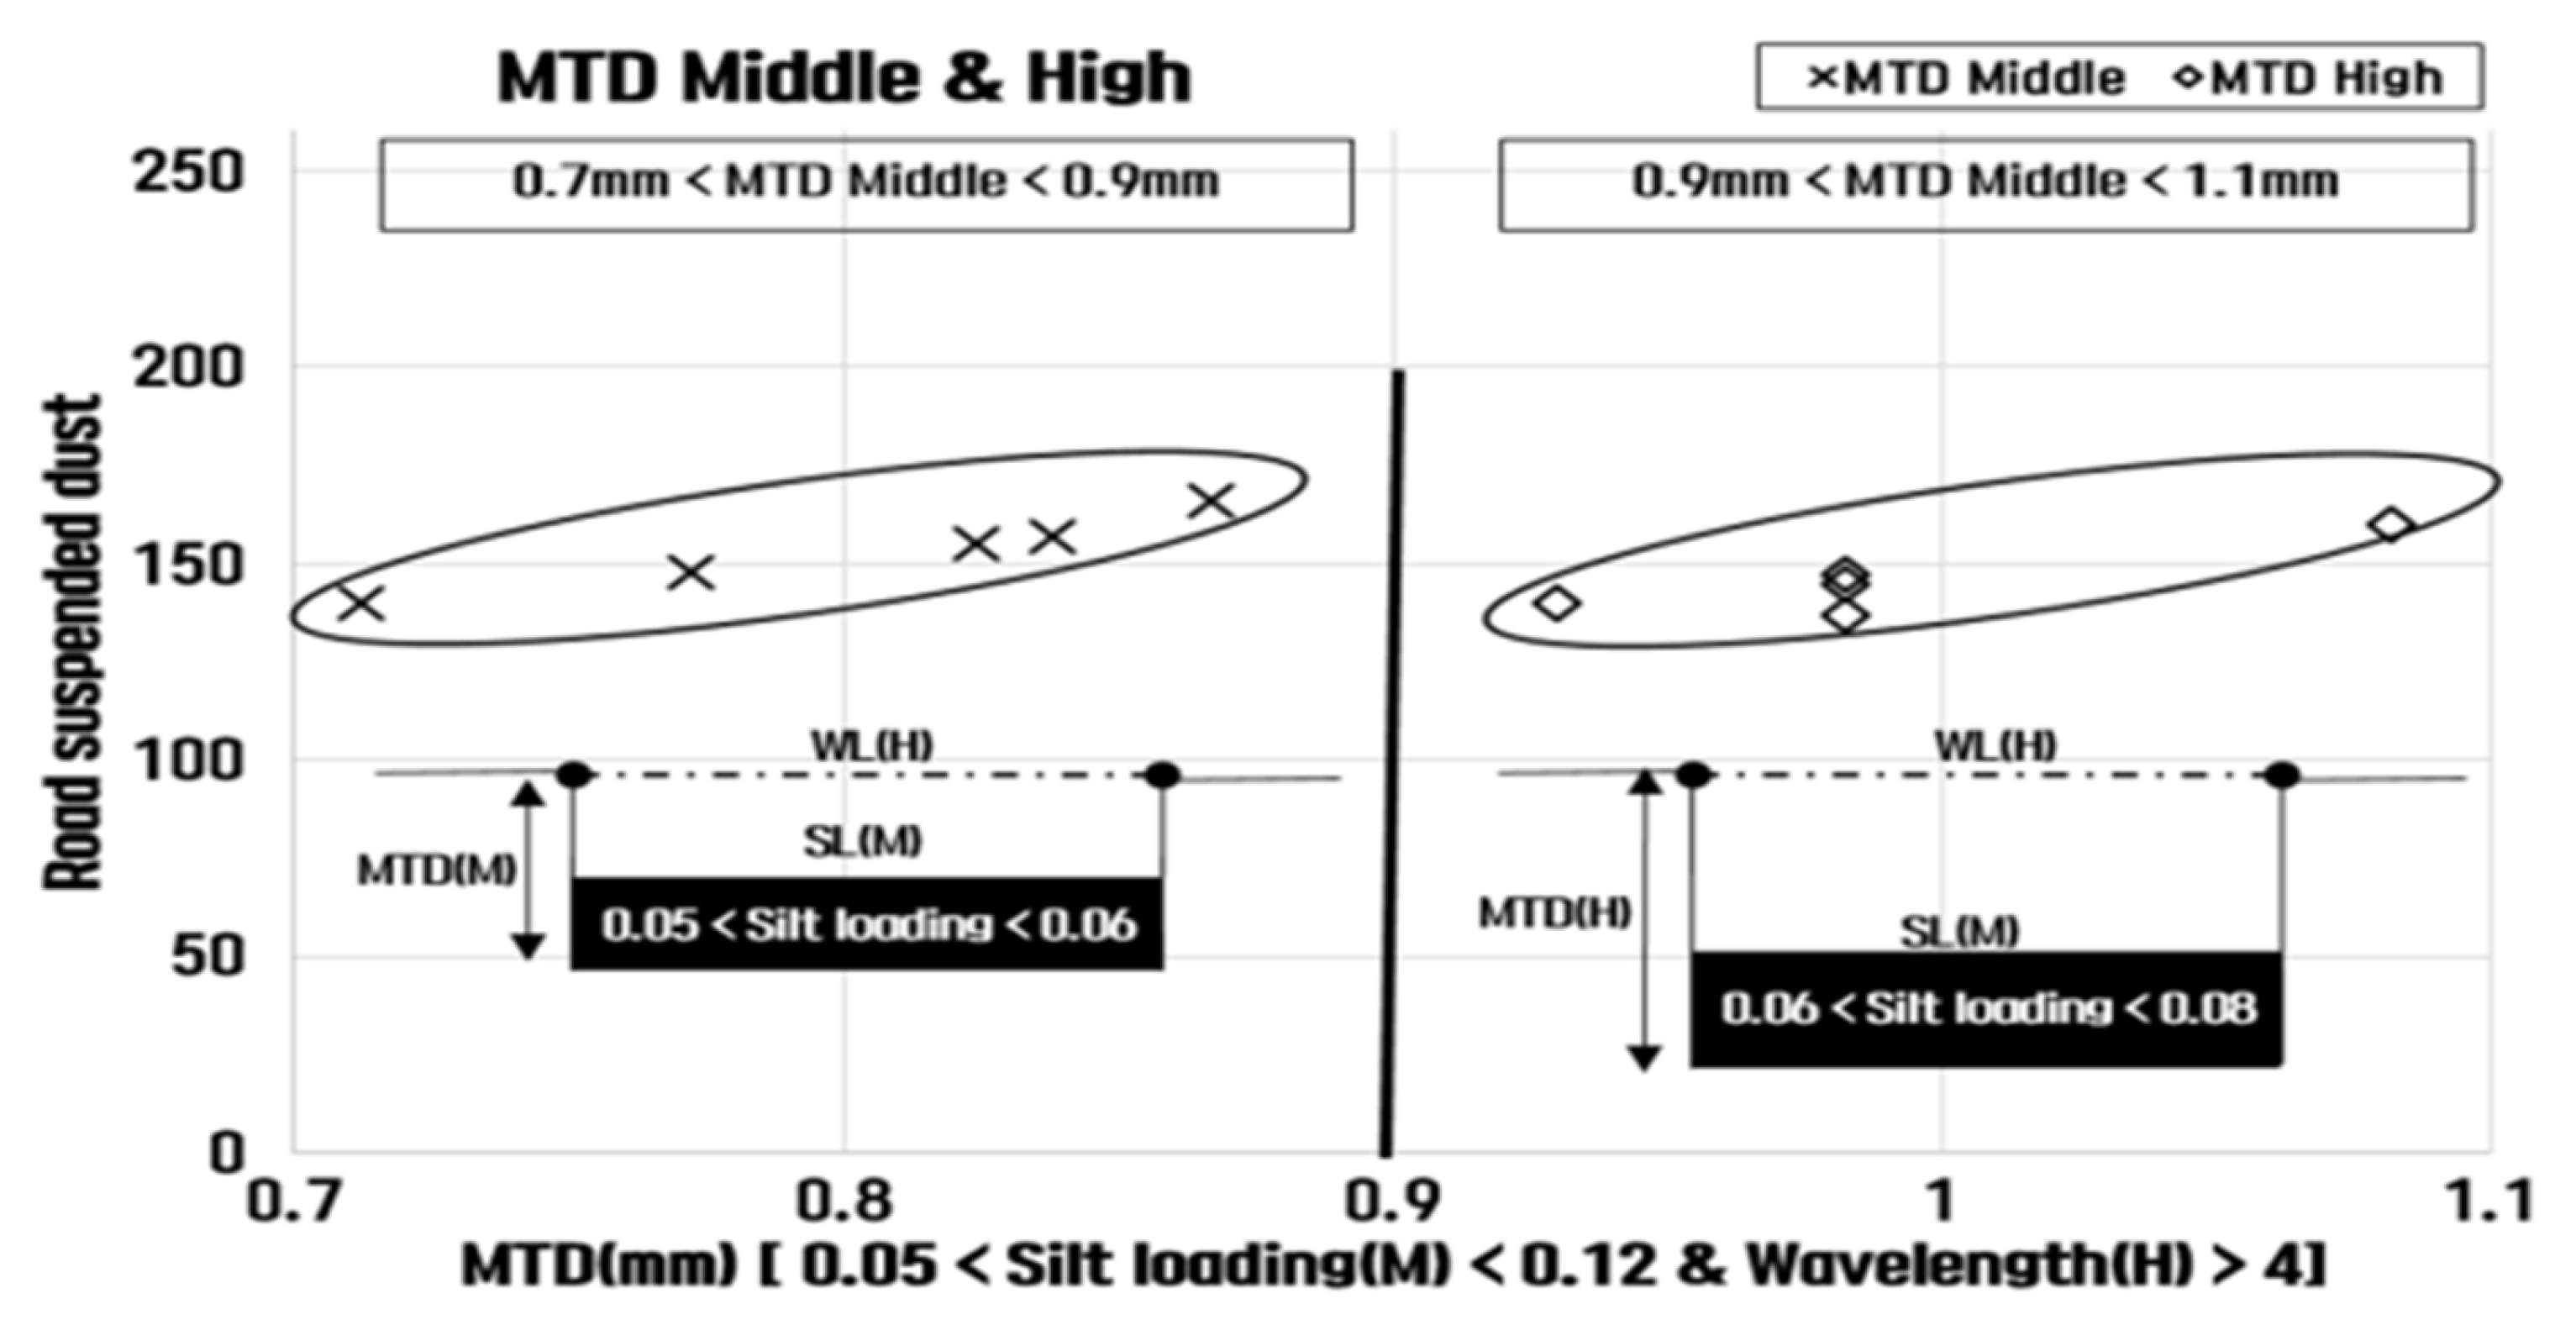
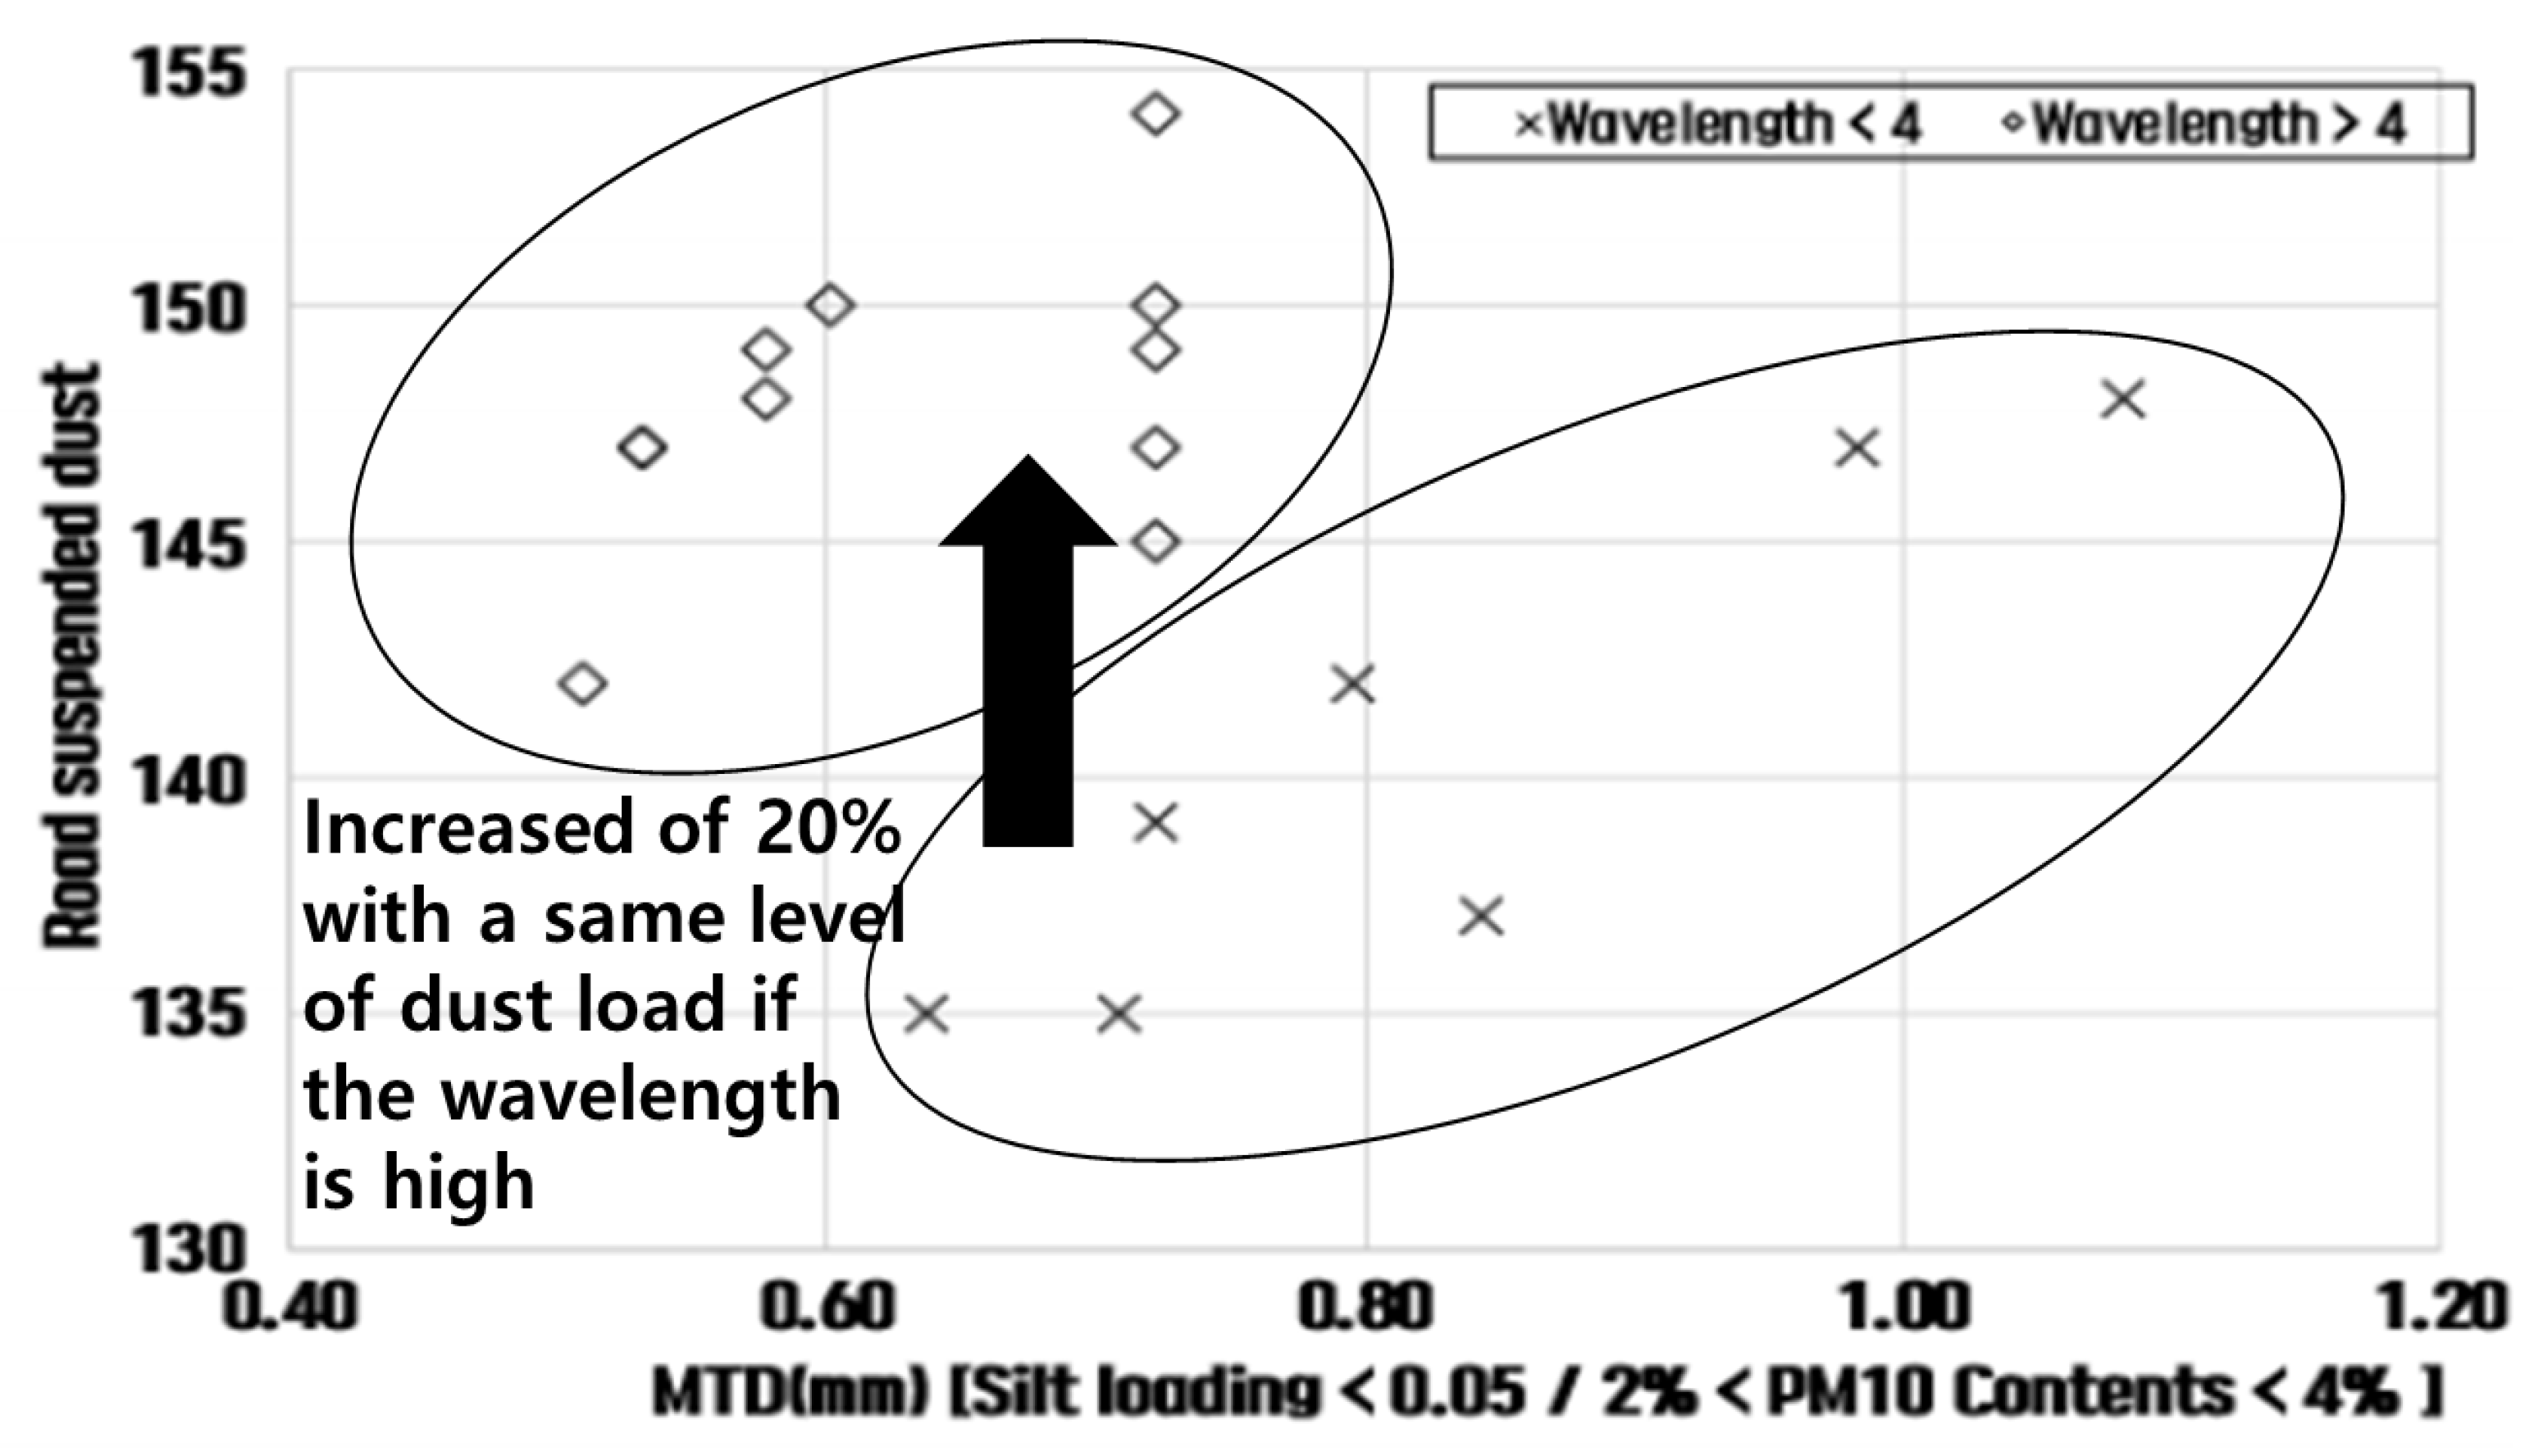
Further analysis conducted on the middle range of sL (0.05 to 0.12 g/m
2) revealed that when the wavelength exceeds four, the suspended dust concentration is approximately 30% higher than when the wavelength is below four, as shown in
Figure 16. This suggests that a higher wavelength leads to a greater accumulation of dust on the surface, as the sL in the higher wavelength range contains more dust. When the tires contact the road surface, the air pumping effect is more pronounced [
25], resulting in a larger amount of dust being suspended in the air. Therefore, managing the wavelength and surface texture can be an effective strategy for controlling dust suspension in areas with a high road dust load. Indeed, the gap between aggregates plays a significant role in the suspension of dust. When the wavelength is higher, the gap between the aggregates increases, creating more space for dust particles to become airborne. This larger gap allows for greater air movement between the road surface and the tires, increasing the potential for dust to be lifted and suspended in the air as a result of
Figure 16. Therefore, it can be concluded that the wavelength does have an effect on the concentration of suspended dust, with higher wavelengths facilitating more dust suspension due to the larger gaps between the aggregates. Reducing the wavelength by minimizing the gap between aggregates can thus be a key strategy in controlling suspended dust concentrations, especially in areas with a high road dust load.
Moreover, when the dust load is high, particularly during MTD, the suspended dust concentration is significantly influenced by the wavelength. PM10 content, being the largest contributing factor, showed a similar pattern, where the wavelength played a role under similar conditions, as shown in
Figure 17. In the analysis of suspended dust within the middle and high ranges of sL, it was observed that when the wavelength is low, the suspended dust concentration increases with higher sL values. However, this increase in dust concentration is also heavily dependent on the PM10 content. Further analysis revealed that in cases where the sL was high, the concentration of suspended dust was notably elevated. This suggests that not only does the sL level contribute to the dust concentration but also the interaction between the sL, PM10 content, and the wavelength also determines the extent to which suspended dust is generated. The relationship between these factors highlights the complexity of managing road dust, where controlling the wavelength could reduce dust suspension, especially in areas with high PM10 content and elevated sL levels (
Figure 17).
However, the findings indicate that when MTD is within a mid-range, the impact of the surface wavelength on suspended dust concentration is negligible if the silt load (sL) remains low with the result of
Figure 18. In this study, a low sL level was identified as 0.05 g/m
2, corresponding to the dust load observed in the special metropolitan area of Seoul. This suggests that on urban roads with minimal dust accumulation, the surface wavelength may not be a critical factor influencing dust suspension. Conversely, when sL exceeds 1.0 g/m
2—typically associated with industrial areas in South Korea [
25]—suspended dust concentration significantly increases. In such cases, minimizing the surface wavelength becomes essential to mitigating dust emissions. This can be achieved by reducing the peak height of surface texture, specifically by minimizing the gap between aggregates in asphalt pavement. Implementing this approach could serve as an effective strategy for managing suspended dust levels based on road dust load conditions.
3.7. Relationship Between Silt Loading and PM10 Content (%) with Road-Suspended Dust
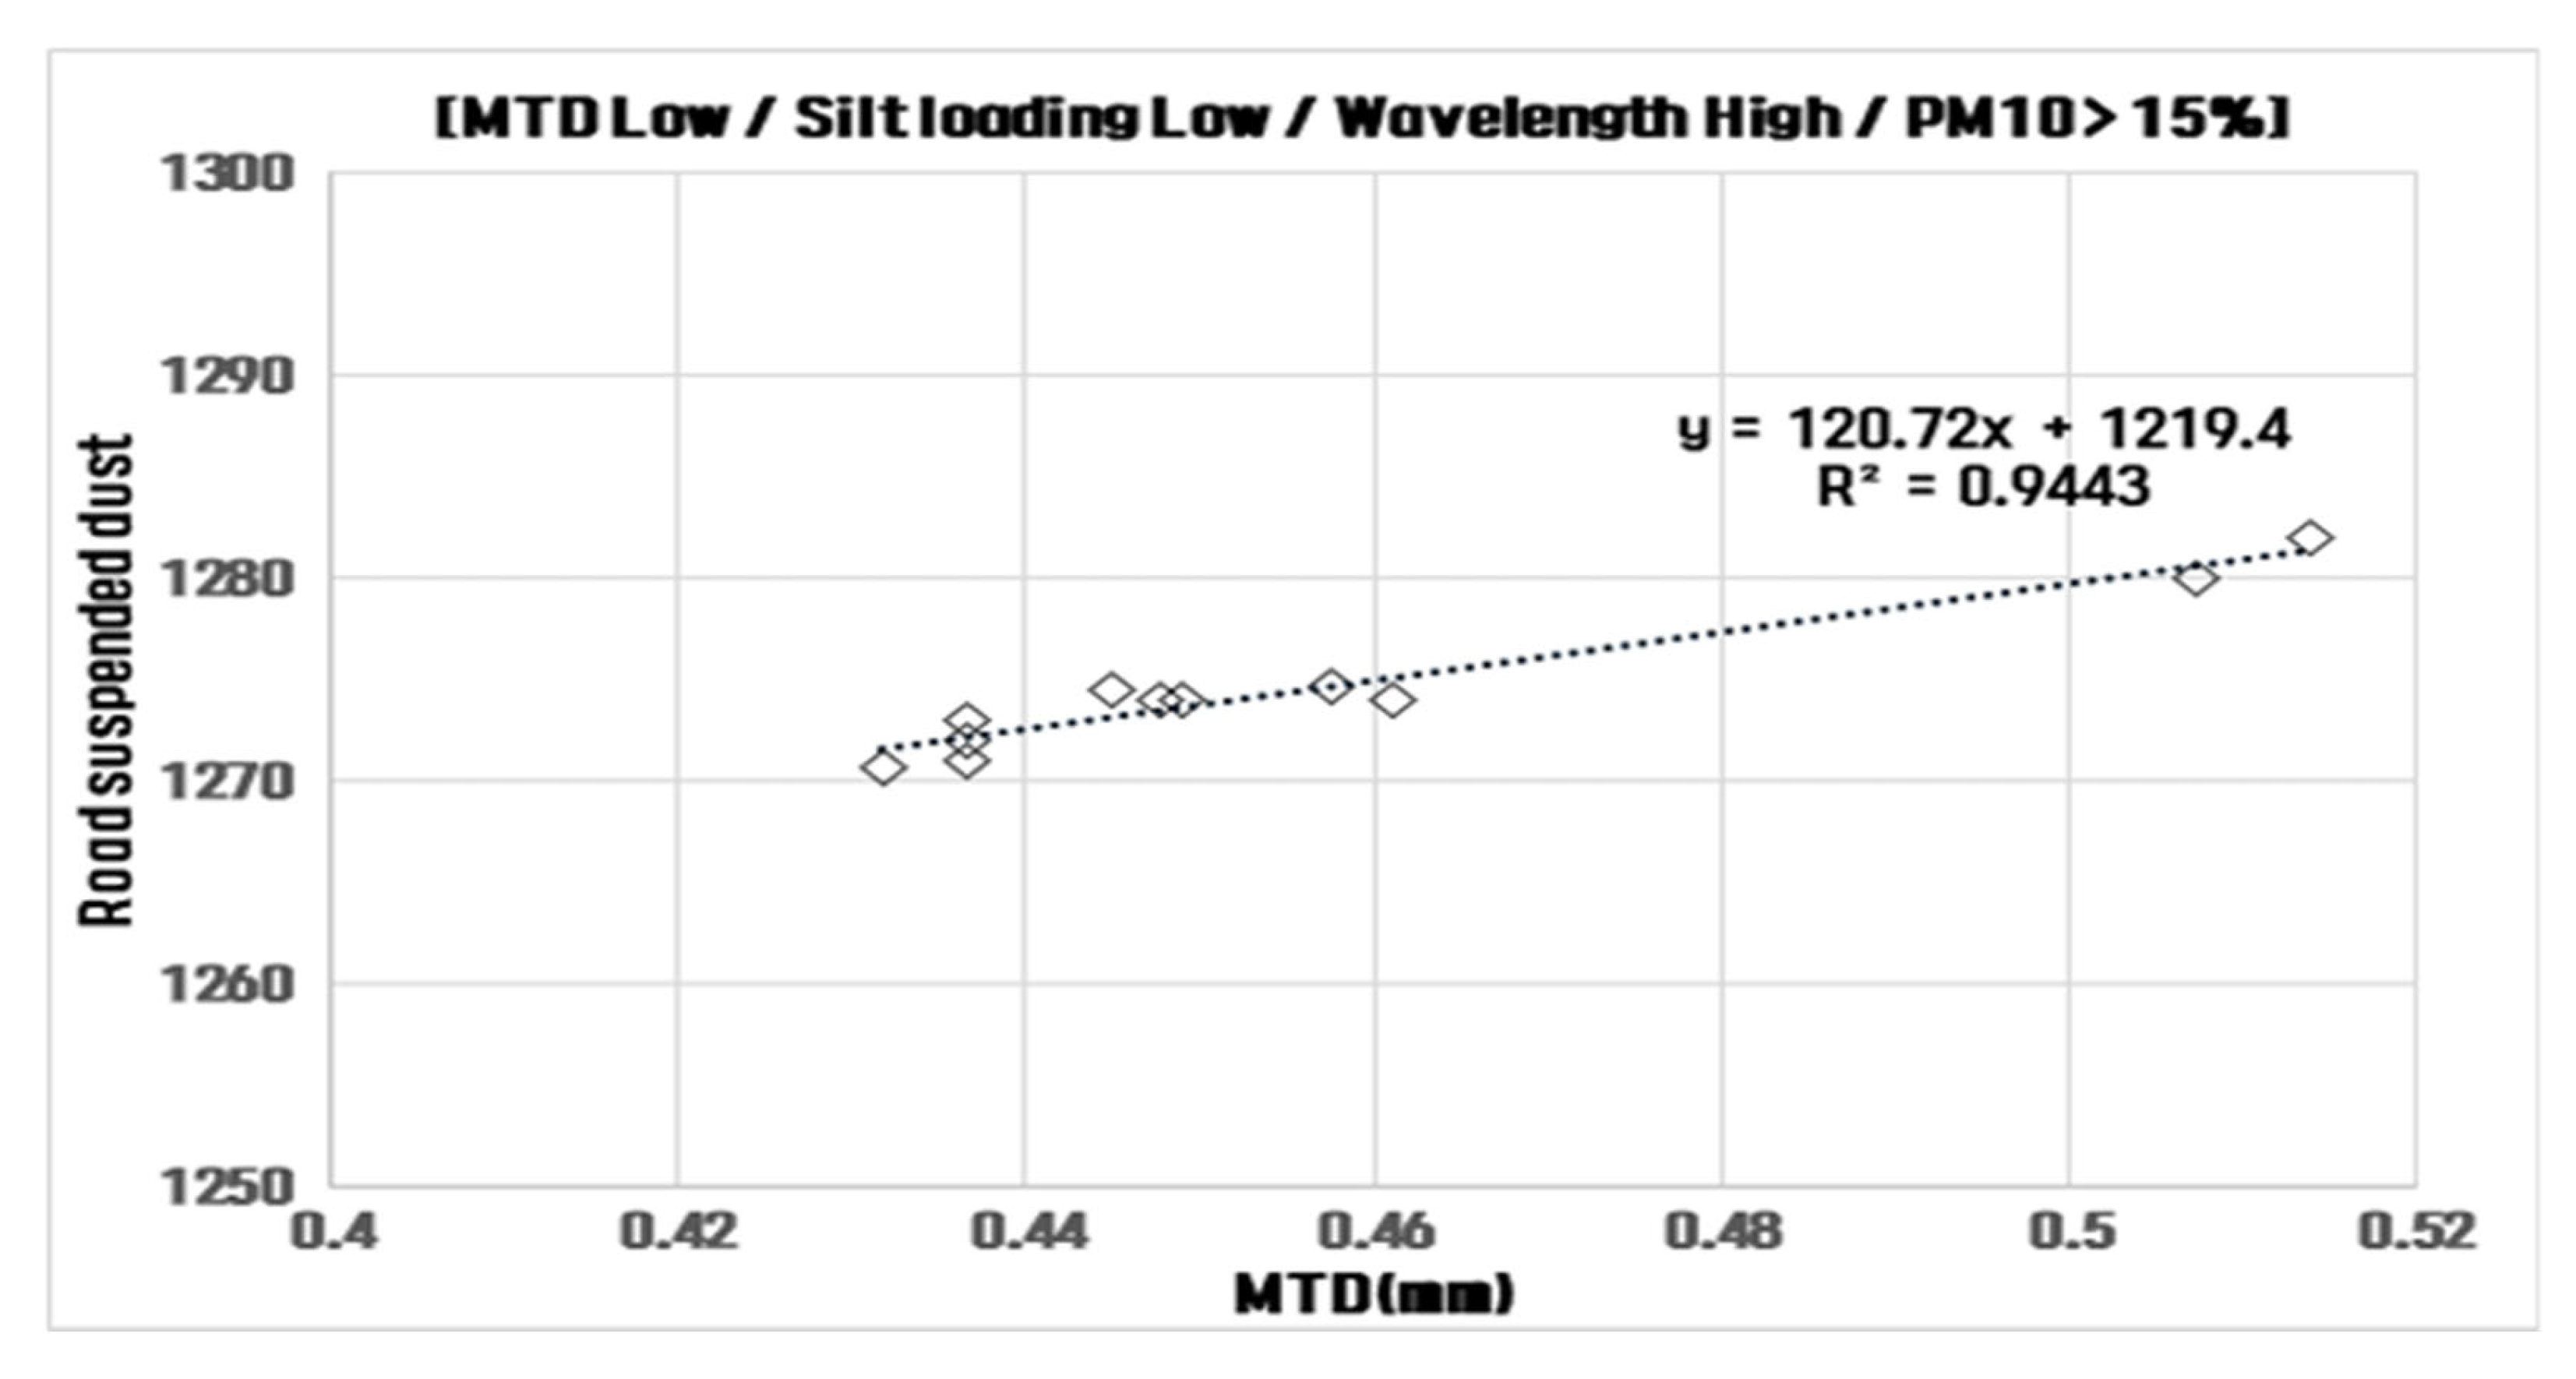
As observed in the analysis of Site A, where the PM10 content averaged 15%, even when both the MTD and sL were low, the suspended dust concentration remained high. This was particularly evident when both the PM10 content and the wavelength were high. The suspended dust generation mechanism related to the road surface texture can be attributed to the significant amount of dust that becomes suspended in the air due to the long wavelength.
This is caused by contact with the peak level of the road surface during the rotation of the tires, which enhances the dust suspension process. Moreover, the results indicated that the higher the MTD, the greater the amount of sL. In sections where the MTD was lower, it was found that as the MTD increased, the suspended dust concentration also increased, which is consistent with the findings shown in
Figure 19. This suggests that the texture depth (MTD) plays a crucial role in the generation of suspended dust, particularly when considering the interaction between the road surface texture, tire contact, and dust load. Therefore, managing the MTD and wavelength is important for controlling road dust emissions, especially in areas with high PM10 content.
In Section A, despite the silt value being the lowest, the road-suspended dust concentration was the highest overall. This suggests that factors other than silt content, such as the texture depth (MTD) and dust load (sL), had a significant impact on dust levels.
Figure 20 presents the analysis of suspended dust concentration in relation to sL at the same MTD level. When the PM10 content ranged from 2% to 4% in sections where the MTD was less than 0.7 mm, the dust concentration was found to be 20% higher when the sL was at a middle level, which reflects typical conditions found on urban roads. This indicates that the higher the sL value, the higher the concentration of suspended dust, emphasizing the importance of dust load in dust suspension.
Therefore, it is observed that the gap between aggregates increases with a longer wavelength [
18], which creates more space for dust particles to become suspended in the air. This suggests that the wavelength has a significant effect on the concentration of suspended dust. Additionally, as a result of analyzing suspended dust according to both the high sL and high wavelength within the same MTD level, it was found that higher sL values correspond to a 20% increase in suspended dust concentration. This increase in dust concentration is believed to be influenced by the higher sL, which in turn affects the dust levels, despite maintaining similar PM10 content across the measurements. This reinforces the relationship between sL, wavelength, and the concentration of suspended dust, highlighting their combined impact on road dust emissions (
Figure 21).
As a result of analyzing the concentration of suspended dust at the middle MTD level, it was found that sL values ranging from 0.05 to 0.08 g/m2 corresponded to a moderate level of suspended dust, while higher sL values between 0.08 and 0.12 g/m2 led to increased suspended dust concentrations. Moreover, elevated sL levels were associated with higher suspended dust levels. The analysis also revealed a distinct difference in suspended dust concentrations between sL values below 0.1 g/m2 and those exceeding 0.1 g/m2, indicating that sL plays a critical role in determining suspended dust.
At the highest MTD level, exceeding 1.7 mm, the concentration of road-suspended dust remained constant regardless of further increases in MTD expressed in
Figure 22. This suggests that an MTD threshold of 1.7 mm effectively stabilizes middle-level sL, preventing dust from becoming airborne due to the deeper texture depth. Therefore, for managing road dust in areas with high sL levels, optimizing the MTD can serve as a practical strategy for mitigating suspended dust emissions. Analysis of road surface texture depth and wavelength cycles in asphalt pavement indicates that MTD and wavelength influence suspended dust levels differently under the same conditions. This variation is attributed to aggregate particle size, as both MTD and wavelength are strongly correlated with changes in aggregate size. Consequently, the influence of aggregate particle size on asphalt pavement is expected to be significant [
12], with smaller maximum aggregate sizes leading to lower suspended dust levels. Furthermore, the analysis revealed that when the MTD is low and wavelength is high, the suspended dust concentration increases.
3.8. Mechanism of Road-Suspended Dust with Different Types of Asphalt Pavement
Based on the data of measured dust concentration by suspended dust influencing factors, correlation analysis was conducted to identify the correlation between each variable and examine the linearity and independence. Correlation analysis is a method of analyzing the linear relationship between two variables, and it is characterized by using the coefficient to determine the degree of relationship, which is generally expressed as the Pearson correlation coefficient. It has a value between −1 and 1, and if it is close to −1, it is a negative correlation, and if it is close to 1, it is a positive correlation, and if the absolute value is close to 0, it can be seen as almost no correlation. In general, if the absolute value of the correlation coefficient is above 0.8, it means a strong correlation, if it is between 0.8 and 0.4, it means a moderate correlation, and if it is below 0.4, it means a weak correlation. In this case, Right MTD was selected because it has a high correlation with suspended dust concentration. The correlation analysis, as shown in
Table 5, shows that road-suspended dust concentration in concrete pavement is correlated with all variables except wetness to some extent, and the correlations between the variables are all weaker than 0.5 except wavelength, so it can be inferred that independence exists. However, in this study, we want to analyze the interaction effect to determine whether there is an interaction between the factors affected by road-suspended dust.
The results of multi-regression analysis by influencing factors on the mechanism of suspended dust generation in asphalt pavement is shown in
Table 5. The
p-value was calculated to be less than or equal to 0.05 with 95% confidence, so the results of this regression analysis are considered statistically significant. The t-statistic is an indicator of whether the regression coefficient of each independent variable is statistically significant, and the larger the absolute value of the t-statistic, the greater the impact of the independent variable on the dependent-187 variable. In general, a t-statistic is known to be significant if the absolute value of the t-statistic is greater than or equal to 2. Therefore, based on the t-statistic, wavelength and the MTD were found to be the largest variables explaining suspended dust for concrete and asphalt pavement for each. In the case of wavelength, there is still no officially approved standard like texture depth, but from this study, the importance of wavelength can be a factor for the generation of road-suspended dust. Based on the 95% confidence interval, it can be concluded that wavelength, sL, and PM10 content have a positive effect on the increase in road-suspended dust, while the MTD has a negative correlation. This is consistent with previous studies finding that the MTD of road texture reduces suspended dust concentration [
6,
7,
26,
27,
31], and may suggest that considering PM10 content and wavelength in addition to analyzing sL as a single factor can predict concentration changes more accurately. The results of the analysis in this section show that the MTD related to road texture is related to suspended dust that slope of the trend line is negative for asphalt pavement. Moreover, sL * PM10 content are shows positive correlation, indicating that the higher the dust load and PM10 content, the higher the suspended dust.
Based on these findings, the mechanisms and results of suspended dust generation for asphalt pavement types were analyzed and summarized in
Table 6. The analysis concludes that sL characteristics and dust concentration vary depending on MTD and aggregate size for each pavement type. This suggests that surface texture management, particularly controlling MTD and aggregate size, plays a crucial role in mitigating suspended dust emissions.


