
Theoretical Analysis of Suspended Road Dust in Relation to Concrete Pavement Texture Characteristics


Abstract
1. Introduction
2. Materials and Methods
2.1. Study Area
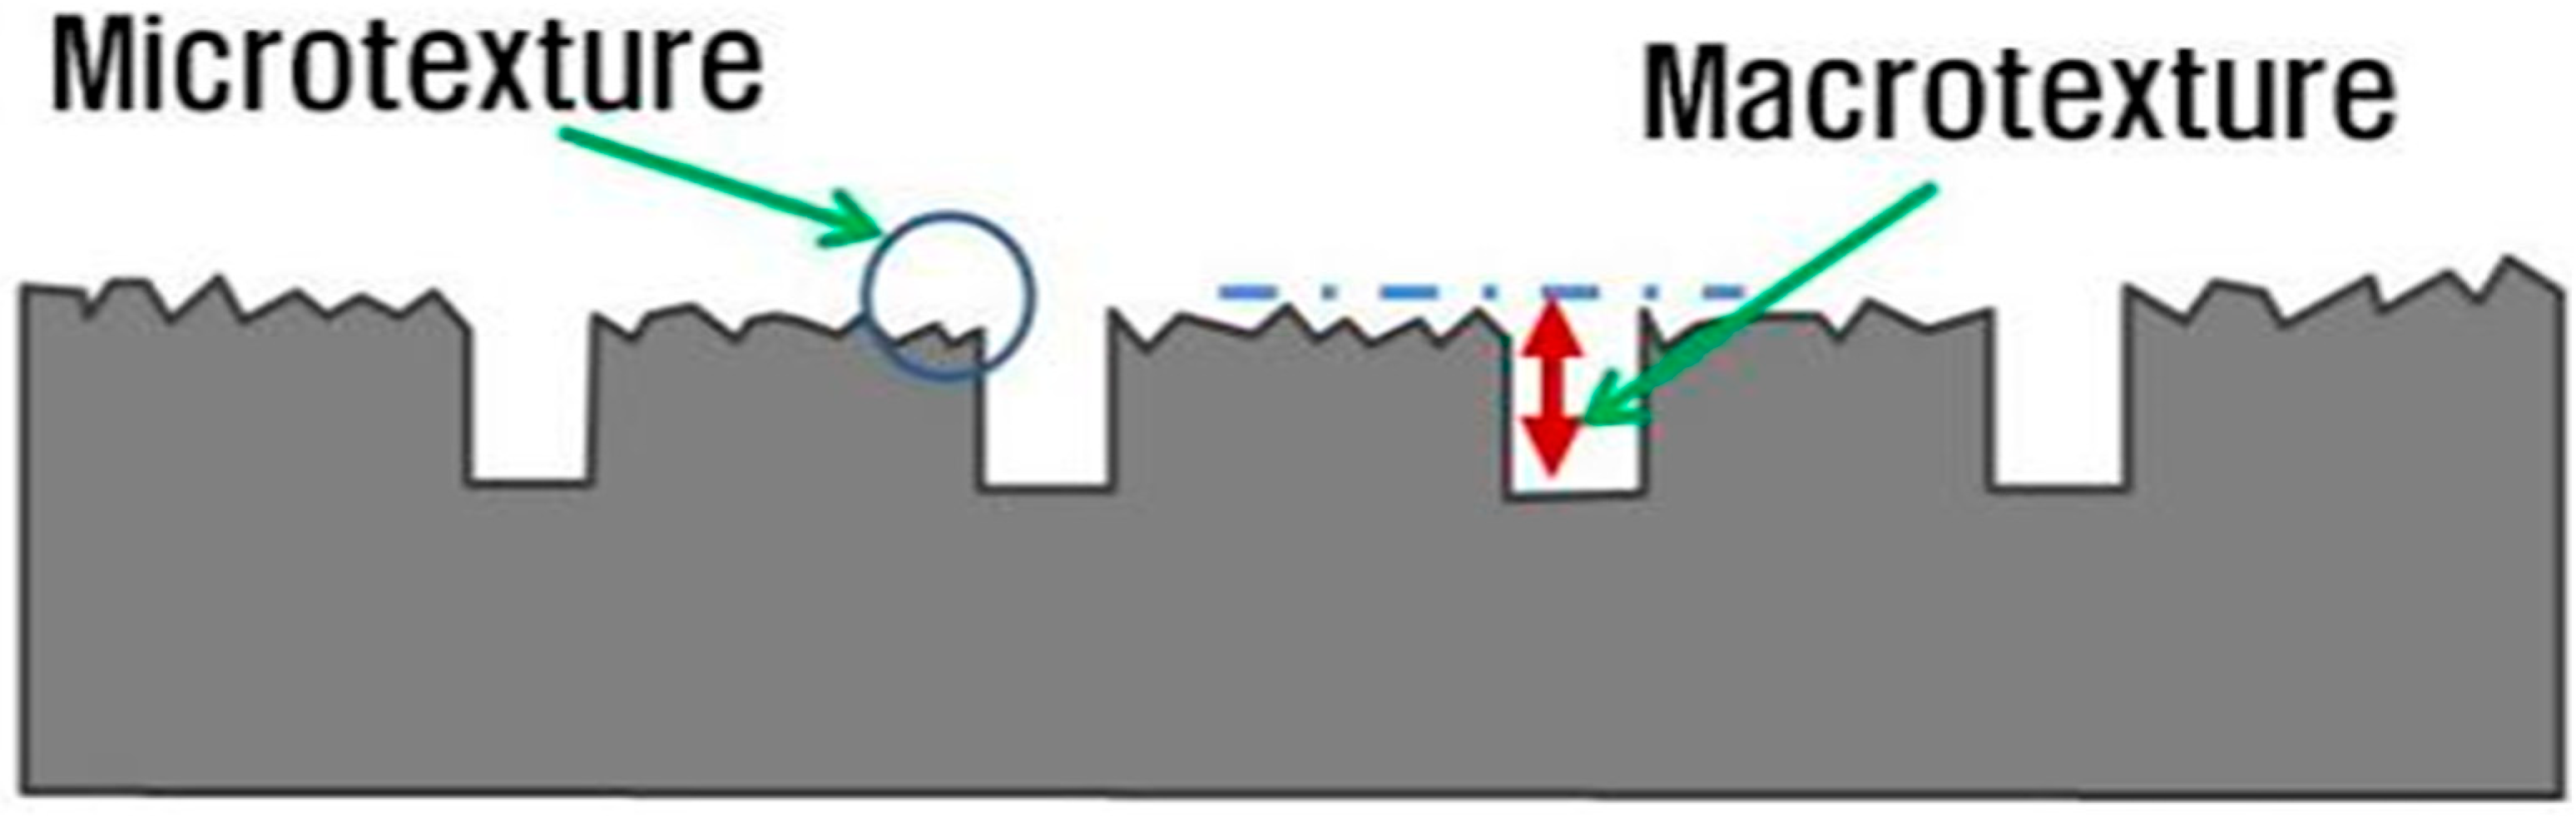
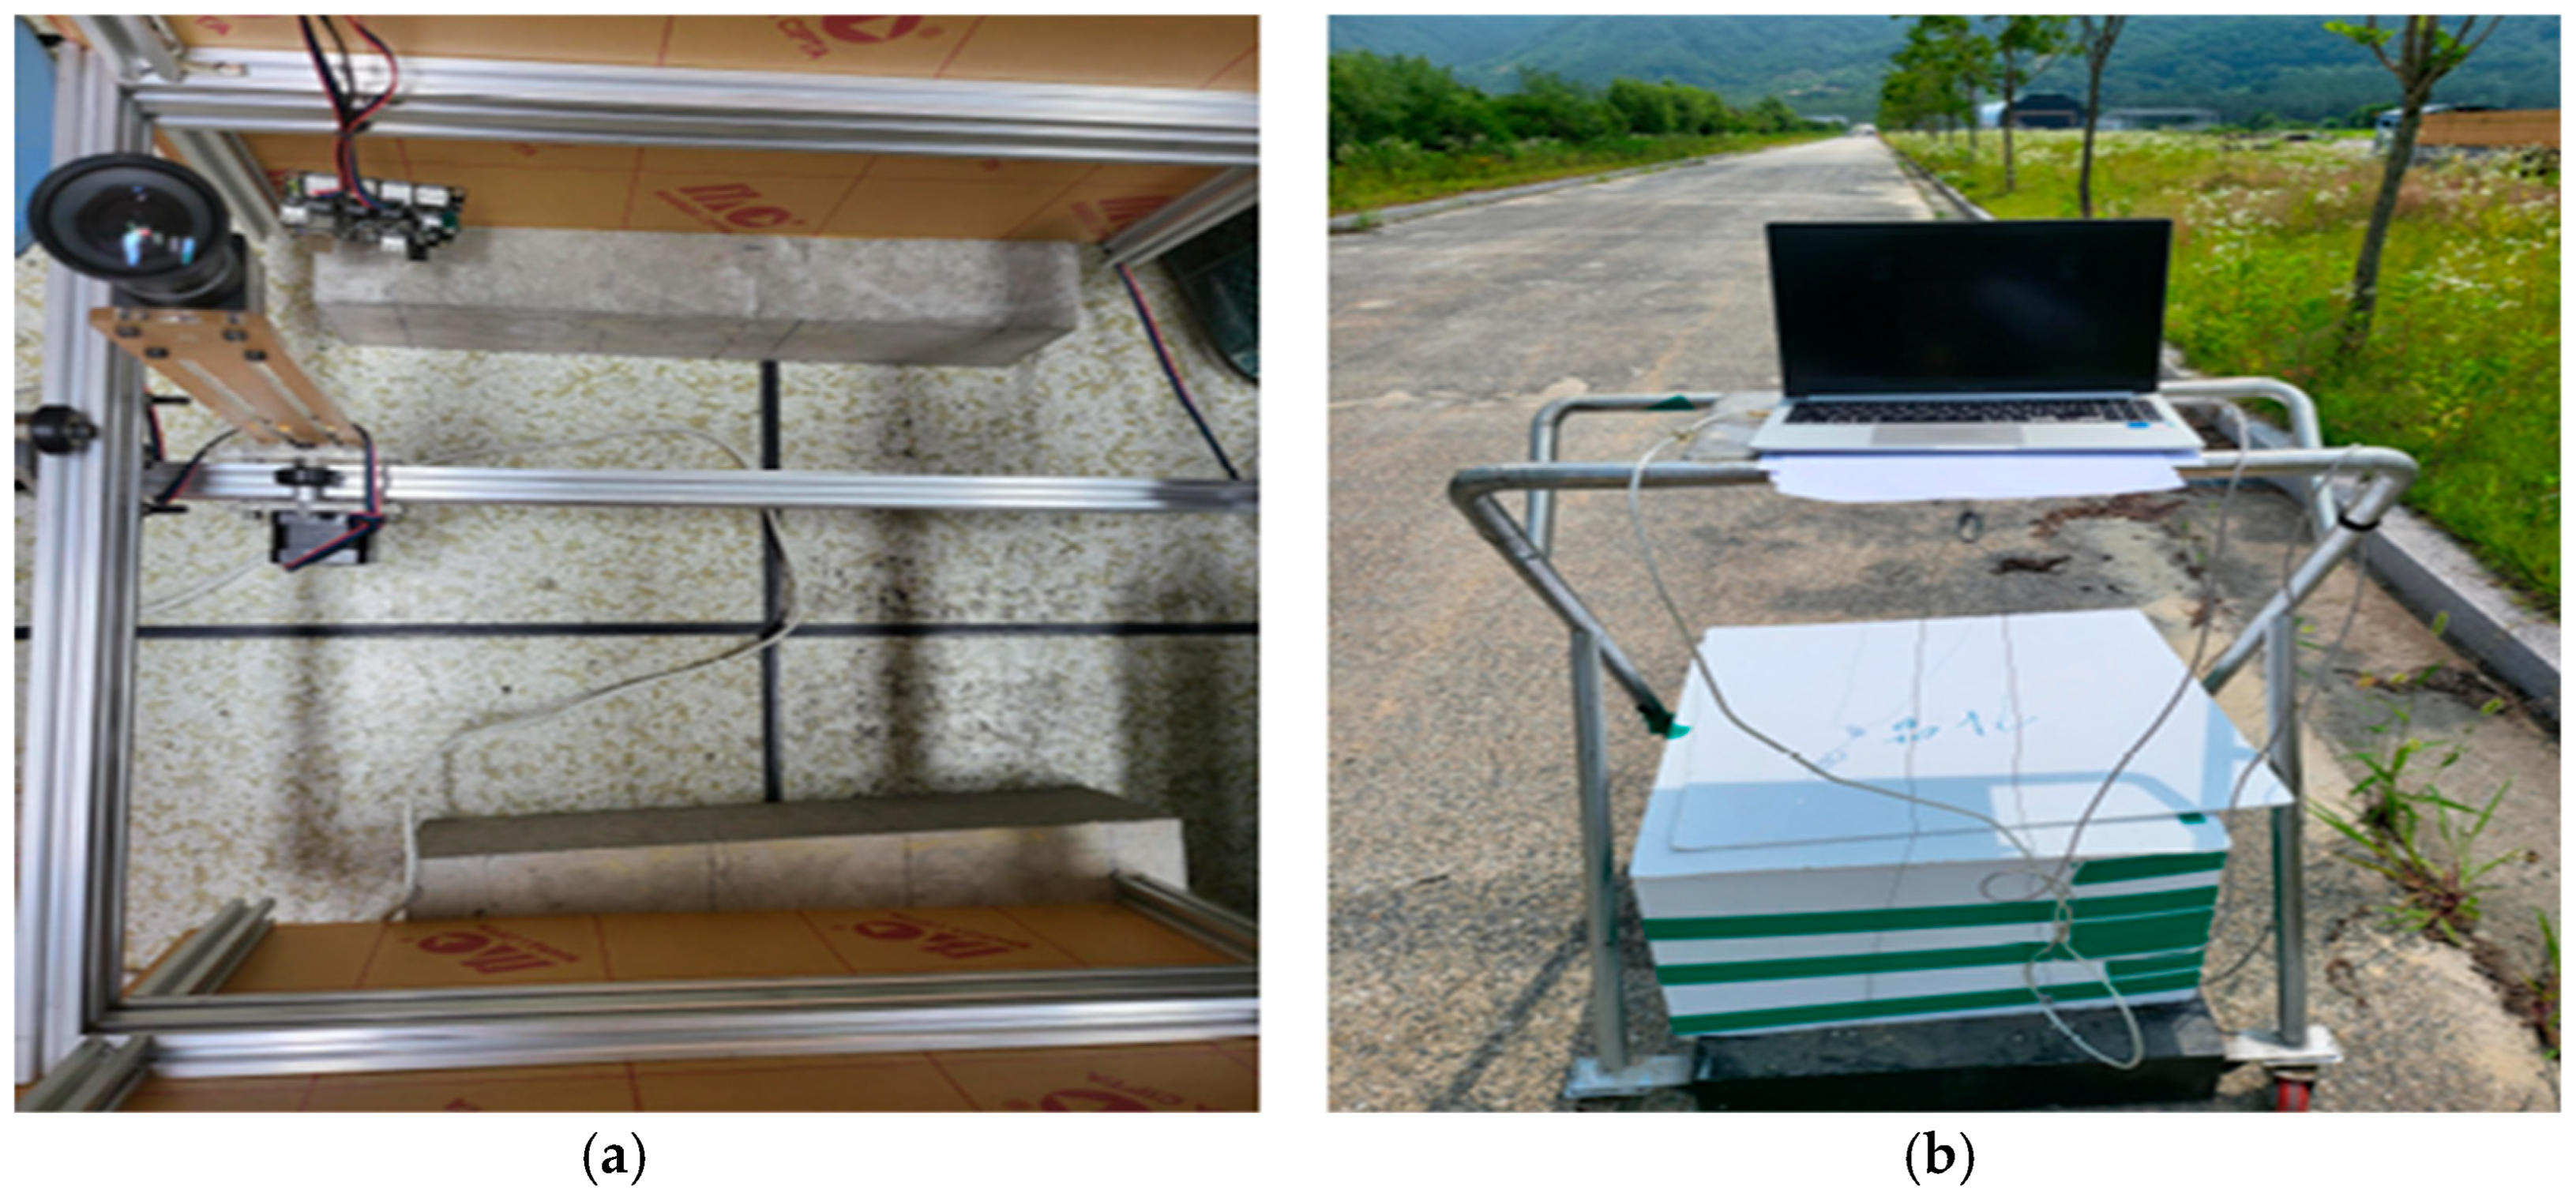
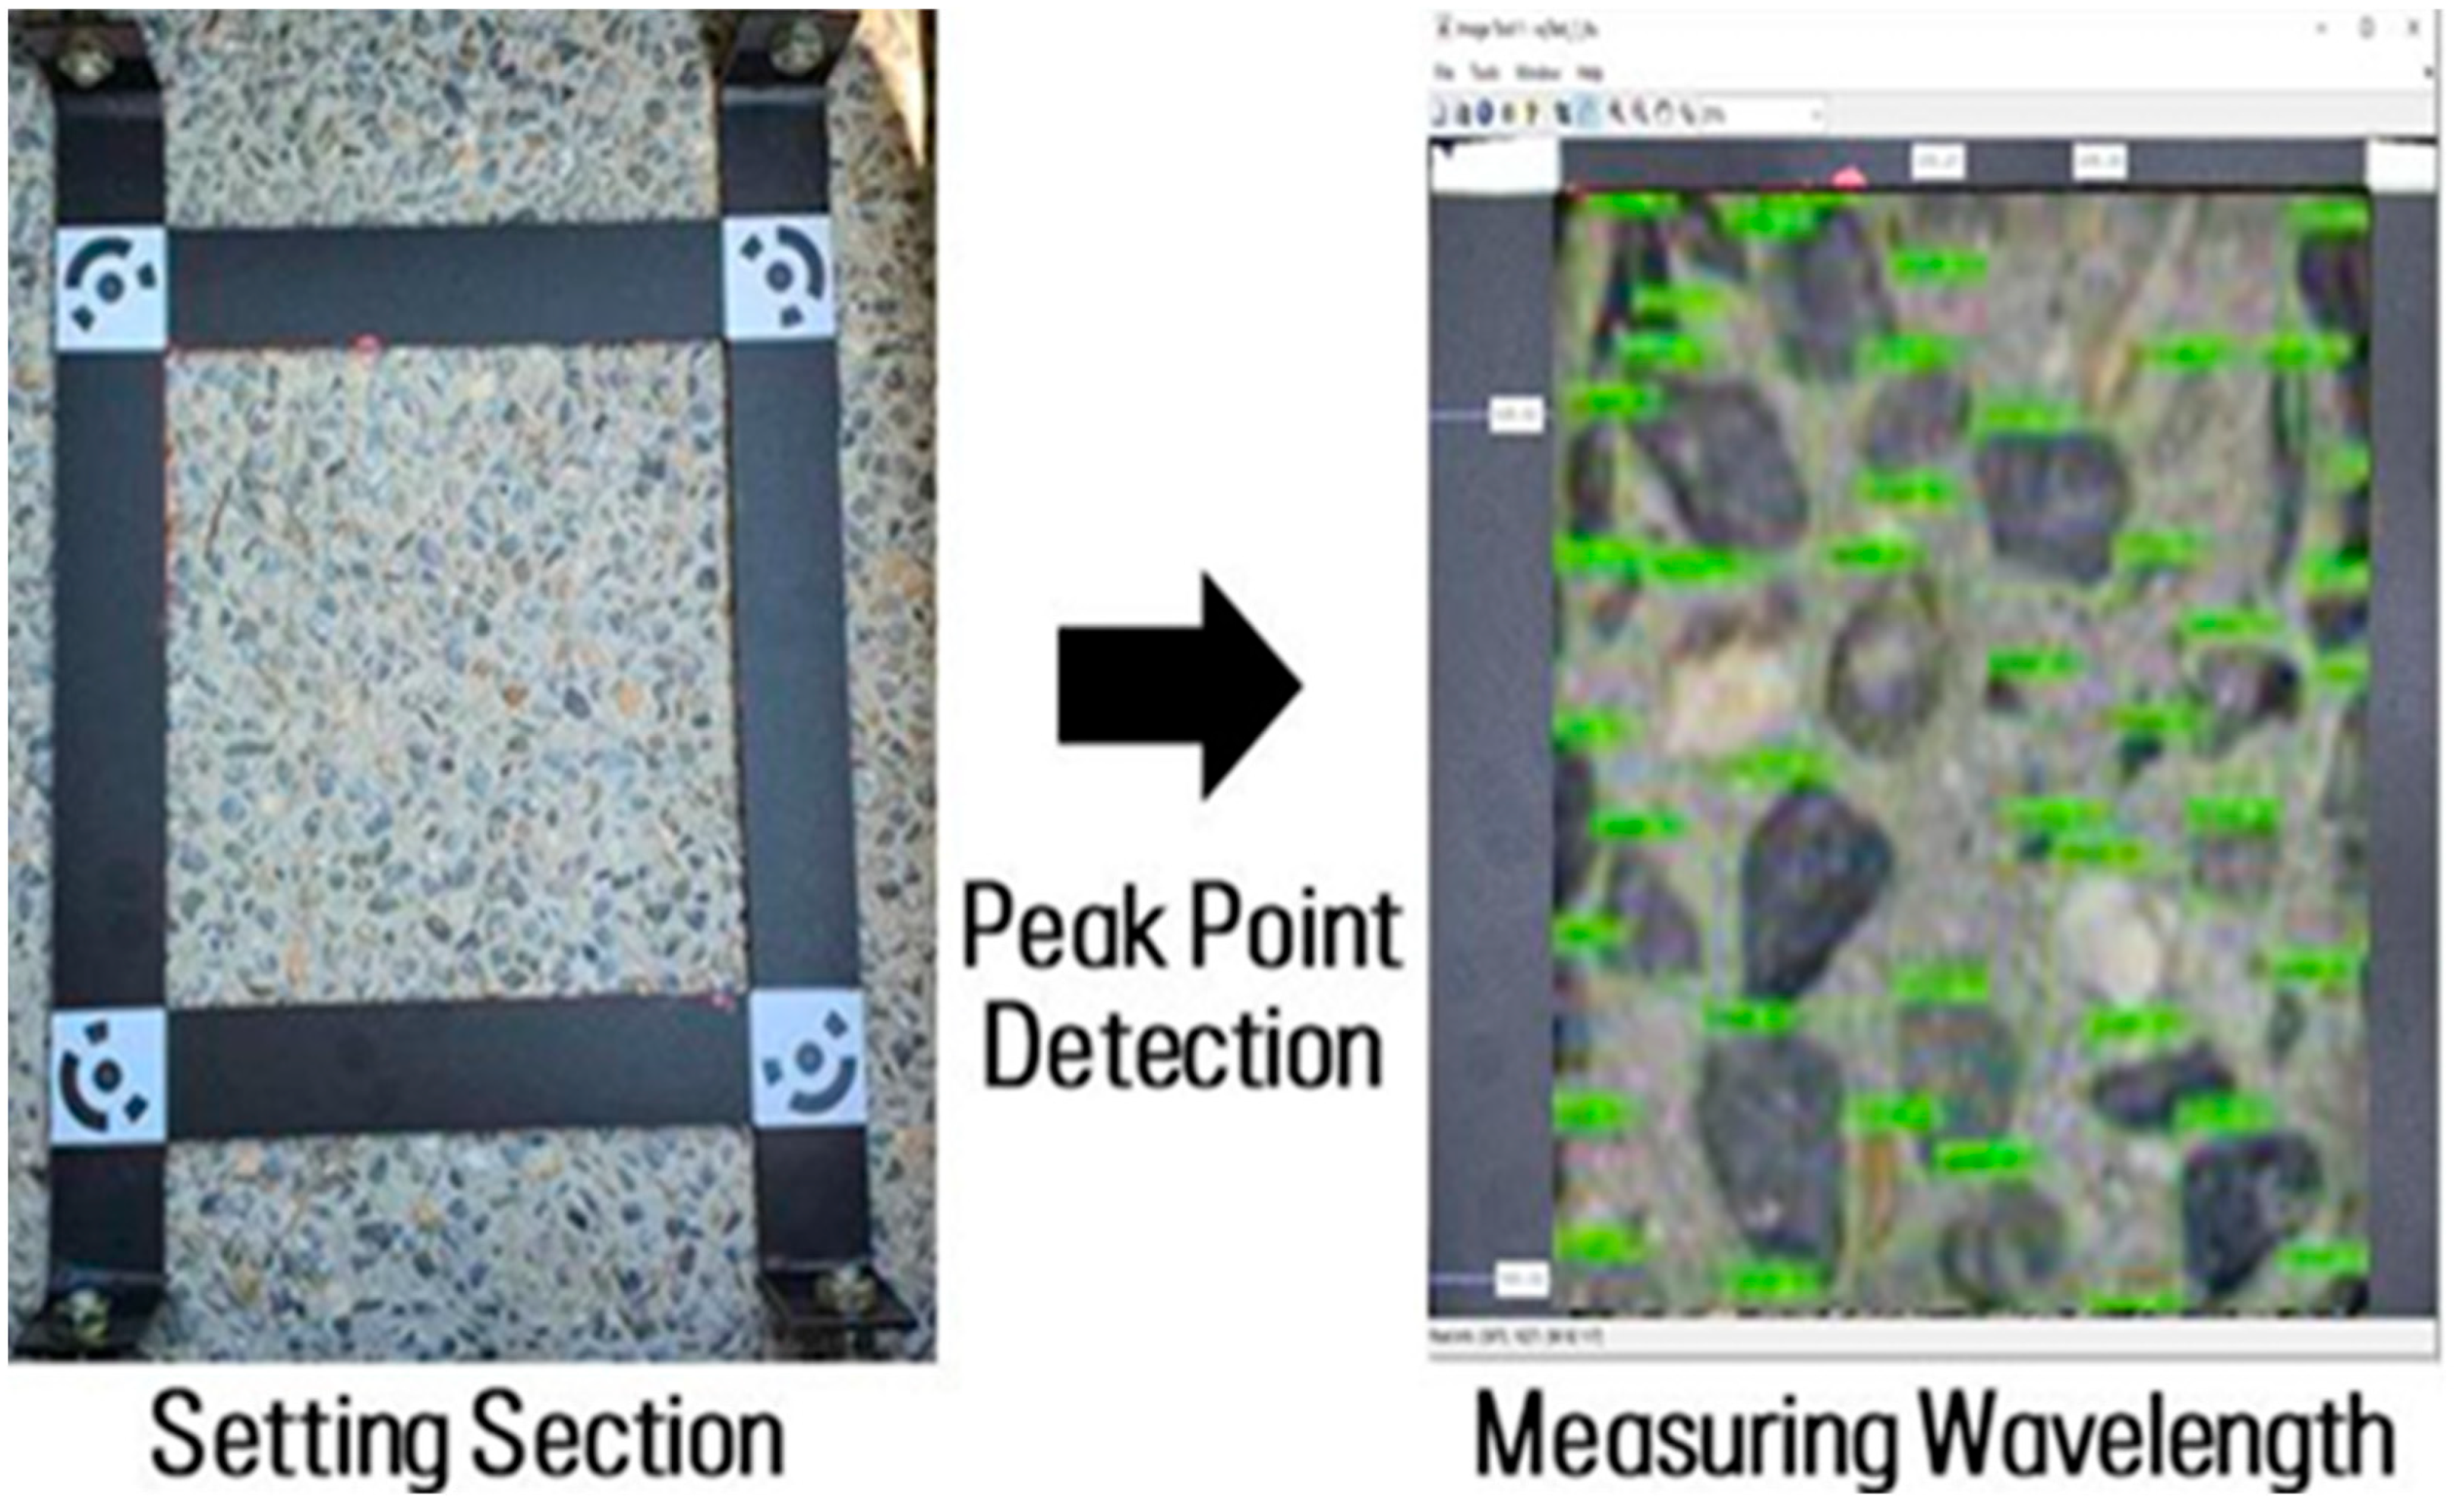
2.2. Measurement of Micro and Macro Surface Texture of Concrete Pavement
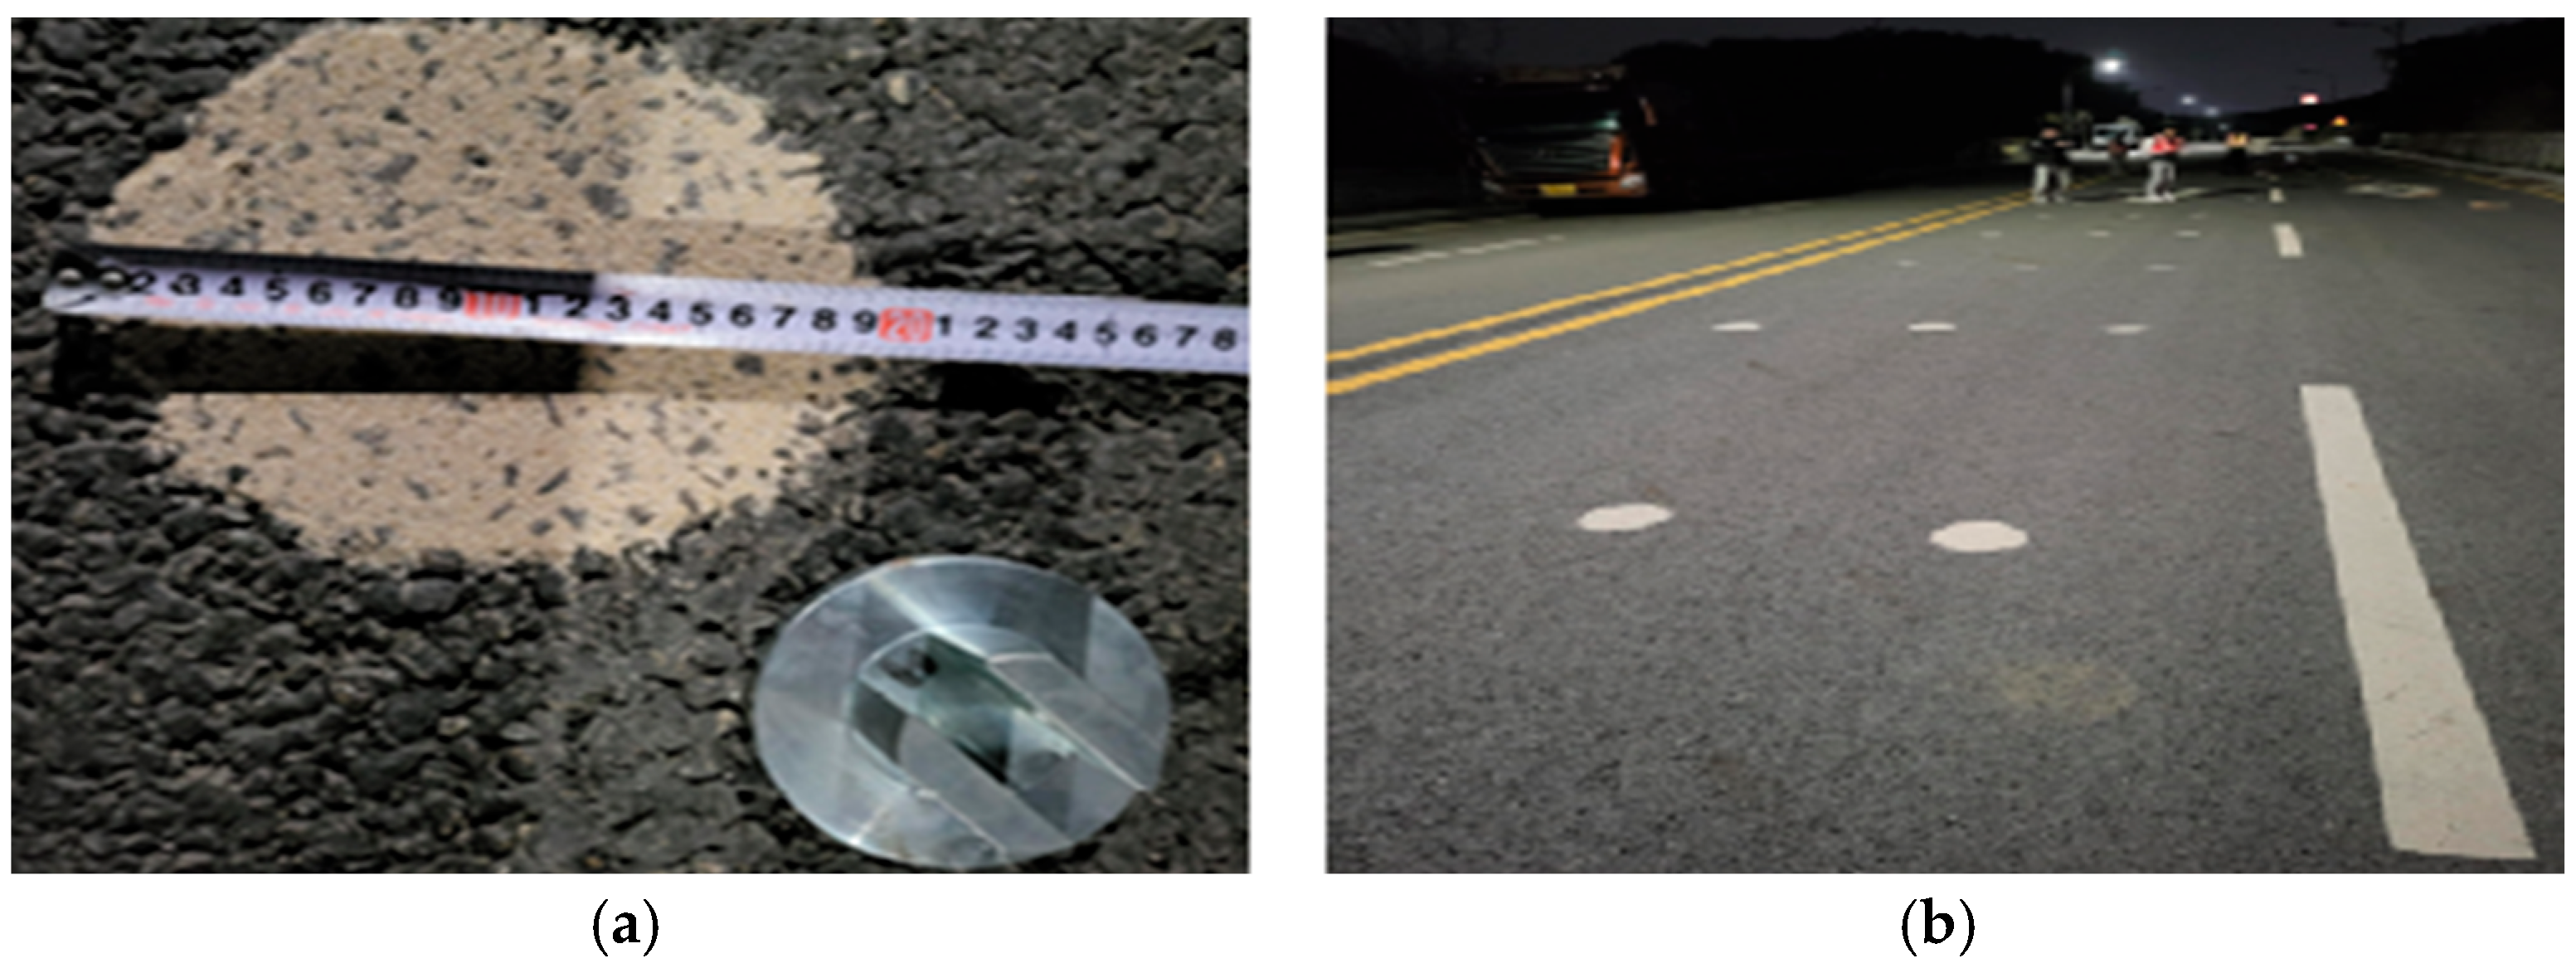
2.3. sL and Suspended Road Dust Measurement
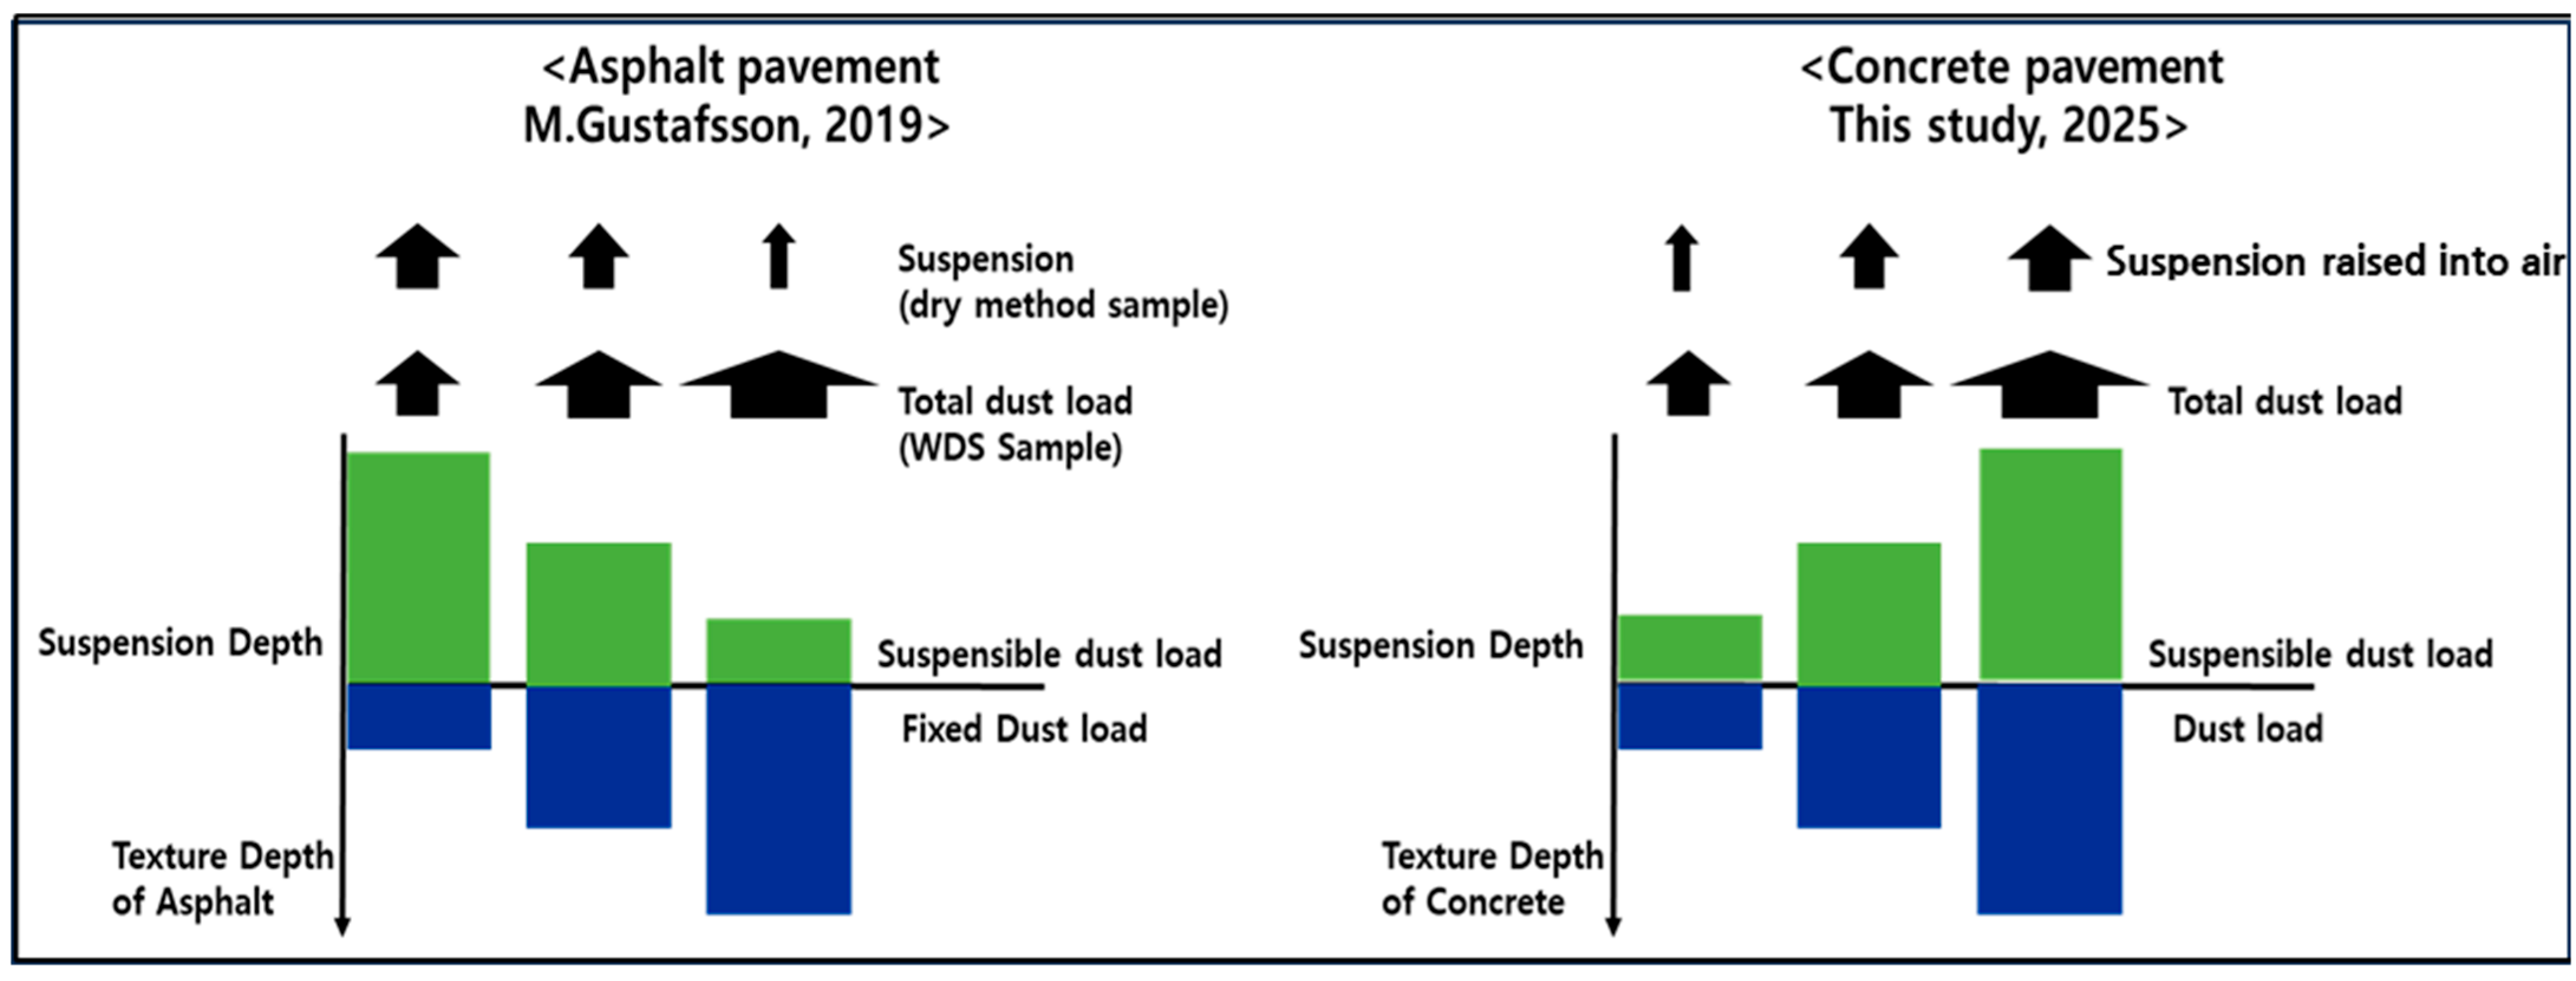
2.4. Assumption
3. Results
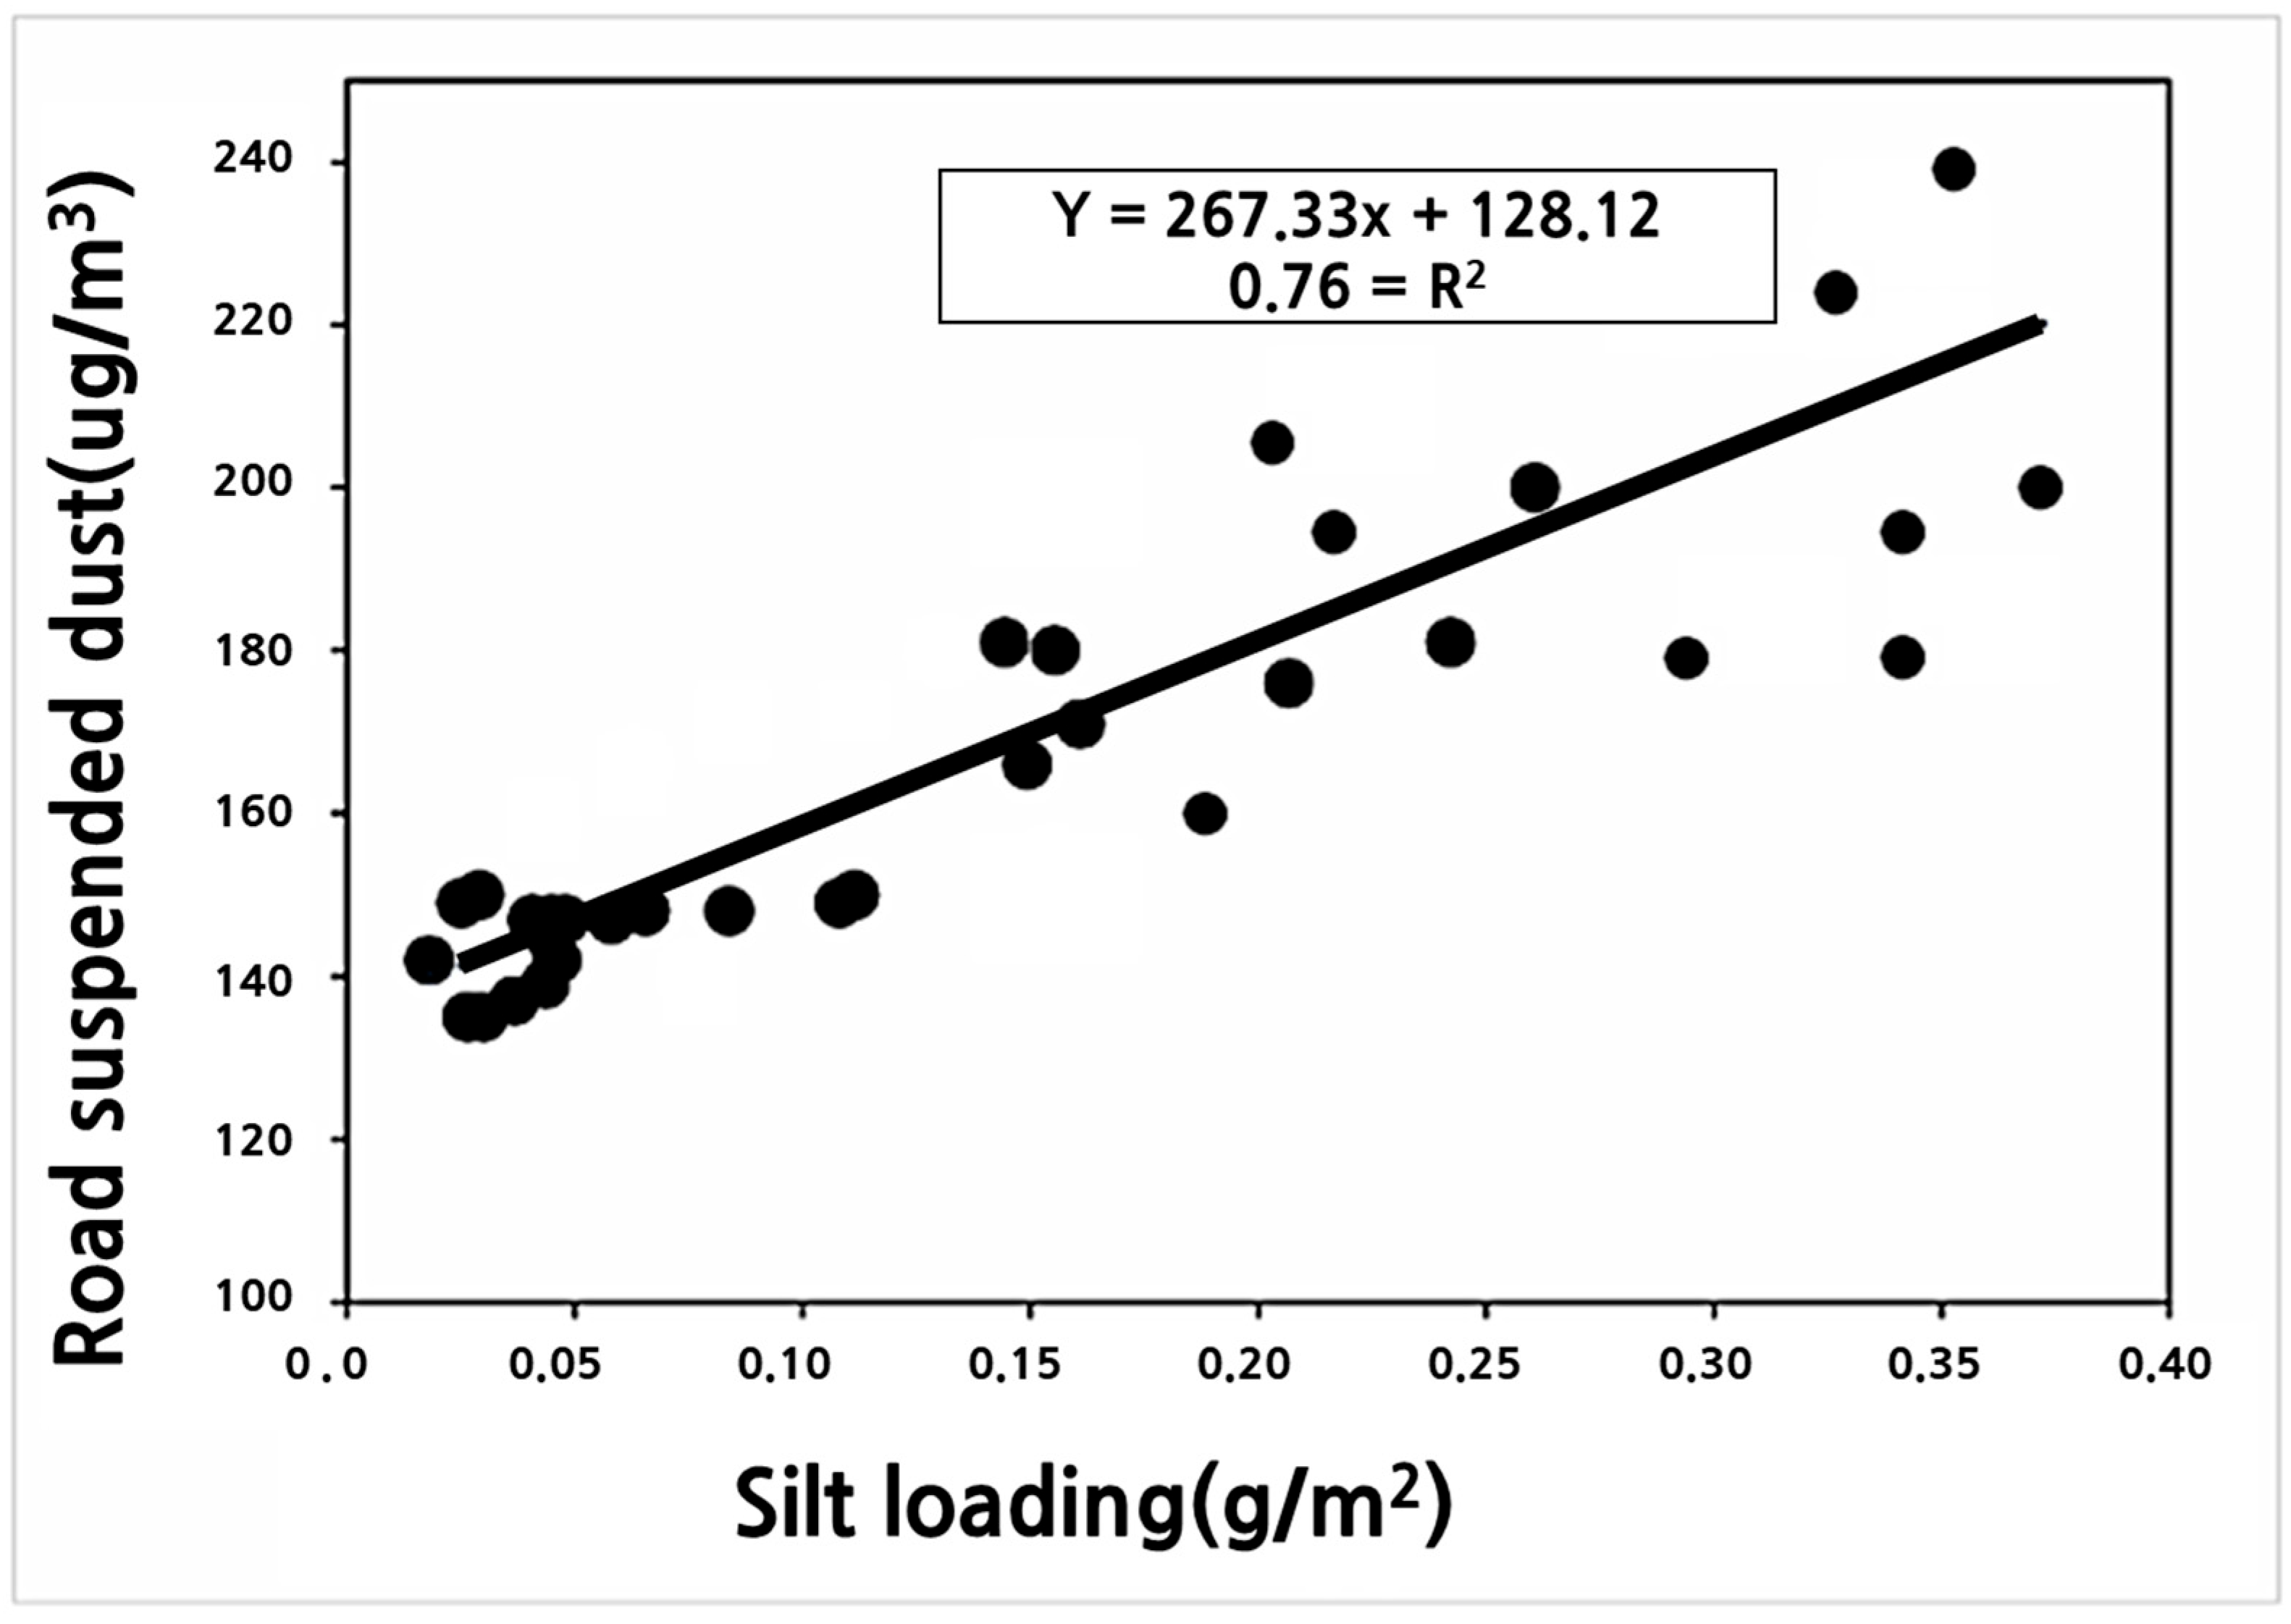
3.1. Correlation Between sL and Suspended Road Dust for Validation
3.2. Data Eligibility Criteria for Analyzing Suspended Road Dust and Surface Texture Parameters
- Suspended Dust Measurement: PM10 concentrations were recorded prior to sL sampling. If a measured value was lower than the background concentration—indicating potential interference from nearby vehicles or environmental sources—the corresponding data point was excluded.
- sL Measurement: sL was then quantified using the vacuum-based sampling method described earlier to determine the mass of deposited dust per unit area on the pavement.
- Road Surface Texture Measurement: After dust collection, the surface texture depth and wavelength were measured to characterize the pavement texture under low dust-loading conditions.
- Data Filtering: When averaging suspended dust concentrations for a given road segment, only stable measurements collected over approximately 10 seconds of non-accelerating motion were used. Data collected during turns or immediately following a U-turn were excluded based on road alignment.
3.3. MTD and Average Wavelength Results for Different Types of Concrete Pavement
3.4. Analysis of Dust Generation Based on MTD
3.5. Results of sL According to MTD
3.6. Results of Suspended Road Dust Across Different Concrete Pavement Types
4. Discussion
5. Conclusions
- (1)
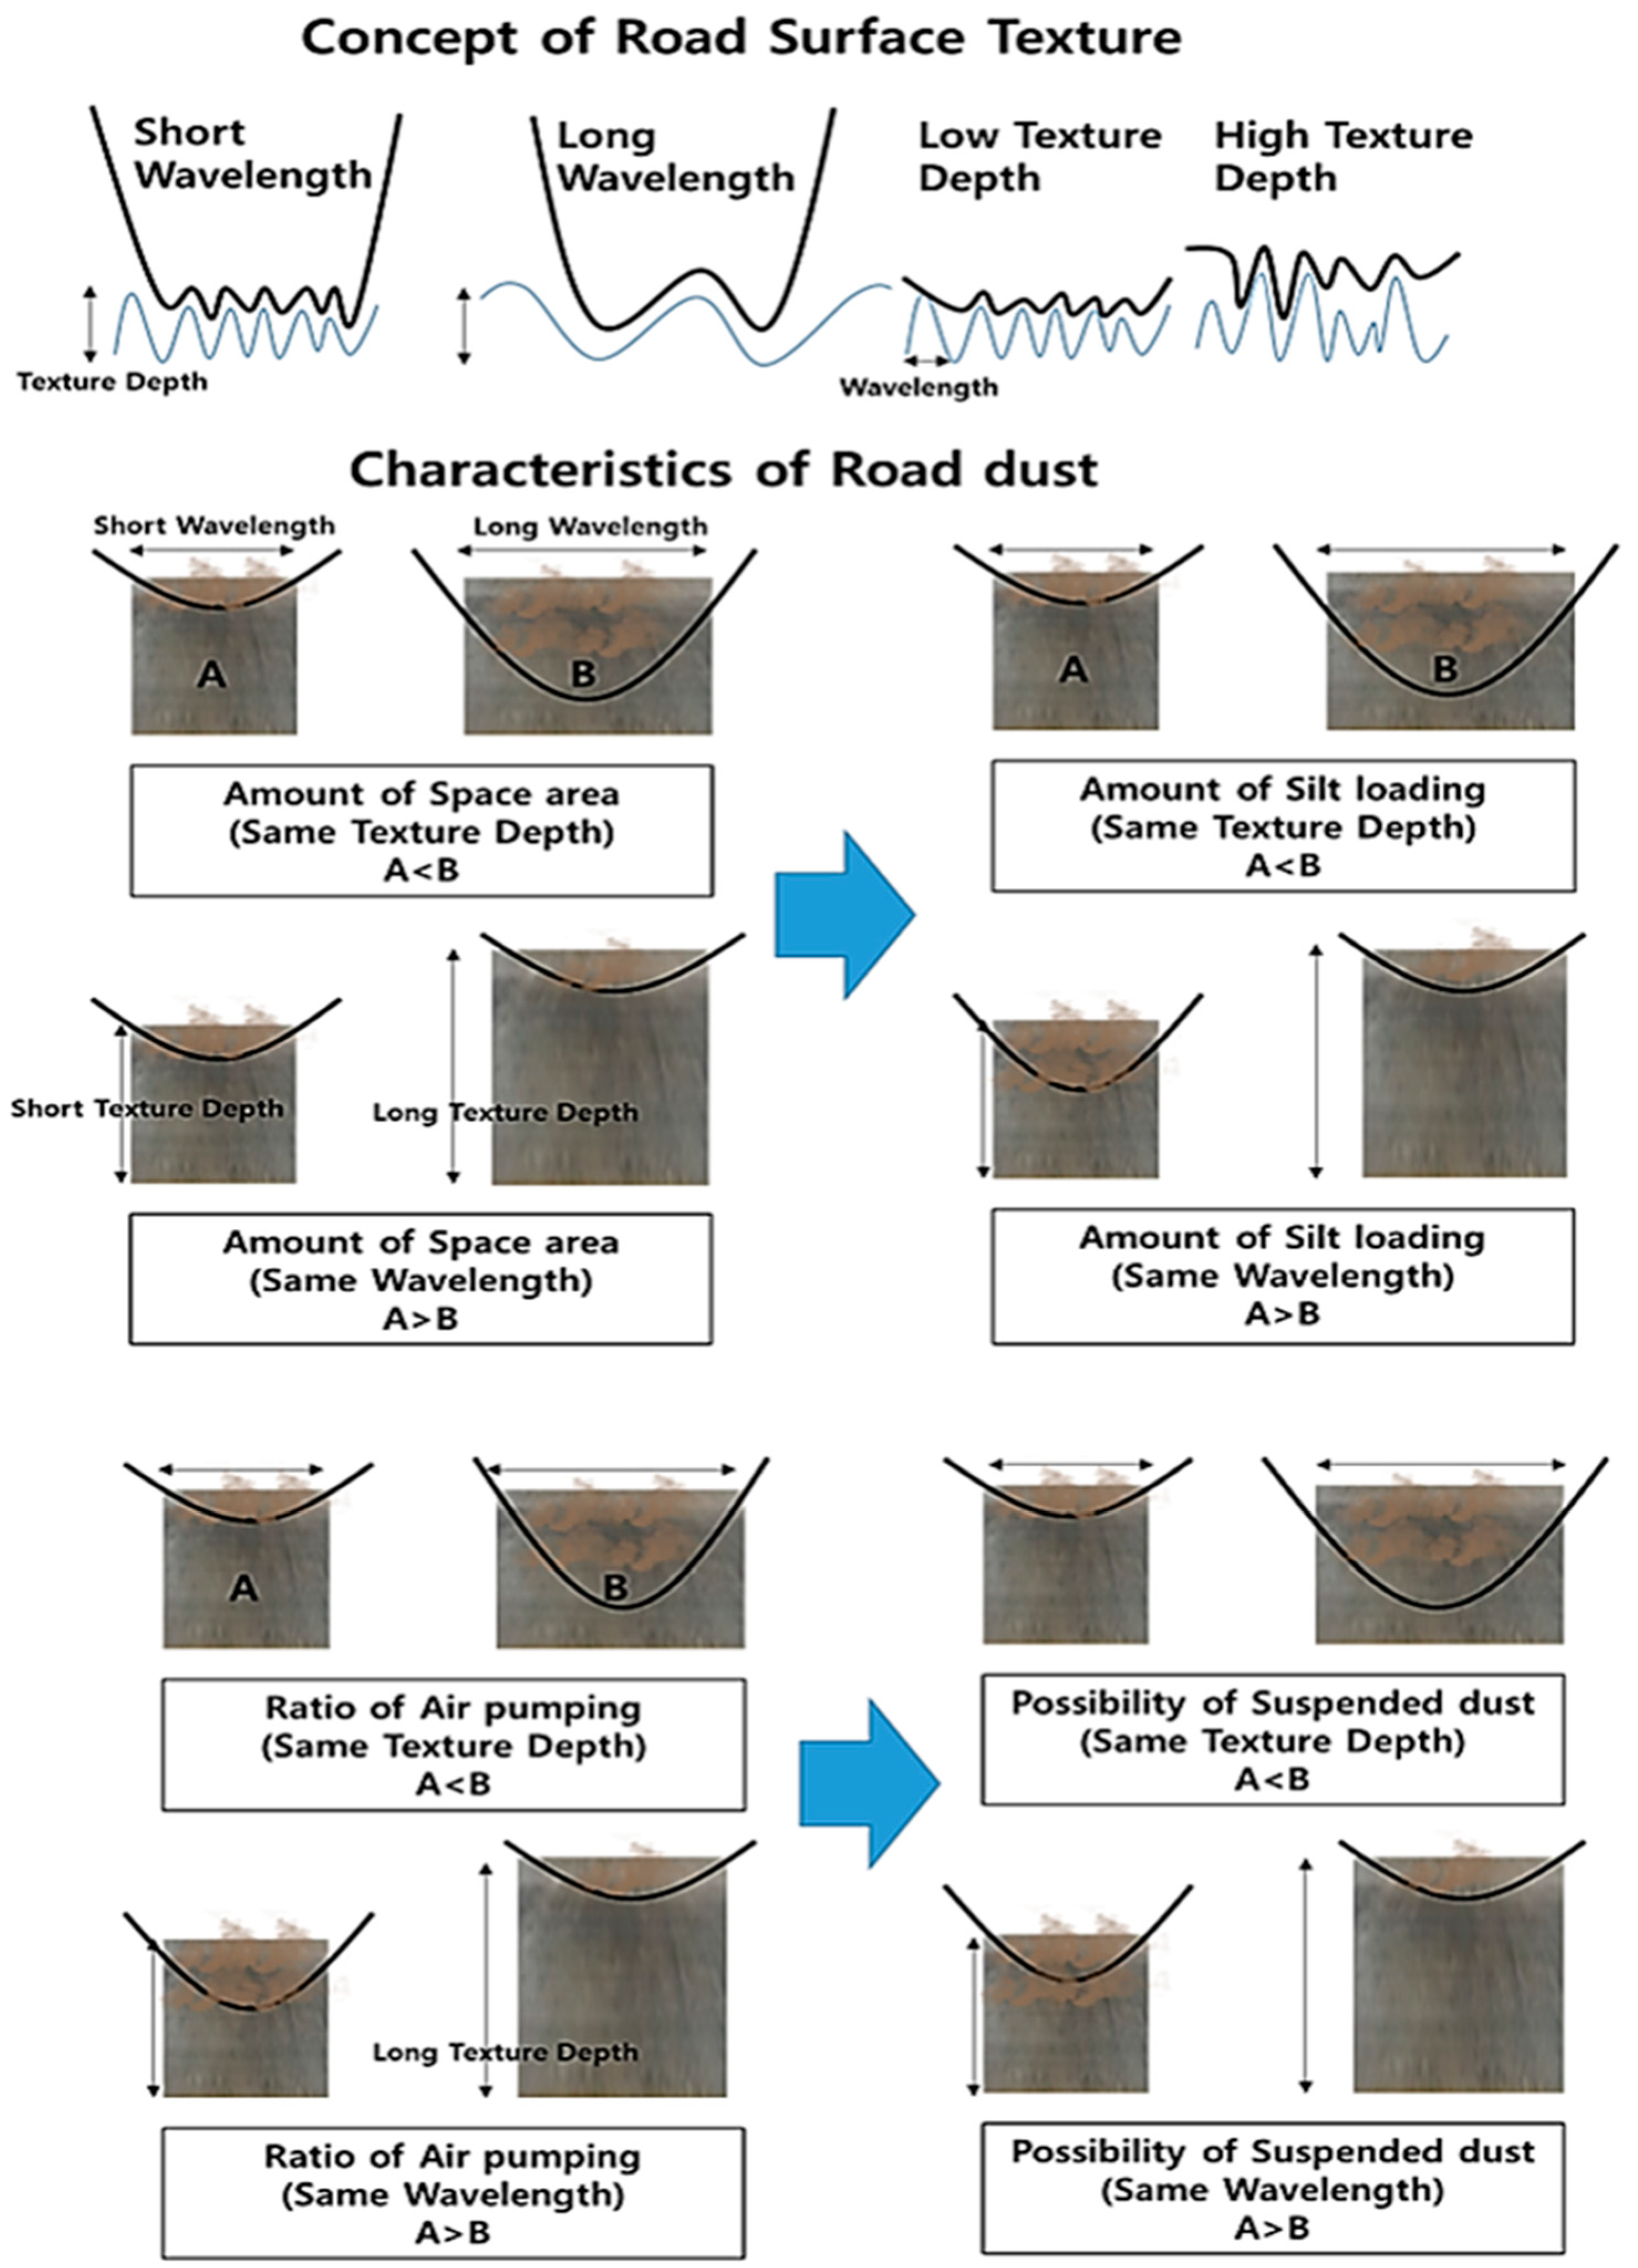
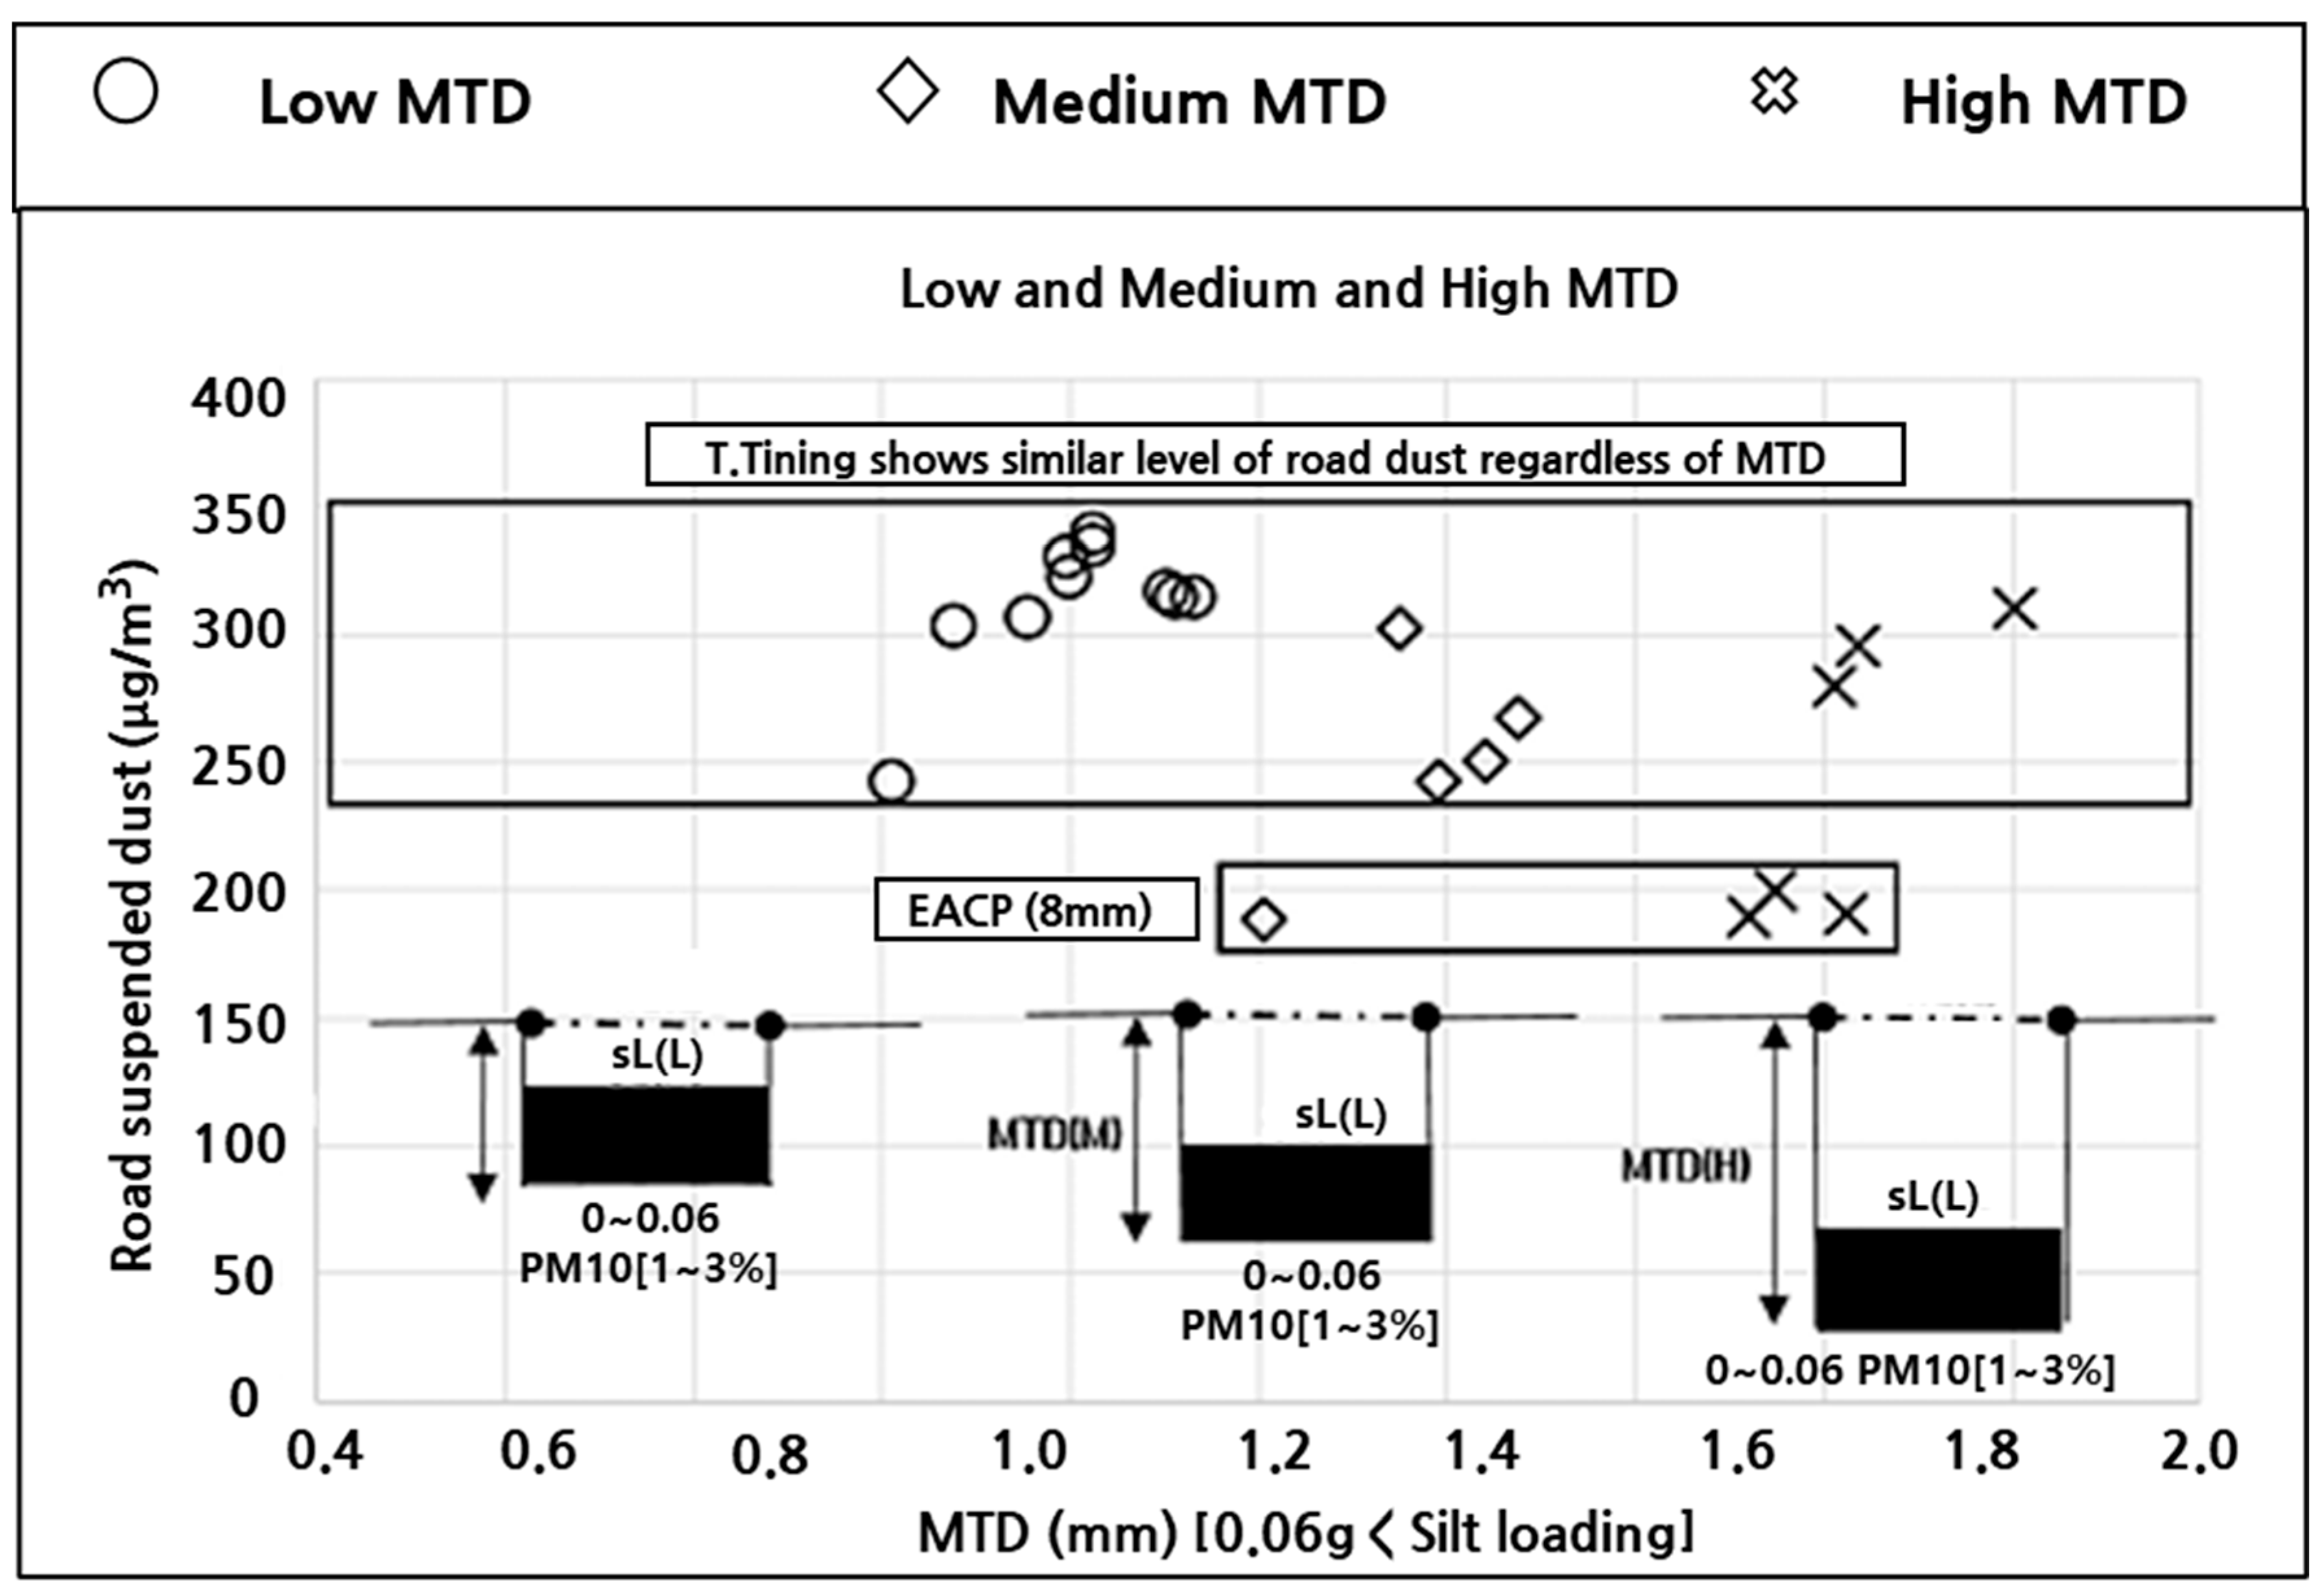
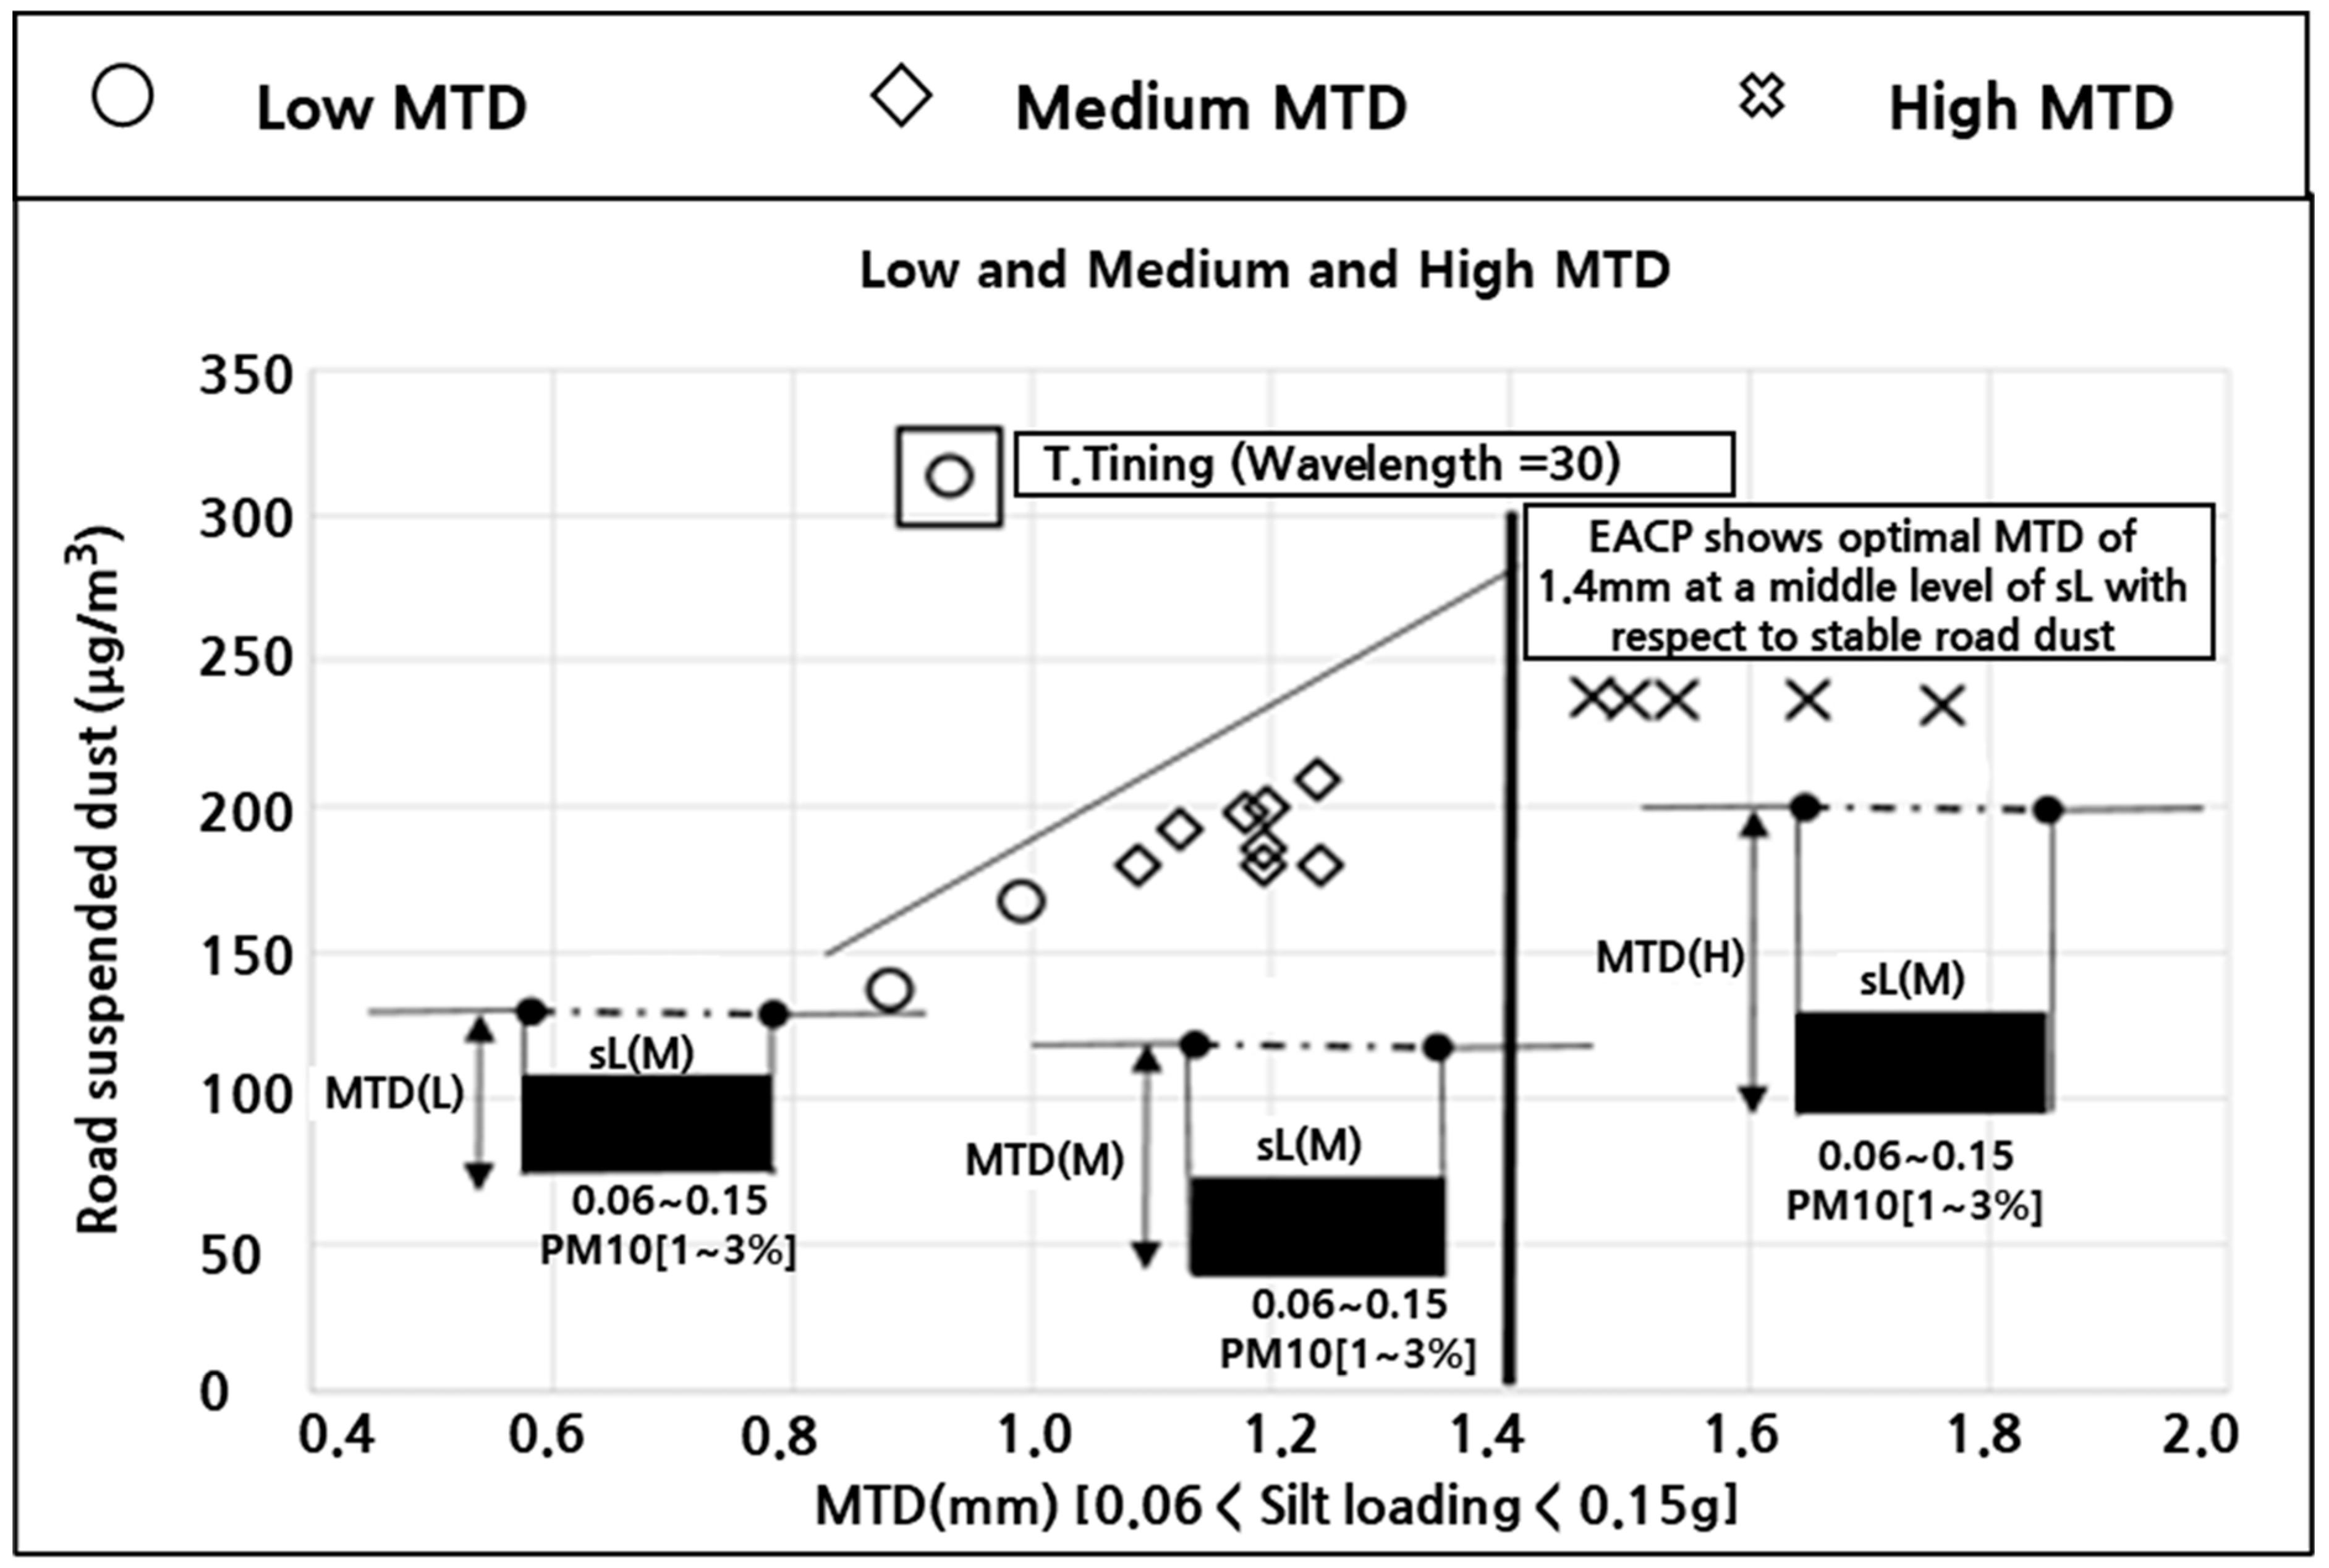
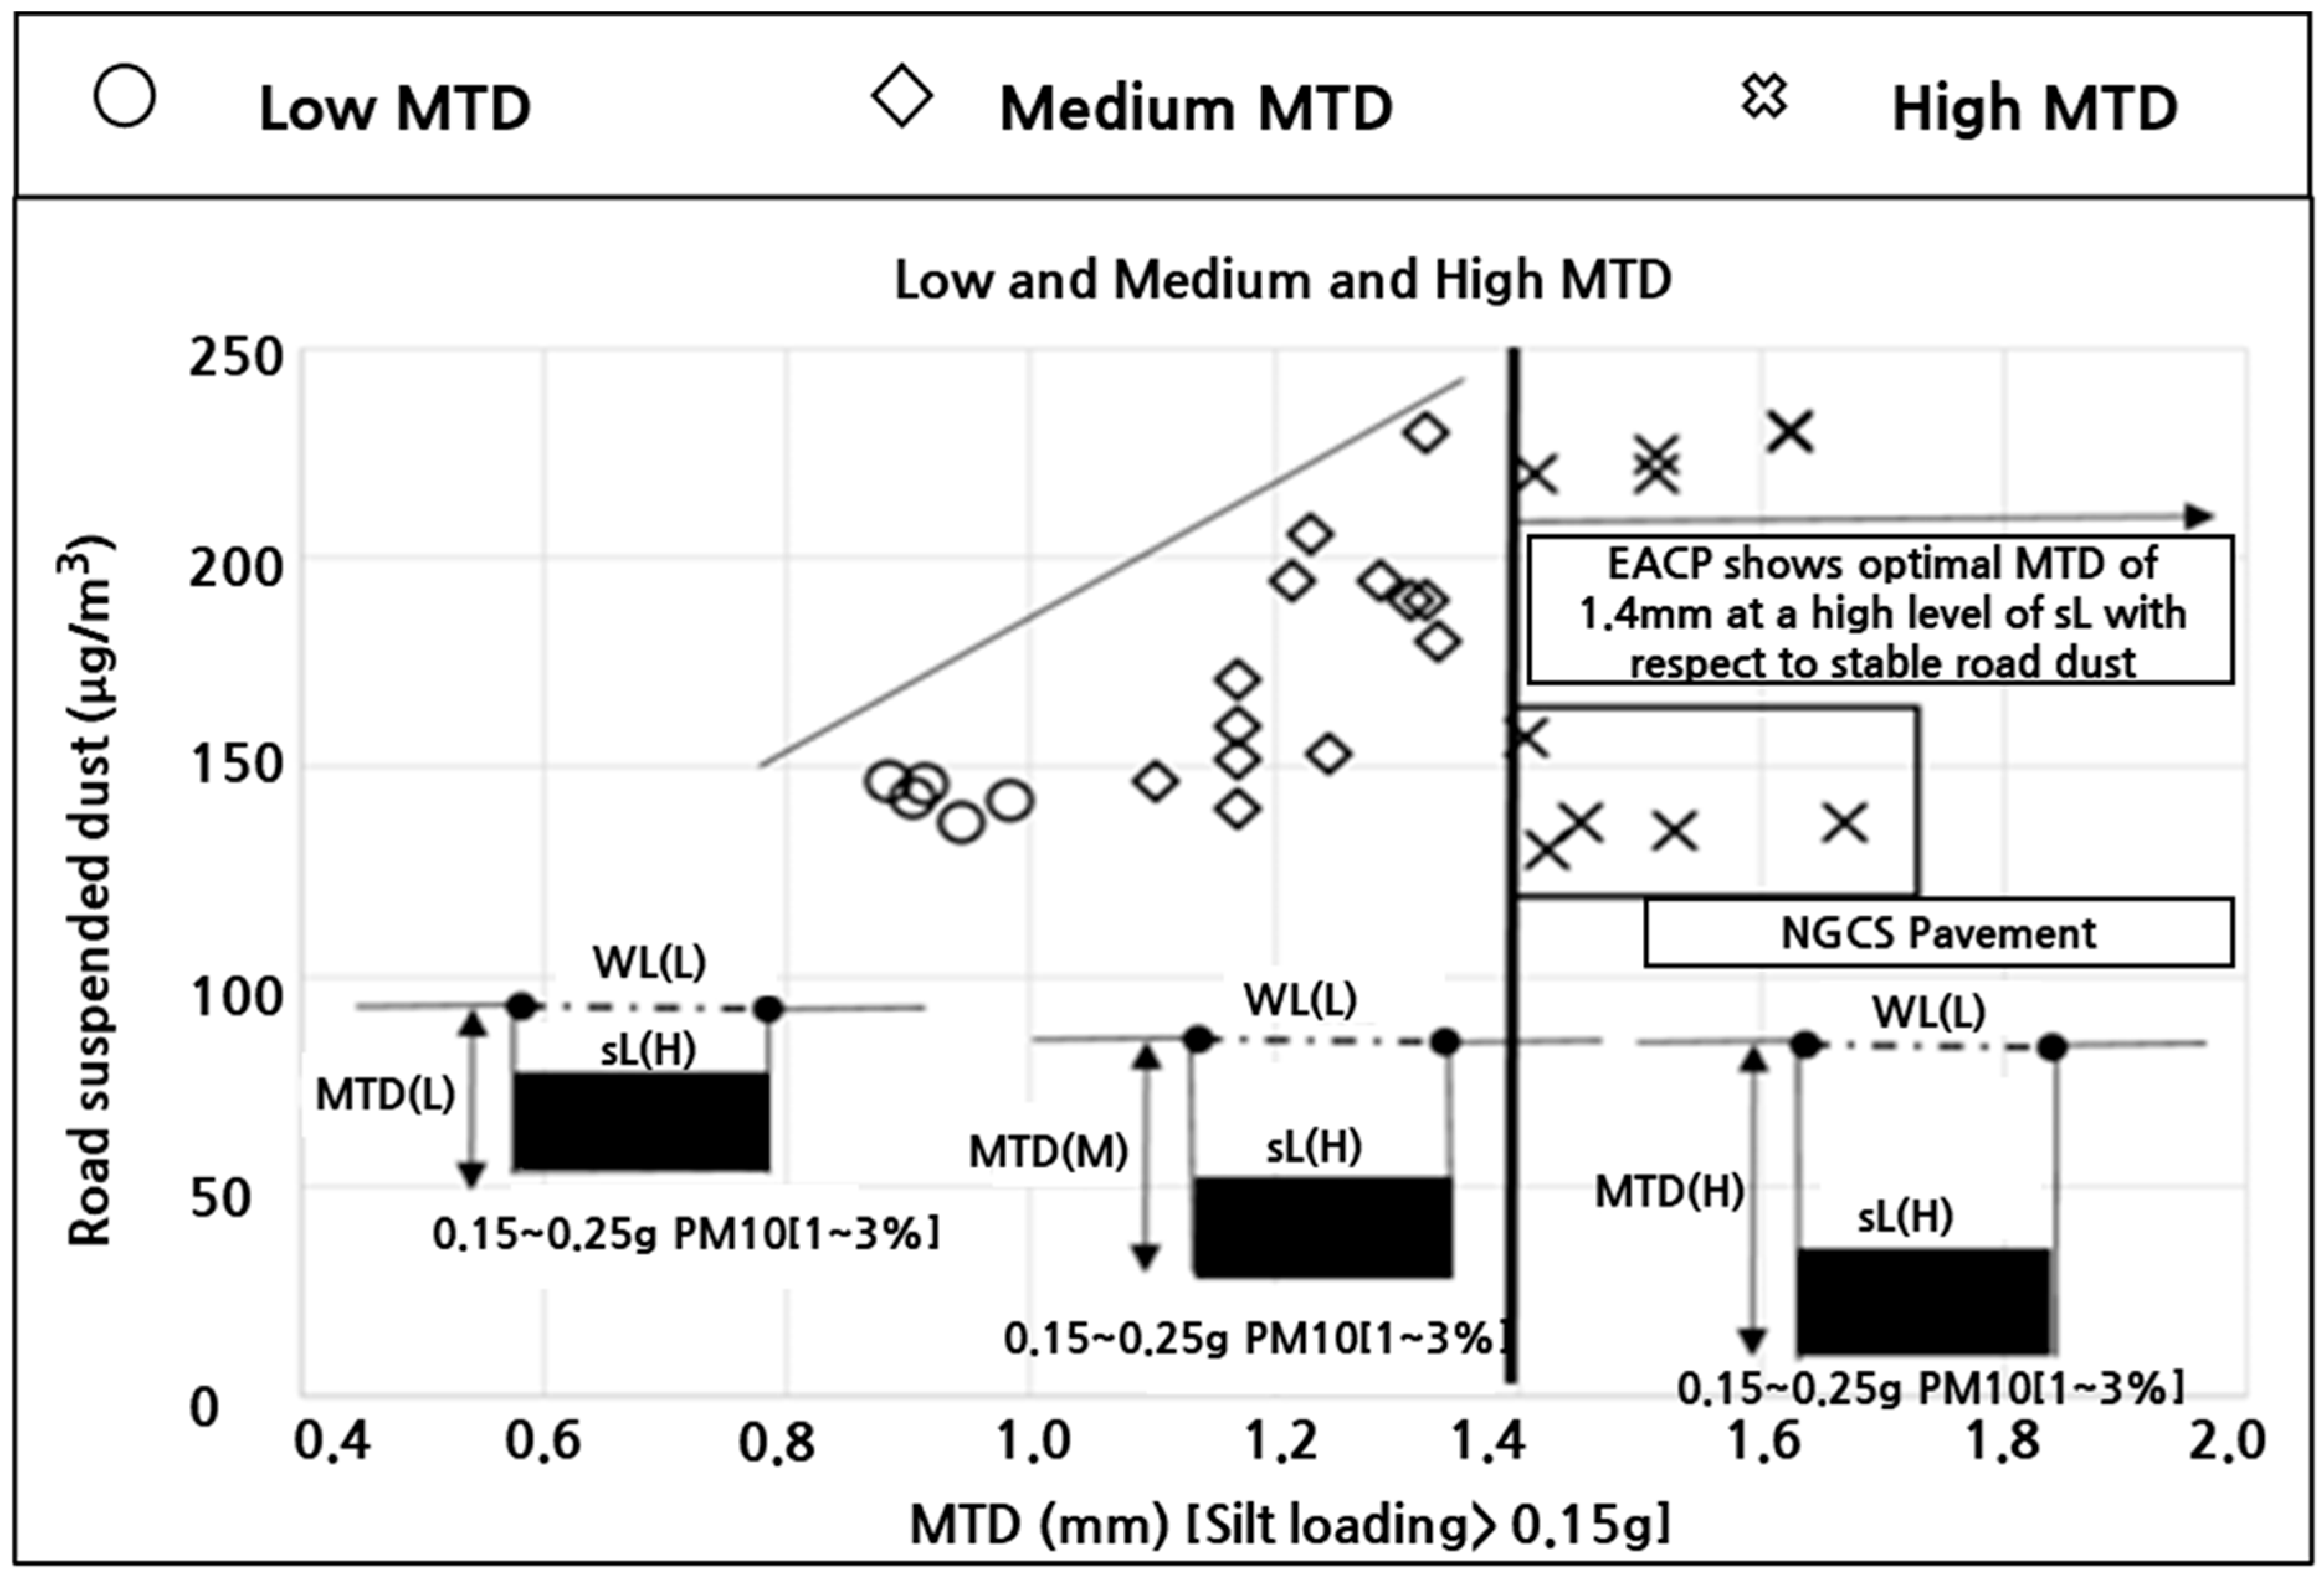
- Interaction Between the MTD and sLThe combined effect of the MTD and sL was found to be highly significant. Under high-sL conditions, deeper textures (MTD ≥ 1.4 mm) resulted in notably elevated PM10 concentrations due to intensified air-pumping effects. These results highlight the importance of considering both the texture depth and surface dust levels in tandem when developing emission reduction strategies.
- (2)
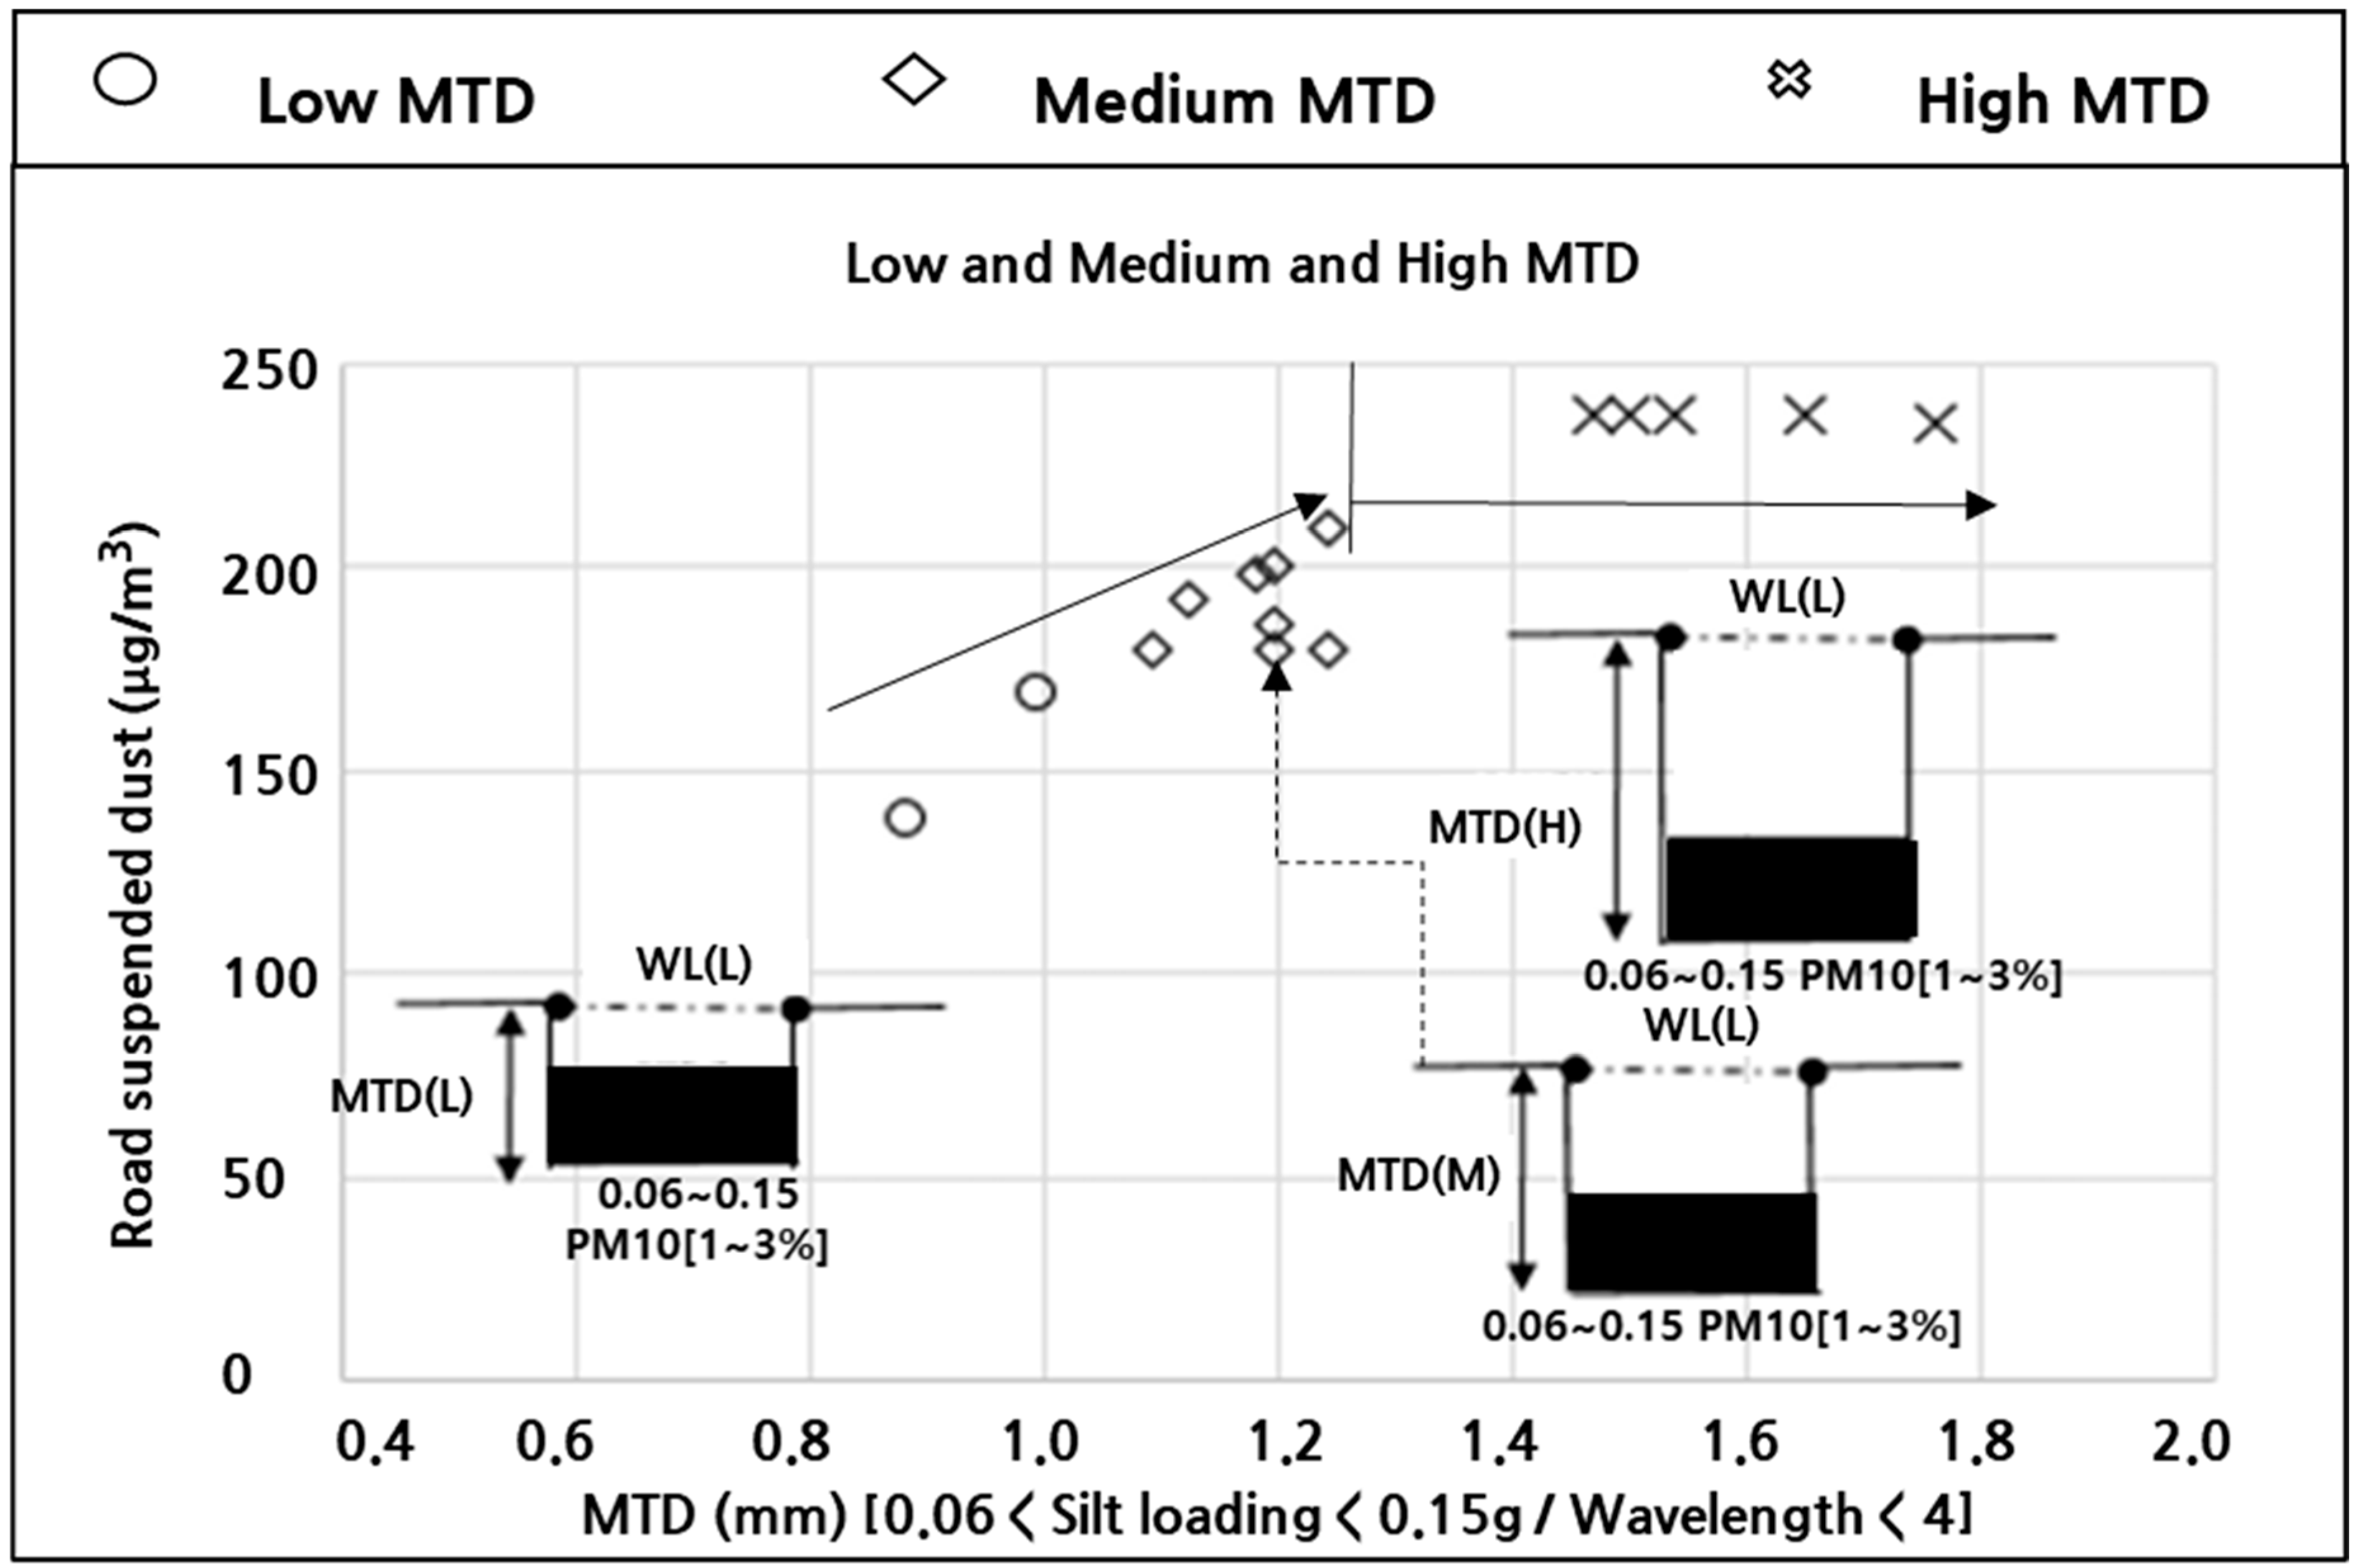
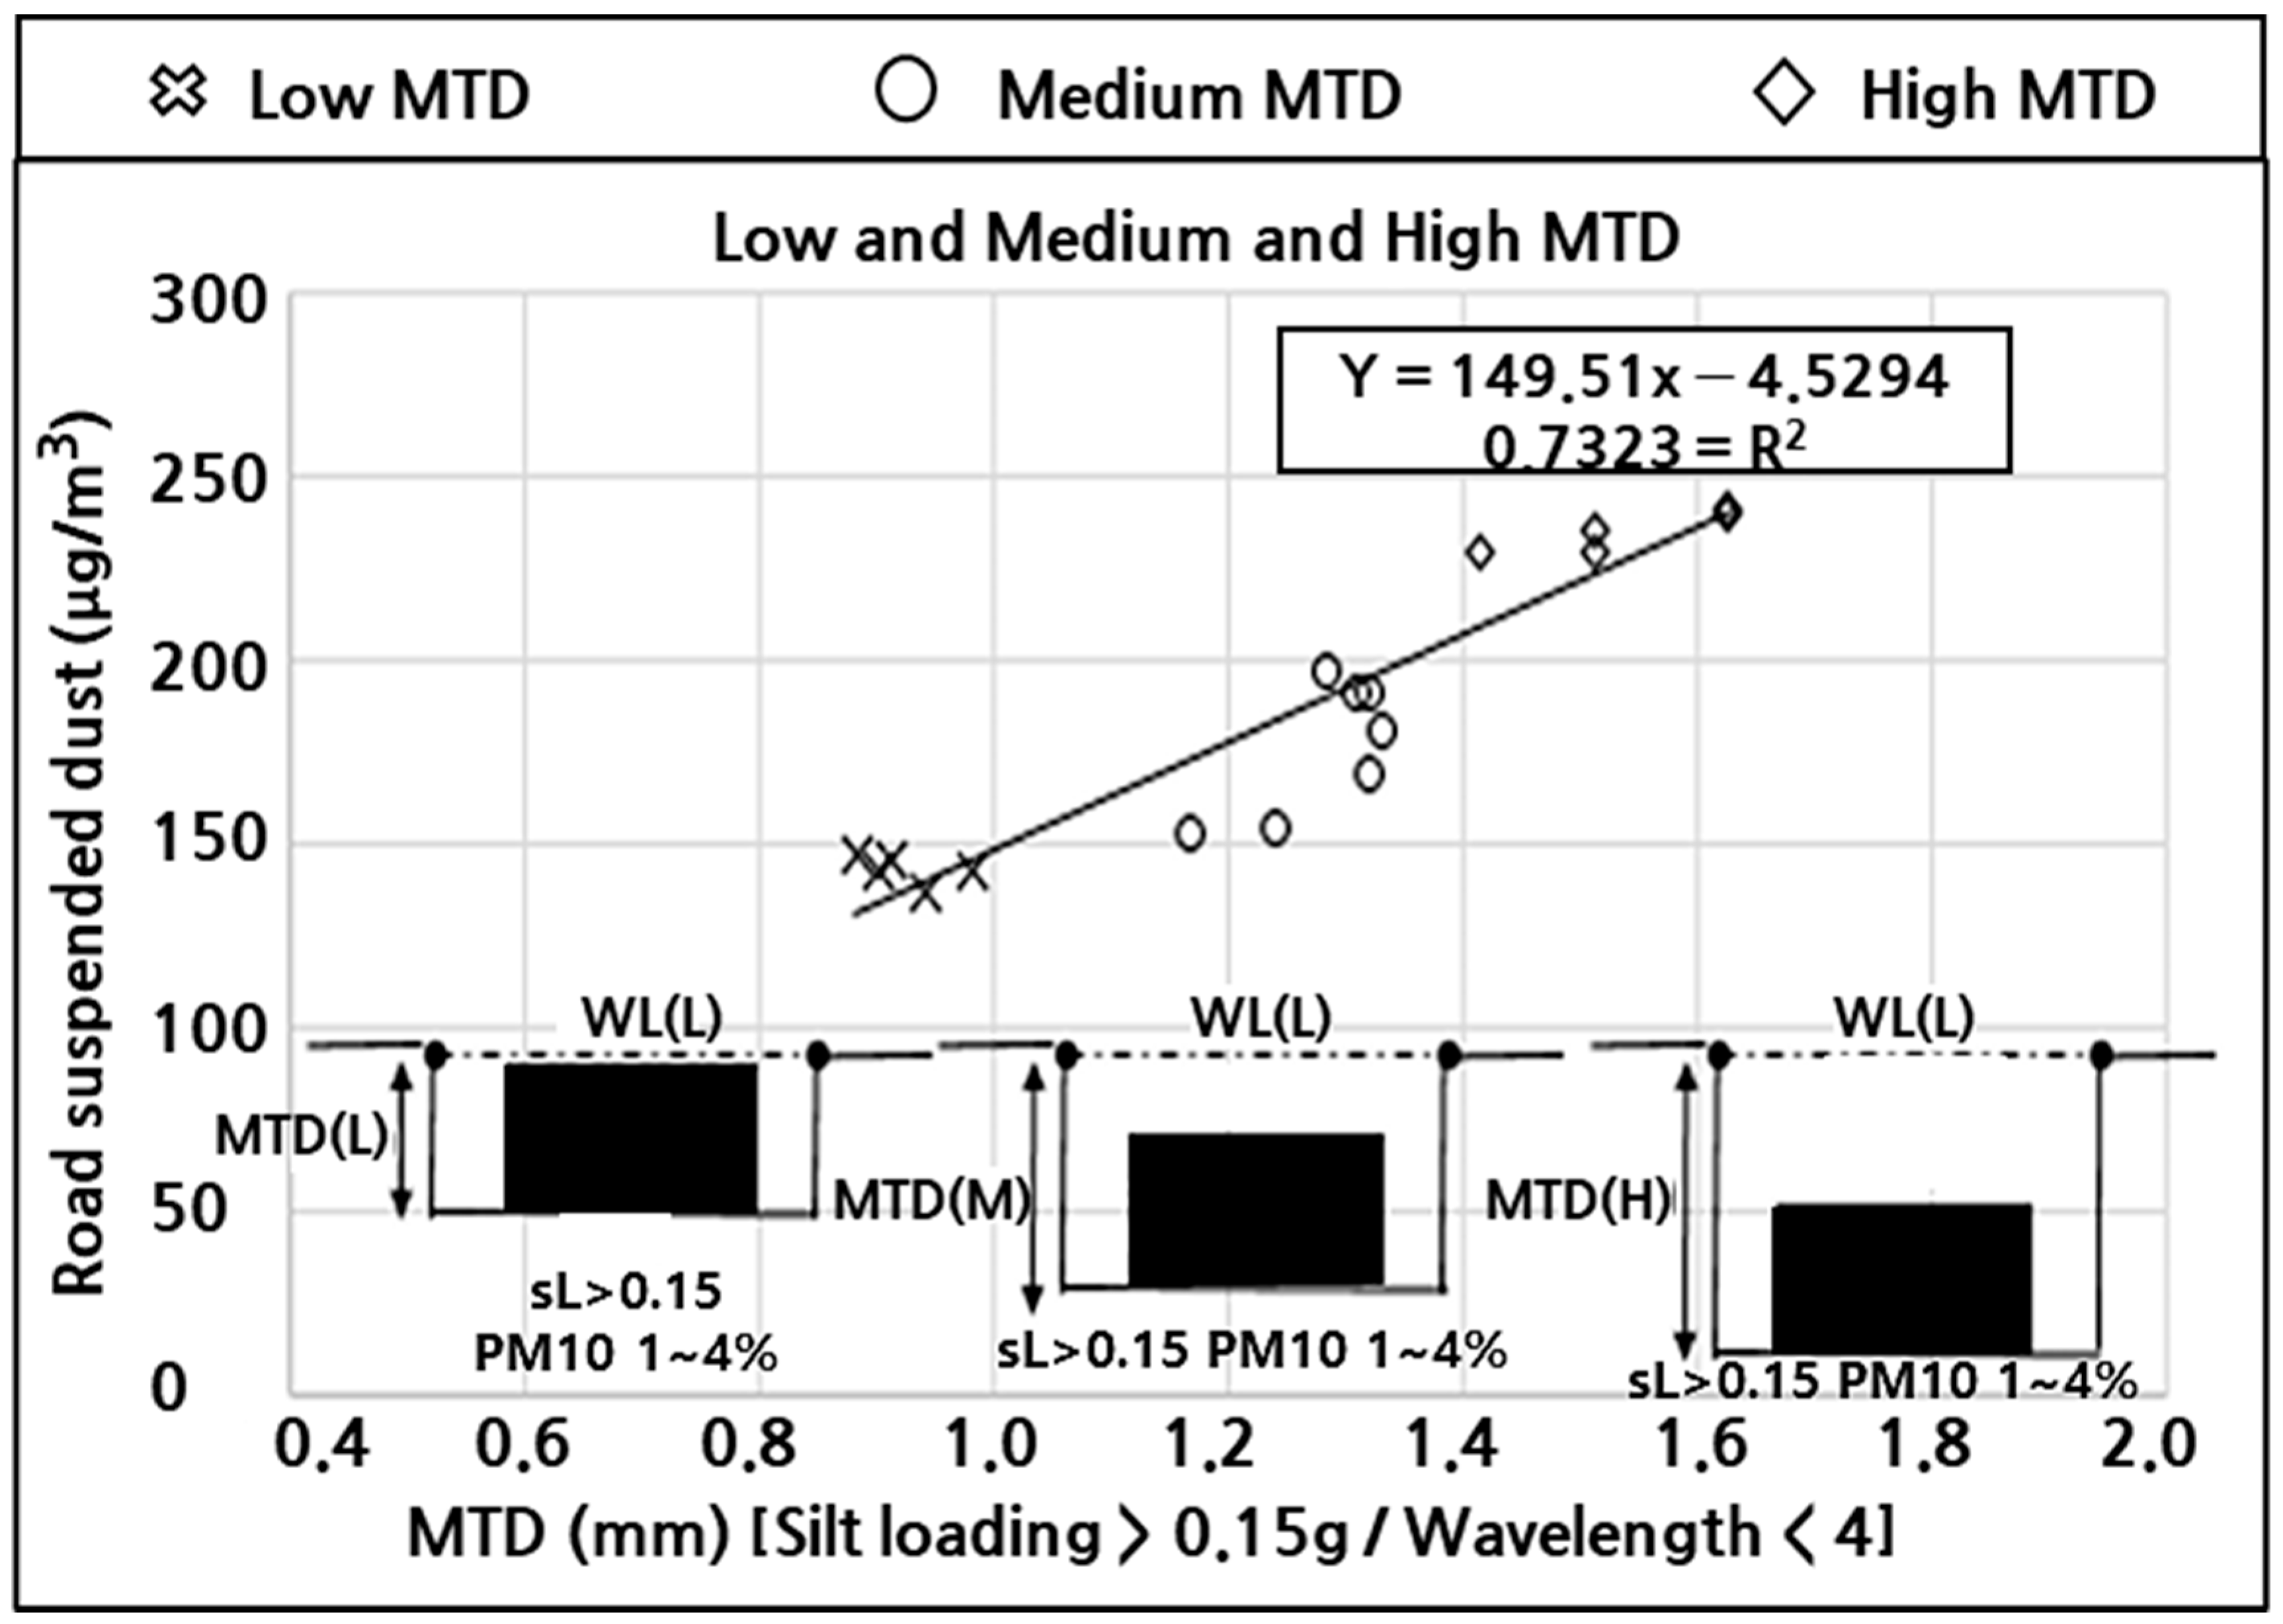
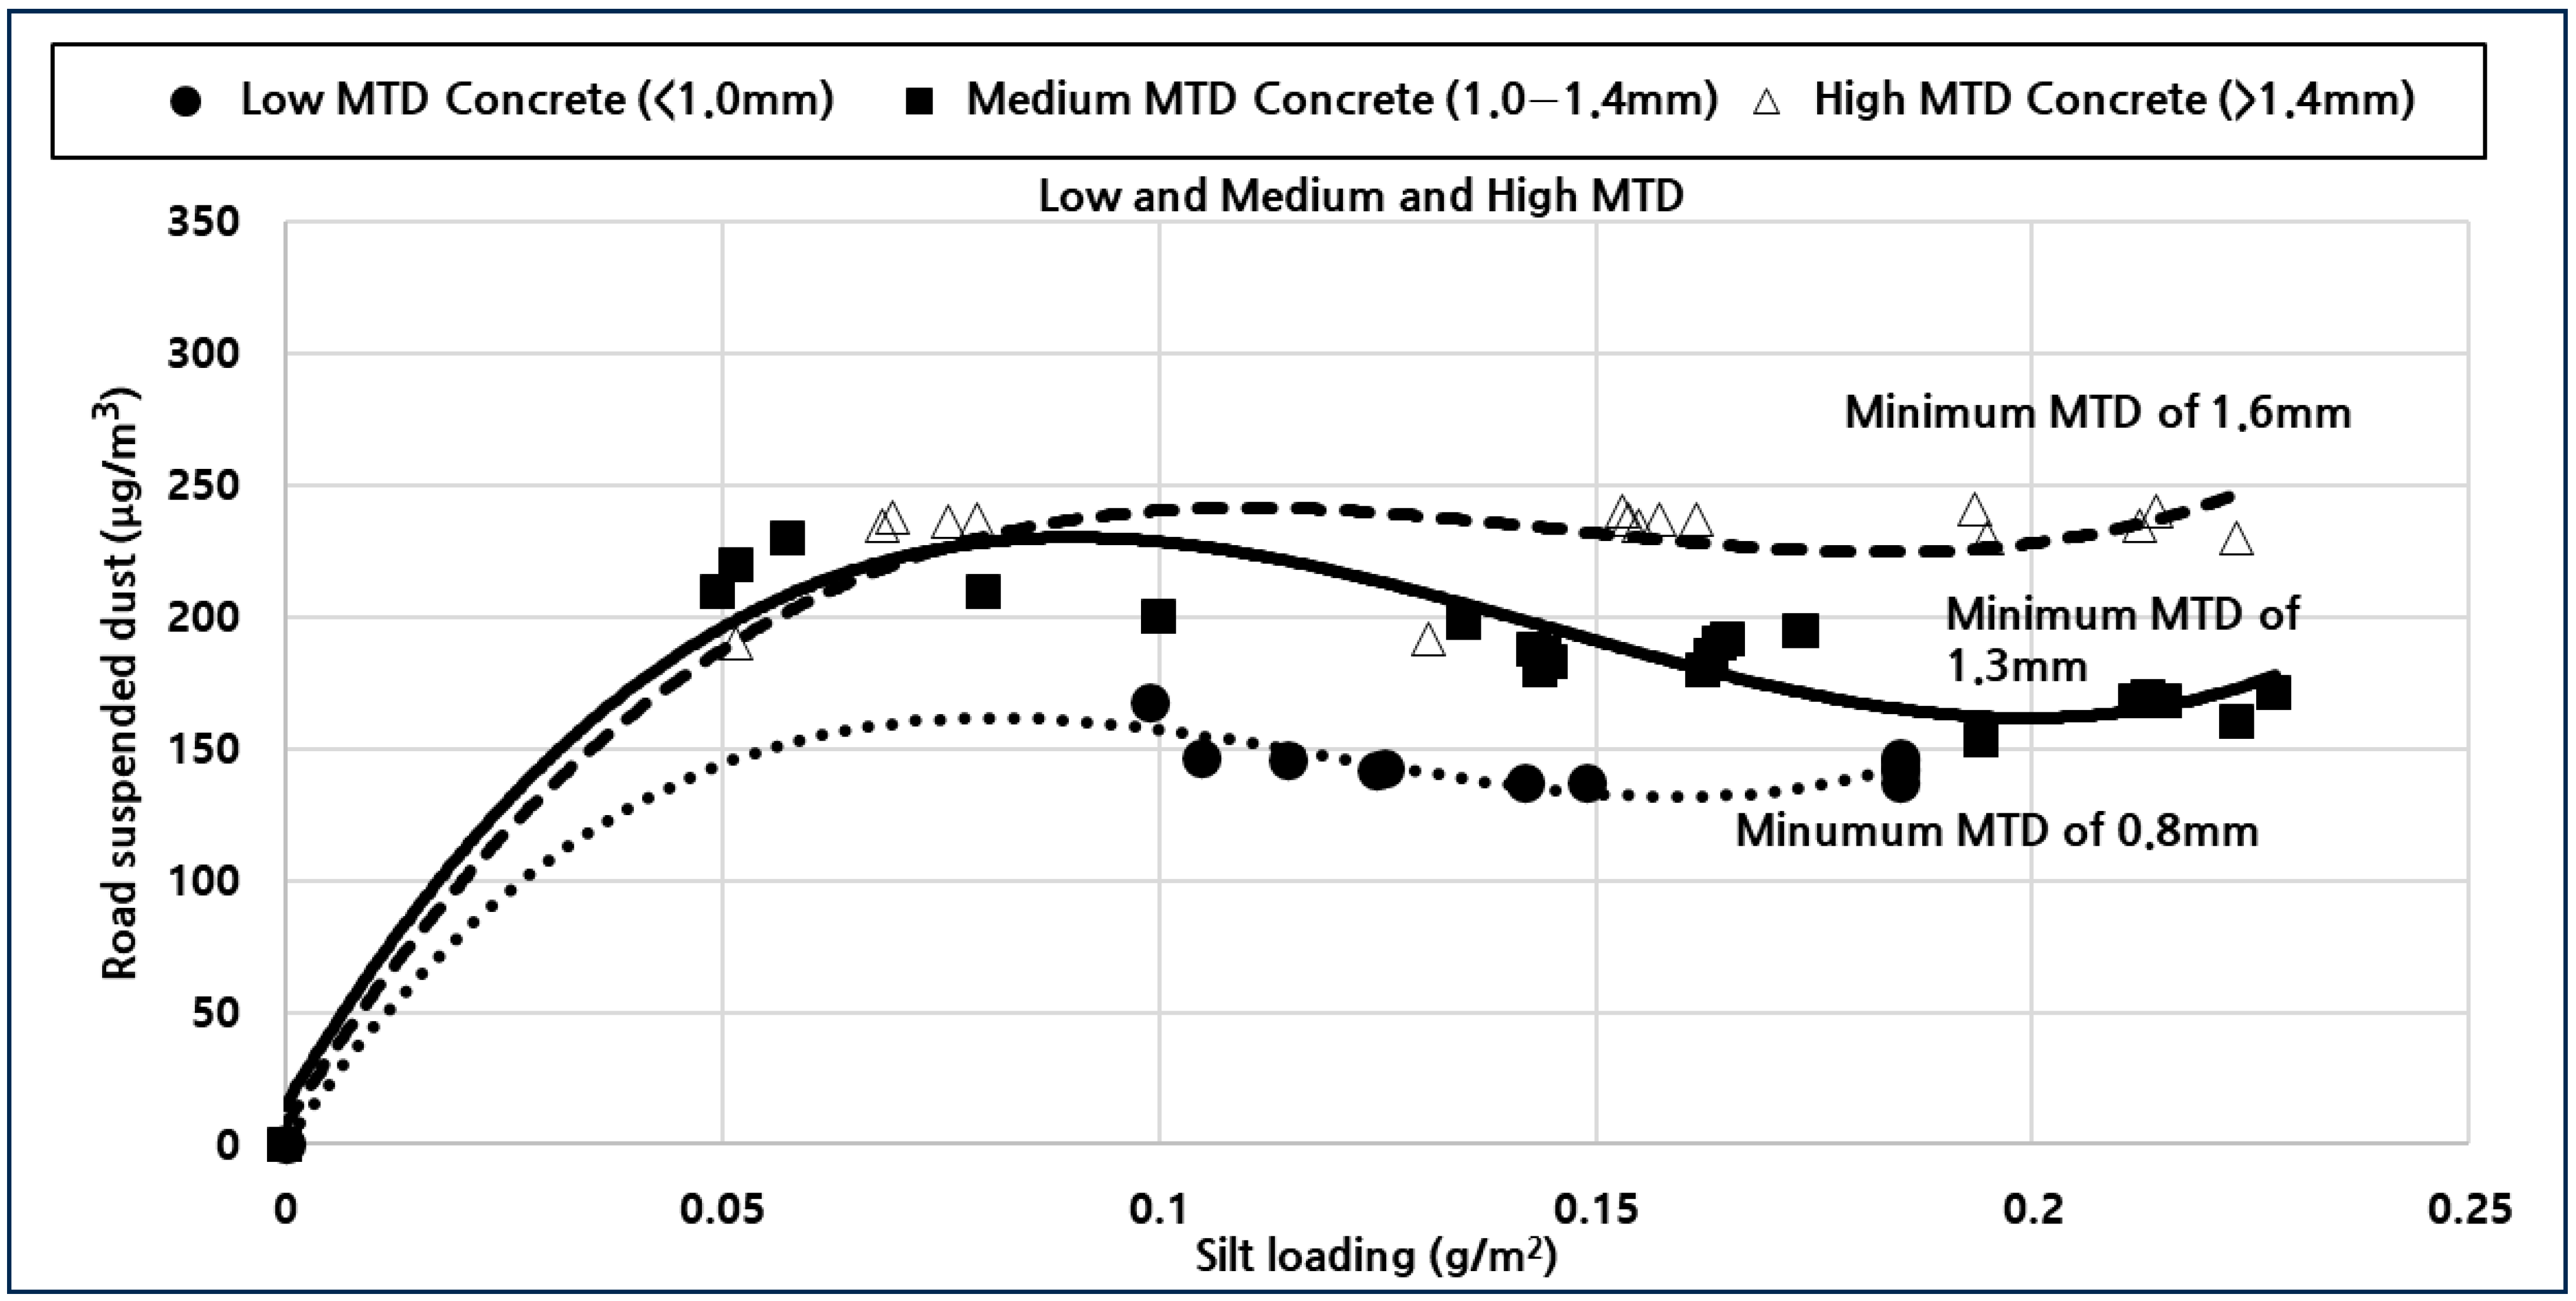
- Relationship Between the MTD and Road Dust ConcentrationSuspended dust concentrations showed a strong positive correlation with the MTD up to the 1.4 mm threshold. Beyond this point, the influence of a greater texture depth diminished, suggesting that excessive roughness no longer contributes meaningfully to resuspension. This threshold offers a quantifiable design parameter for optimizing pavement surface profiles.
- (3)
- Impact of Surface Treatment Methods on Road Dust ConcentrationSurface treatments such as T.Tining, which create deep artificial grooves (~3 mm), were associated with the highest levels of suspended PM10. This is attributed to a reduced contact area and enhanced air pumping, with localized airflow reaching up to 2.2 m/s. While such treatments are beneficial for drainage and skid resistance, they can substantially increase dust emissions. Thus, surface treatment design must carefully balance functional performance with environmental impact.
- (4)
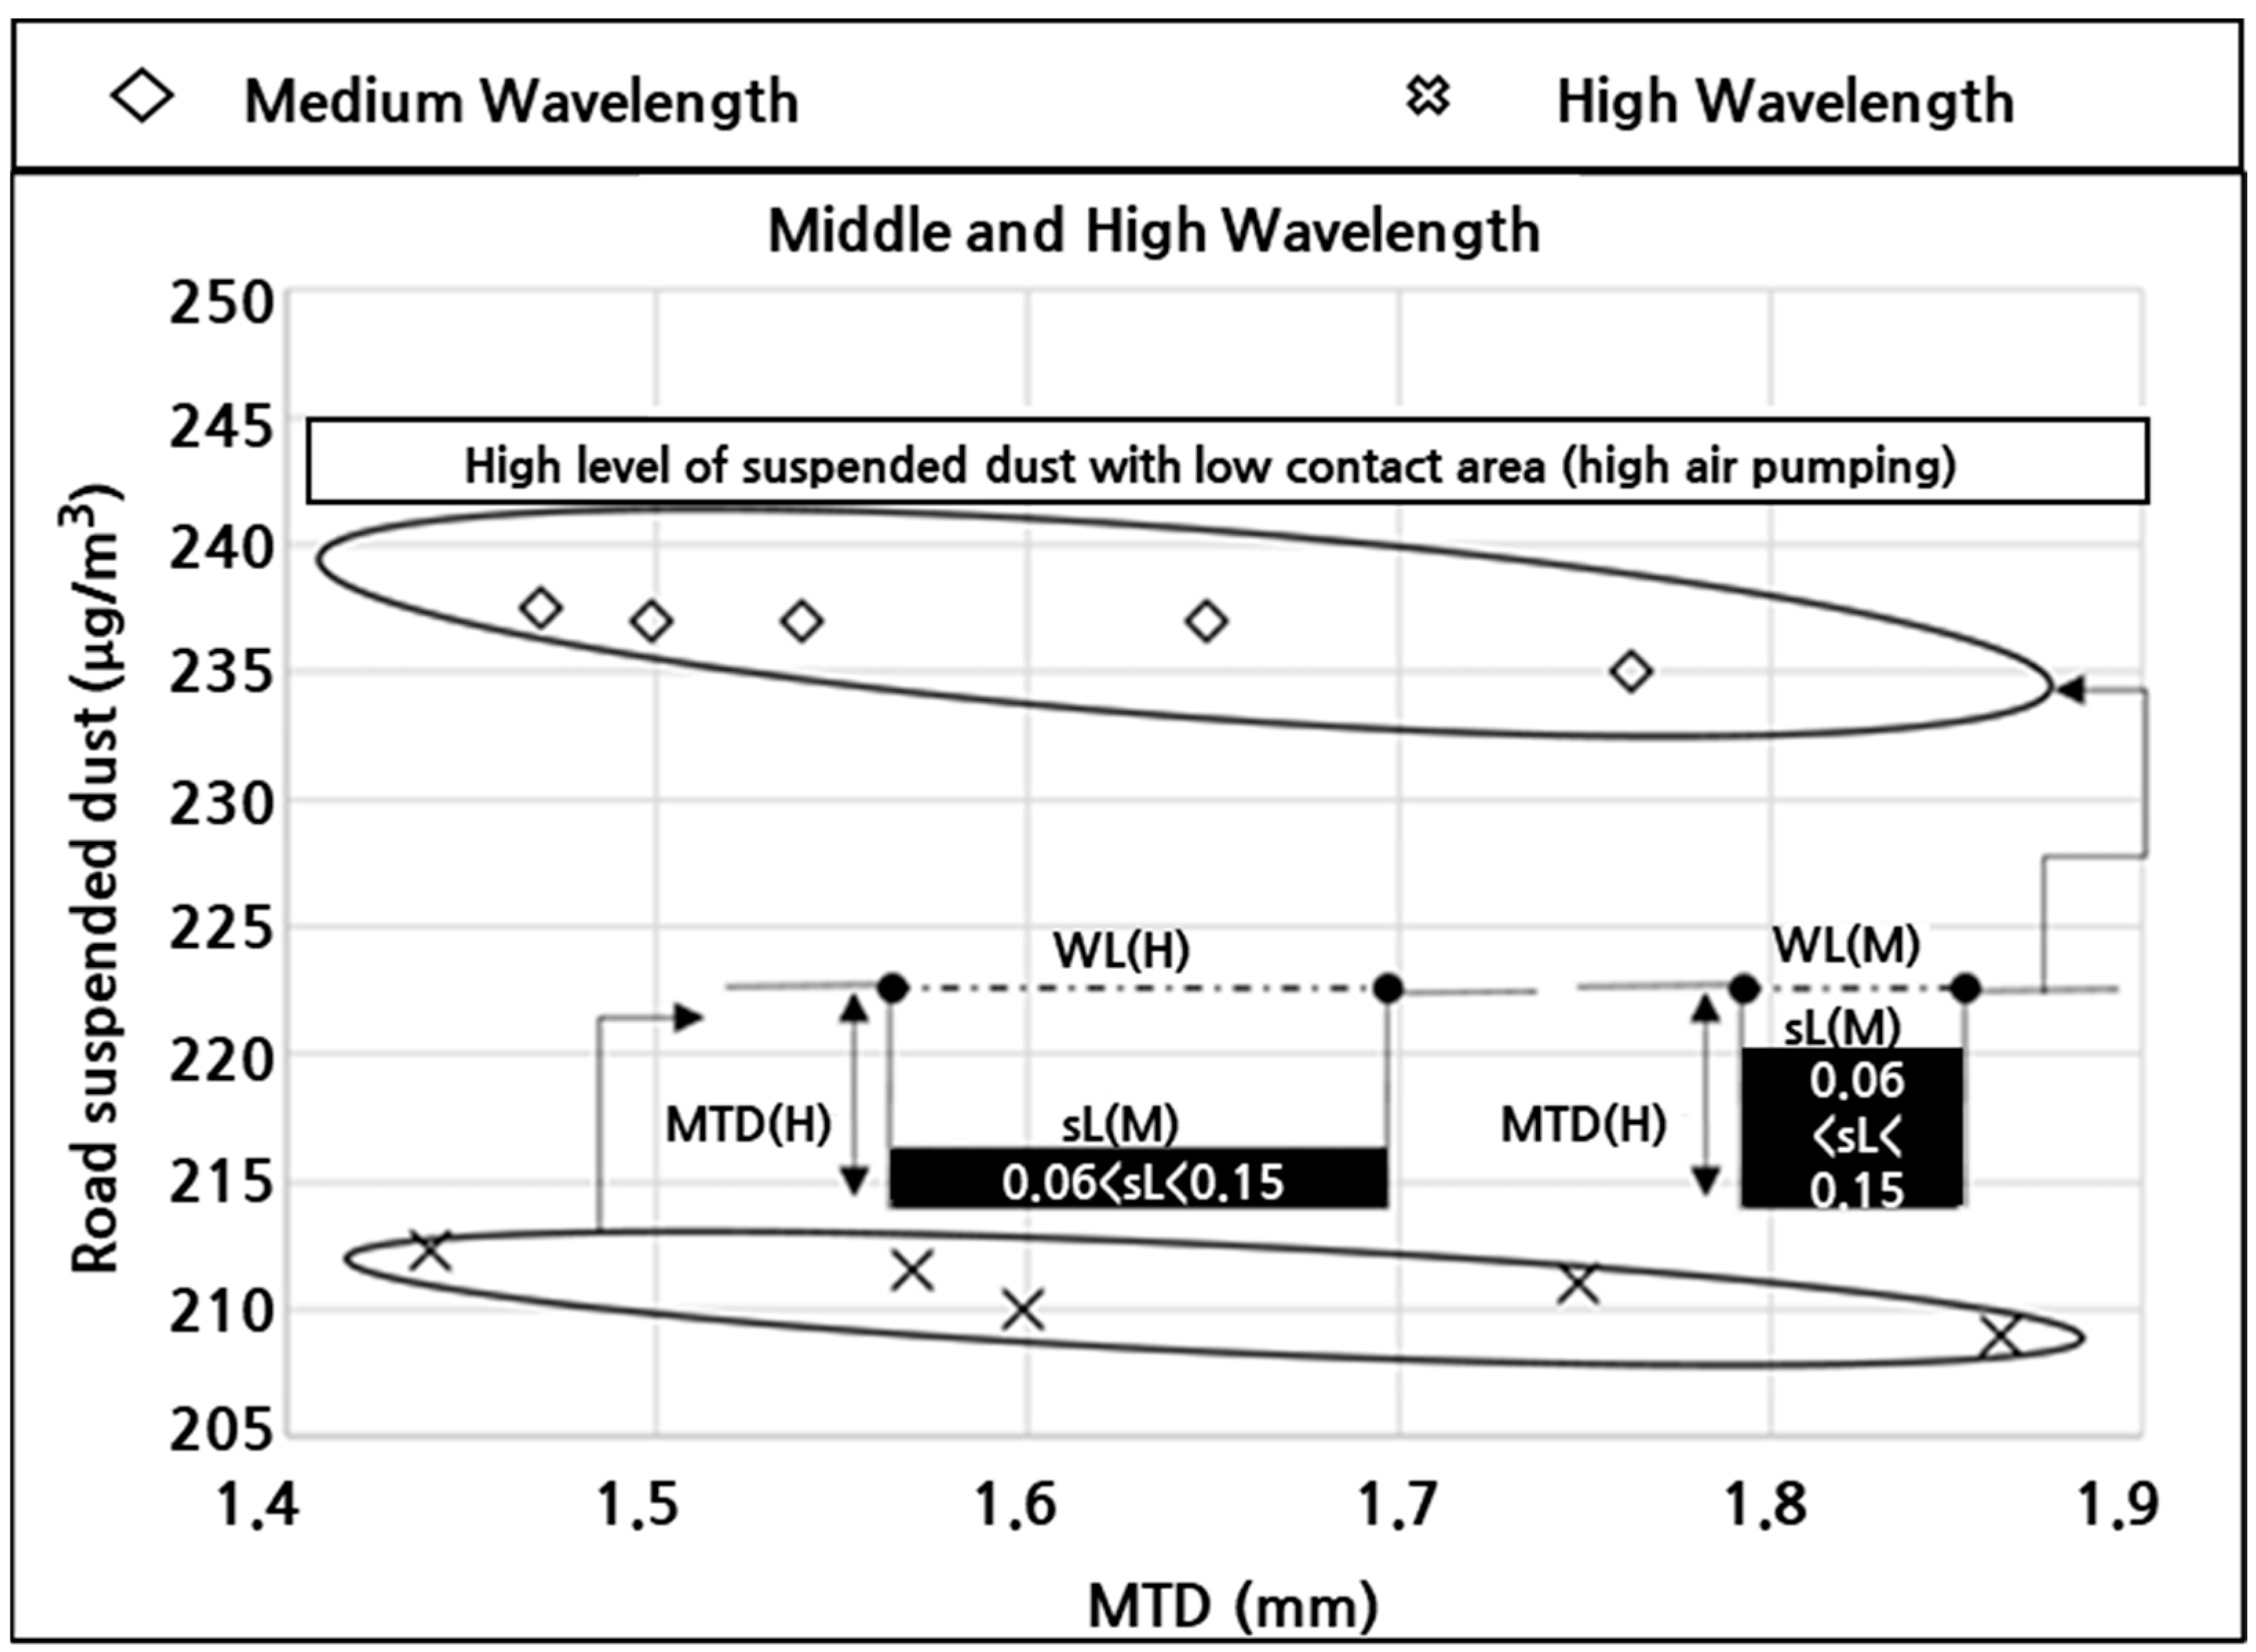
- Effect of WavelengthA shorter surface wavelength was associated with increased dust concentrations due to more frequent tire contact points and stronger localized aerodynamic disturbances. In contrast, longer wavelengths mitigated these effects by reducing contact frequency and turbulence. Optimizing wavelength—by minimizing sharpness and increasing inter-aggregate spacing—can support both environmental goals (dust reduction) and mechanical objectives (riding comfort and noise control), though trade-offs with skid resistance and durability must be considered.
- (5)
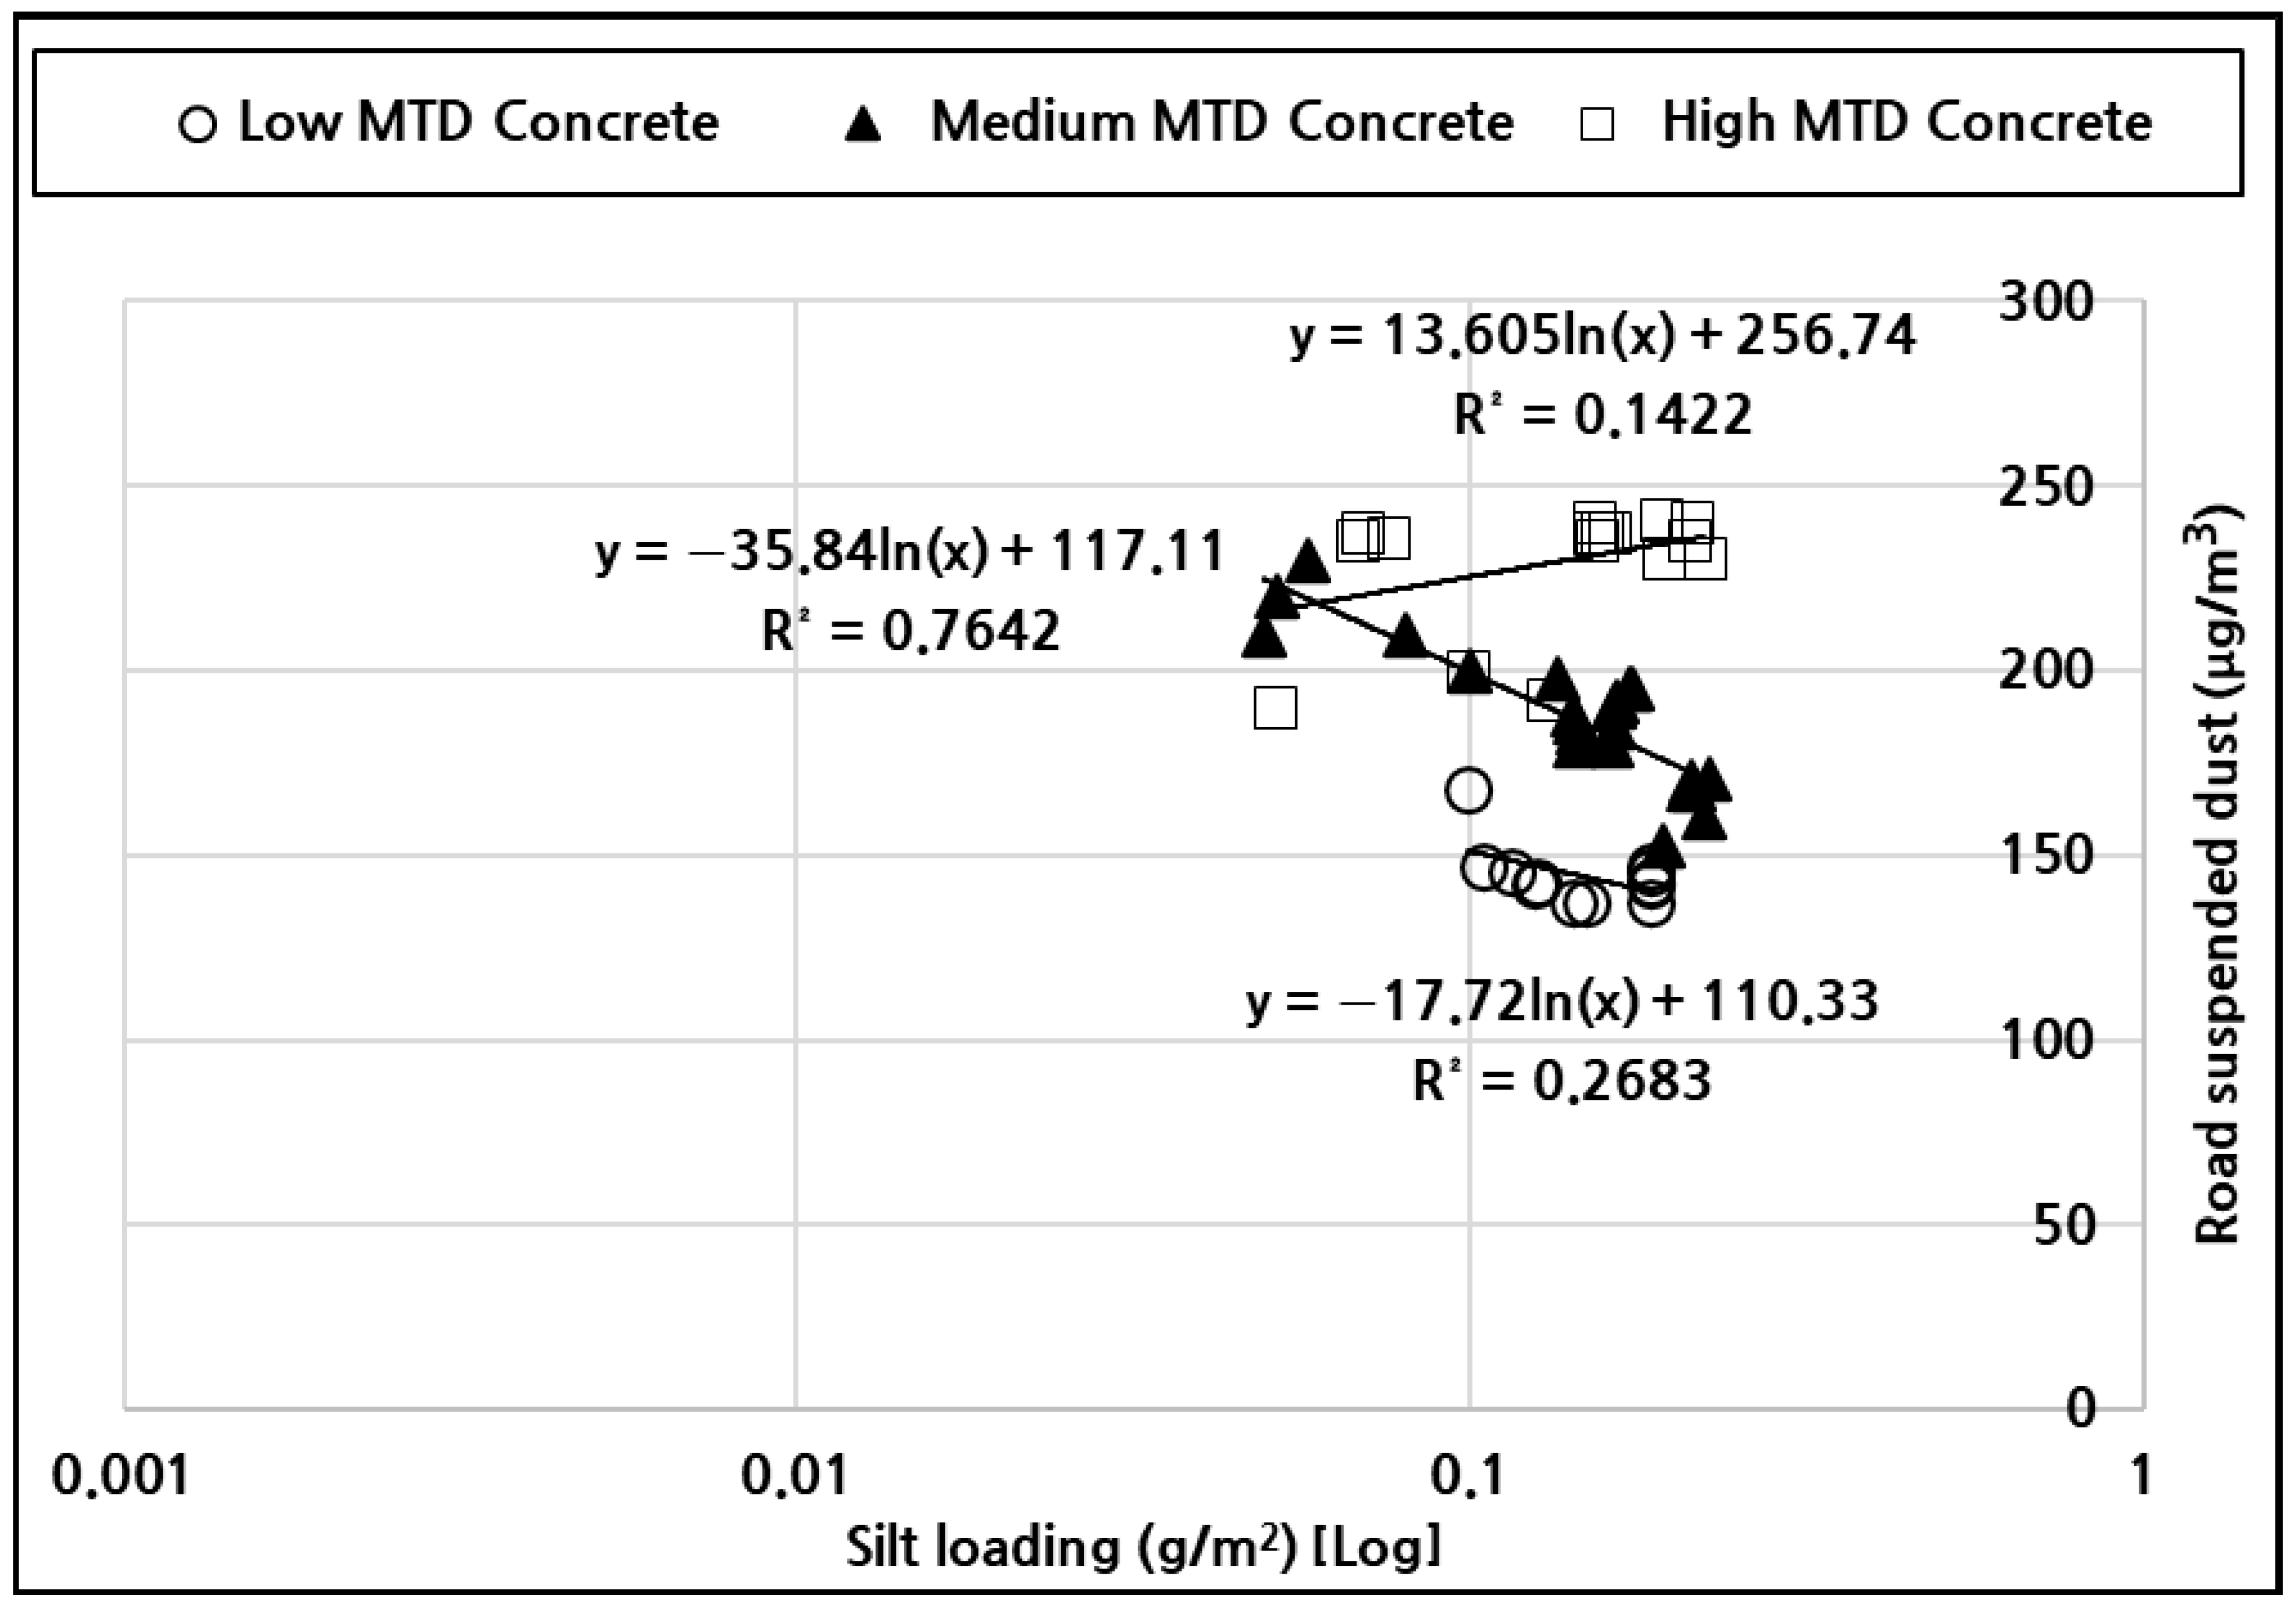
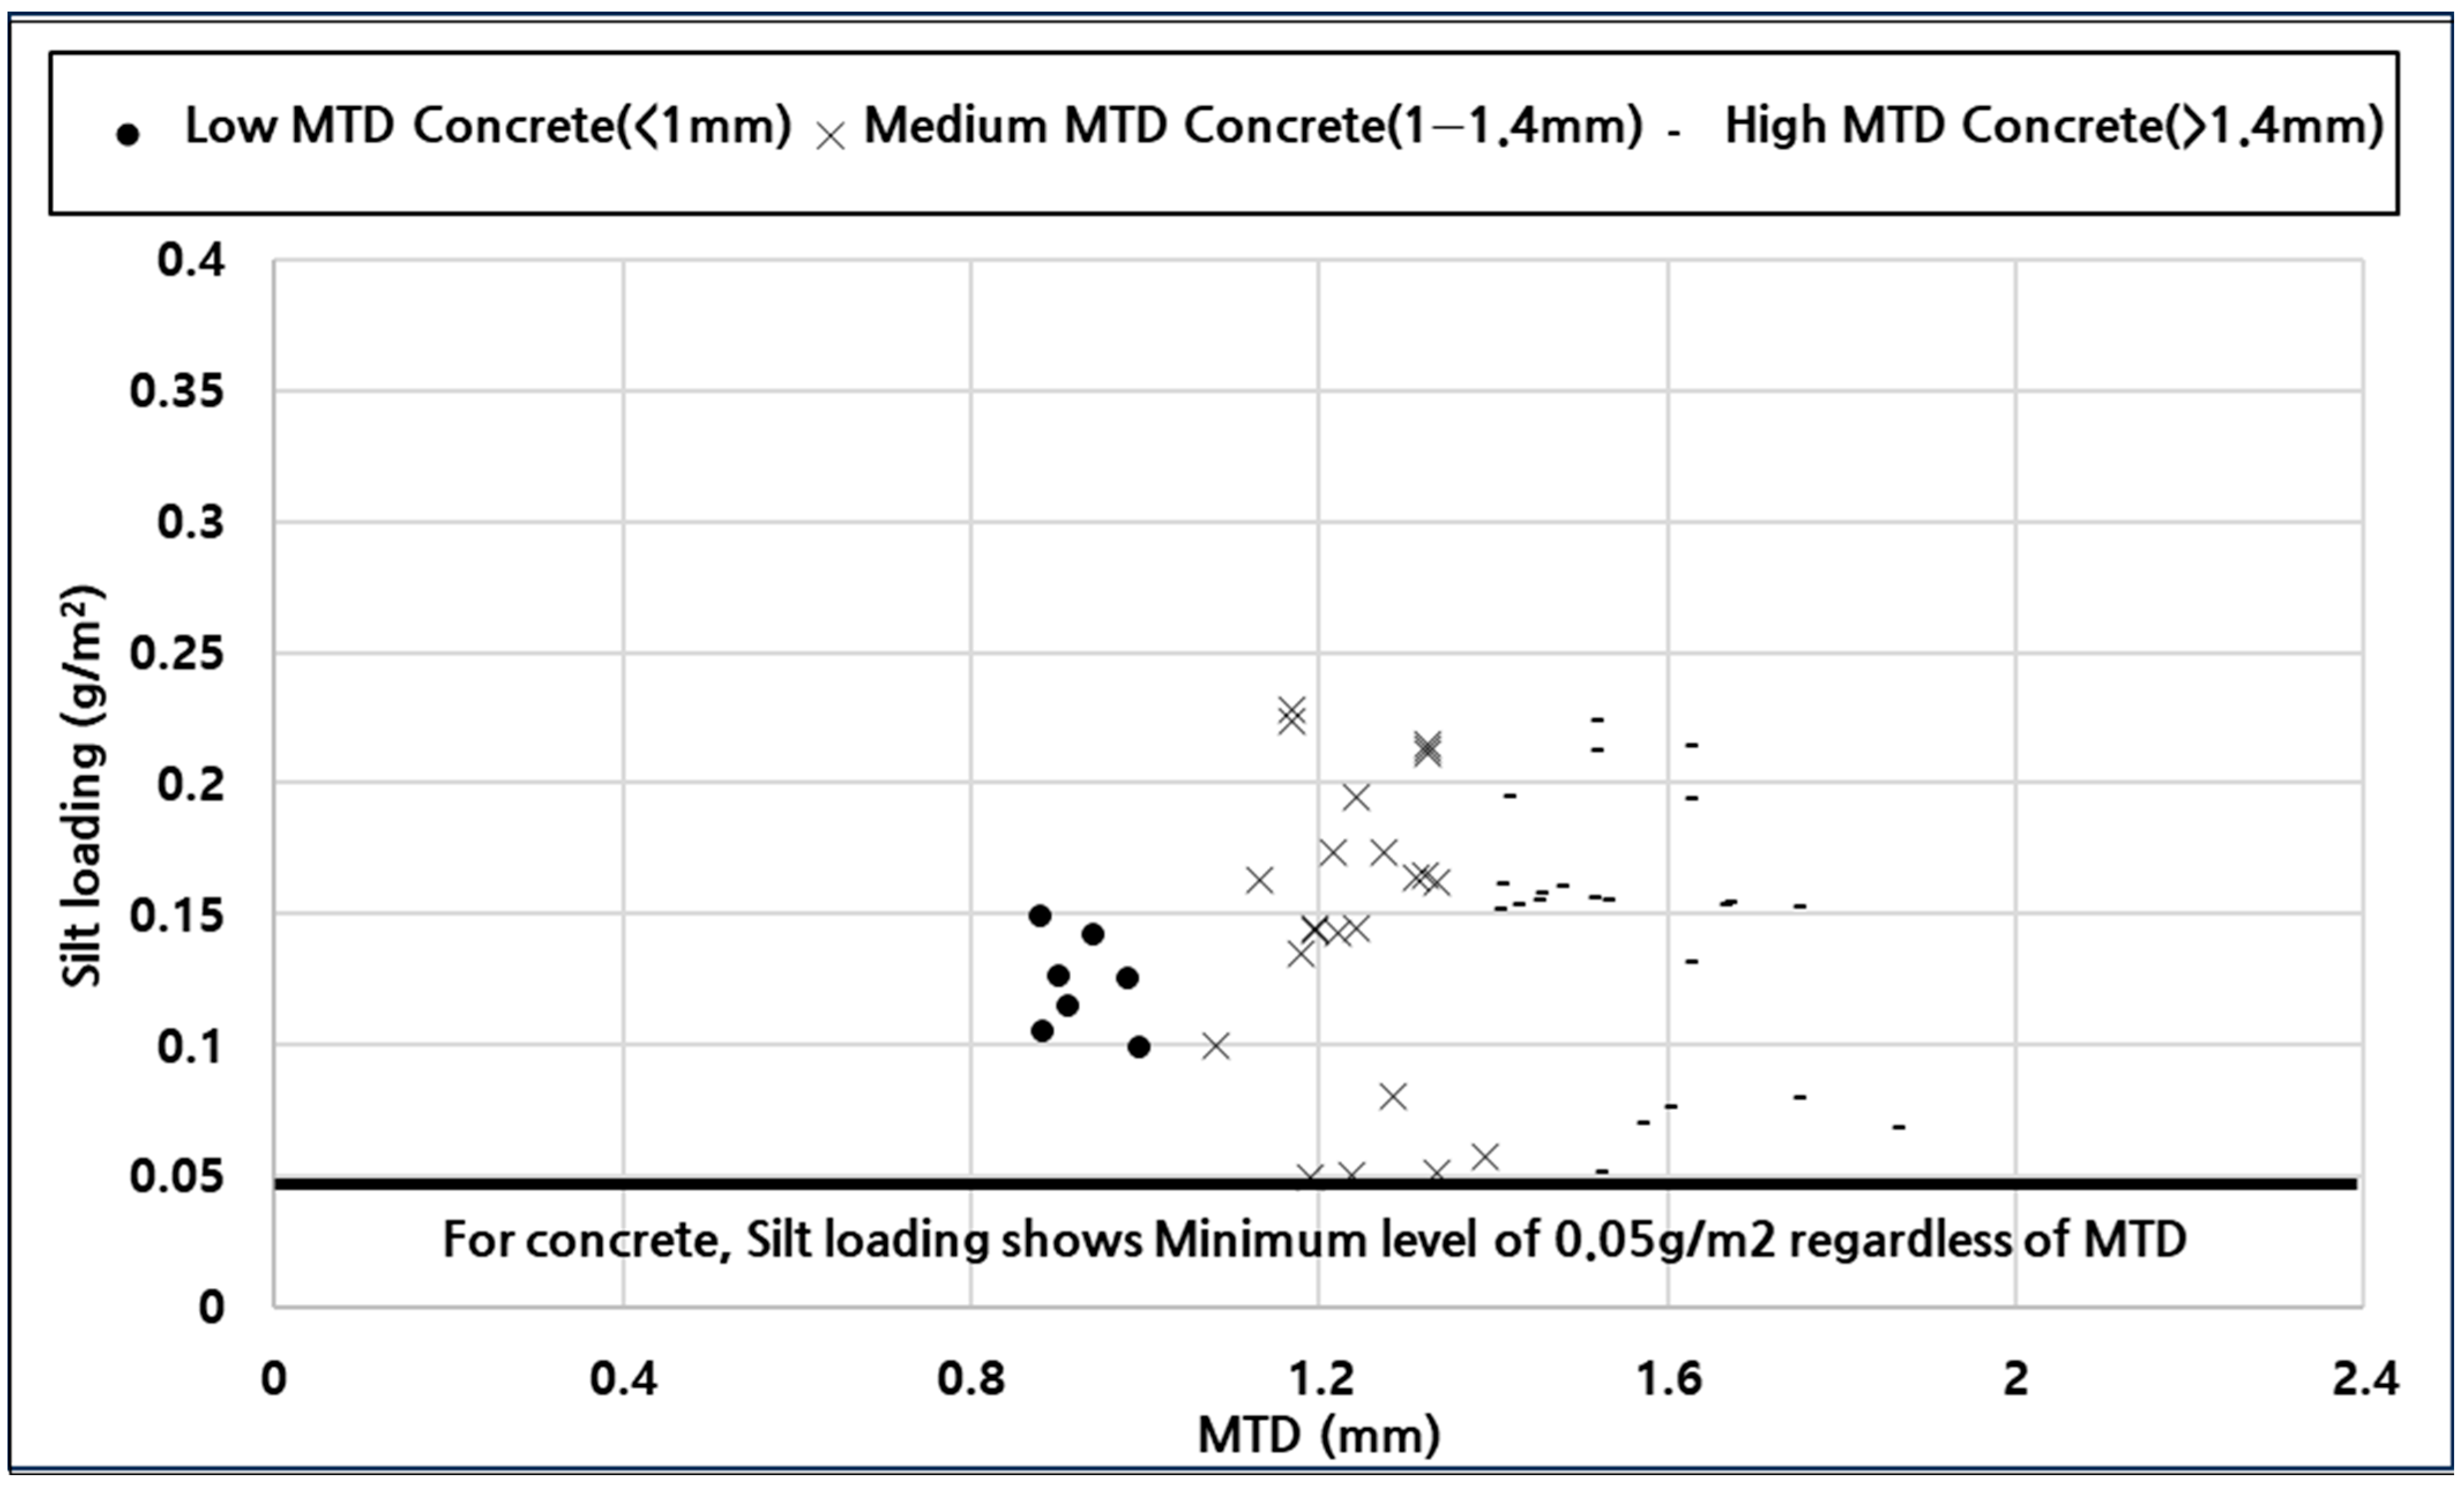
- Effect of the Dust Load (sL) on SuspensionHigher sL values (above 0.1 g/m2) significantly increase dust emissions, emphasizing the need for targeted dust control measures in areas with high particulate accumulation.
Author Contributions
Funding
Institutional Review Board Statement
Informed Consent Statement
Data Availability Statement
Acknowledgments
Conflicts of Interest
Abbreviations and Designations
| PM | Particulate Matter. |
| PM10 | Particulate Matter ≤ 10 µm. |
| MTD | Mean Texture Depth. |
| sL | Silt Loading. |
| EACP | Exposed Aggregate Concrete Pavement. |
| NGCS | Next-Generation Concrete Surface. |
| PSD | Power Spectral Density. |
| RMS | Root Mean Square (Roughness). |
| PN | Peak Number. |
| T.Tining | Transverse Tining. |
| CFD | Computational Fluid Dynamics. |
| CPX | Close Proximity Method. |
| ASOS | Automated Synoptic Observing System. |
| EPA | Environmental Protection Agency. |
| NEE | Non-Exhaust Emissions. |
| EE | Exhaust Emissions. |
| SPT | Sand Patch Test. |
References
- Pope, C.A.; Thun, M.J.; Namboodiri, M.M.; Dockery, D.W.; Evans, J.S.; Speizer, F.E.; Heath, C.W. Particulate air pollution as a predictor of mortality in a prospective study of US adults. Am. J. Respir. Crit. Care Med. 1995, 151, 669–674. [Google Scholar] [CrossRef]
- Askariyeh, M.H.; Venugopal, M.; Khreis, H.; Birt, A.; Zietsman, J. Near-road traffic-related air pollution: Resuspended PM2.5 from highways and arterials. Int. J. Environ. Res. Public Health 2020, 17, 2851. [Google Scholar] [CrossRef]
- Lewis, A.; Moller, S.J.; Carslaw, D. Non-Exhaust Emissions from Road Traffic. 2019. Available online: https://eprints.whiterose.ac.uk/156628/ (accessed on 27 July 2022).
- Rienda, I.C.; Alves, C.A. Road dust resuspension: A review. Atmos. Res. 2021, 261, 105740. [Google Scholar] [CrossRef]
- U.S. Environmental Protection Agency. Environmental Protection Agency Compilation of Air Pollution Emission Factors, AP-42, 5th ed.; U.S. Environmental Protection Agency: Washington, DC, USA, 2003; Volume I: Stationary Point and Area Sources, Section 13.2.1 Paved Roads. [Google Scholar]
- U.S. Environmental Protection Agency. Emission Factor Documentation for AP-42, Section 13.2.1: Paved Roads; Policy Group, Office of Air Quality Planning and Standard U.S. EPA: Research Triangle Park, NC, USA, 2011. [Google Scholar]
- Baldasano, J.M.; Güereca, L.P.; Gasso, L.E.; Guerrero, P.J. Development of a high-resolution (1 km × 1 km, 1 h) emission model for Spain: The High-Elective Resolution Modelling Emission System (HERMES). Atmos. Environ. 2008, 42, 7215–7233. [Google Scholar] [CrossRef]
- Padoan, E. An empirical model to predict road dust emissions based on pavement and traffic characteristics. Environ. Pollut. 2018, 237, 634–642. [Google Scholar] [CrossRef]
- Denby, B.R. A coupled road dust and surface moisture model to predict non-exhaust road traffic induced particle emissions (NORTRIP). Part 1: Road dust loading and suspension modelling. Atmos. Environ. 2013, 77, 283–300. [Google Scholar] [CrossRef]
- Lundberg, J.; Blomqvist, G.; Gustafsson, M.; Janhäll, S. Texture influence on road dust load. In Proceedings of the International Transportation and Air Pollution Conference, Zürich, Switzerland, 15–16 November 2017. [Google Scholar]
- Zhang, M.; Yin, H.; Tan, J.; Wang, X.; Yang, Z.; Hao, L.; Du, T.; Niu, Z.; Ge, Y. A Comprehensive Review of Tyre Wear Particles: Formation, Measurements, Properties, and Influencing Factors. Atmos. Environ. 2023, 297, 119597. [Google Scholar] [CrossRef]
- Järlskog, I.; Jaramillo-Vogel, D.; Rausch, J.; Gustafsson, M.; Strömvall, A.-M.; Andersson-Sköld, Y. Concentrations of Tire Wear Microplastics and Other Traffic-Derived Non-Exhaust Particles in the Road Environment. Environ. Int. 2022, 170, 107618. [Google Scholar] [CrossRef] [PubMed]
- Blomqvist, G. Road surface dust load is dependent on road surface macro texture. Atmos. Environ. X 2013, 2, 28. [Google Scholar]
- Amato, F. Impact of traffic intensity and pavement aggregate size on road dust particles loading. Atmos. Environ. 2013, 77, 29. [Google Scholar] [CrossRef]
- China, S. Effects of pavement macrotexture on PM10 emissions from paved roads. UNLV Retrosp. Theses Diss. 2006, 30, 2343. [Google Scholar]
- China, S. Influence of pavement macrotexture on PM10 emissions from paved roads: A controlled study. Atmos. Environ. 2012, 63, 313–326. [Google Scholar] [CrossRef]
- Svensson, N. Effects of a porous asphalt pavement on dust suspension and PM10 concentration. Transp. Res. Part D 2023, 123, 103921. [Google Scholar] [CrossRef]
- Hall, J.W.; Smith, K.L.; Titus-Glover, L.; Wambold, J.C.; Yager, T.J.; Rado, Z. Guide for pavement friction. Final Rep. NCHRP Proj. 2009, 43. [Google Scholar] [CrossRef]
- ASTM E965; Standard Test Method for Measuring Pavement Macrotexture Depth Using a Volumetric Technique. ASTM: West Conshohocken, PA, USA, 2007.
- Moon, S.B.; Lee, S.W.; Kim, J.H.; Kim, Y.K. Characterization of coarse aggregate amounts on a road surface of fine-size exposed aggregate concrete pavement for tire-pavement noise reduction. Int. J. Highw. Eng. 2019, 21, 27–33. [Google Scholar] [CrossRef]
- Lyhour, C. Computer Vision and Photogrammetry-aided for Exposed Aggregate Concrete Pavement Surface Texture Evaluation. Ph.D. Thesis, Gangreungwonju Univeristy, Gangneung-si, Republic of Korea, 2022. [Google Scholar]
- U.S. Environmental Protection Agency. Emission Factor Documentation for AP-42, Section 13.2.1: Paved Roads; EPA Contact No. 68-D0-0123, Work Assignment No. 44 MRI Project No. 9712-44. 1993. Available online: https://www3.epa.gov/ttn/chief/ap42/ch13/bgdocs/b13s0201.pdf (accessed on 27 July 2022).
- Zhang, W.; Ji, Y.; Zhang, S.; Zhang, L.; Wang, S. Determination of silt loading distribution characteristics using a rapid silt loading testing system in Tianjin, China. Aerosol Air Qual. Res. 2017, 17, 2129–2138. [Google Scholar] [CrossRef]
- Li, D.; Chen, J.; Zhang, Y.; Gao, Z.; Ying, N.; Gao, J.; Zhang, K.; Zhu, S. Dust emissions from urban roads using the AP-42 and TRAKER methods: A case study. Atmos. Pollut. Res. 2021, 12, 101051. [Google Scholar] [CrossRef]
- Yoo, H.; Cho, J.; Hong, S.; Kim, I. Characteristics of suspended road dust according to vehicle driving patterns in an urban area and PM10 content in silt. Atmosphere 2024, 15, 5. [Google Scholar] [CrossRef]
- Hong, S.; Yoo, H.; Cho, J.; Yeon, G.; Kim, I. Characteristics of resuspended road dust with traffic and atmospheric environment in South Korea. Atmosphere 2022, 13, 1215. [Google Scholar] [CrossRef]
- Chung, C.H.; Park, J.H.; Hwang, S.M.; Jeong, Y.G. Comparison of PM10 mass concentration in different measurement methods and meteorological conditions. J. Korean Aerosol Soc. 2009, 5, 53–62. [Google Scholar]
- Hong, S.J. Relationship Between Tire-Pavement Noise and Surface Texture. Ph.D. Thesis, Gangreungwonju Univeristy, Gangneung-si, Republic of Korea, 2015. [Google Scholar]
- Kim, J.H. Effects of Pavement Texture Characteristics on Tire—Pavement Interaction Noise. Ph.D. Thesis, Gangreungwonju Univeristy, Gangneung-si, Republic of Korea, 2023. [Google Scholar]
- Han, S.H. A Study on the Emissions and Chemical Characteristics of Resuspended Dust from Paved Roads in Urban Areas. Ph.D. Thesis, Inha University, Incheon, Republic of Korea, 2012. [Google Scholar]
- Penkala, M. Exploring the relationship between particulate matter emission and the construction material of road surface: Case study of highways and motorways in Poland. Materials 2023, 16, 1200. [Google Scholar] [CrossRef] [PubMed]
- Johansson, C. PM10 Emission Från Betongbeläggning (PM10 Emission from Concrete Pavement in Swedish); Stockholm University: Stockholm, Sweden, 2009; Report No: 192. [Google Scholar]
- Gustafsson, M.; Blomqvist, G.; Järlskog, I.; Lundberg, J.; Janhäll, S.; Elmgren, M.; Johansson, C.; Norman, M.; Silvergren, S. Road Dust Load Dynamics and Influencing Factors for Six Winter Seasons in Stockholm, Sweden. Atmos. Environ. X 2019, 2, 100014. [Google Scholar] [CrossRef]
- Jiang, W.; He, C.; Huang, Y.; Wang, T.; Yuan, D.; Wu, W.; Fan, H. Diffusion of re-suspended dust induced by vehicles: Full-scale simulation and field test. Transp. Res. Part D Transp. Environ. 2025, 139, 104552. [Google Scholar] [CrossRef]
- Wang, B.; Guo, A.; Bai, Y.; Wang, J.; Wu, J.; Xu, X.; Li, Y. Road resuspension PM2.5 from two vehicles driving in parallel by CFD method: The characteristics and population exposure. J. Clean. Prod. 2024, 471, 143380. [Google Scholar] [CrossRef]


| Before sL | ||||
| Location | Vehicle Speed | Road Dust (RD) | Background Dust (BD) | Resuspended Dust (RD-BD) |
| Site C | 30 km/h | 114.014 | 97.252 | 16.719 |
| 40 km/h | 122.989 | 95.792 | 27.197 | |
| 50 km/h | 148.3 | 93.033 | 55.267 | |
| After sL | ||||
| Location | Vehicle Speed | Road Dust (RD) | Background Dust (BD) | Resuspended Dust (RD-BD) |
| Site C | 30 km/h | 124.223 | 122.14 | 2.083 |
| 40 km/h | 125.545 | 122.306 | 3.239 | |
| 50 km/h | 128.75 | 122.889 | 5.861 | |
| Mean Reduction in Suspended Dust Concentration After sL Sampling | ||||
| Location | Vehicle Speed | Before | After | Mean Reduction Rate (%) |
| Site C | 30 km/h | 16.719 | 2.083 | 87.55 |
| 40 km/h | 27.197 | 3.239 | 88.09 | |
| 50 km/h | 55.267 | 5.861 | 89.41 | |
| Average reduction | 88.35 | |||
| Measurement Section | Type of Pavement | Average Wavelength (mm) (Standard Deviation) | Average Mean Texture Depth (mm) (Standard Deviation) |
|---|---|---|---|
| Site A | EACP (10 mm) | 5.3 (0.08) | 1.43 (0.2) |
| T.Tining | 30 (0.01) | 1.14 (0.19) | |
| Site B | EACP (6 mm) | 3.4 (0.06) | 1.23 (0.11) |
| EACP (8 mm) | 3.7 (0.06) | 1.27 (0.15) | |
| NGCS | 4.5 (0.05) | 1.4 (0.18) | |
| T.Tining | 30 (0.01) | 0.84 (0.1) |
| Measurement Section | Type of Pavement | sL (mg/m2) | Suspended Road Dust (µg/m3) | PM10 Contents (%) | Background Dust (OB) | Background Dust (TR) | |
|---|---|---|---|---|---|---|---|
| Site A | EACP (10 mm) | 44.4 | 255.16 | 2.1615 | 61 | 68.01 | |
| T.Tining | 80 | 306 | 3.775 | 61 | 67.99 | ||
| Site B | EACP (6 mm) | 152.3 | 192.35 | 4.1245 | 62 | 64.25 | |
| EACP (8 mm) | 200.6 | 167.7 | 4.1345 | 62 | 64.25 | ||
| NGCS | 151.5 | 172.16 | 3.9335 | 62 | 64.11 | ||
| T.Tining | 50.1 | 277.29 | 1.8830 | 65 | 70.28 | ||
| OB: Background concentration measured by the observatory closest to the test site TR: PM10 concentration measured by the TRAKER-mounted vehicle during testing | |||||||
| Sampling locations | sL collected Specimens | ||||||
| Exposed aggregate concrete pavement (10 mm) | 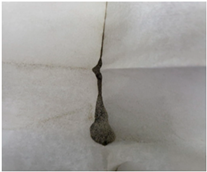 | ||||||
| Next-generation concrete pavement | 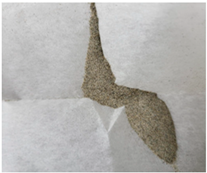 | ||||||
| Transverse tining concrete pavement | 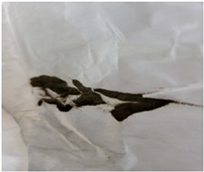 | ||||||
| Factors | Low | Middle | High |
|---|---|---|---|
| MTD (mm) | Under 1 | 1~1.4 | More than 1.4 |
| Silt loading (g/m2) | Under 0.06 | 0.06~0.15 | More than 0.15 |
| Wavelength (mm) | Under 4 | 4~30 | 30 |
| Type of Pavement | Dust Load Potential/Results | Suspended Dust Potential/Results | Principle and Discussion |
|---|---|---|---|
| EACP (Removal of surface mortar from randomly exposed aggregates to surfaces) | Low/Low | Low/Low | Surface wear may increase the accumulation of dust; however, the random exposure of coarse aggregates on the pavement can disrupt airflow continuity and reduce the air-pumping pressure generated between the tire and the surface, thereby lowering the amount of dust |
| NGCS (Formation of texture via grooving treatment after surface treatment) | Middle/Middle | Middle/Middle | It forms a groove with a certain standard, but the depth is shallower than T.tining, which may affect road dust collection. The road dust concentration can be lower than T.Tining |
| T.Tining (Horizontal texture with arbitrary lines spaced laterally) | High/Irregularity | Low/High | Although it forms a groove of a certain standard, it may not affect the collection of road dust using the Vacuum Sweep Method, and air-pumping generates high levels of dust |
| Correlation Analysis Results Between Suspended Road Dust and Influencing Factors | ||||||
| Right MTD | 3 Points MTD | Wavelength | sL | PM10 Contents | ||
| −0.287 | −0.300 | 0.840 | −0.750 | −0.510 | ||
| Results of Multi-regression Analysis between suspended road dust | ||||||
| Adjust R2 | F | p-value | ||||
| 0.765 | 80.6 | <0.01 | ||||
| Category | Coefficient | Standard error | t-statistics | p-value | ||
| y-intercept | 180.177 | 24.819 | 7.260 | <0.001 | ||
| Right MTD | 19.122 | 13.730 | 1.393 | 0.047 | ||
| Wavelength | 3.532 | 0.410 | 8.617 | <0.001 | ||
| sL * PM10 (Contents of PM10 in sL) | 48.954 | 12.162 | 4.025 | <0.01 | ||
Disclaimer/Publisher’s Note: The statements, opinions and data contained in all publications are solely those of the individual author(s) and contributor(s) and not of MDPI and/or the editor(s). MDPI and/or the editor(s) disclaim responsibility for any injury to people or property resulting from any ideas, methods, instructions or products referred to in the content. |
© 2025 by the authors. Licensee MDPI, Basel, Switzerland. This article is an open access article distributed under the terms and conditions of the Creative Commons Attribution (CC BY) license (https://creativecommons.org/licenses/by/4.0/).
Share and Cite
Yoo, H.; Yeon, G.; Kim, I. Theoretical Analysis of Suspended Road Dust in Relation to Concrete Pavement Texture Characteristics. Atmosphere 2025, 16, 761. https://doi.org/10.3390/atmos16070761
Yoo H, Yeon G, Kim I. Theoretical Analysis of Suspended Road Dust in Relation to Concrete Pavement Texture Characteristics. Atmosphere. 2025; 16(7):761. https://doi.org/10.3390/atmos16070761
Chicago/Turabian StyleYoo, Hojun, Gyumin Yeon, and Intai Kim. 2025. "Theoretical Analysis of Suspended Road Dust in Relation to Concrete Pavement Texture Characteristics" Atmosphere 16, no. 7: 761. https://doi.org/10.3390/atmos16070761
APA StyleYoo, H., Yeon, G., & Kim, I. (2025). Theoretical Analysis of Suspended Road Dust in Relation to Concrete Pavement Texture Characteristics. Atmosphere, 16(7), 761. https://doi.org/10.3390/atmos16070761