Article

Spatiotemporal Analysis of Air Pollution and Climate Change Effects on Urban Green Spaces in Bucharest Metropolis

ITC Department, National Institute of R&D for Optoelectronics, 409 Atomistilor Street, MG5, 077125 Magurele, Romania
*
Author to whom correspondence should be addressed.
Atmosphere 2025, 16(5), 553; https://doi.org/10.3390/atmos16050553
Submission received: 31 March 2025 / Revised: 2 May 2025 / Accepted: 3 May 2025 / Published: 7 May 2025
(This article belongs to the Section Biosphere/Hydrosphere/Land–Atmosphere Interactions)

Abstract

:
Being an essential issue in global climate warming, the response of urban green spaces to air pollution and climate variability because of rapid urbanization has become an increasing concern at both the local and global levels. This study explored the response of urban vegetation to air pollution and climate variability in the Bucharest metropolis in Romania from a spatiotemporal perspective during 2000–2024, with a focus on the 2020–2024 period. Through the synergy of time series in situ air pollution and climate data, and derived vegetation biophysical variables from MODIS Terra/Aqua satellite data, this study applied statistical regression, correlation, and linear trend analysis to assess linear relationships between variables and their pairwise associations. Green spaces were measured with the MODIS normalized difference vegetation index (NDVI), leaf area index (LAI), photosynthetically active radiation (FPAR), evapotranspiration (ET), and net primary production (NPP), which capture the complex characteristics of urban vegetation systems (gardens, street trees, parks, and forests), periurban forests, and agricultural areas. For both the Bucharest center (6.5 km × 6.5 km) and metropolitan (40.5 km × 40.5 km) test areas, during the five-year investigated period, this study found negative correlations of the NDVI with ground-level concentrations of particulate matter in two size fractions, PM2.5 (city center r = −0.29; p < 0.01, and metropolitan r = −0.39; p < 0.01) and PM10 (city center r = −0.58; p < 0.01, and metropolitan r = −0.56; p < 0.01), as well as between the NDVI and gaseous air pollutants (nitrogen dioxide—NO2, sulfur dioxide—SO2, and carbon monoxide—CO. Also, negative correlations between NDVI and climate parameters, air relative humidity (RH), and land surface albedo (LSA) were observed. These results show the potential of urban green to improve air quality through air pollutant deposition, retention, and alteration of vegetation health, particularly during dry seasons and hot summers. For the same period of analysis, positive correlations between the NDVI and solar surface irradiance (SI) and planetary boundary layer height (PBL) were recorded. Because of the summer season’s (June–August) increase in ground-level ozone, significant negative correlations with the NDVI (r = −0.51, p < 0.01) were found for Bucharest city center and (r = −76; p < 0.01) for the metropolitan area, which may explain the degraded or devitalized vegetation under high ozone levels. Also, during hot summer seasons in the 2020–2024 period, this research reported negative correlations between air temperature at 2 m height (TA) and the NDVI for both the Bucharest city center (r = −0.84; p < 0.01) and metropolitan scale (r = −0.90; p < 0.01), as well as negative correlations between the land surface temperature (LST) and the NDVI for Bucharest (city center r = −0.29; p< 0.01) and the metropolitan area (r = −0.68, p < 0.01). During summer seasons, positive correlations between ET and climate parameters TA (r = 0.91; p < 0.01), SI (r = 0.91; p < 0.01), relative humidity RH (r = 0.65; p < 0.01), and NDVI (r = 0.83; p < 0.01) are associated with the cooling effects of urban vegetation, showing that a higher vegetation density is associated with lower air and land surface temperatures. The negative correlation between ET and LST (r = −0.92; p < 0.01) explains the imprint of evapotranspiration in the diurnal variations of LST in contrast with TA. The decreasing trend of NPP over 24 years highlighted the feedback response of vegetation to air pollution and climate warming. For future green cities, the results of this study contribute to the development of advanced strategies for urban vegetation protection and better mitigation of air quality under an increased frequency of extreme climate events.

1. Introduction

European cities will face a wide range of challenges over the coming decades that will influence the nature of urban growth, development across the continent, and impacts on human and vegetation ecosystem health [1,2,3]. Climate change and the intensity of extreme climate events (like heat waves—HWs, flooding, storming, freezing, etc.) are of great environmental concern for humanity in this century. Due to reduced vegetation and increased impermeable areas, the urban heat island (UHI) is one of the important outcomes of land cover surface changes processes induced by urbanization, which represents the difference in land surface albedo (LSA), roughness, and heat flux exchange of land surface between urban and rural areas [4,5]. As urbanization has become an important contributor to global warming, the UHI effect will influence the regional climate, environment, and socio-economic development. Synergy of HWs with UHIs will amplify the effects of hot summers on urban vegetation and people’s health. Air pollution can exacerbate urban heat by increasing the greenhouse effect, altering atmospheric chemistry, and amplifying UHI intensity [6]. It worsens people’s health and air quality, while urban green infrastructure plays a fundamental role in mitigating the effects of UHIs [7,8]. In the frame of predicted climate change due to the increasing trend of extreme event frequency, ozone layer depletion, and global warming in the south-eastern part of Europe, urban air pollution is an important issue in scientific research. Air pollution represents one of the most important drivers affecting the Earth’s energy balance and hydrological cycle, climate, vegetation, and human health. In large metropolitan areas, air pollution resulting from rapid urbanization, industrialization, and population growth, associated with the increased emissions of several pollutants, and enhanced by secondary aerosol formation, is a major concern for society, affecting urban ecosystems, including urban green spaces. Air pollution has destructive effects both on vegetation and human health, inducing physiological and biochemical responses [9,10]. The dispersion process of major air pollutants in the lower atmosphere (with particulate matter in two size fractions, 2.5 µm (PM2.5) and 10 µm (PM10); ozone—O3; nitrogen dioxide—NO2; sulfur dioxide—SO2; carbon monoxide—CO; formaldehyde—HCHO; volatile organic compounds—VOCs), which originate from various anthropogenic and natural sources, is crucial for an understanding of air quality and its impacts on urban vegetation and public health [11]. Different factors influence the dispersion of these pollutants, including emission sources, meteorological conditions, topography, and atmospheric chemical reactions. It is considered that besides meteorological factors such as wind intensity and direction, relative air humidity, atmospheric stability conditions, and planetary boundary layer height (PBL) strongly affect seasonal and diurnal air pollutant concentration variations [12]. The influence of aerosol particles on climate, and how their properties are modified by anthropogenic activity, is one of the key uncertainties in climate change assessments. Urban vegetation plays an important role in the retention of the PM2.5 and PM10, but it is most affected when the wet and dry atmospheric deposition onto the leaf surface increases through light reduction and blocking stomata, followed by photosynthesis decline [13,14]. Besides direct toxic effects on vegetation, air pollutants may have indirect negative effects by changing soil pH, followed by the solubilization of toxic salts of metals like aluminum, which can decrease plant growth [15]. However, meteorological parameters and their seasonal variation affect air pollutant removal through deposition in many ways. For PM deposition, precipitation and wind speed are the most important climate factors [16], while for stomatal NO2 deposition, and to some extent also for small PM, factors such as solar radiation, air humidity, and soil moisture affecting stomatal conductance are essential [17].
Numerous authors reported that urban vegetation can absorb PM2.5 and PM10 from the atmosphere, while others reported that urban forests play an important role in carbon storage and sequestration [18,19]. However, under field conditions, long-term exposure of urban vegetation to air pollutants emitted by incomplete combustion of fossil fuels and road transport triggers a decline in urban trees and forests [20,21]. The explanation for this comprises plant photosynthesis inhibition via air pollution, resulting in a decrease in plant growth. According to scientific findings, various pollutant mixtures can have synergistic effects on vegetation photosynthesis. Several studies have shown that air pollutants, such as NO2, O3, and SO2, cause chlorophyll degradation [22,23]. The chlorophyll content in plants is related both to photosynthesis mechanisms and leaf nitrogen content, which is one of the key components of chlorophyll [24]. Also, ground-level gaseous air pollutants can lead to oxidative stress in plants [25], which can damage their cell membranes, resulting in ion leakage because of changes in cell permeability [26]. While CO2 promotes vegetation health through the fertilization effect, O3 reduces its health by causing oxidative damage. Meanwhile, aerosols exert dual effects on urban vegetation by altering surface radiation for photosynthesis. The impacts of air temperature change vary by region, and the effects of average and extreme precipitation differ. Also, urban vegetation absorbs carbon dioxide (CO2) as organic compounds through the mechanism of photosynthesis, regulating the global carbon cycle and energy exchange [27,28]. Numerous studies have identified urban green spaces as a potential tool in urban planning for air pollution removal through deposition on vegetation, but the impact is still being debated [29,30].
During the last few decades, due to climate change, extreme climate events such as heat waves, droughts, floods, and severe thunderstorms have become more intense, frequent, and long-lasting. The cumulative stress effects on urban/periurban vegetation affect plant survival, productivity, and the adaptive capacity of trees [31]. In the context of global warming and climate change in South-Eastern Europe, where Bucharest, the capital of Romania, is located, the occurrence and severity of extreme events like heat waves and meteorological droughts significantly impact metropolitan vegetation. Several studies demonstrated the numerous beneficial effects of urban green on the environment, including improving air quality, thermal comfort, well-being, and carbon storage, as well as reductions in the heat island effect, flood risk, and noise, and increasing sustainability in urban areas [32]. While urban vegetation plays a major role in air quality and climate mitigation, its health is affected by air pollutants and extreme heat events [33]. However, the interplay between urban green land cover, air pollution, and urban thermal environment is a crucial issue in urban climatology.
The European Union’s (EU) New Biodiversity Strategy and New EU Forest Strategy for 2030 target protecting nature, particularly forests, reversing the degradation of vegetation ecosystems biodiversity recovery by 2030 [34], while the EU Nature Restoration Law calls for ending net loss and increasing the area of urban green spaces by the end of 2030 [35]. Specific actions will be implemented for the adaptation to ongoing climate warming of Europe’s urban land covers.
However, exploring the effects of air pollution and climate change on urban vegetation degradation is crucial to human and urban ecosystems’ health and safety. This is a critical issue to be addressed by both active and passive remote sensing systems. Multispectral and multiresolution satellite remote sensing sensors can distinguish and monitor vegetation landcover types over large surface areas and relate the spatiotemporal changes to local and regional climate and anthropogenic conditions. In situ monitoring data can serve as validation tools. With advances in remote sensing technology, remote sensing monitoring based on the link between vegetation spectral information and vegetation land cover has emerged as an efficient tool for obtaining valuable data on large regions. Time series satellite remote sensing data allow urban vegetation monitoring at different spatial scales (regional, national, and global scales), providing a powerful tool for analysis of spatiotemporal pattern changes under climate and air pollution stressors. Also, such analysis is suitable for the differentiation of vegetation species together with urban vegetation classes and stand conditions and for the detection of the structure and vegetation condition changes attributed to air pollutants’ effects on vegetation phenology/structure, water stress, insect infestation, or disease damage [36].
Due to the extensive use of old cars, industrial pollution, and heating based on fossil fuels such as coal and natural gas, Bucharest is considered among the most polluted metropolitan cities in Europe, where the recorded high concentration levels of air pollutants (PM2.5 and PM10, NO2, O3, CO, and SO2), sometimes exceed critically standard limits for Romania and the European Union [37]. Monitoring urban vegetation health has become essential due to increasing pressures caused by climate change and air pollution in the Bucharest metropolitan area, where, over the last few decades, green spaces have been fragmented and dispersed, causing impairment and dysfunction. Also, urban green infrastructure, among which periurban forests of Bucharest metropolis provide recognized cultural ecosystem services, is essential for enhancing social wellbeing and resilience [38]. To promote, preserve, and enhance the benefits offered by the urban vegetation, it is necessary to adequately describe the urban green ecosystem state and thoroughly understand its structure and functionality.
Long-term monitoring of urban green areas is needed to understand the specific mechanisms and interactions with air pollution and climate change, especially during the recent extreme climate events. This study considered the two-way interactions between air pollution and climate impacts on urban greenery and its feedback on urban air quality and urban climatology. Through integrated time series in situ observations and satellite data provided by several monitoring networks and digital platforms, analytical methodological data processing, and statistical cross-correlation and regression analysis of pairs of different variables changes, this study explored the impact of air pollution and climate seasonality on urban/periurban vegetation.
While some studies assessed the role of urban vegetation in mitigating air pollution in large cities by conducting extensive air quality measurements and using analytical techniques [39,40,41], limited research has analyzed the response of urban vegetation to air pollution and climate variability from a spatiotemporal perspective [42]. This study is focused on Bucharest urban green state analysis with a long-term spatiotemporal perspective during the 2000–2024 period through the integration of MODIS Terra/Aqua satellite-derived biophysical time series variables and in situ meteorological and air pollution data. This study aims to enhance our understanding of the air pollutants and climate influence on urban vegetation state in Bucharest metropolis from a spatiotemporal perspective during the last 25 years, with a focus on the 2020–2024 period. The main objective of this study was to comparatively quantify the effects of air pollutants (PM2.5, PM10, O3, NO2, SO2, and CO) and environmental parameters (air temperature-TA at a 2 m height, air relative humidity (RH), Planetary Boundary Layer height (PBL), solar surface irradiance (SI), and land surface temperature (LST)) on the normalized difference vegetation index (NDVI) and their temporal patterns in Bucharest center and metropolitan area. Also, the impact of the land surface temperature on vegetation parameters, Leaf Area Index (LAI), the fraction of absorbed photosynthetically active radiation (FPAR), and Net Primary Productivity (NPP) was analyzed.

2. Materials and Methods

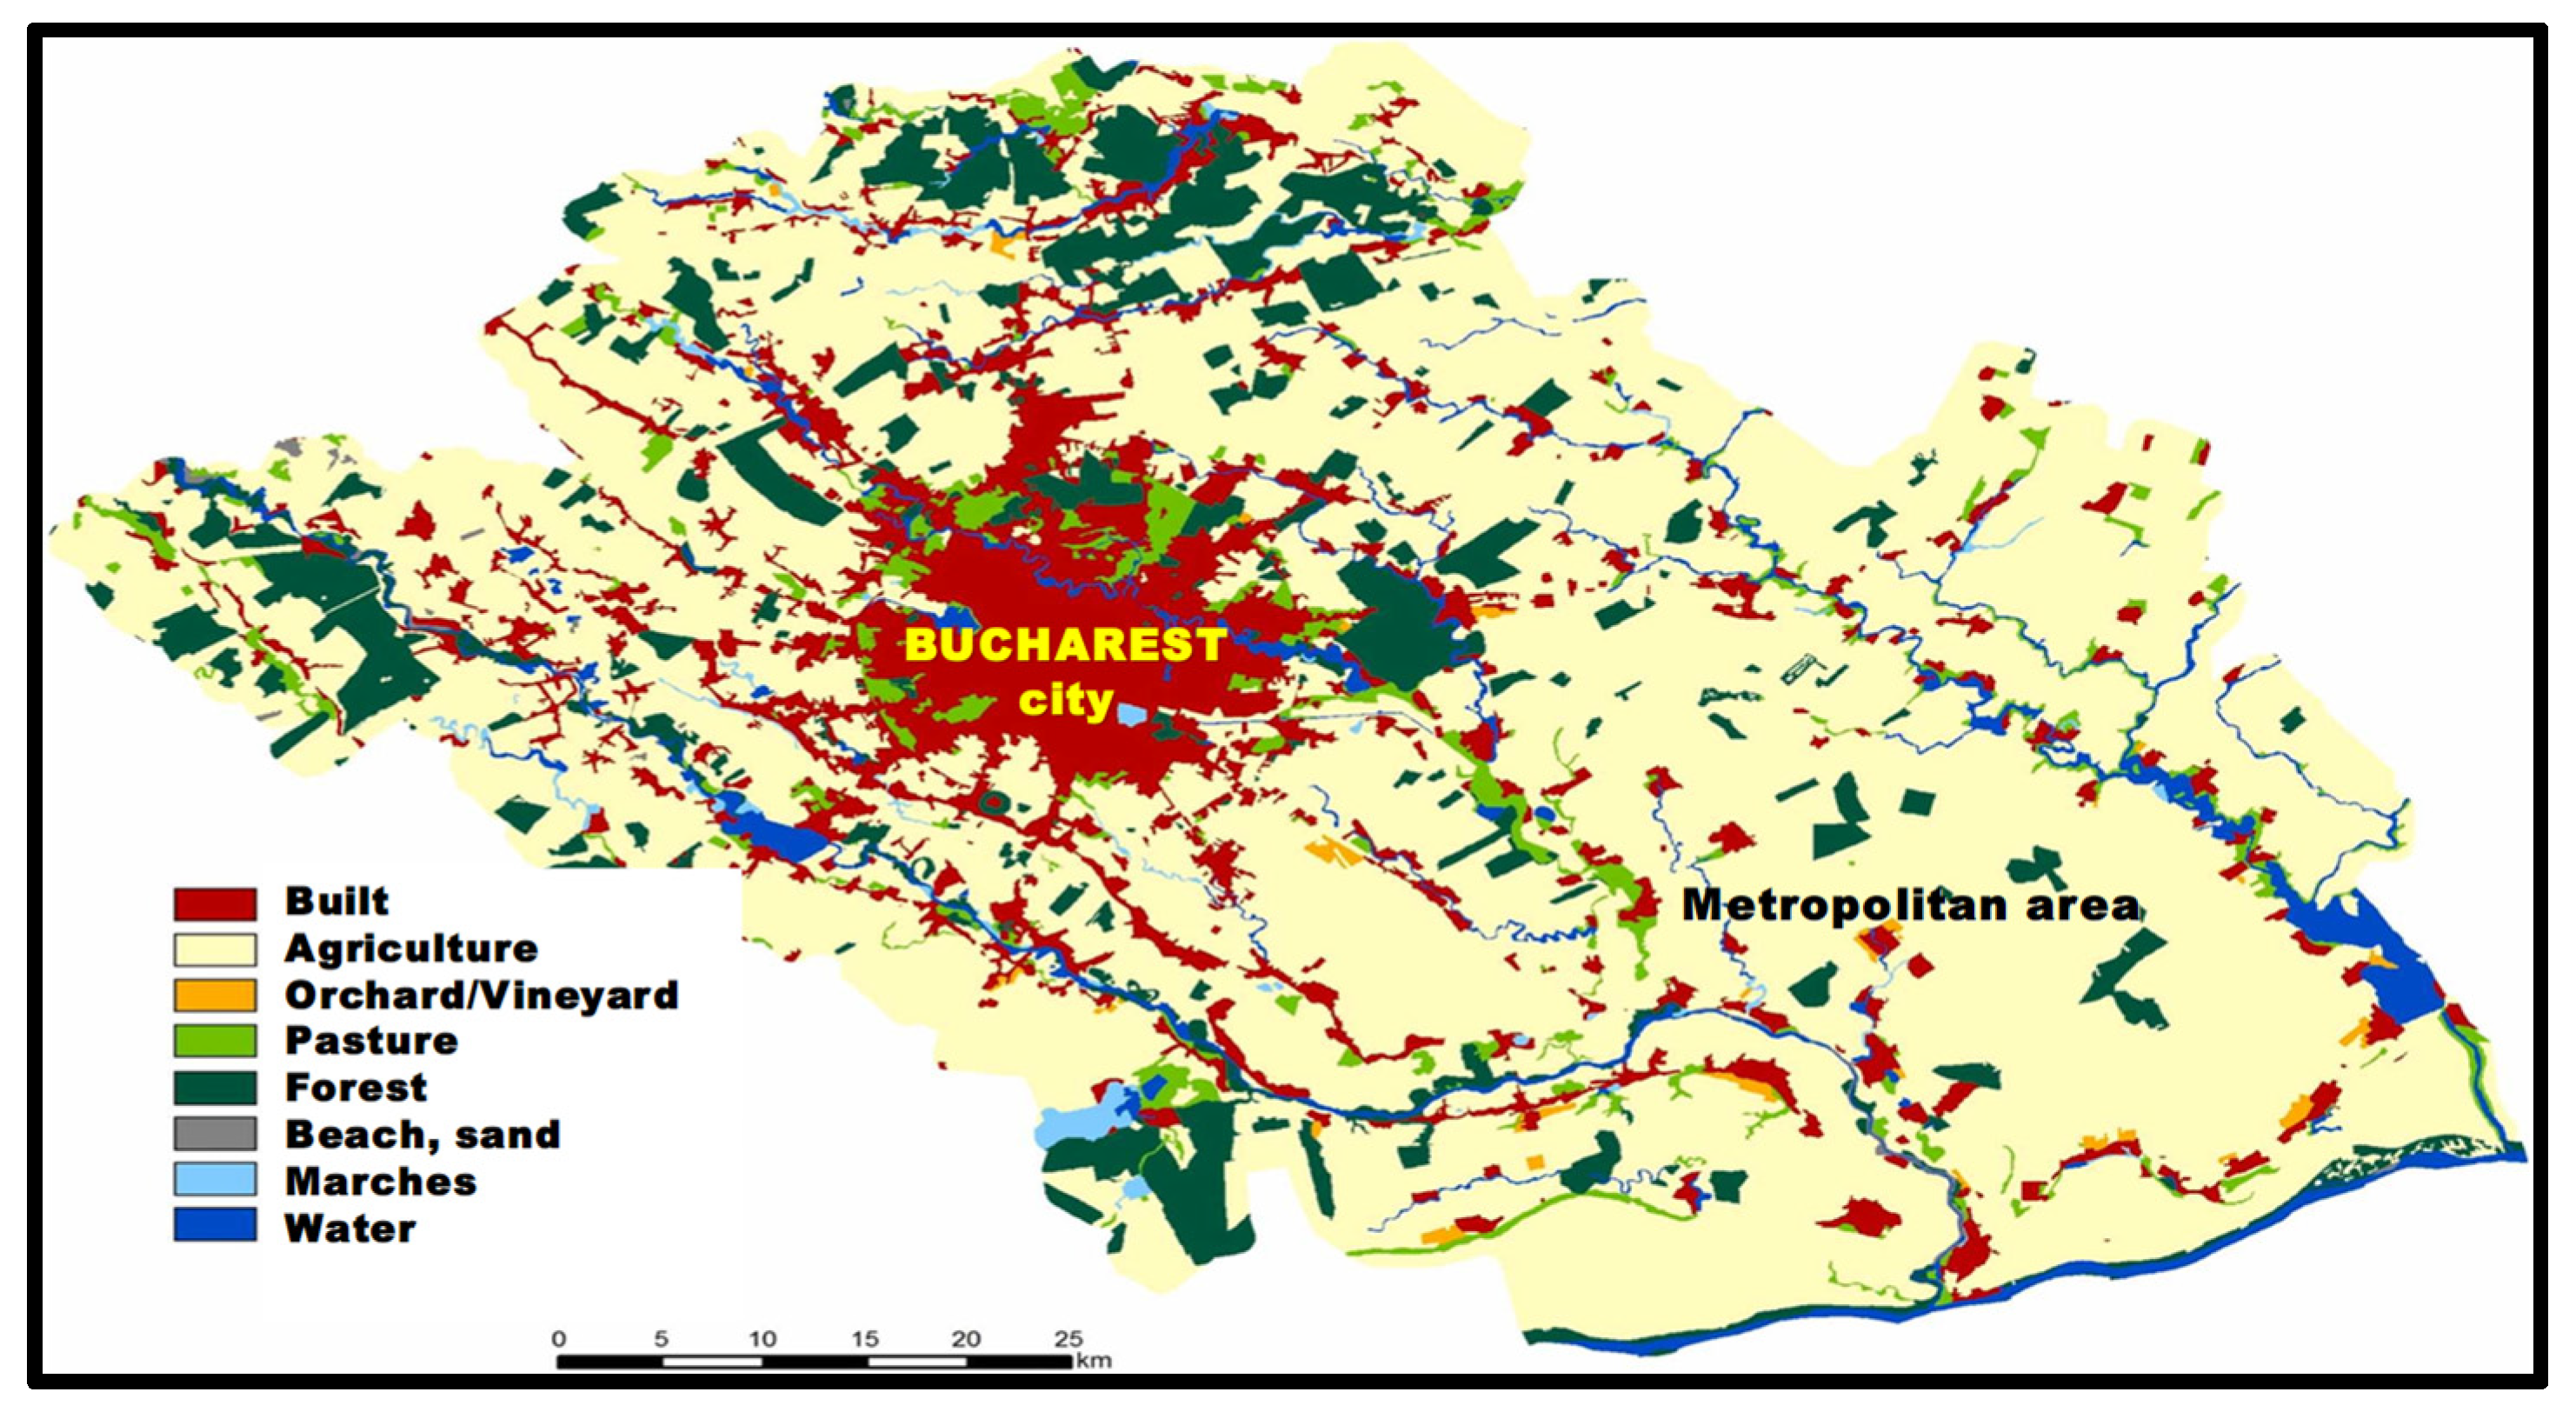
2.1. Study Test Area

Bucharest metropolitan area, capital of Romania, is located in the south-eastern part of the country and South-Eastern part of Europe, being bounded by latitudes 44.33° N and 44.66° N and 25.90° E and 26.20° E longitudes. Its center is situated at 44.4355381° N Latitude and 26.100049° E Longitude (Figure 1). Bucharest lies on the Romanian Plain, on the banks of the Dâmbovița River, a small tributary of the Danube. It is the largest metropolis in the country, with approximately 2.2 million people and a 1811 km2 area, while Bucharest city has 1.8 million inhabitants and a 240 km2 area, of which urban green (parks, forests, and small green patches) covers almost 10% of its area [43]. The metropolitan test area includes the city of Bucharest and its surrounding periurban areas with complex landcover environments (green, built, and blue structures), as well as ongoing urbanization. These periurban areas cover approximately 543 km2 and have approximately 0.81 million inhabitants. During the period from 1993 to 2020, the metropolitan vegetation land cover in Bucharest decreased, from 4839 ha in 1993 to 4506 ha [44]. This large area covers multiple urban-to-rural transition areas and consists of different vegetation types (shrubs, grass, forest, crops, etc.). Additionally, the metropolitan area has a diverse landscape pattern in terms of the spatial distribution of various land cover types, with flat plain areas. Bucharest is one of the most polluted cities in Europe, being ranked in 2022 in the 9th position out of 96 European top cities, having the highest air pollution level in Romania [45]. The climate is temperate continental, with influences of the Western European Climate Circulation, Mediterranean Cyclones, and the East European Anticyclone, which is characterized by very hot summers, particularly during heat wave events, and cold, humid winters.

2.2. Data Sets

To analyze air pollution and climate impacts on urban vegetation in the Bucharest metropolitan area during 2020–2024, this study used available observational, satellite remote sensing, and reanalysis data provided by various sources. The main air pollutants and climate time series data sets were supplied by different monitoring networks and satellite platforms:
(1)
Air quality data. AQICN (World Air Quality Index) [46] and local monitoring networks supplied the daily mean time series data for air pollutant concentrations.
(2)
Potential climate driving factors. This study used the daily mean time series of climate data (air temperature (TA) at 2 m height, air relative humidity (RH), air pressure (p), wind speed intensity (w) and direction, planetary boundary layer height (PBL), and solar surface irradiance (SI)) provided by MERRA-2 Version 2 (Modern-Era Retrospective Analysis for Research and Applications) [47] and C3S (Copernicus Climate Change Service) [48], and NASA’s online database by Goddard Earth Sciences Data and Information Services Center (GES DISC) released Geospatial Interactive Online Visualization and Analysis Infrastructure (GIOVANNI) V4.28 via its portal [49].
  • From the Terrestrial Ecology Subsetting & Visualization Services (TESViS)
  • Global Subsets Tool from the ORNL DAAC, MODIS Terra/Aqua data [50]:
(3)
MODIS LST data: among the available LST products developed through the different retrieval algorithms based on TIR sensors from different satellite missions (TM/ETM+/OLI, AVHRR, SENTINEL, AMSR-E, AATSR, and VIRR), MODIS Terra/Aqua is considered the most suitable data source for LST monitoring due to its high observation frequency, moderate spatial resolution, and free availability [51,52]. This study used the NASA MODIS/VIIRS Land Products Global Subsetting Tool at the ORNL DAAC, MOD11A2 LST_Day_1 km and MOD11A2 LST_Night_1 km collected within 8 days [53], providing time series LST data for the Bucharest metropolitan area. Several studies found that the root mean square error (RMSE) of the MODIS LST data is within 2.0 °C and exhibits high accuracy in the major global cities [54].
(4)
MODIS NDVI data: MOD13Q1 MODIS/Terra Vegetation Indices NDVI/EVI 16-Day L3 Global 250 m SIN Grid V06116-day.
(5)
MODIS LAI/FPAR data: MOD15A2H MODIS/Terra Leaf Area Index/FPAR 8-Day with 500 m spatial resolution, mainly for their capacity to detect anthropogenic and climate impacts on urban vegetation land cover changes.
(6)
MODIS LSA (land Surface Albedo): MCD43A1 MODIS/Terra+Aqua BRDF/Albedo Model Parameters Daily L3 Global–500 m V061.
(7)
MOD16A2ET_500 m at 8 days for evapotranspiration monitoring.
(8)
MOD17A3HGF v061: MODIS/Terra Net Primary Production Gap-Filled Yearly L4 Global 500 m SIN Grid.

2.3. Methodology

Current research used a robust methodology to investigate the complex interplay of urban green land cover with air pollutants and climate variables in a comprehensive manner, incorporating time series data analysis, an approach less commonly employed in urban vegetation contexts.
NDVI observable, expressing the greenness of the land surface is calculated from reflectance measurements in the red and the near-infrared bands from satellite images and ranges from −1 to 1, with negative values indicating the absence of vegetation (e.g., clouds and water), and positive values near zero indicating bare soil, sparse vegetation (0.1–0.5) and abundant healthy vegetation (0.6 and above) [55]. Cross-correlation analysis was used to assess the similarity between two time series data of the outdoor daily mean air pollutants (PM2.5, PM10, O3, NO2, SO2, and CO) concentrations, the daily average meteorological multiparameters (TA, RH, SI, PBL, LST, and LSA), and vegetation parameters (NDVI, LAI/FPAR, and GPP) in Bucharest center and metropolitan areas. Standard statistical tools, Spearman rank-correlation, rank-correlation non-parametric test coefficients, trend analysis, and linear regression analysis were used for the dependence between pairs of the daily mean time series data.
Kolmogorov–Smirnov Tests of Normality were used to assess the normality of the daily mean time-series data sets, because climate observables have a non-normal distribution during extreme climate events, such as heat waves, cold waves, or thunderstorms. Spearman rank correlation as a nonparametric measure was chosen to identify the dependence between the rankings of the important pairs of variables, also showing the strength and direction of the linear relationship between two continuous variables, to provide a numerical summary of their association [56]. This method is effective for analyzing the diverse characteristics of vegetation phenology across different spatial and temporal scales of seasonal variation, especially in complex urban environments. The Spearman rank correlation coefficient, r, measures the strength and direction of both linear and nonlinear correlations between variables. This coefficient ranges from −1 to 1, with higher absolute values showing stronger correlations between variables. Correlations were considered significant when the p-value met the 0.01 to 0.05 level of significance.
So, the degree to which changes in one variable are associated with changes in another variable. In this study, we explored the application of these statistical methods to investigate the associations between independent variables (explanatory variables) X, such as PM2.5, PM10, O3, NO2, SO2, CO, and NDVI (Normalized Difference Vegetation Index), and the dependent variable (response variable) Y, which represents TA, LST, and LSA. To determine the statistical significance of the correlation, we used a p-value (p < 0.01). ORIGIN 10.0 software version 2021 for Microsoft Windows and ENVI 5.7 were used for data processing. All time series data sets were preprocessed using TIMESAT 3.2 software. Various preprocessing levels were tested, including smoothing and phenometrics computation.

3. Results and Discussion

3.1. Land Use/Cover Changes in Bucharest

After 1990, Bucharest city suffered an intense and rapid periurban development, when the boundaries of the functional urban area shifted outwards from the urban core, increasing landscape diversity coupled with fragmentation. Also, the rapid urbanization may be responsible for the higher air and land surface temperatures associated with UHIs and HWs recorded during summer periods due to vegetation land cover reduction and an increase in impervious surfaces. Based on Copernicus Urban Atlas land use land cover (LULC) in 2018, the distribution (km2) of different surface land cover classes in the Bucharest metropolitan area was as follows: agricultural area, 53%; artificial area, 33.6%; natural areas, 10.7%; water, 2.4%; and wetland, 0.2% [57]. During the 2012–2018 period, the Bucharest metropolitan area recorded significant land cover changes, as Table 1 presents.
However, by increasing urban land cover, artificial properties change the urban surface energy and water balance, different from that of natural surfaces. The Bucharest metropolitan region has a diverse landscape pattern in terms of the spatial distribution of various land cover types, with flat plain areas. Also, the new city morphology, urban forms, and topography of Bucharest impacted the microclimate by creating new urban canyons due to spatiotemporal changes of wind speed and direction, building walls creating warmer spots, which results in urban thermal discomfort. During the 2000–2024 period, Bucharest city expanded in all directions, with strong urban growth inside the town but also in periurban areas, resulting in an increase in overcrowded urban areas for all six sectors of the Bucharest metropolis. These changes resulted in modified characteristic urban/periurban spatial patterns, gradients, and landscape metrics, which support an understanding of Bucharest’s spatial growth, important for future urban spatial and strategic planning [58].

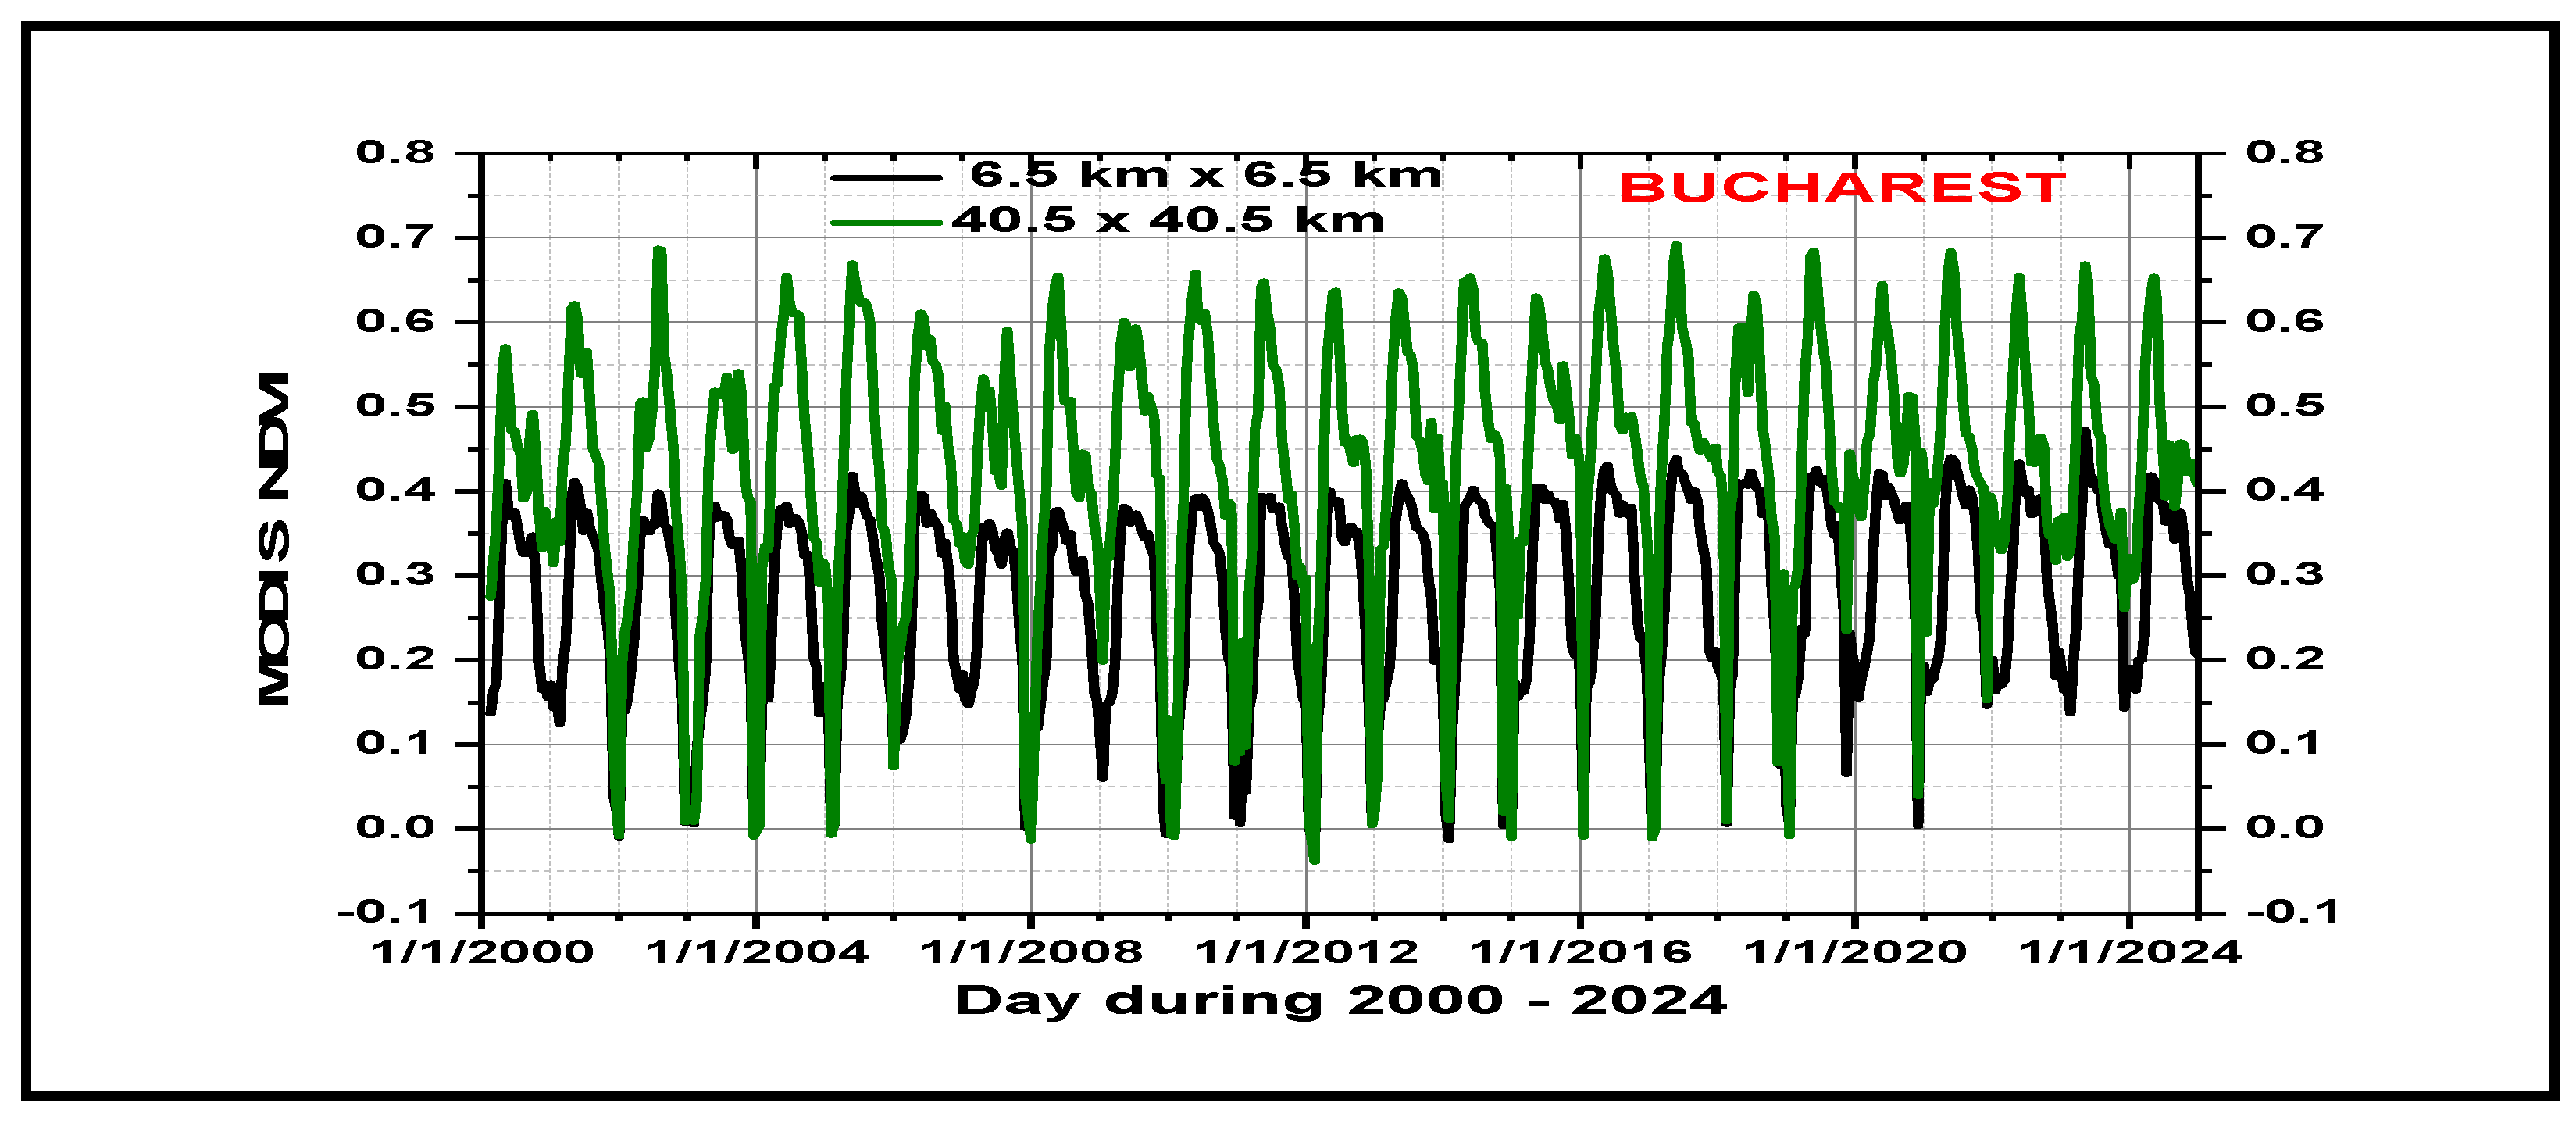
3.2. Normalized Difference Vegetation Indices’ Spatiotemporal Variability

To clarify the influence of climate and air pollution seasonal changes on urban vegetation and to quantitatively quantify their correlations with vegetation phenology in the Bucharest metropolitan area, this study analyzed time series of MODIS-derived NDVI vegetation parameter from a spatiotemporal perspective during 2000–2024, with a focus on the 2020–2024 period. Time series NDVI analysis captures dynamic changes in vegetation health in the Bucharest metropolitan area.
As Figure 2 shows, during the 25 years, the time series of the MODIS NDVI, spanning from 2000 to 2024 in 16-day intervals, presented a clear seasonality with maximum values during summer and minimum values during winter. Per entire analyzed period NDVI recorded average values of 0.29 ± 0.09 in the range of 0.004 to 0.4721 for Bucharest center, and 0.45 ± 0.11 in the range of −0.037 to 0.686 for the metropolitan area, revealing sparse to rich periurban vegetation, comparable with urban city lower to moderate vegetation vitality influenced by diverse urban microclimates. The time of maximum greenness is similarly distributed from early June to early August, results which is generally consistent with previous studies [59,60].
The trend analysis in the time series of the NDVI for the 2000–2024 period revealed distinct positive patterns for both Bucharest center (R2 = 0.672) and for the metropolitan area (R2 = 0.682), indicating that vegetation health is most responsive to climate factors during spring to autumn seasons, correlating strongly with peaks in seasonal air temperature, land surface temperature, solar radiation, and precipitation [61]. These findings confirm the urban greening trend that has been observed in other regions of Europe, using the longer time series and higher-spatial-resolution satellite data.
Understanding the dynamics of urban green in the central part of the city and metropolitan area is crucial for effective environmental monitoring and management, especially in plain regions like the South-Eastern part of Romania, which is sensitive to climate change, especially extreme climate events.

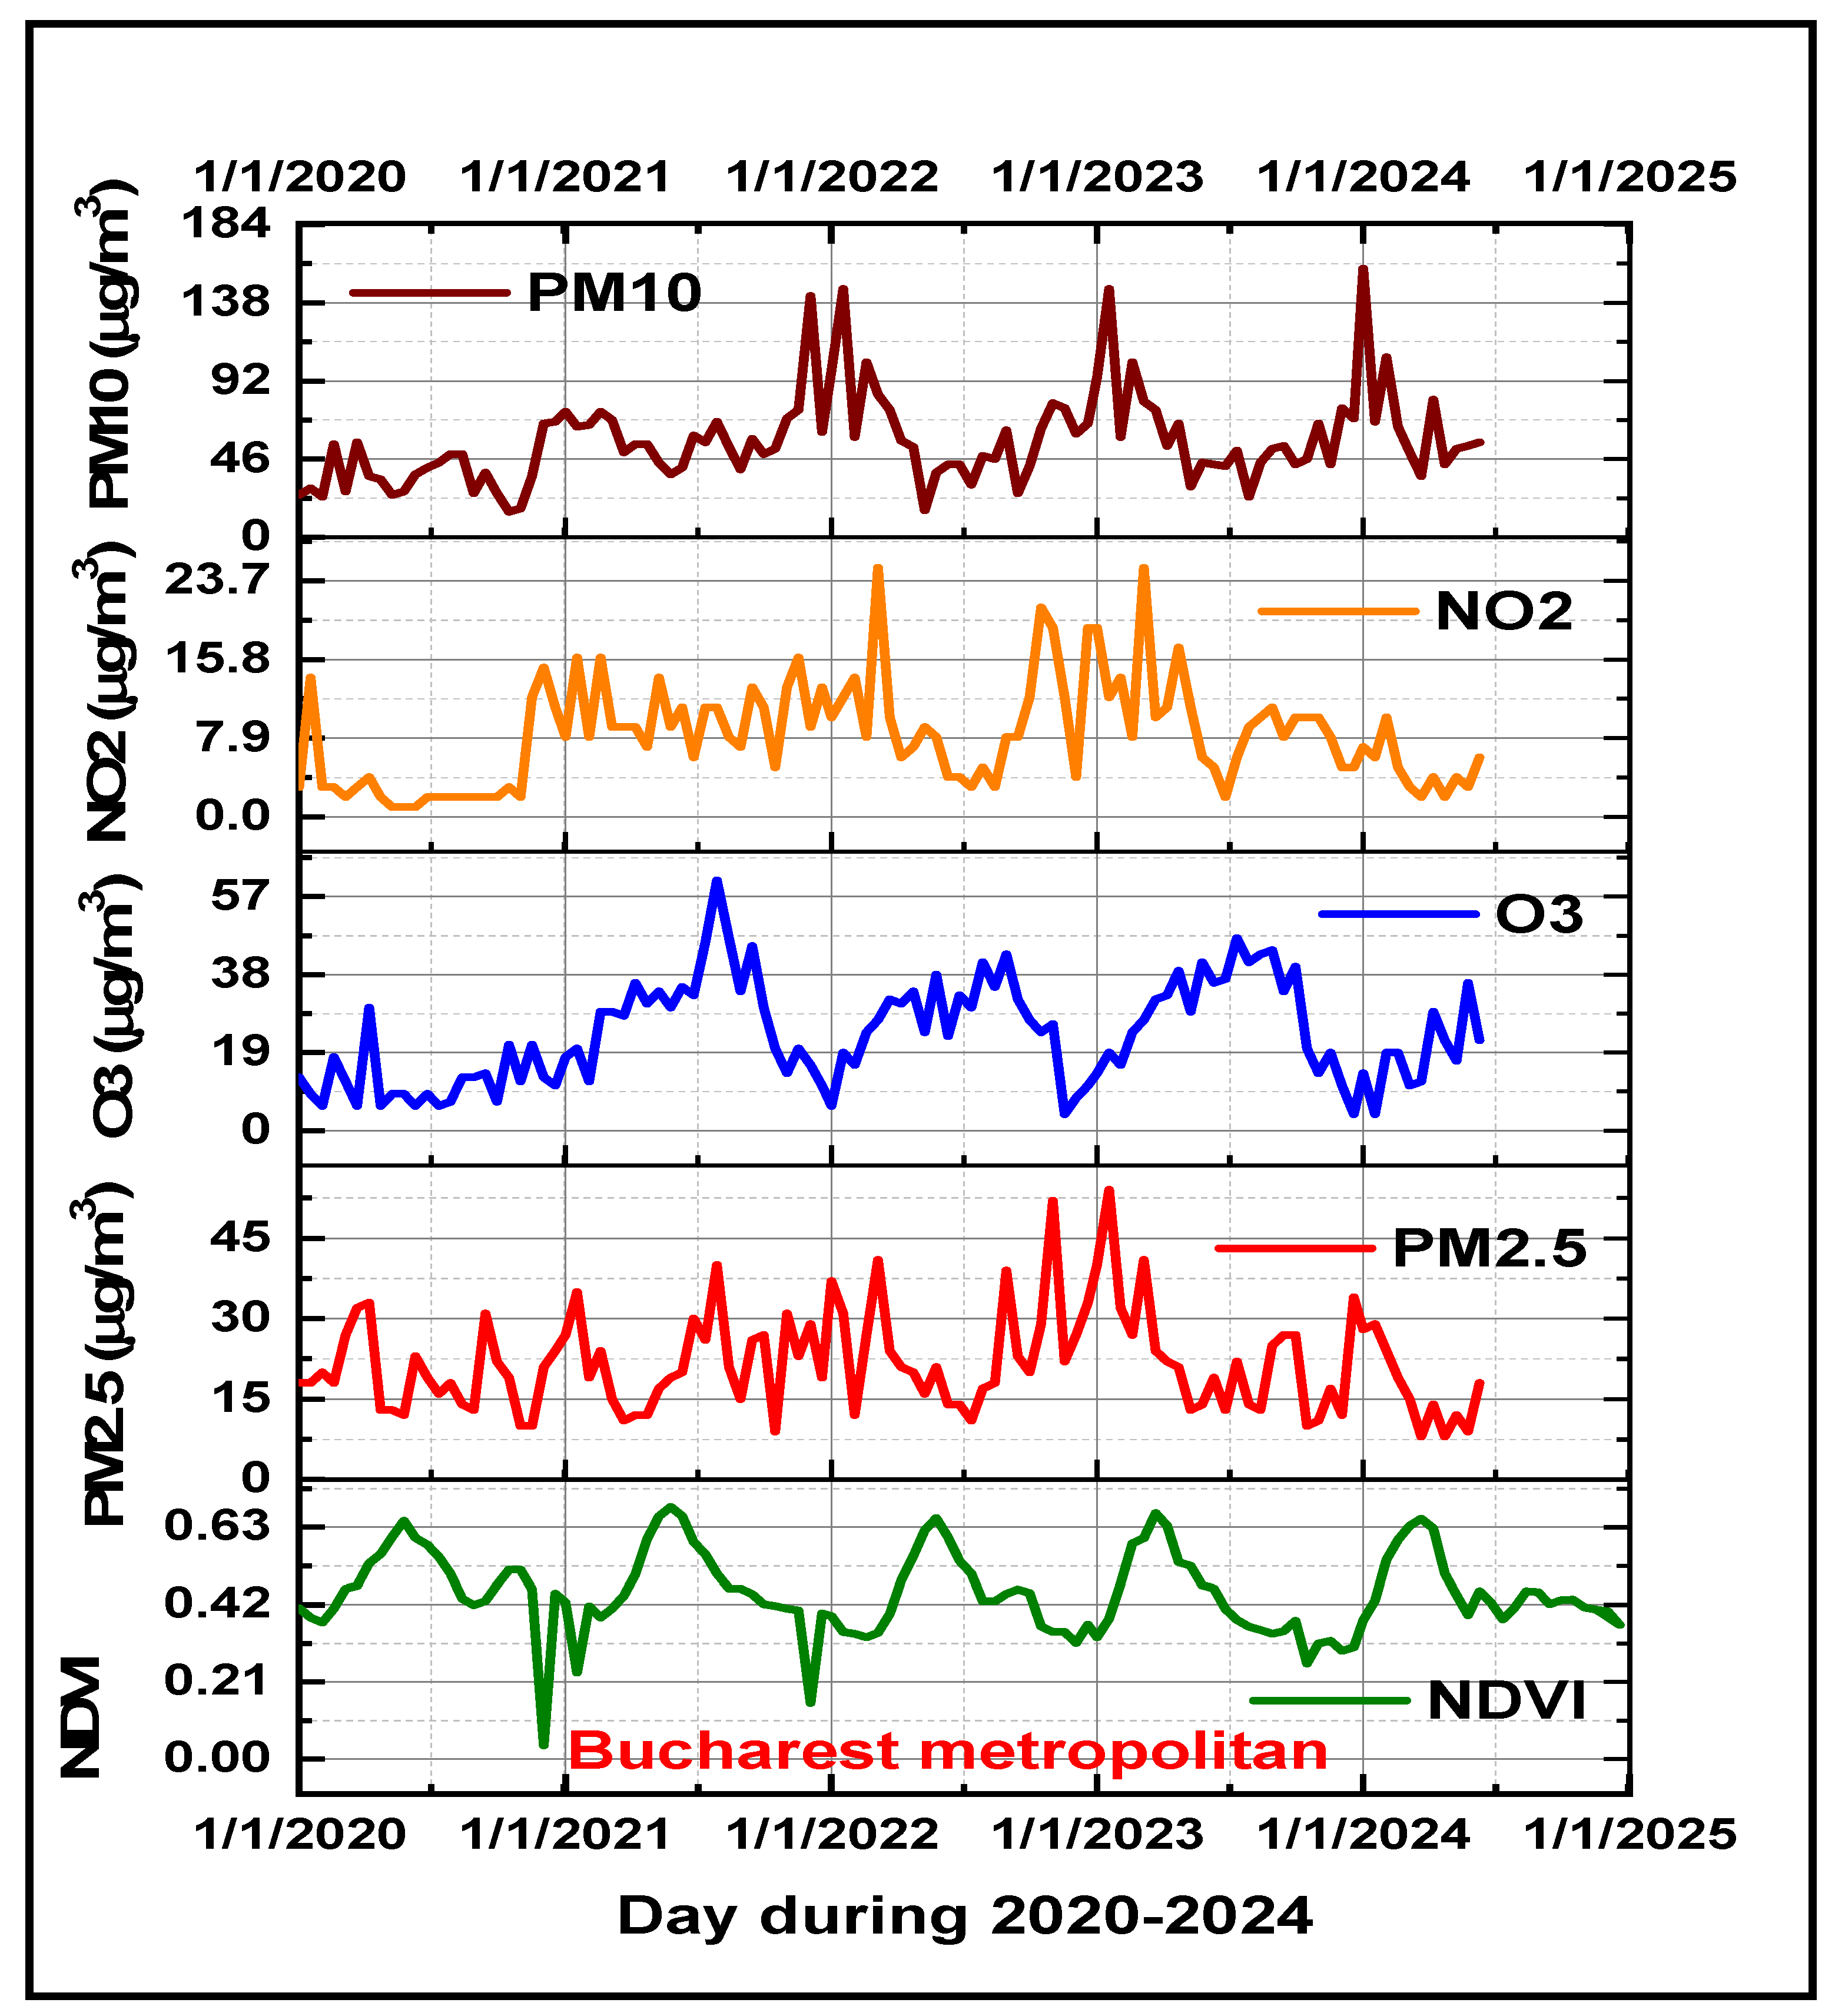
3.3. Impact of Air Pollution on Urban Vegetation

NDVI seasonality was analyzed in relation to ground-level air pollutants in the Bucharest city center and metropolitan area. Atmospheric pollution with particulate matter PM is mainly attributed to particles of different size fractions: ultrafine particles, PM0.1 (with a diameter < 0.1 µm); fine particles, PM2.5 (with a diameter < 0.25 µm); and coarse particles, PM10 (with 0.25 µm < diameter < 10 µm). It is considered the largest urban carbon emitter among all Romanian cities and one of the most air-polluted metropolises in Europe. This mainly resulted from the traffic-related use of old cars, extensive industrial activity, and the burning of fossil fuels and residual waste, characterized by higher PM2.5, PM10, NO2, O3, CO, and SO2 concentrations, which sometimes exceed the standard thresholds for Romania and the European Union.
During the entire analyzed period of 2020–2024, this study found that particulate matter of PM2.5 and PM10, together with the air pollutant gases nitrogen dioxide (NO2), sulfur dioxide (SO2), and carbon monoxide (CO) concentrations, are negatively correlated with the NDVI, with higher concentrations of air pollutants being associated with a decrease in vegetation health and production (Table 2). For the urban green growing season period in Bucharest (March–November) months, the NDVI shows a low negative correlation with ground-level ozone (r = −0.16; p > 0.01), while during the summer season (June–August), this correlation is significantly negative (r = −0.51, p < 0.01) for the Bucharest city center, and (r = −76; p < 0.01) for the metropolitan area. This finding may explain the degraded or devitalized vegetation under high levels of ozone.
According to the results in Table 2 for the entire analyzed period, including spring, summer, autumn, and winter seasons, the increased green space significantly decreases PM2.5, PM10, and gaseous air pollutant NO2, SO2, and CO concentrations, while a positive correlation coefficient of the NDVI with ground-level ozone (O3) was found. During the 2020–2024 investigation period, daily mean of air pollutants concentrations in Bucharest recorded the following values: PM2.5 (23.71 ± 7.63) µg/m3; PM10 (55.02 ± 25.76) µg/m3, O3 (23.72 ± 13.21) µg/m3; NO2 (8.19 ± 5.32) µg/m3; SO2 (7.29 ± 4.87) µg/m3; and CO (301.19 ± 126.12) µg/m3.
Particulate matter PM10 exceeds the daily limit threshold in Romania and the European Union, and other air pollutants are sometimes recorded at higher values above the norms. According to EU air quality standards, the daily PM2.5 limit is 25 µg/m3, the PM10 daily limit is 50 µg/m3, the NO2 and SO2 daily limit is 50 µg/m3, the CO daily limit is 4 mg/m3, and the O3 daily limit is 120 µg/m3 [62]. However, the study period partially overlapped with the COVID-19 pandemic viral disease in Bucharest, which may explain some registered lower values of air pollutant concentrations compared with previous years [63].
The findings of this research confirmed vegetation’s potential role in improving air quality through dry or wet deposition of air pollutants and retention, functioning as natural biofilters, being in line with previous research such as [64,65], which also considered vegetation’s role as a protective barrier against pollution dispersal. Broad-leaved forests provide the main dry deposition effects in urban space. In the case of PM, the main processes include deposition on the leaf surface, where it can be retained, washed off, or resuspended. For pollutant gases, uptake via stomata is the most prominent process [66]. NO2 is mainly deposited through stomatal uptake, and thus, stomatal conductance and its responses to environmental conditions are key factors.
Figure 3 illustrates the temporal patterns of NDVI and the main air pollutants concentrations in Bucharest between 2020 and 2024. These graphs show a seasonal distribution of vegetation index, inversely correlated with PM2.5, PM10, and NO2 air pollutant concentrations, and a direct correlation of the NDVI with ground-level O3.
On polluted days, air temperature was significantly negatively correlated with PM10 (r = −0.33; p < 0.01) and weakly negatively correlated with PM2.5 (r = −0,19; p < 0.05). On heat-stress days, the air temperature at a 2 m height was significantly negatively correlated with NO2 (r = −042; p < 0.01) and positively correlated with O3 (r = 0.39; p < 0.01). Overall, PM2.5 and PM10 concentrations decreased with increasing air temperature across both Bucharest center and metropolitan areas. This effect can be attributed to urban/periurban vegetation, which has an ecological function to reduce particulate matter concentrations via deposition and retention on the plants. These findings are consistent with other studies, which estimated air pollutants’ removal capacity by urban vegetation through several processes, such as adsorption, deposition, or the retention of plants, being affected by many factors such as leaf structure, tree height and canopy geometry, source location, and meteorological conditions [67,68].
This study considers that urban/periurban forests in the Bucharest metropolitan area play a significant role in mitigating air pollutants through retention, deposition, and dispersion processes. The efficiency of air pollutant removal depends on the particle size, ultrafine particles being removed via dispersion, whereas larger particles are likely to be retained by deposition [69,70]. Previous studies showed that mainly urban forests decreased PM concentrations by 0.2% to 26%, depending on plant characteristics, urban configuration, background concentrations, and environmental factors like precipitation, relative humidity, air temperature, and wind speed and direction. Green areas help improve air quality in large metropolitan regions, lowering PM2.5 and PM10 concentrations in areas with higher NDVI values. It was reported that a higher NDVI is linked to 50% lower PM levels compared with industrial and high-traffic areas [71,72]. Also, particularly during summer heat waves and under urban heat islands, air pollutants can exacerbate urban heat by increasing the greenhouse effect and altering atmospheric chemistry. Through absorption and re-radiating infrared radiation, air pollutants increase land surface temperatures and impact urban air quality, with a direct impact on the urban thermal environment and UHI intensity [73].

3.4. Impact of Climate on Normalized Difference Vegetation Indices

Like air pollution, climate conditions significantly affect the vegetation state in urban ecosystems. Due to the spatial heterogeneity of urban ecosystems, the vegetation responses to climate variability at the local and regional scales show diverse spatial and temporal patterns.
The NDVI is a globally used index to analyze the characteristics of vegetation land cover, including its dynamic spatiotemporal patterns, being a crucial parameter for examining vegetation stability and its complex interaction with climate and anthropogenic stressors.
The NDVI and other vegetation parameters respond to climate factors such as the air temperature, air relative humidity, precipitation rate, land surface temperature, land surface albedo, and planetary boundary layer heights. This study analyzed the spatiotemporal patterns of meteorological parameters with high impacts on urban/periurban vegetation. Also, vegetation feedbacks play a key role in climate regulation by cooling and humidifying processes of urban areas.

3.4.1. Air Temperature Impact on NDVI

During the summer hot seasons (June–August) in the 2020–2024 period, this research found negative Spearman correlations between the air temperature at a 2 m height, TA, and NDVI for both the Bucharest city center (r = −0.84; p < 0.01) and metropolitan scale (r = −0.90; p < 0.01), results that explained the cooling effect of large urban green spaces on the air temperature at a 2 m height.
During the entire investigated period, 2020–2024, including all seasons, this study found a seasonal pattern of TA distribution and an average TA value of (13.21 ± 9.6) °C in the range of −10.09–30.74 °C. As Table 3 shows, for the entire 2020–2024 period, the normalized vegetation index (NDVI) presented a positive Spearman rank correlation with the air temperature (TA) in both the central area of Bucharest (r = 0.85; p< 0.01) and at the metropolitan scale (r = 0.57; p< 0.01), explaining the effect of the heat island of the city center.
During the summer season (June–August) in 2020–2024, both NDVI correlations with TA turned to negative correlations, as follows: in the Bucharest central area (r = −0.47; p < 0.01) and metropolitan area (r = −0.52; p < 0.01).
The high rate of the urbanization process in Bucharest, which was significant during the last two decades, is responsible for the increased conversion rate of vegetated land cover to built-up areas both in the city center area, and in the metropolitan areas, with negative impacts on the thermal environment, biodiversity conservation and human health.

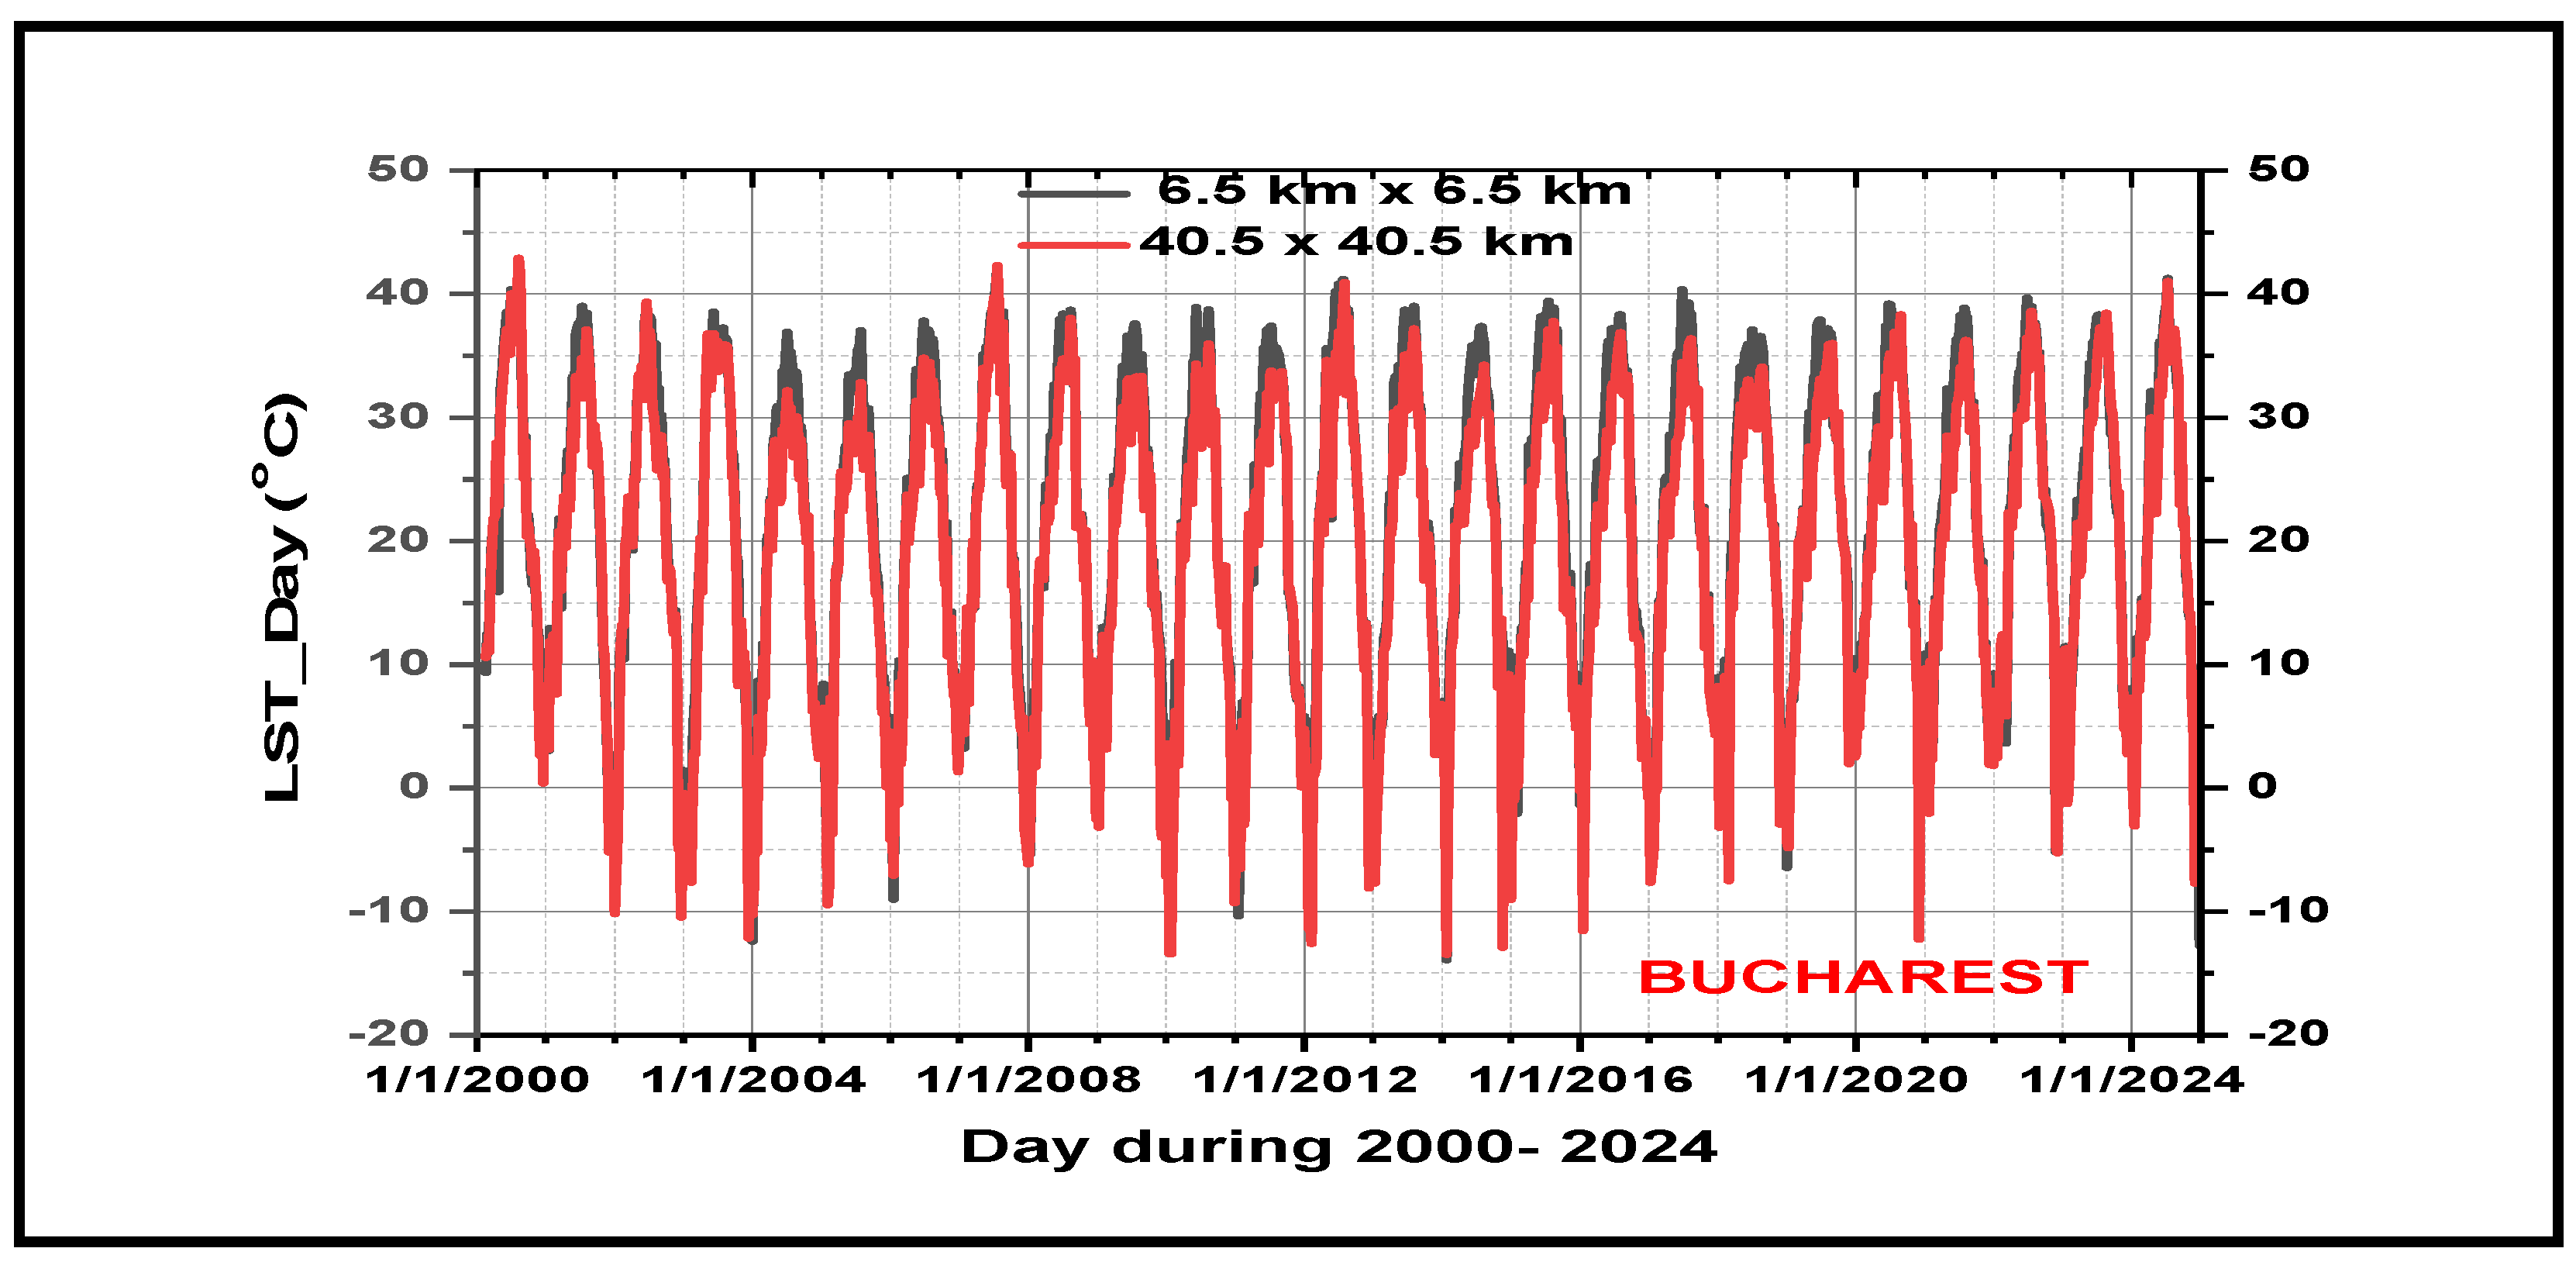
3.4.2. Land Surface Temperature’s Impact on NDVI

The vegetation parameters of the NDVIs are also crucial metrics for measuring the characteristics of urban surface vegetation land cover and are often used to describe land features and study the relationship between LST and surface greenness [74].
Like the air temperature at a 2 m height, TA, the land surface temperature has a seasonal variation, with higher values during summer and lowest values during winter seasons (Figure 4). However, the LST parameter did not show significant differences across seasons for the city center and metropolitan areas.
Due to various urban/periurban biomes and seasons during the 2020–2024 period, based on time series analysis of MODIS Terra satellite data, this study found different seasonal correlations between the land surface temperature (LST) and NDVI: in the spring months (March–May), the LST-NDVI presented the dominance of a significant positive Spearman correlation (r = 0.88, p < 0.01) for the city center, and (r = 0.65, p < 0.01) for the metropolitan area, while for autumn and winter seasons, LST showed positive correlations with the NDVI of (r = 0.44; p < 0.01) for the city center, and (r = 0.66 and p < 0.01) for the metropolitan area of Bucharest. During the hot summer seasons (June–August) in the 2020–2024 period, this study found negative correlations between the land surface temperature (LST) and the Normalized Difference Vegetation Index (NDVI) for Bucharest city center (r = −0.29; p < 0.01) and metropolitan area (r = −0.68, p < 0.01), results indicating that higher urban/periurban vegetation density with cooling effects is associated with lower land surface temperatures.
During the entire investigated period, 2020–2024, this study found an average LST value of 20.79 ± 12.26 °C in the range of −12.33–38.45 °C, with positive correlations between the LST and NDVI (Table 3). Our findings confirm the previous studies’ results, which considered that urban vegetation has a high impact on LST reduction in all seasons [75,76]. Some studies found that urban trees provide the highest contribution to heat stress decreasing during summer (66.8%) and autumn (65.7%), so urban planning through optimizing urban green infrastructure design and proper selection of vegetation types can significantly enhance urban air and land surface temperature, reducing UHI effects and improving urban ecological quality [77]. Some previous studies reported a greater impact of urban green morphology on LST than on air pollutants distribution at all scales [78].
There was a significant positive Spearman rank correlation between TA and LST_Day for both Bucharest center (r = 0.89; p < 0.01) and metropolitan area (r = 0.91; p < 0.01).
Because this study recorded a high correlation between LST_Day and LST_Night values for both test areas of Bucharest, with respective values for the city center (r = 0.94; p < 0.01), and metropolitan areas (r = 0.98; p < 0.01), this study will consider LST_Day as LST parameter for our analysis.

3.4.3. Land Surface Albedo Impact on NDVI

Another key parameter investigated in this research concerning vegetation conditions, land surface albedo (LSA), which depends on environmental and climatic factors, is described by the ratio between the solar radiation reflected from the land surface and the solar radiation falling on it. As can be seen in Table 3, for the entire investigated period 2020–2024, this study demonstrated an inverse correlation between the LSA and NDVI, explaining the crucial role of urban green in lowering land surface temperature, particularly in hot summers under heat waves.
This research highlights the cooling effects of urban green vegetation, which were consistent across the Bucharest metropolitan area, with an average cooling impact of −0.197 °C per increase of 0.014. However, urban vegetation cooling efficiency is a function of sunlight, the precipitation rate, and vegetation moisture content. Our findings are in good agreement with the results reported by other studies, which, based on multi-source remote sensing image data, quantified and analyzed the influencing factors of the cooling effect of urban green space and stability on both regional and patch scales, showing that a strong cooling effect on the surrounding environment increases with the land surface temperature [79,80].
An analysis of the thermal environment in big cities is very useful for designing and implementing healthy urban strategies and development. Because of the synergy of UHIs and HWs during hot summers, Bucharest urban center, with increased artificial built areas, experienced higher temperatures of 3.4 °C compared to the adjacent less urbanized periurban zones. The findings indicate the need to implement new urban green spaces, such as parks and green roofs, to mitigate urban heat island effects, especially during heat waves in the Bucharest metropolis, by providing shading and evaporative cooling.
Our results are in good agreement with other findings reported in several remote sensing studies [81,82].
The cooling capacity of urban vegetation, especially in the metropolitan area of Bucharest, was weak during heat wave-stressed summers of 2003, 2007, 2012, and 2022. The interaction between urban heat environments and air pollution is deeply interconnected, and it is crucial to investigate their synergistic effects. Also, elevated heat stress was associated with stagnant synoptic conditions, lower levels of planetary boundary layer heights PBL, and reduced wind speeds, which diminished air turbulent flux, lowering air pollutant dispersion and resulting in higher concentrations of CO, NO2, and SO2. So, urban green space, including all types of green structures and water bodies, creates cold islands which control urban microclimates through efficient UHI reduction and the mitigation of the hot summer urban thermal environment [83,84].
An analysis of land surface albedo dynamics in the Bucharest metropolitan area highlights a significant inverse relationship of LSA with the air temperature at a 2 m height, TA, which may explain the development of high-intensity summer urban heat islands [Figure 5]. Negative Spearman rank correlations were found between LST and LSA for both Bucharest center (r = −0.59; p < 0.01) and metropolitan area (r = −0.56; p < 0.01) during all seasons in the 2020–2023 period.

3.4.4. Solar Surface Irradiance’s Impact on NDVI

As can be seen in Figure 6, urban vegetation responds to the main atmospheric conditions, which include solar surface irradiance, air and land surface temperatures, showing similar trends.
During the entire investigated period, 2020–2024, including all seasons, this study found an average solar surface irradiance SI value of (217.67 ± 93.76) W/m2 in the range of (80.115–357.91) W/m2, with higher values during summer periods (337.29 ± 97.24) W/m2.
As Table 3 shows, for the entire investigated period 2020–2024, this study found a direct positive correlation between NDVI and SI, explaining the major role of solar radiation intensity in the increasing photosynthetic activity in plants, which correlates positively with radiation levels. Solar radiation shows the most significant impact on urban vegetation health. The results in this study are similarly coherent with previous studies’ findings, which support the hypothesis that, according to the function of latitude height, the photosynthetic activity in plants correlates positively with solar radiation levels, Bucharest being located at a mid-latitude height [85,86].

3.5. Climate Impact on Evapotranspiration

The main mechanisms by which urban green spaces contribute to cooling the urban thermal environment are evapotranspiration and shading, with urban trees standing out. Through energy consumption, transpiration reduces accumulated heat in the surrounding environment, while shading lowers air and land surface temperatures by blocking incoming solar radiation during the day, where the maximum efficiency of urban vegetation cooling effects is obtained for strong evapotranspiration rates and shading [87]. However, the cooling effects of urban vegetation differ between daytime and nighttime, when is significantly weakened [88]. Previous studies adopted different quantitative methods of measuring the cooling effect of urban green, which led to considerable differences in the results for cooling and humidifying effects in different types of urban green vegetation, like trees and herbaceous plant structures [89]. It was reported that mixed needle-broadleaf and evergreen broadleaf communities have the best cooling and humidifying effects [90]. Urban green cooling capacity and carbon uptake are weakened by drought, when urban decision makers must adopt sustainable water management measures to prevent the impact of drought on vegetation health [91].
Despite the fact that urban land surface temperature LST and air temperatures AT seem to be closely related and positively correlated with solar surface irradiance, SI, the results of this study show the different responses to urban vegetation evaporative conditions described by the evapotranspiration parameter ET. For summer (June–August) periods analyzed in the Bucharest metropolitan area during 2020–2024, this study found positive Spearman rank correlations between ET, climate parameters TA (r = 0.91; p < 0.01), SI (r = 0.91; p < 0.01), relative humidity RH (r = 0.65; p < 0.01), and the NDVI (r = 0.83; p < 0.01). A negative Spearman rank correlation was recorded between ET and LST (r = −0.92; p < 0.01). This finding explains the imprint of evapotranspiration in the diurnal variations of LST in contrast with air temperature. These results will be very useful to be considered in urban temperature data analysis and interpretation in climate change studies or land–atmosphere interactions. For the entire analyzed period, 2020–2024, Spearman rank correlation coefficients between LST and evapotranspiration, ET, present moderate positive values (r = 0.48; p < 0.01) for the Bucharest metropolis area. Also, per the entire analyzed period, ET recorded an average value of (9.91 ± 6.21) mm/year in the range of 2.06–28.24 mm/year. Figure 7 presents the temporal patterns of land surface temperature and evapotranspiration for the Bucharest metropolitan area during 2020–2024 from MODIS Terra data, emphasizing the decreasing trend of evapotranspiration and increasing trend of land surface temperature, attributed to urbanization, decrease in vegetation, and climate warming.
Our results are consistent with other studies’ findings, which considered that evapotranspiration changes are influenced by both human activities and climate change, with climate change being the primary driver [42,92,93,94]. The findings of this study are consistent with previous studies, showing that the land surface temperature anomalies associated with urbanization-induced climate warming, especially during strong summer heat waves and under urban heat islands, alter urban vegetation biophysical properties, directly impacting the land’s phenology patterns and shifts [95,96,97,98,99]. The quantitative findings of this study, in good accord with several previous studies [100,101,102,103], are of great importance for understanding the complex impacts of air pollution and climate change on vegetation health and for developing models to predict vegetation changes under future urbanization.

3.6. Impact of Climate on Leaf Area Index and Photosynthetically Active Radiation

The leaf area index (LAI) and photosynthetically active radiation (FPAR) indicators have been used to characterize the effects of climate parameters and urbanization impacts on vegetation health and their changes. The urban vegetation phenology in the leaf area index (LAI) is the primary driver of seasonal variation in FPAR, which drives photosynthesis. However, FPAR is widely used in remote sensing-based production models to estimate net primary production [82]. FPAR absorbed by vegetation is a key biophysical variable to monitor vegetation growth, productivity, and the energy balance of urban ecosystems. The results in Figure 8 show that the response of vegetation health to urbanization level and climate parameters variability has a distinct seasonal pattern across the 2000–2024 period in the Bucharest metropolitan area. Statistical analysis found positive significant correlations between land surface temperature, LST, and LAI (r = 0.69; p < 0.01) and FPAR (r = 0.72; p < 0.01) for the Bucharest metropolitan area. Like our study, recent studies have emphasized the effects of rising air and land surface temperatures as primary drivers on vegetation parameters, LAI, and FPAR seasonal trends, attributed to climate warming and urban land management [104,105].

3.7. Impact of Climate and Anthropogenic Changes on Vegetation Net Primary Production

Also, this study explored the vegetation carbon sequestration capacity of urban/periurban vegetation through yearly monitoring of Net Primary Production (NPP) changes in the Bucharest metropolitan area during the 2021–2024 period. This parameter, considered for urban vegetation health assessment, is a measure of the annual productivity of the vegetation land cover in the metropolitan area of Bucharest. MODIS NPP is a valuable indicator of productivity and health at large spatial scales. This variable expresses the net carbon gained by plant biomass, being measured yearly by the MODIS Terra MOD17A3HGF product in (g biomass or g C m−2 year−1). NPP refers to the amount of organic carbon accumulated per unit area per unit time after accounting for plant respiration and serves as a critical indicator for measuring the carbon sequestration capacity of vegetation. It is the balance between the carbon gained by gross primary production (GPP—i.e., net photosynthesis measured at the ecosystem scale) and carbon released by plant mitochondrial respiration, both expressed per unit land area [106].
Over the past 24 years, as Figure 9 shows, MODIS NPP_500 m has experienced fluctuating, rising, and stabilizing stages, associated with air pollution, climate variability, and other anthropogenic changes.
The lower values of NPP corresponded to hot summers of 2003, 2007, 2012, 2022, and 2023, associated with strong heat waves under urban heat islands in Bucharest [107].
This study found that the annual average NPP fluctuated around the multi-year average value of 0.488 ± 0.062 g C m−2 year−1, in the range of 0.387–0.584 g C m−2 year−1, during 2000–2024. The linear trend analysis shows a positive value (R2 = 0.346). However, urban green spaces in Bucharest effectively mitigated UHI and air pollution, emphasizing urban planning value. In addition, compared to natural ecosystems, the carbon cycle in urban ecosystems is significantly influenced by the effects of climate and anthropogenic changes, such as extreme weather events (heat waves, cold waves, droughts, floodings, and thunderstorms), which can alter vegetation growth patterns, decline in carbon sequestration capacity, and NPP [108].
Overall, this study highlights the complex interplay between air pollution in synergy with climate variability and urban vegetation health in the metropolitan area of Bucharest. Our analysis also identified the most influential environmental factors on vegetation health and the crucial role of urban vegetation in improving the urban thermal environment and air quality, offering insights for feature optimization and mitigation strategies of metropolitan vegetation health for people’s health safety. Vegetation can reduce air and land surface temperatures through shading, evapotranspiration, and the reduction in heat-absorbing surfaces. Through integrating natural vegetation systems (such as parks, green corridors, and urban forests) into urban environments, aiming to mitigate the negative impacts of air pollutants and extreme climate events, urban green spaces emerge as a sustainable solution to address these environmental challenges. These strategies are designed to enhance ecological resilience, improve air quality, and promote overall urban sustainability. However, there is an urgent need to increase the urban resilience of large towns towards climate change through large-scale greening to reduce hot summer temperatures under the synergy of urban heat islands and heat waves [109].

3.8. Study Limitations and Perspectives

Despite providing valuable insights into the impact of urban air pollution and climate variability on urban vegetation, this study has several limitations that underline the imperative need for a more complex approach. Our results might not be fully in line with those spatial and contextual variations. Second, we used MODIS Terra/Aqua coarse spatial resolution data, higher spatial resolutions like as Worldview-3 (WV-3) satellite imagery [40], or ESA Copernicus Sentinel-2 (for providing vegetation and soil land covers and emergency services), and Sentinel-5P (for providing timely data on a multitude of trace gases and aerosols affecting air quality and climate), being preferred in environmental studies to improve the information on urban greenness.
To improve the quantitative accuracy on the urban vegetation landcover, crucial in climate–vegetation interaction monitoring in both coarse and high-spatial-resolution satellite imagery when mixed pixels of vegetation, ground, water and buildings are present, it is necessary to use advanced spectral mixture analysis methods, like Discrete Anisotropic Radiative Transfer (DART) model (US-DART) unmixing models in the shortwave domain from mono- or multispectral remotely sensed images [110]. Also, to assess the cooling effects of urban vegetation during summer heat waves under islands, it is necessary to apply high-spatial-resolution TIR images for better retrieval of thermal parameters [111]. However, the finer temporal resolution of satellite imagery will be better for the monitoring of gradual, seasonal, and abrupt urban vegetation trends [112].
Also, air pollution data might be provided by local network stations monitoring for the individual green space approach. This study relies on a limited number of air quality monitoring data, which may not adequately represent the diversity of urban/periurban green environments in the Bucharest metropolis. Also, the spatial distribution of available meteorological in situ monitoring data constrains the ability to generalize findings across the entire city center and metropolitan areas. Air pollutants at ground vegetation or forest stand levels may differently impact the urban green cover capacity in mitigating air quality and extreme climate effects, which may depend on several other variables defined at the forest stand or agricultural vegetation levels, that have not been considered such as inventories, trees species, leaf size, and height [113]. To better quantify the impact of air pollutants and climate change on vegetation health, and using the removal capacity of urban green, it is necessary to conduct in situ measurements at the vegetation level using advanced multisensor techniques for validation of satellite data, as well as vegetation areas located in the non-polluted urban regions.

4. Conclusions

In conclusion, this paper contributes to the field of near-surface urban/periurban air pollutants and climate variability impacts on vegetation changes. Air pollution is a key factor affecting vegetation‘s health in metropolitan areas, where green spaces are directly affected by various sources of pollutants and anthropogenic changes, to which they exhibit numerous responses.
The data analysis from 2020 to 2024 reveals that during hot summer, the urban vegetation density has an essential role in decreasing the air temperature at a 2 m height and land surface temperature, and via this effect, urban heat island and heat wave intensity, as well as persistent air pollution hotspots, reducing the vulnerability to heat-related health risks.
This is the first study of its kind to be conducted for the Bucharest metropolitan area that highlights significant changes in urban vegetation in the last two decades. Compared to prior studies, this study is innovative in its scope, using the synergy of time series in situ and MODIS Terra/Aqua satellite data to assess the impact of air quality and climate changes on biophysical parameters of urban/periurban vegetation.
These findings contribute to a deeper understanding of the complex interactions among vegetation systems, climate change, and air pollution, issues that are crucial for mitigating climate change, improving air quality, and promoting the sustainable development of metropolitan systems. Given the potential effects of elevated concentrations of the main air pollutants in the lower atmosphere (PM2.5, PM10, O3, NO2, SO2, and CO) and high temperatures on plants, the present study explored the impact of these environmental factors on urban vegetation biophysical variables. The evaluation of the results presented in this study serves as a comprehensive reference for researchers in relevant fields, offering baselines for comparison, improvement, and further exploration of urban vegetation health and its feedback. Urban green systems are significantly affected by air pollution and climate change, while being key contributors to these environmental challenges.
The investigation of the air pollutants influences on urban vegetation both at local and regional scales, with other meteorological and biophysical variables in the Bucharest metropolitan area of Romania reveals a significant impact of air pollutants and climate variables on urban vegetation NDVI, LAI/FPAR, and NPP, contributing to our understanding of the environmental factors that influence vegetation’s health, important for adopting mitigation strategies. In the frame of increased urbanization and rapid climate warming, urban green infrastructure offers a sustainable solution, but effective implementation requires robust, data-driven strategies. These insights are crucial for developing urban climate adaptation strategies and informing sustainable metropolitan environmental management practices in the face of ongoing climatic changes.

Author Contributions

M.Z.: Conceptualization; Methodology, Supervision, Review and editing. Validation; D.S.: Methodology, Validation, Software. M.T.: Methodology, Writing. D.T.: Data processing. A.S.: Data processing. All authors have read and agreed to the published version of the manuscript.

Funding

This research received no external funding.

Institutional Review Board Statement

Not applicable.

Informed Consent Statement

This study did not require ethical approval.

Data Availability Statement

Data are contained within the article.

Acknowledgments

This study was supported by the Romanian Ministry of Education and Research, Research Development and Innovation Plan 2022–2027, CONTRACT PN 23 05 NUCLEU; We are very thankful for the NASA MODIS products and MERRA-2 derived meteorological and solar parameters product provided by the Copernicus Atmosphere Monitoring Service (CAMS).

Conflicts of Interest

The authors declare no conflicts of interest and consent to publish this paper.

References

  1. Jeong, A.; Lovison, G.; Bussalleu, A.; Cirach, M.; Dadvand, P.; de Hoogh, K.; Flexeder, C.; Hoek, G.; Imboden, M.; Karrasch, S.; et al. Lung function-associated exposome profile in the era of climate change: Pooled analysis of 8 population-based European cohorts within the EXPANSE project. Environ. Int. 2025, 196, 109269. [Google Scholar] [CrossRef]
  2. Kašpar, J.; Král, K.; Levanič, T.; Adamič, P.C.; Čater, M. Climate growth limitations of European beech and silver fir along the Carpathian arc—The recent state and future prospects. Agric. For. Meteorol. 2025, 361, 110323. [Google Scholar] [CrossRef]
  3. Biagi, B.; Brattich, E.; Cintoles, C.; Barbano, F.; Di Sabatino, S. Dynamical and chemical impacts of urban green areas on air pollution in a city environment. Urban Clim. 2025, 60, 102343. [Google Scholar] [CrossRef]
  4. Sharma, S.; Hussain, S.; Kumar, P.; Singh, A.N. Urban trees’ potential for regulatory services in the urban environment: An exploration of carbon sequestration. Environ. Monit. Assess. 2024, 196, 504. [Google Scholar] [CrossRef] [PubMed]
  5. Steinparzer, M.; Schaubmayr, J.; Godbold, D.L.; Rewald, B. Particulate matter accumulation by tree foliage is driven by leaf habit types, urbanization-and pollution levels. Environ. Pollut. 2023, 335, 122289. [Google Scholar] [CrossRef]
  6. Lopes, H.S.; Vidal, D.G.; Cherif, N.; Silva, L.; Remoaldo, P.C. Green infrastructure and its influence on urban heat island, heat risk, and air pollution: A case study of Porto (Portugal). J. Environ. Manag. 2025, 376, 124446. [Google Scholar] [CrossRef]
  7. Wang, C.; Jin, J.; Davies, C.; Chen, W.Y. Urban forests as nature-based solutions: A comprehensive overview of the national forest city action in China. Curr. For. Rep. 2024, 10, 119–132. [Google Scholar] [CrossRef]
  8. Chen, D.; Sun, W.; Shi, J.; Johnson, B.A.; Tan, M.L.; Pan, Q.; Li, W.; Yang, X.; Zhang, F. Utilizing GaoFen-2 derived urban green space information to predict local surface temperature. Urban For. Urban Green. 2024, 99, 128463. [Google Scholar] [CrossRef]
  9. Liu, Y.; Tang, G. Contradictory response of ozone and particulate matter concentrations to boundary layer meteorology. Environ. Pollut. 2024, 343, 123209. [Google Scholar] [CrossRef]
  10. Xiang, Y.; Zhang, T.; Liu, J.; Lv, L.; Dong, Y.; Chen, Z. Atmosphere boundary layer height and its effect on air pollutants in Beijing during winter heavy pollution. Atmos. Res. 2019, 215, 305–316. [Google Scholar] [CrossRef]
  11. Girotti, C.; Kowalski, L.F.; Silva, T.; Correia, E.; Shimomura, A.R.P.; Kurokawa, F.A.; Lopes, A. Air pollution Dynamics: The role of meteorological factors in PM10 concentration patterns across urban areas. City Environ. Interact. 2025, 25, 100184. [Google Scholar] [CrossRef]
  12. Chen, Y.; Chen, S.; Zhao, D.; Li, J.; Bi, H.; Lou, G.; Guan, Y. The role of boundary layer height in India on transboundary pollutions to the Tibetan Plateau. Sci. Total Environ. 2022, 837, 155816. [Google Scholar] [CrossRef] [PubMed]
  13. Buccolieri, R.; Santiago, J.-L.; Rivas, E.; Sáanchez, B. Reprint of: Review on urban tree modelling in CFD simulations: Aerodynamic, deposition and thermal effects. Urban For. Urban Green. 2019, 37, 56–64. [Google Scholar] [CrossRef]
  14. Santiago, J.-L.; Martilli, A.; Martin, F. On dry deposition modelling of atmospheric pollutants on vegetation at the microscale: Application to the impact of street vegetation on air quality. Bound.-Layer. Meteorol. 2017, 162, 451–474. [Google Scholar] [CrossRef]
  15. Mehmood, Z.; Yang, H.-H.; Awan, M.U.F.; Ahmed, U.; Hasnain, A.; Luqman, M.; Muhammad, S.; Sardar, A.A.; Chan, T.-Y.; Sharjeel, A. Effects of Air Pollution on Morphological, Biochemical, DNA, and Tolerance Ability of Roadside Plant Species. Sustainability 2024, 16, 3427. [Google Scholar] [CrossRef]
  16. Xu, X.; Zhang, Z.; Bao, L.; Mo, L.; Yu, X.; Fan, D.; Lun, X. Influence of rainfall duration and intensity on particulate matter removal from plant leaves. Sci. Total Environ. 2017, 609, 11–16. [Google Scholar] [CrossRef]
  17. Zhou, S.J.; Cong, L.; Liu, Y.; Xie, L.M.; Zhao, S.Q.; Zhang, Z.M. Rainfall intensity plays an important role in the removal of PM from the leaf surfaces. Ecol. Indic. 2021, 128, 107778. [Google Scholar] [CrossRef]
  18. Andrade, G.C.; Santana, B.V.N.; Rinaldi, M.C.S.; Ferreira, S.O.; da Silva, R.C.; da Silva, L.C. Leaf surface traits related to differential particle adsorption—A case study of two tropical legumes. Sci. Total Environ. 2022, 823, 153681. [Google Scholar] [CrossRef] [PubMed]
  19. Chen, L.; Liu, C.; Zhang, L.; Zou, R.; Zhang, Z. Variation in tree species ability to capture and retain airborne fine particulate matter (PM 2.5). Sci. Rep. 2017, 7, 3206. [Google Scholar]
  20. Chiam, Z.Y.; Song, X.P.; Lai, H.R.; Tan, H.T.W. Particulate matter mitigation via plants: Understanding complex relationships with leaf traits. Sci. Total Environ. 2019, 688, 398–408. [Google Scholar] [CrossRef]
  21. Corada, K.; Woodward, H.; Alaraj, H.; Collins, C.M.; de Nazelle, A. A systematic review of the leaf traits considered to contribute to removal of airborne particulate matter pollution in urban areas. Environ. Pollut. 2020, 269, 116104. [Google Scholar] [CrossRef] [PubMed]
  22. Delaria, E.R.; Place, B.K.; Liu, A.X.; Cohen, R.C. Laboratory measurements of stomatal NO2 deposition to native California trees and the role of forests in the NO cycle. Atmos. Chem. Phys. 2020, 20, 14023–14041. [Google Scholar] [CrossRef]
  23. Lee, J.K.; Woo, S.Y.; Kwak, M.J.; Park, S.H.; Kim, H.D.; Lim, Y.J.; Park, J.H.; Lee, K.A. Effects of elevated temperature and ozone in Brassica juncea L.: Growth, physiology, and ROS accumulation. Forests 2020, 11, 68. [Google Scholar] [CrossRef]
  24. Lindén, J.; Gustafsson, M.; Uddling, J.; Watne, Å.; Pleijel, H. Air pollution removal through deposition on urban vegetation: The importance of vegetation characteristics. Urban For. Urban Green. 2023, 81, 127843. [Google Scholar] [CrossRef]
  25. Redondo-Bermudez, M.D.; Gulenc, I.T.; Cameron, R.W.; Inkson, B.J. ‘Green barriers’ for air pollutant capture: Leaf micromorphology as a mechanism to explain plants capacity to capture particulate matter. Environ. Pollut. 2021, 288, 117809. [Google Scholar] [CrossRef]
  26. Xu, L.S.; Yan, Q.; Liu, L.W.; He, P.; Zhen, Z.L.; Duan, Y.H.; Jing, Y.D. Variations of particulate matter retention by foliage after wind and rain disturbance. Air Qual. Atmos. Health 2022, 15, 437–447. [Google Scholar] [CrossRef]
  27. Singh, S.; Pandey, B.; Roy, L.B.; Shekhar, S.; Singh, R.K. Tree responses to foliar dust deposition and gradient of air pollution around opencast coal mines of Jharia coalfield, India: Gas exchange, antioxidative potential and tolerance level. Environ. Sci. Pollut. Res. 2020, 28, 8637–8651. [Google Scholar] [CrossRef]
  28. Mukherjee, A.; Agrawal, M. Use of GLM approach to assess the responses of tropical trees to urban air pollution in relation to leaf functional traits and tree characteristics. Ecotoxicol. Environ. Saf. 2018, 152, 42–54. [Google Scholar] [CrossRef]
  29. You, H.N.; Kwak, M.J.; Je, S.M.; Lee, J.K.; Lim, Y.J.; Kim, H.; Park, S.; Jeong, S.G.; Choi, Y.S.; Woo, S.Y. Morpho-Physio-Biochemical Attributes of Roadside Trees as Potential Tools for Biomonitoring of Air Quality and Environmental Health in Urban Areas. Land 2021, 10, 236. [Google Scholar] [CrossRef]
  30. Yao, J.; Wu, S.; Cao, Y.; Wei, J.; Tang, X.; Hu, L.; Wu, J.; Yang, H.; Yang, J.; Ji, X. Dry deposition effect of urban green spaces on ambient particulate matter pollution in China. Sci. Total Environ. 2023, 900, 165830. [Google Scholar] [CrossRef]
  31. Gustafsson, M.; Lindén, J.; Johansson, E.M.M.; Watne, A.K.; Pleijel, H. Air pollution removal with urban greenery—Introducing the Vegetation Impact Dynamic Assessment model (VIDA). Atmos. Environ. 2024, 323, 120397. [Google Scholar] [CrossRef]
  32. Kwak, M.J.; Lee, J.K.; Park, S.; Kim, H.; Lim, Y.J.; Lee, K.A.; Son, J.A.; Oh, C.Y.; Kim, I.; Woo, S.Y. Surface-based analysis of leaf microstructures for adsorbing and retaining capability of airborne particulate matter in ten woody species. Forests 2020, 11, 946. [Google Scholar] [CrossRef]
  33. Batkhuyag, E.-U.; Lehmann, M.M.; Cherubini, P.; Ulziibat, B.; Soyol-Erdene, T.-O.; Schaub, M.; Saurer, M. Combination of multiple stable isotope and elemental analyses in urban trees reveals air pollution and climate change effects in Central Mongolia. Ecol. Indic. 2023, 154, 110719. [Google Scholar] [CrossRef]
  34. New EU Forest Strategy for 2030. 2022. Available online: https://www.europarl.europa.eu/RegData/etudes/ATAG/2022/698936/EPRS_ATA(2022)698936_EN.pdf (accessed on 2 March 2025).
  35. Environment European Commission. Degraded Ecosystems to Be Restored Across Europe as Nature Restoration Law Enters into Force. 2024. Available online: https://environment.ec.europa.eu/news/nature-restoration-law-enters-force-2024-08-15_en?prefLang&equals;ro (accessed on 10 March 2025).
  36. de Souza, A.; de Oliveira-Júnior, J.F.; Cardoso, K.R.A.; Gautam, S. Impact of vehicular emissions on ozone levels: A comprehensive study of nitric oxide and ozone interactions in urban areas. Geosyst. Geoenviron. 2025, 4, 100348. [Google Scholar] [CrossRef]
  37. Zoran, M.; Savastru, R.; Savastru, D.; Tautan, M.; Tenciu, D. Linkage between Airborne Particulate Matter and Viral Pandemic COVID-19 in Bucharest. Microorganisms 2023, 11, 2531. [Google Scholar] [CrossRef]
  38. Dușcu, D.-M.; Rîșnoveanu, G. Understanding visitor preferences: Perceived importance of anthropogenic and natural forest features in supplying cultural ecosystem services. For. Ecosyst. 2025, 13, 100306. [Google Scholar] [CrossRef]
  39. Mărmureanu, L.; Leca, Ş.; Pitar, D.; Pascu, I.; De Marco, A.; Sicard, P.; Chivulescu, Ş.; Dobre, A.C.; Badea, O. Estimation of plant pollution removal capacity based on intensive air quality measurements. Environ. Res. 2024, 261, 119703. [Google Scholar] [CrossRef]
  40. Araminienė, V.; Sicard, P.; Černiauskas, V.; Coulibaly, F.; Varnagirytė-Kabašinskienė, I. Estimation of air pollution removal capacity by urban vegetation from very high-resolution satellite images in Lithuania. Urban Clim. 2023, 51, 101594. [Google Scholar] [CrossRef]
  41. Ferrini, F.; Fini, A.; Mori, J.; Gori, A. Role of vegetation as a mitigating factor in the urban context. Sustainability 2020, 12, 4247. [Google Scholar] [CrossRef]
  42. Yao, M.; Smith, M.; Peng, C. Modelling the effects of vegetation and urban form on air quality in real urban environments: A systematic review of measurements, methods, and predictions. Urban For. Urban Green. 2025, 105, 128693. [Google Scholar] [CrossRef]
  43. National Institute of Statistics. INS Baze de Date Statistice. 2025. Available online: http://statistici.insse.ro:8077/tempo-online/#/pages/tables/insse-table (accessed on 10 March 2025).
  44. National Institute of Statistics. Available online: https://insse.ro/cms/ro/publicatii-statistice-in-format-electronic (accessed on 10 March 2025).
  45. Popescu, L.; Popescu, R.; Catalina, T. Indoor particle’s pollution in Bucharest, Romania. Toxics 2022, 10, 757. [Google Scholar] [CrossRef] [PubMed]
  46. AQICN. 2023. Available online: https://aqicn.org/city/ (accessed on 28 February 2025).
  47. MERRA. 2025. Available online: http://www.soda-pro.com/web-services/meteo-data/merra (accessed on 25 February 2025).
  48. Copernicus. 2025. Available online: https://cds.climate.copernicus.eu/ (accessed on 2 February 2025).
  49. GIOVANNI. 2025. Geospatial Interactive Online Visualization and Analysis Infrastructure GIOVANNI. Available online: https://giovanni.gsfc.nasa.gov/giovanni (accessed on 20 February 2025).
  50. NASA MODIS. Available online: https://modis.ornl.gov/ (accessed on 20 February 2025).
  51. Nour Eldeen, N.; Mao, K.; Yuan, Z.; Shen, X.; Xu, T.; Qin, Z. Analysis of the spatiotemporal change in land surface temperature for a long-term sequence in africa (2003–2017). Remote Sens. 2020, 12, 488–511. [Google Scholar] [CrossRef]
  52. Phan, T.N.; Kappas, M.; Nguyen, K.T.; Tran, T.P.; Tran, Q.V.; Emam, A.R. Evaluation of modis land surface temperature products for daily air surface temperature estimation in northwest Vietnam. Int. J. Remote Sens. 2019, 40, 5544–5562. [Google Scholar] [CrossRef]
  53. ORNL DAAC. MODIS and VIIRS Land Products Global Subsetting and Visualization Tool; ORNL DAAC: Oak Ridge, TN, USA, 2018. [Google Scholar] [CrossRef]
  54. Yoo, C.; Im, J.; Cho, D.; Yokoya, N.; Xia, J.; Bechtel, B. Estimation of all-weather 1 km MODIS land surface temperature for humid summer days. Remote Sens. 2020, 12, 1398. [Google Scholar] [CrossRef]
  55. de la Iglesia Martinez, A.; Labib, S.M. Demystifying normalized difference vegetation index (NDVI) for greenness exposure assessments and policy interventions in urban greening. Environ. Res. 2023, 220, 115155. [Google Scholar] [CrossRef] [PubMed]
  56. Al-Hameed, A.A.K. Spearman’s correlation coefficient in statistical analysis. Int. J. Nonlinear Anal. Appl. 2022, 13, 3249–3255. [Google Scholar]
  57. Copernicus Urban Atlas. Available online: https://land.copernicus.eu/local/urban-atlas/urban-atlas-2018 (accessed on 20 February 2025).
  58. Bacău, S.; Domingo, D.; Palka, G.; Pellissier, L.; Kienast, F. Integrating strategic planning intentions into land-change simulations: Designing and assessing scenarios for Bucharest. Sustain. Cities Soc. 2022, 76, 103446. [Google Scholar] [CrossRef]
  59. Eisfelder, C.; Asam, S.; Hirner, A.; Reiners, P.; Holzwarth, S.; Bachmann, M.; Gessner, U.; Dietz, A.; Huth, J.; Bachofer, F.; et al. Seasonal Vegetation Trends for Europe over 30 Years from a Novel Normalised Difference Vegetation Index (NDVI) Time-Series—The TIMELINE NDVI Product. Remote Sens. 2023, 15, 3616. [Google Scholar] [CrossRef]
  60. Prăvălie, R.; Sirodoev, I.; Nita, I.A.; Patriche, C.; Dumitraşcu, M.; Roşca, B.; Tişcovschi, A.; Bandoc, G.; Săvulescu, I.; Mănoiu, V.; et al. NDVI-based ecological dynamics of forest vegetation and its relationship to climate change in Romania during 1987–2018. Ecol. Indic. 2022, 136, 108629. [Google Scholar] [CrossRef]
  61. Klimavičius, L.; Rimkus, E.; Stonevičius, E.; Mačiulytė, V. Seasonality and long-term trends of NDVI values in different land use types in the eastern part of the Baltic Sea basin. Oceanologia 2023, 65, 171–181. [Google Scholar] [CrossRef]
  62. Beloconi, A.; Vounatsou, P. Revised EU and WHO air quality thresholds: Where does Europe stand? Atmos. Environ. 2023, 314, 120110. [Google Scholar] [CrossRef]
  63. Zoran, M.; Savastru, R.; Savastru, D.; Tautan, M. Impacts of exposure to air pollution, radon, and climate drivers on the COVID-19 pandemic in Bucharest, Romania: A time series study. Environ. Res. 2022, 212, 113437. [Google Scholar] [CrossRef] [PubMed]
  64. Yang, W.; Lin, W.; Li, Y.; Shi, Y.; Xiong, Y. Estimating the seasonal and spatial variation of urban vegetation’s PM2.5 removal capacity. Environ. Pollut. 2025, 369, 125800. [Google Scholar] [CrossRef] [PubMed]
  65. Islam, A.; Pattnaik, N.; Moula, M.M.; Rötzer, T.; Pauleit, S.; Rahman, M.A. Impact of urban green spaces on air quality: A study of PM10 reduction across diverse climates. Sci. Total Environ. 2024, 955, 176770. [Google Scholar] [CrossRef]
  66. Sohrab, S.; Csikos, N.; Szilassi, P. Effects of land use patterns on PM10 concentrations in urban and suburban areas. A European scale analysis. Atmos. Pollut. Res. 2023, 14, 101942. [Google Scholar] [CrossRef]
  67. Yao, L.; Li, T.; Xu, M.; Xu, Y. How the landscape features of urban green space impact seasonal land surface temperatures at a city-block-scale: An urban heat island study in Beijing, China. Urban For. Urban Green. 2020, 52, 126704. [Google Scholar] [CrossRef]
  68. Vigevani, I.; Corsini, D.; Comin, S.; Fini, A.; Ferrini, F. Methods to quantify particle air 361 pollution removal by urban vegetation: A review. Atmos. Environ. X 2023, 21, 100233. [Google Scholar] [CrossRef]
  69. Chen, D.; Yan, J.; Sun, N.; Sun, W.; Zhang, W.; Long, Y.; Yin, S. Selective capture of PM2.5 by urban trees: The role of leaf wax composition and physiological traits in air quality enhancement. J. Hazard. Mater. 2024, 478, 135428. [Google Scholar] [CrossRef] [PubMed]
  70. Sheng, Q.; Zhang, C.; Huang, Y.; Jia, C.; Liu, C.; Dai, A.; Zhu, Z.; Huang, Z. The mediating effect of microclimate in the impacts of roadside vegetation barriers on air pollution in pedestrian spaces. Build. Environ. 2025, 279, 113052. [Google Scholar] [CrossRef]
  71. Oliveira, M.C.Q.D.; de Miranda, R.M.; de Fátima Andrade, M.; Kumar, P. Impact of urban green areas on air quality: An integrated analysis in the metropolitan area of São Paulo. Environ. Pollut. 2025, 372, 126082. [Google Scholar] [CrossRef]
  72. Cichowicz, R.; Bochenek, A.D. Assessing the effects of urban heat islands and air pollution on human quality of life. Anthropocene 2024, 46, 100433. [Google Scholar] [CrossRef]
  73. Zhang, Y.; Ge, J.; Wang, S.; Dong, C. Optimizing urban green space configurations for enhanced heat island mitigation: A geographically weighted machine learning approach. Sustain. Cities Soc. 2025, 119, 106087. [Google Scholar] [CrossRef]
  74. Han, L.; Zhang, R.; Wang, J.; Cao, S.J. Spatial synergistic effect of urban green space ecosystem on air pollution and heat island effect. Urban Clim. 2024, 55, 101940. [Google Scholar] [CrossRef]
  75. Sun, X.; Fang, P.; Huang, S.; Liang, Y.; Zhang, J.; Wang, J. Impact of urban green space morphology and vegetation composition on seasonal land surface temperature: A case study of Beijing’s urban core. Urban Clim. 2025, 60, 102367. [Google Scholar] [CrossRef]
  76. Zhang, J.; Hong, S.; Chen, B.; Wu, S. Multiscale synergistic effects of urban green space morphology on heat-pollution: A case study of Guangdong-Hong Kong-Macao Greater Bay Area, China. Ecol. Indic. 2025, 173, 113390. [Google Scholar] [CrossRef]
  77. Smith, I.A.; Fabian, M.P.; Hutyra, L.R. Urban green space and albedo impacts on surface temperature across seven United States cities. Sci. Total Environ. 2023, 857, 159663. [Google Scholar] [CrossRef]
  78. Arunab, K.S.; Mathew, A. Quantifying urban heat island and pollutant nexus: A novel geospatial approach. Sustain. Cities Soc. 2024, 101, 105117. [Google Scholar] [CrossRef]
  79. Ngarambe, J.; Joen, S.J.; Han, C.H.; Yun, G.Y. Exploring the relationship between particulate matter, CO, SO2, NO2, O3 and urban heat island in Seoul, Korea. J. Hazard. Mater. 2021, 403, 123615. [Google Scholar] [CrossRef]
  80. Yu, H.; Piao, Y. The Cooling Effect and Its Stability in Urban Green Space in the Context of Global Warming: A Case Study of Changchun, China. Sustainability 2025, 17, 2590. [Google Scholar] [CrossRef]
  81. Beele, E.; Aerts, R.; Reyniers, M.; Somers, B. Spatial configuration of green space matters: Associations between urban land cover and air temperature. Landsc. Urban Plan. 2024, 249, 105121. [Google Scholar] [CrossRef]
  82. Liang, S.; Ma, W.; Sui, X.; Wang, M.; Li, H. An Assessment of Relations between Vegetation Green FPARandVegetation Indices through a Radiative Transfer Model. Plants 2023, 12, 1927. [Google Scholar] [CrossRef] [PubMed]
  83. Wang, A.; Wang, J.; Zhang, R.; Cao, S.-J. Mitigating urban heat and air pollution considering green and transportation infrastructure. Transp. Res. Part A Policy Pract. 2024, 184, 104079. [Google Scholar] [CrossRef]
  84. Klopfer, F. The thermal performance of urban form—An analysis on urban structure types in Berlin. Appl. Geogr. 2023, 152, 102890. [Google Scholar] [CrossRef]
  85. Tuoku, L.; Wu, Z.; Men, B. Impacts of climate factors and human activities on NDVI change in China. Ecol. Inform. 2024, 81, 102555. [Google Scholar] [CrossRef]
  86. Dash, S.; Maity, R. Association between hydroclimatic factors and vegetation health: Impact of climate change in the past and future. Sci. Total Environ. 2025, 964, 178605. [Google Scholar] [CrossRef]
  87. Huang, Q.; Xu, C.; Haase, D.; Teng, Y.; Su, M.; Yang, Z. Heterogeneous effects of the availability and spatial configuration of urban green spaces on their cooling effects in China. Environ. Int. 2024, 183, 108385. [Google Scholar] [CrossRef]
  88. Yu, L.; Liu, Y.; Li, X.; Yan, F.; Lyne, V.; Liu, T. Vegetation-induced asymmetric diurnal land surface temperatures changes across global climate zones. Sci. Total Environ. 2023, 896, 165255. [Google Scholar] [CrossRef] [PubMed]
  89. Zhou, W.; Yu, Y.; Zhang, S.; Xu, J.; Wu, T. Methods for quantifying the cooling effect of urban green spaces using remote sensing: A comparative study. Landsc. Urban Plan. 2025, 256, 105289. [Google Scholar] [CrossRef]
  90. Sheng, Q.; Ji, Y.; Jia, C.; Jiang, L.; Li, C.; Huang, Z.; Ma, C.; Zhang, X.; Chen, H.; Wang, T.; et al. Differential effects of cooling and humidification in urban green spaces and thresholds of vegetation community structure parameters: A case study of the Yangtze River Delta region. Cities 2025, 159, 105765. [Google Scholar] [CrossRef]
  91. Guidolotti, G.; Zenone, T.; Endreny, T.; Pace, R.; Ciolfi, M.; Mattioni, M.; Pallozzi, E.; Rezaie, N.; Bertolini, T.; Corradi, C.; et al. Impact of drought on cooling capacity and carbon sequestration in urban green area. Urban Clim. 2025, 59, 102244. [Google Scholar] [CrossRef]
  92. Ma, J.; Wang, S.; Chen, G.C.; Zhu, S.; Wang, P.; Chen, J.; Zhang, H. Estimating emissions of biogenic volatile organic compounds from urban green spaces and their contributions to secondary pollution. Environ. Sci. Atmos. 2024, 5, 129–141. [Google Scholar] [CrossRef]
  93. Anees, S.A.; Mehmood, K.; Rehman, A.; Rehman, N.U.; Muhammad, S.; Shahzad, F.; Hussain, K.; Luo, M.; Alarfaj, A.A.; Alharbi, S.A.; et al. Unveiling fractional vegetation cover dynamics: A spatiotemporal analysis using MODIS NDVI and machine learning. Environ. Sustain. Indic. 2024, 24, 100485. [Google Scholar] [CrossRef]
  94. Mehmood, K.; Anees, S.A.; Muhammad, S.; Hussain, K.; Shahzad, F.; Liu, Q.; Ansari, M.J.; Alharbi, S.A.; Khan, W.R. Analyzing vegetation health dynamics across seasons and regions through NDVI and climatic variables. Sci. Rep. 2024, 14, 11775. [Google Scholar] [CrossRef]
  95. Guo, J.; Fan, L.; Feng, P.; Sun, X.; Xue, S. Response of vegetation evapotranspiration to landscape pattern changes in an arid region: A case study of the Loess Plateau, China. CATENA 2025, 252, 108878. [Google Scholar] [CrossRef]
  96. Lin, G.; Zhao, H.; Chi, Y. A comprehensive evaluation of deep learning approaches for ground-level ozone prediction across different regions. Ecol. Inform. 2025, 86, 103024. [Google Scholar] [CrossRef]
  97. Motlagh, O.R.K.; Darand, M. Identification of the Driving factors impacts of Land Surface Albedo over Iran: An analysis with the MODIS data. J. Atmos. Sol.-Terr. Phys. 2024, 265, 106378. [Google Scholar] [CrossRef]
  98. Chen, S.; Huang, Y.; Gao, S.; Wang, G. Impact of physiological and phenological change on carbon uptake on the Tibetan Plateau revealed through GPP estimation based on spaceborne solar-induced fluorescence. Sci. Total Environ. 2019, 663, 45–59. [Google Scholar] [CrossRef]
  99. Wang, A.; Ren, C.; Wang, J.; Feng, Z.; Kumar, P.; Haghighat, F.; Cao, S.J. Health assessment and mitigating solutions to heat-pollution induced by urban traffic. J. Clean. Prod. 2024, 434, 140097. [Google Scholar] [CrossRef]
  100. Li, Z.; Zhang, H.; Juan, Y.H.; Lee, Y.T.; Wen, C.Y.; Yang, A.S. Effects of urban tree planting on thermal comfort and air quality in the street canyon in a subtropical climate. Sustain. Cities Soc. 2023, 91, 104334. [Google Scholar] [CrossRef]
  101. Cao, W.; Zhou, W.; Yu, W.; Wu, T. Combined effects of urban forests on land surface temperature and PM2.5 pollution in the winter and summer. Sustain. Cities Soc. 2024, 104, 105309. [Google Scholar] [CrossRef]
  102. Azizi, S.; Azizi, T. Urban Climate Dynamics: Analyzing the Impact of Green Cover and Air Pollution on Land Surface Temperature—A Comparative Study Across Chicago, San Francisco, and Phoenix, USA. Atmosphere 2024, 15, 917. [Google Scholar] [CrossRef]
  103. Liang, S.; Xu, D.; Luo, D.; Xiao, A.; Yuan, X. Study on the Impact of Land Use and Climate Change on the Spatiotemporal Evolution of Vegetation Cover in Chongqing, China. Atmosphere 2025, 16, 25. [Google Scholar] [CrossRef]
  104. Zhu, L.; Chen, T.; Chen, X.; Liu, S.; Zhou, S.; Wang, S.; Li, W. Investigation of the Key Drivers of Vegetation Change Based on a Paired Land Use Experiment Approach—A Case Study of the Emin River Transboundary Basin. Land 2025, 14, 437. [Google Scholar] [CrossRef]
  105. Tao, Y.; Peng, N.; Fan, W.; Mu, X.; Letu, H.; Ma, R.; Yang, S.; He, Q.; Zhai, D.; Ren, H. High spatiotemporal resolution vegetation FAPAR estimation from Sentinel-2 based on the spectral invariant theory. Sci. Remote Sens. 2025, 11, 100207. [Google Scholar] [CrossRef]
  106. Li, Y.; Huang, S.; Fang, P.; Liang, Y.; Wang, J. Human activity’s impact on urban vegetation in China during the COVID-19 lockdown: An atypical anthropogenic disturbance. iScience 2025, 28, 4112195. [Google Scholar] [CrossRef] [PubMed]
  107. Savastru, D.; Zoran, M.; Savastru, R.; Tautan, M.; Tenciu, V. Effects of Climate Change and Urbanization on Vegetation Phenology in the Bucharest Metropolitan Area. WSEAS Trans. Environ. Dev. 2023, 19, 961–968. [Google Scholar] [CrossRef]
  108. Wang, J.; Shao, Z.; Fu, P.; Zhuang, Q.; Chang, J.; Jing, P.; Zhao, Z.; Xu, Z.; Wang, S.; Yang, F. Unraveling the impact of urban expansion on vegetation carbon sequestration capacity: A case study of the Yangtze River Economic Belt. Sustain. Cities Soc. 2025, 120, 106157. [Google Scholar] [CrossRef]
  109. Bügelmayer-Blaschek, M.; Züger, J.; Tötzer, T. Assessing the potential of urban wide greening for climate-resilience: The example of Vienna. Sustain. Futures 2025, 9, 100532. [Google Scholar] [CrossRef]
  110. Zhen, Z.; Chen, S.; Lauret, N.; Kallel, A.; Chavanon, E.; Yin, T.; León-Tavares, J.; Cao, B.; Guilleux, J.; Gastellu-Etchegorry, J.-P. A gradient-based 3D nonlinear spectral model for providing components optical properties of mixed pixels in shortwave urban images. Remote Sens. Environ. 2025, 321, 114657. [Google Scholar] [CrossRef]
  111. Chen, S.; Ren, H.; Ye, X.; Dong, J.; Zheng, Y. Geometry and adjacency effects in urban land surface temperature retrieval from high-spatial-resolution thermal infrared images. Remote Sens. Environ. 2021, 262, 112518. [Google Scholar] [CrossRef]
  112. Darabi, H.; Haghighi, A.T.; Klöve, B.; Luoto, M. Remote sensing of vegetation trends: A review of methodological choices and sources of uncertainty. Remote Sens. Appl. Soc. Environ. 2025, 37, 101500. [Google Scholar] [CrossRef]
  113. Manzini, J.; Hoshika, Y.; Carrari, E.; Sicard, P.; Watanabe, M.; Tanaka, R.; Badea, O.; Nicese, F.P.; Ferrini, F.; Paoletti, E. FlorTree: A unifying modelling framework for estimating the species-specific pollution removal by individual trees and shrubs. Urban For. Urban Green. 2023, 85, 127967. [Google Scholar] [CrossRef]
Figure 1. Bucharest city in the metropolitan test area.
Atmosphere 16 00553 g001
Figure 2. Spatiotemporal patterns of NDVI in Bucharest city center and metropolitan areas are defined by surfaces 6.5 km × 6.5 km, and, respectively, 40.5 km × 40.5 km.
Atmosphere 16 00553 g002
Figure 3. Temporal variation of MODIS Terra NDVI and daily average PM2.5, PM10, O3, and NO2 concentrations in Bucharest during the 2020 and 2024 period.
Atmosphere 16 00553 g003
Figure 4. Temporal patterns of MODIS Terra LST_Day for Bucharest center (6.5 km × 6.5 km) and metropolitan (40.5 km × 40.5 km) areas during the 2020 and 2024 period.
Atmosphere 16 00553 g004
Figure 5. Temporal patterns of MODIS LSA DVI and daily average air temperature, TA, in Bucharest.
Atmosphere 16 00553 g005
Figure 6. Temporal variation of MODIS Terra NDVI center/metropolitan areas and daily average air temperature, TA; land surface temperature, LST; and solar surface irradiance, SI, in Bucharest during the 2020 and 2024 period.
Atmosphere 16 00553 g006
Figure 7. Temporal variation of MODIS Terra land surface temperature, LST, and evapotranspiration, ET, during the 2021 and 2024 period.
Atmosphere 16 00553 g007
Figure 8. Temporal variation of MODIS Terra Leaf Area Index (LAI), photosynthetically active radiation (FPAR), and land surface temperature (LST) in Bucharest during the 2020 and 2024 period.
Atmosphere 16 00553 g008
Figure 9. Temporal variation of Net Primary Production of metropolitan Bucharest area derived from MODIS NPP_500 m time series data.
Atmosphere 16 00553 g009
Table 1. Urban expansion of Bucharest metropolitan area during 2012–2018, according to Copernicus Urban Atlas.
Decrease of Agricultural AreasLoss of Natural AreasLoss of Wetlands/WaterLoss of Artificial AreaOther Changes
71.9%1.3%1.3%12.3%13.5%
Table 2. Spearman correlation coefficients between NDVI in Bucharest central city/metropolitan area and air pollutants for the entire analyzed period, 2020–2024, including all seasons.
NDVIPM2.5PM10O3NO2SO2CO
NDVI Bucharest
Center area
(6.5 km × 6.5 km)
r = −0.29
p < 0.01
r = −0.58
p < 0.01
r = 0.71
p < 0.01
r = −0.47
p < 0.01
r = −0.49
p < 0.01
r = −0.61
p < 0.01
NDVI Bucharest metropolitan area
(40.5 km × 40.5 km)
r = −0.39
p < 0.01
r = −0.56
p < 0.01
r = 0.69
p < 0.01
r = −0.52
p < 0.01
r = −0.47
p < 0.01
r = −0.49
p < 0.01
Table 3. Spearman correlation coefficients between NDVI in Bucharest center city/metropolitan area and climate parameters for the entire analyzed period, 2020–2024, including all seasons.
NDVITA
(°C)
RH
(%)
PBL
(m)
LST
(°C)
LSASI
(W/m2)
NDVI Bucharest
Center area
(6.5 km × 6.5 km)
r = 0.85
p < 0.01
r = −0.68
p < 0.01
r = 0.72
p < 0.01
r = 0.88
p < 0.01
r = −0.56
p < 0.01
r = 0.82
p < 0.01
NDVI Bucharest
metropolitan area
(40.5 km × 40.5 km)
r = 0.57
p < 0.01
r = −0.45
p < 0.01
r = 0.64
p < 0.01
r = 0.65
p < 0.01
r = −0.36
p < 0.01
r = 0.65
p < 0.01
Disclaimer/Publisher’s Note: The statements, opinions and data contained in all publications are solely those of the individual author(s) and contributor(s) and not of MDPI and/or the editor(s). MDPI and/or the editor(s) disclaim responsibility for any injury to people or property resulting from any ideas, methods, instructions or products referred to in the content.

