1. Introduction
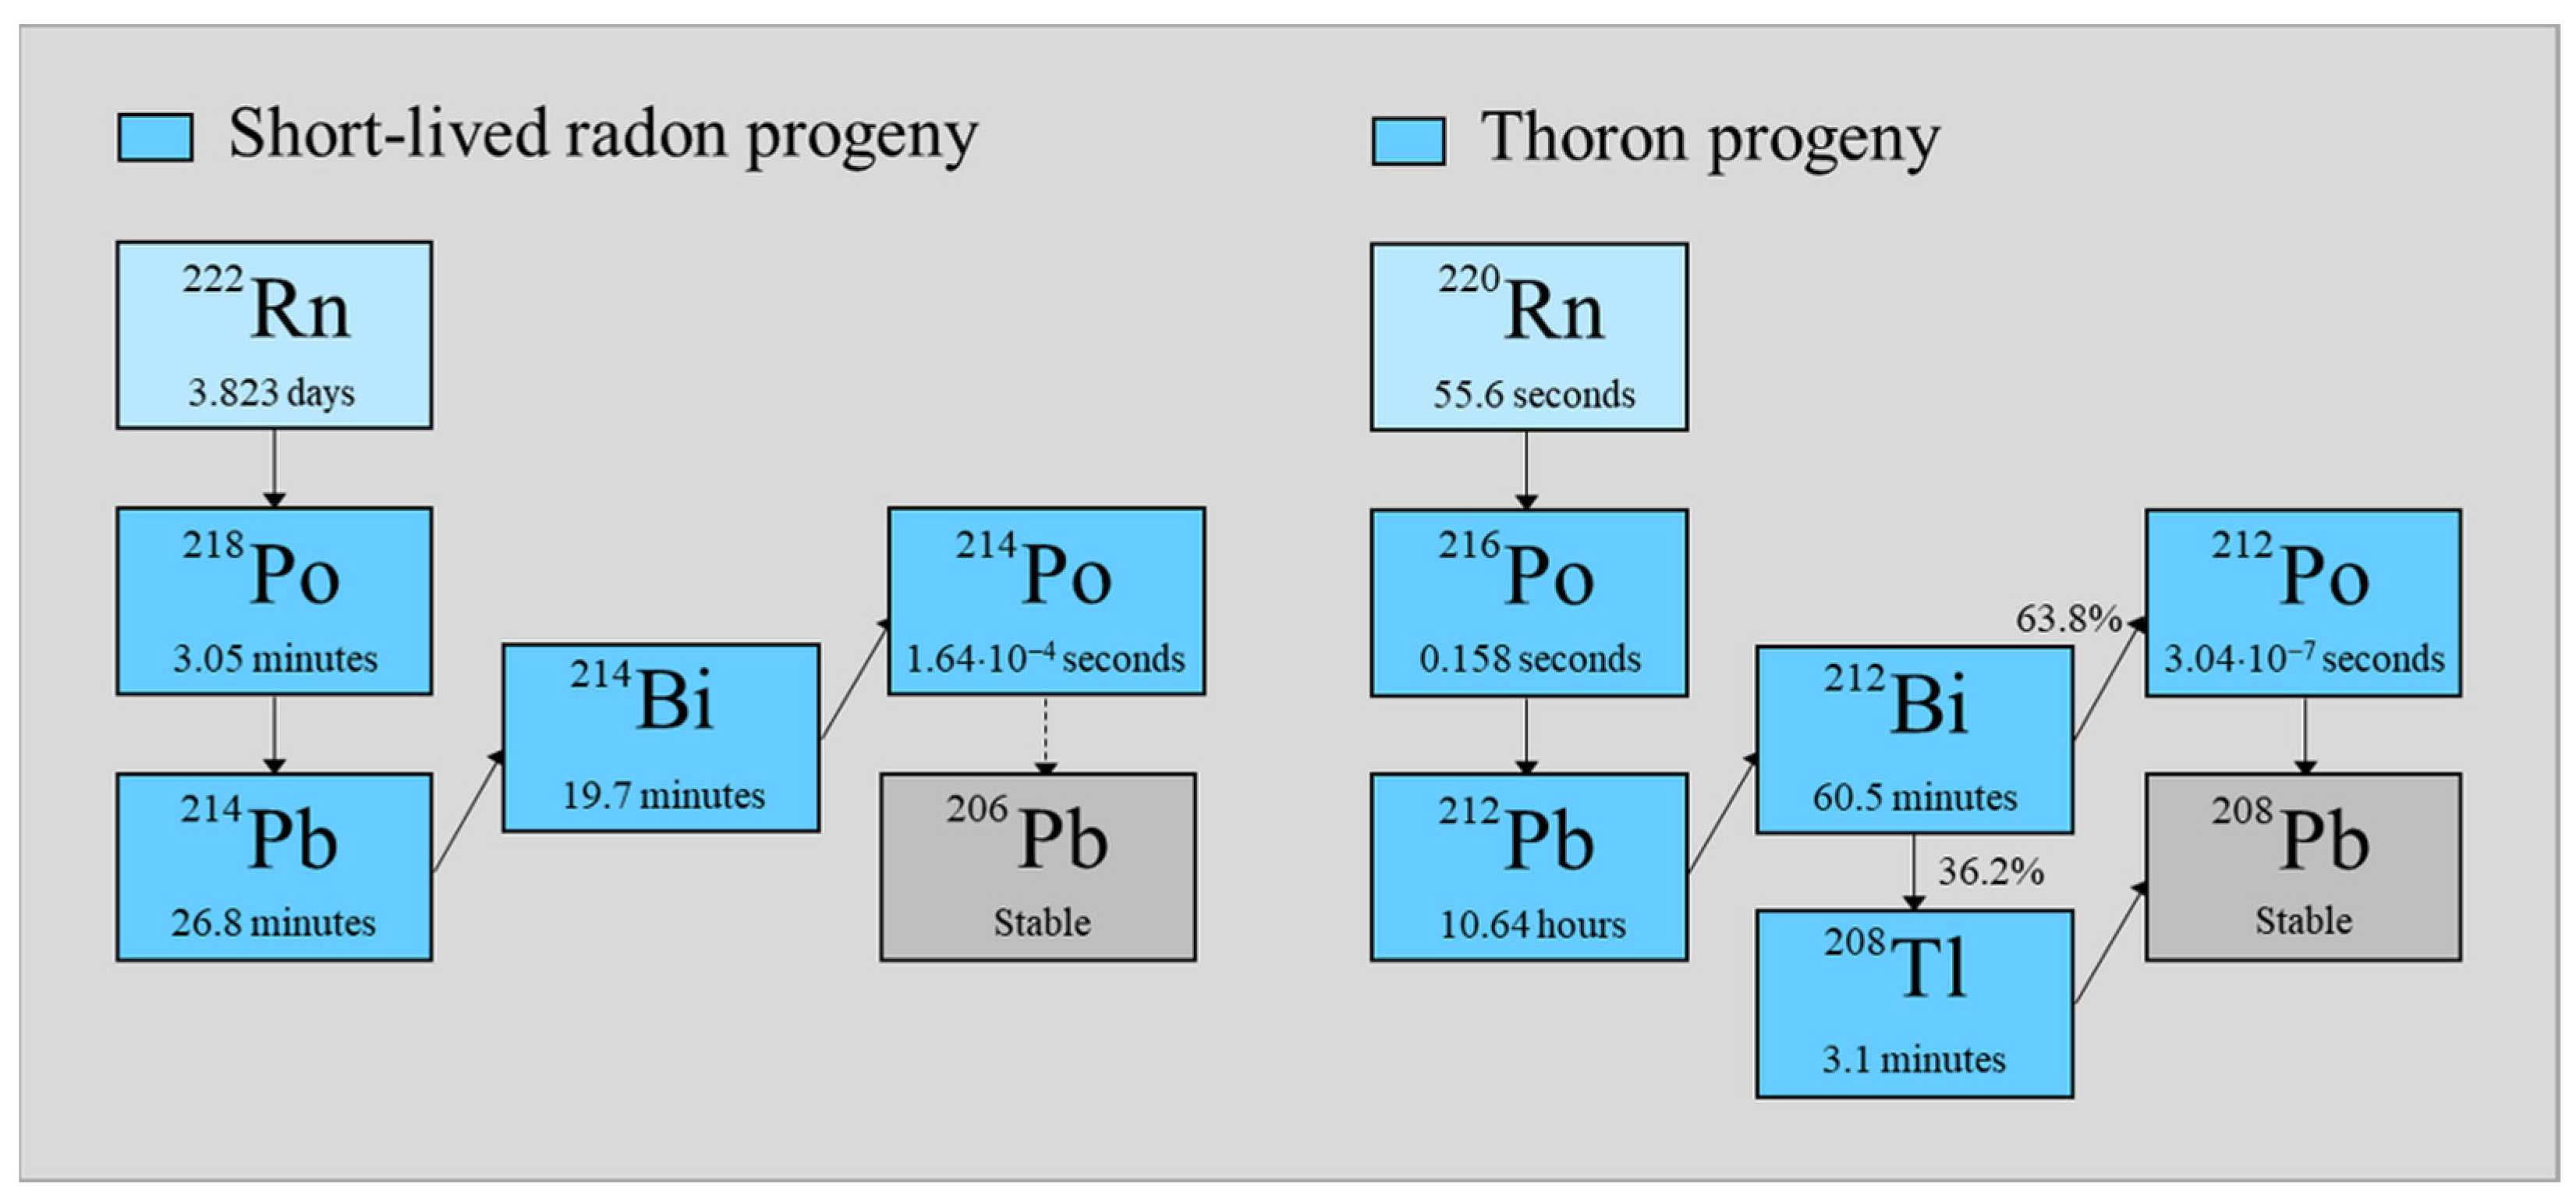
Among the natural radioactive sources, radon plays a leading role, especially such isotopes as Rn 222, belonging to the uranium series, and Rn 220, from the thorium series (
Figure 1). According to the UNSCEAR report [
1], the contribution to the average annual dose of 2.4 mSv from both isotopes is 1.3 mSv; therefore, their contribution is predominant. Of this dose, 1.2 mSv is due to radon and its short-lived progeny, while the contribution from thoron and its decay products is only about 0.1 mSv. Compared to radon, thoron has a much shorter half-life, which reduces its chance of escaping from radium-containing material, and therefore, the thoron contribution (Rn 220) is usually smaller. Sometimes, however, the proportions may be reversed, where the concentration of the nuclides belonging to the thorium series is greater in comparison to the nuclides from the uranium-series, just like in China, where in some provinces, there are soils enriched with thorium [
2].
The radon hazard covers a significant population because the main source of this isotope in the environment is its exhalation from the ground [
3,
4,
5]. In this way, depending on its structure, ventilation, environmental conditions, and building construction, residents become an exposed population [
6]. Therefore, sometimes, in conditions of increased exposure, it is recommended that the designed buildings have a special structure, or, in extreme situations, active forms of reducing the radon concentration are carried out, for example, by pumping air from the basement of buildings.
Ventilation largely affects the concentration of radon and thoron. It is certainly worse in caves and underground active or show mines. It is not uncommon that very high concentrations of radon occur in active or show uranium mines, since the average concentration of Ra-226, which is the parent nuclide of radon, is strongly elevated [
7,
8]. For example, the activity of radium measured in the pitchblende sample by the New Brunswick Laboratory was about 7000 kBq/g [
8]. However, even if the radium activity concentration is relatively low, below the average values in the soil (0.025 kBq/kg), the radon concentration can reach very high levels. This is the case, for example, in Polish underground hard coal mines, where, as a result of rock crushing during mining, radon exhalation increases, and as a result, the potential alpha energy concentration, which is an indicator of this hazard, may reach 15 µJ/m
3 [
9], while the average value in the open air usually does not exceed 0.05 μJ/m
3 1 m above the ground [
10]. Similarly, in soil, where the concentration of radium is usually at the level of twenty–thirty becquerels per kilogram, the concentration of radon in soil gas can reach high values from where it can penetrate the atmosphere by diffusion from a depth of several meters. This process can be intensified if there are cracks in the structure, which promotes convective movements or by means of radon transport in groundwater.
The dose resulting from the presence of radon and thoron in the environment is mainly related to the decay products of these nuclides. It is estimated that during the first passage of blood through the lungs, the concentration of radon already reaches 80-90% of the saturation level in it. According to calculations based on the Jacobi-Eisfeld lung dosimetry model [
11], for aerosols of 0.25 µm in size, which are deposited in the airways with the least efficiency, radon contributes only 2% to the effective dose, while its short-lived progeny is 98%, assuming that all of these isotopes are in radioactive equilibrium. A similar estimation is reported by the latest ICRP report [
12]. The epidemiological studies showed that increasing radon activity concentration by 100 Bq/m
3 increases the risk of lung cancer by 16% for a prolonged exposure period [
5], and according to the US Environmental Protection Agency [
13], radon is responsible for about 21,000 lung cancer deaths every year in the US and is considered the second leading cause of lung cancer after smoking.
Bearing in mind the importance of the radon hazard on human health and especially its role in inducing lung cancer, many legal requirements have been developed to reduce this risk. Therefore, the Council Directive of the European Union introduced rules which should protect people against these hazards [
14]. Also, in other countries, there are rules governing these matters, for example, in Australia [
15], Canada [
16], Great Britain [
17] (2022), and the USA [
18,
19].
The rules for dose assessment have been significantly changed in the new ICRP report [
12], as the conversion factors from the potential alpha energy concentration to doses have been considerably increased (
Table 1). The former recommended effective dose coefficient for occupational exposure due to radon progeny was equal to 1.4 mSv/(mJ/m
3·h).
The common practice is to measure the radon concentration and calculate the doses based on the recommended equilibrium factors. However, the true equilibrium factors can vary significantly, especially when mechanical ventilation is applied [
20,
21,
22]. Therefore, the ICRP recommendations are more flexible, and for sites where aerosol characteristics are significantly different from usually occurring conditions, when reliable aerosol data are available, and dose assessment based on this data warrants more detailed consideration, the modified dose conversion can be accepted. Therefore, in dubious situations and high exposure, more appropriate risk assessment should be based on the direct measurement of the potential alpha energy concentration to avoid the need to accept a recommended equilibrium factor between radon and its decay progeny. Such an approach is recommended in some countries for specific locations, such as the mining industry [
9,
18,
19,
23]. This approach could also be more appropriate for thoron exposure, where due to the half-life of thoron and its progeny, the most realistic dose estimation can be obtained by the direct measurement of the potential alpha energy concentration.
Both devices designed to measure the potential alpha energy concentration and only the activity concentration of radon and thoron require calibration. There are a number of methods and such installations [
24,
25,
26,
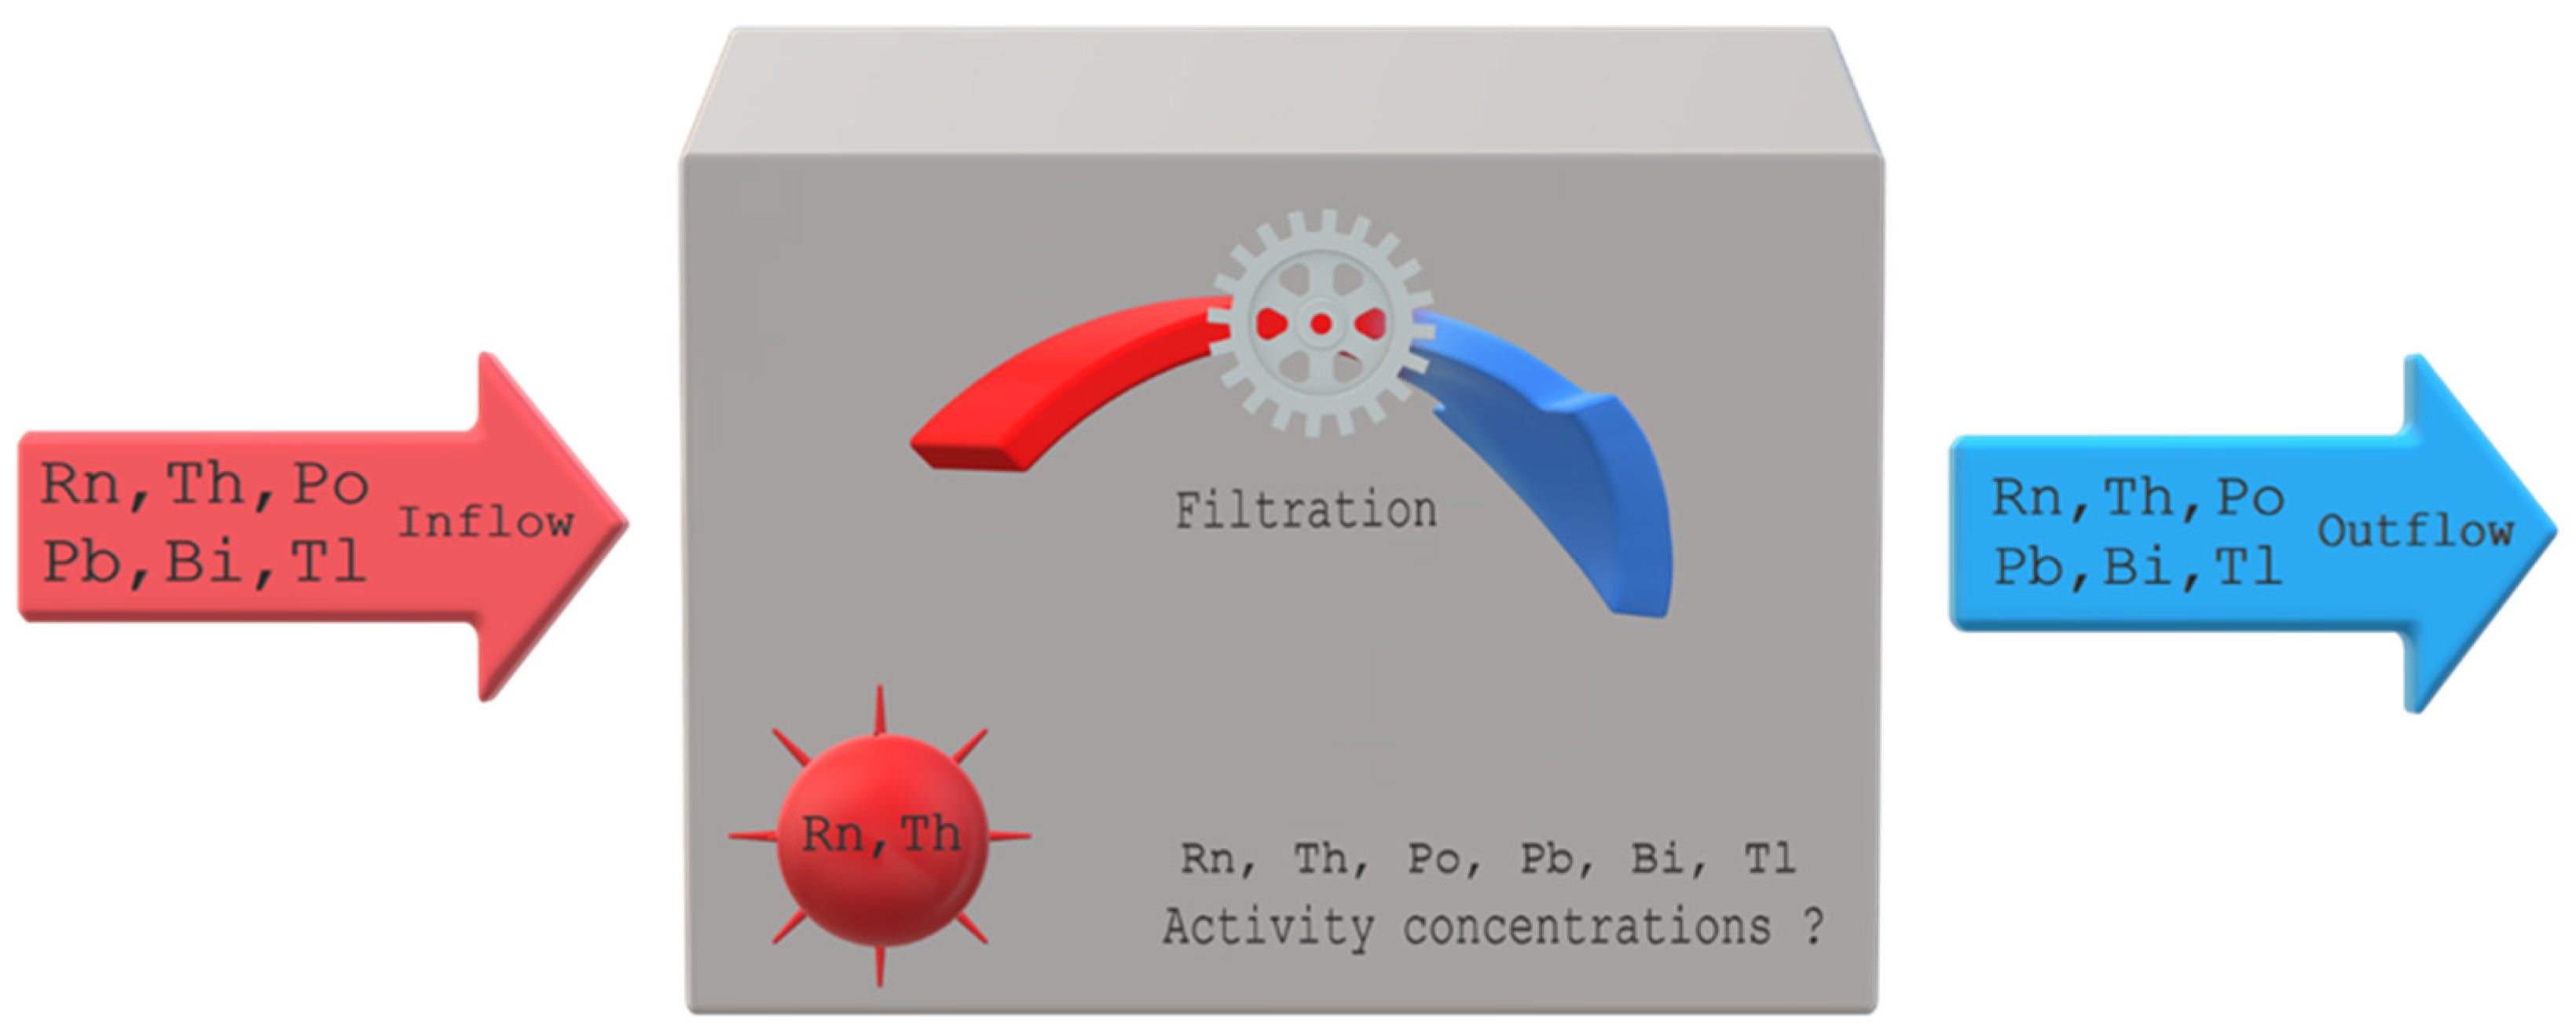
27]. Typically, the calibration procedure is carried out in an isolated facility. The model for simulation was developed to evaluate changes over time in the activity concentration of radon and thoron, and their progeny in an open system. The results of these simulations can be helpful in adapting the calibration process to the object in which it is to be carried out and the calibrated devices. The basic assumptions of this model are presented in a schematic way in
Figure 2.
2. Method
The basis for developing the model was a set of differential equations that corresponded to the assumptions formulated above: that a constant stream of air containing nuclides of known activity flows into a specific space, inside which air filtration can occur. Moreover, it can flow from the system to outside an air stream, which reduces the activity concentration of nuclides inside. At the first step, the differential equations were formulated and then solved. The calculations were tested with the help of the Mathematica software version 11.3 [
28]. In the end, the application was developed for the convenient use of these solutions. The application was based on the Excel worksheet and Visual Basic for Applications [
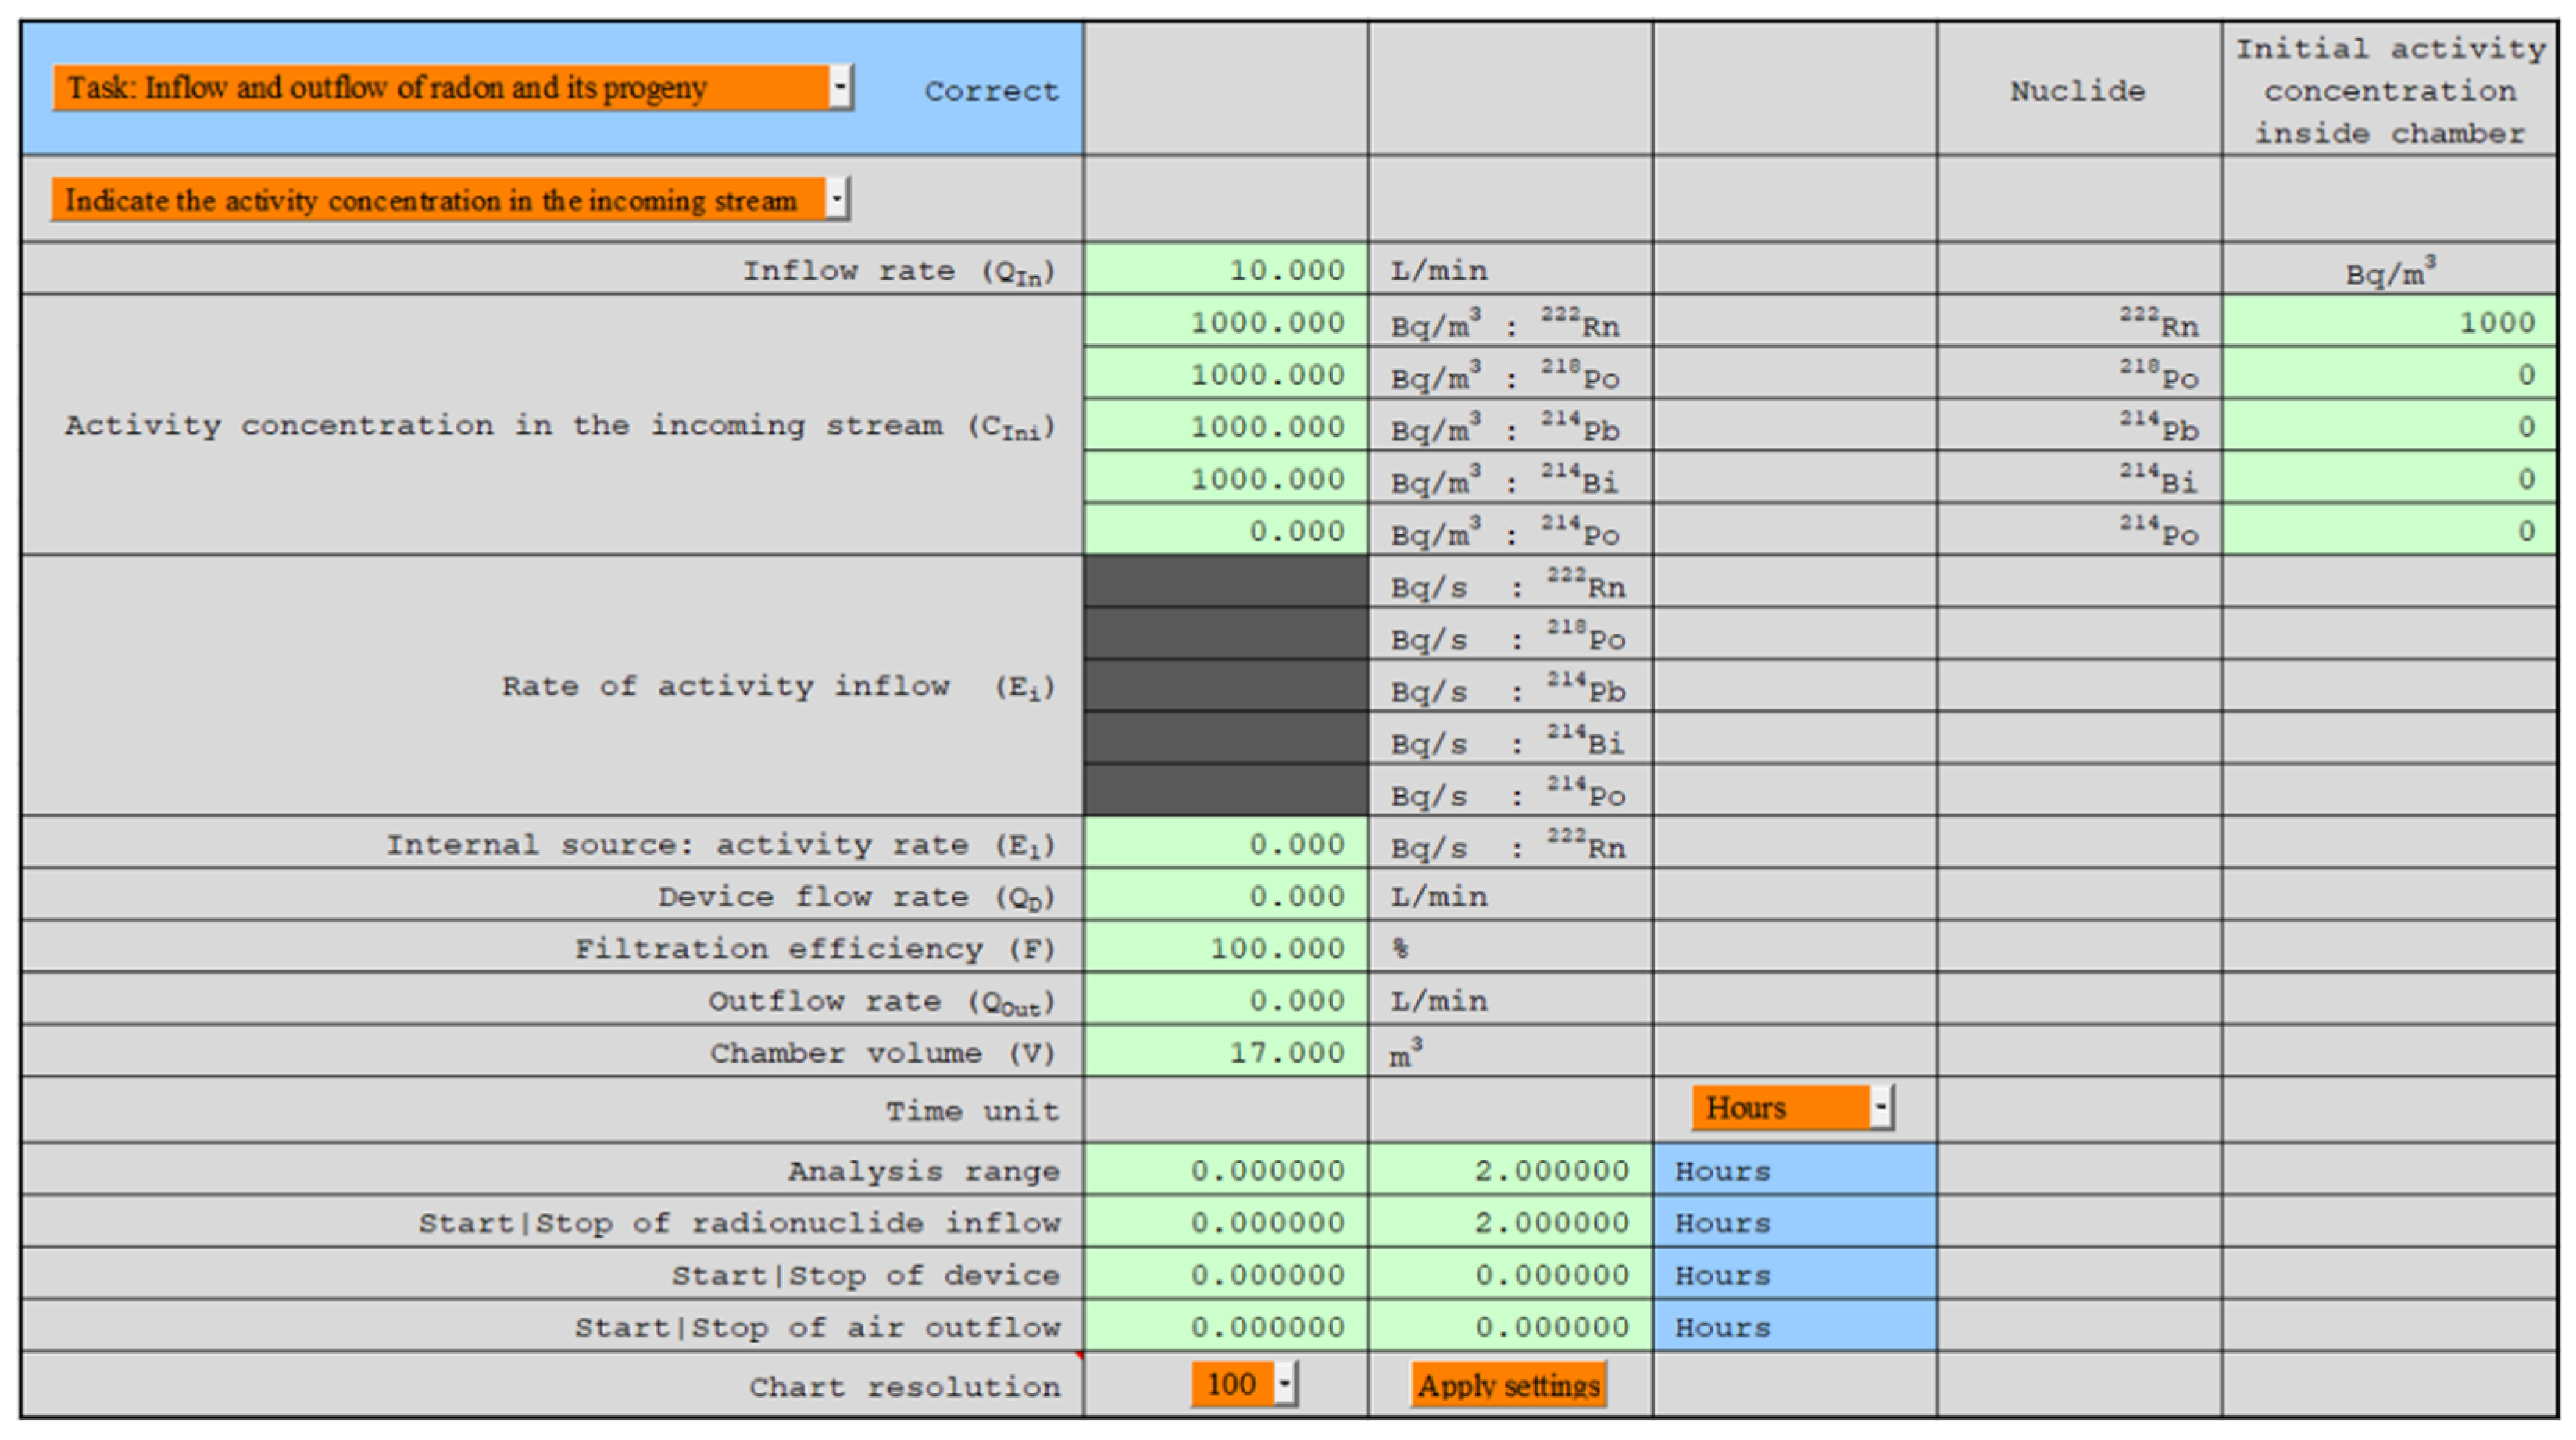
29]. The automatic creation of charts for any parameters indicated and the change in their ranges according to their own needs were possible (
Figure 3). All numerical values, such as nuclide concentrations and potential alpha energy concentration (PAEC) based on which the charts were created, were available to the user in hidden cells of this Excel worksheet. These numerical values also contained information about radon and thoron equilibrium equivalent concentration (EEC) and equilibrium coefficients.
The following parameters were evaluated: the activity concentrations of radon, thoron, and their progeny; the potential alpha energy concentration; the partial contribution of individual isotopes to this value in absolute and percentage terms; and the equilibrium equivalent concentration. It was also possible to evaluate these parameters for two other variants, one of which corresponded to a single injection of radon or thoron into the system, and the other described changes in the activity concentration of the progeny, assuming that the concentration of the parent isotopes was constant, which may correspond to the situation in poorly ventilated facilities.
3. Model Description
The model assumed that the isotopes of radon or thoron and their progeny can flow into space with the known volume
V (m
3) and with the certain constant inflow activity rate
Ei (Bq/s), and at the same period, there was a reduction in their decay products because of the operation of devices equipped with filters with the efficiency
F. The reduction of the concentration of nuclides inside the space occurred because of the radioactive decay, air filtering by devices operating at the flow rate of
QD (m
3/s), and the air outflow
QOut (m
3/s) from the system. On the other hand, their concentration increased due to the incoming isotopes in the stream inflowing with the intensity of
QIn (m
3/s). Decay constants such as
λi (or
λj) were related to radon and its progenies in the following way: Rn-222 (i, j = 1), Po-218 (i, j = 2), Pb 214 (i, j = 3), and Bi 214 (i, j = 4), and for thoron and its decay product: Rn 220 (i, j = 1), Po 216 (i, j = 2), Pb 212 (i, j = 3), Bi 212 (i, j = 4), and Po 212 | Tl 208 (i, j = 5). The all-branch ratios εi for short-lived radon progeny were equal to one. It was different for the decay products of thoron, where ε5 = 0.638 (Po 212) or ε5 = 0.362 (Tl 208). Under such assumptions, the concentrations
Ci of the radionuclides (Bq/m
3) must change, according to the following differential equations:
where the
Si,
RD, and
Rout parameters are equal
The inflow activity rate
Ei can be also expressed by the inflow rate
QIn and the inflow activity concentration
CIniThe following notations were introduced to simplify the form of solutions of these equations:
After introducing these simplifications, the solutions of the system of equations take the following form:
According to the differential equations, the air stream QOut was not returned to the system. However, under certain assumptions, such a system can also be considered with good approximation by the obtained solutions. This issue is discussed in the next chapter.
Depending on the activity concentration, in some denominators, there are terms like
λi −
λ1 +
RD (
i ≠ 1). This means that under specific conditions, singularities may occur in the solutions because such terms may be equal to zero, which is excluded for the radon chain. However, these terms when
RD =
λ1 −
λ3 or
RD =
λ1 −
λ4 or
RD =
λ1 −
λ5 (when Tl-208 is considered) can be equal to zero for the nuclides from the thoron chain. The activities of nuclides depend on such factors as the initial concentration, the amount of inflow and outflow of nuclides from the chamber, their natural decay, and the intensity of air filtration (
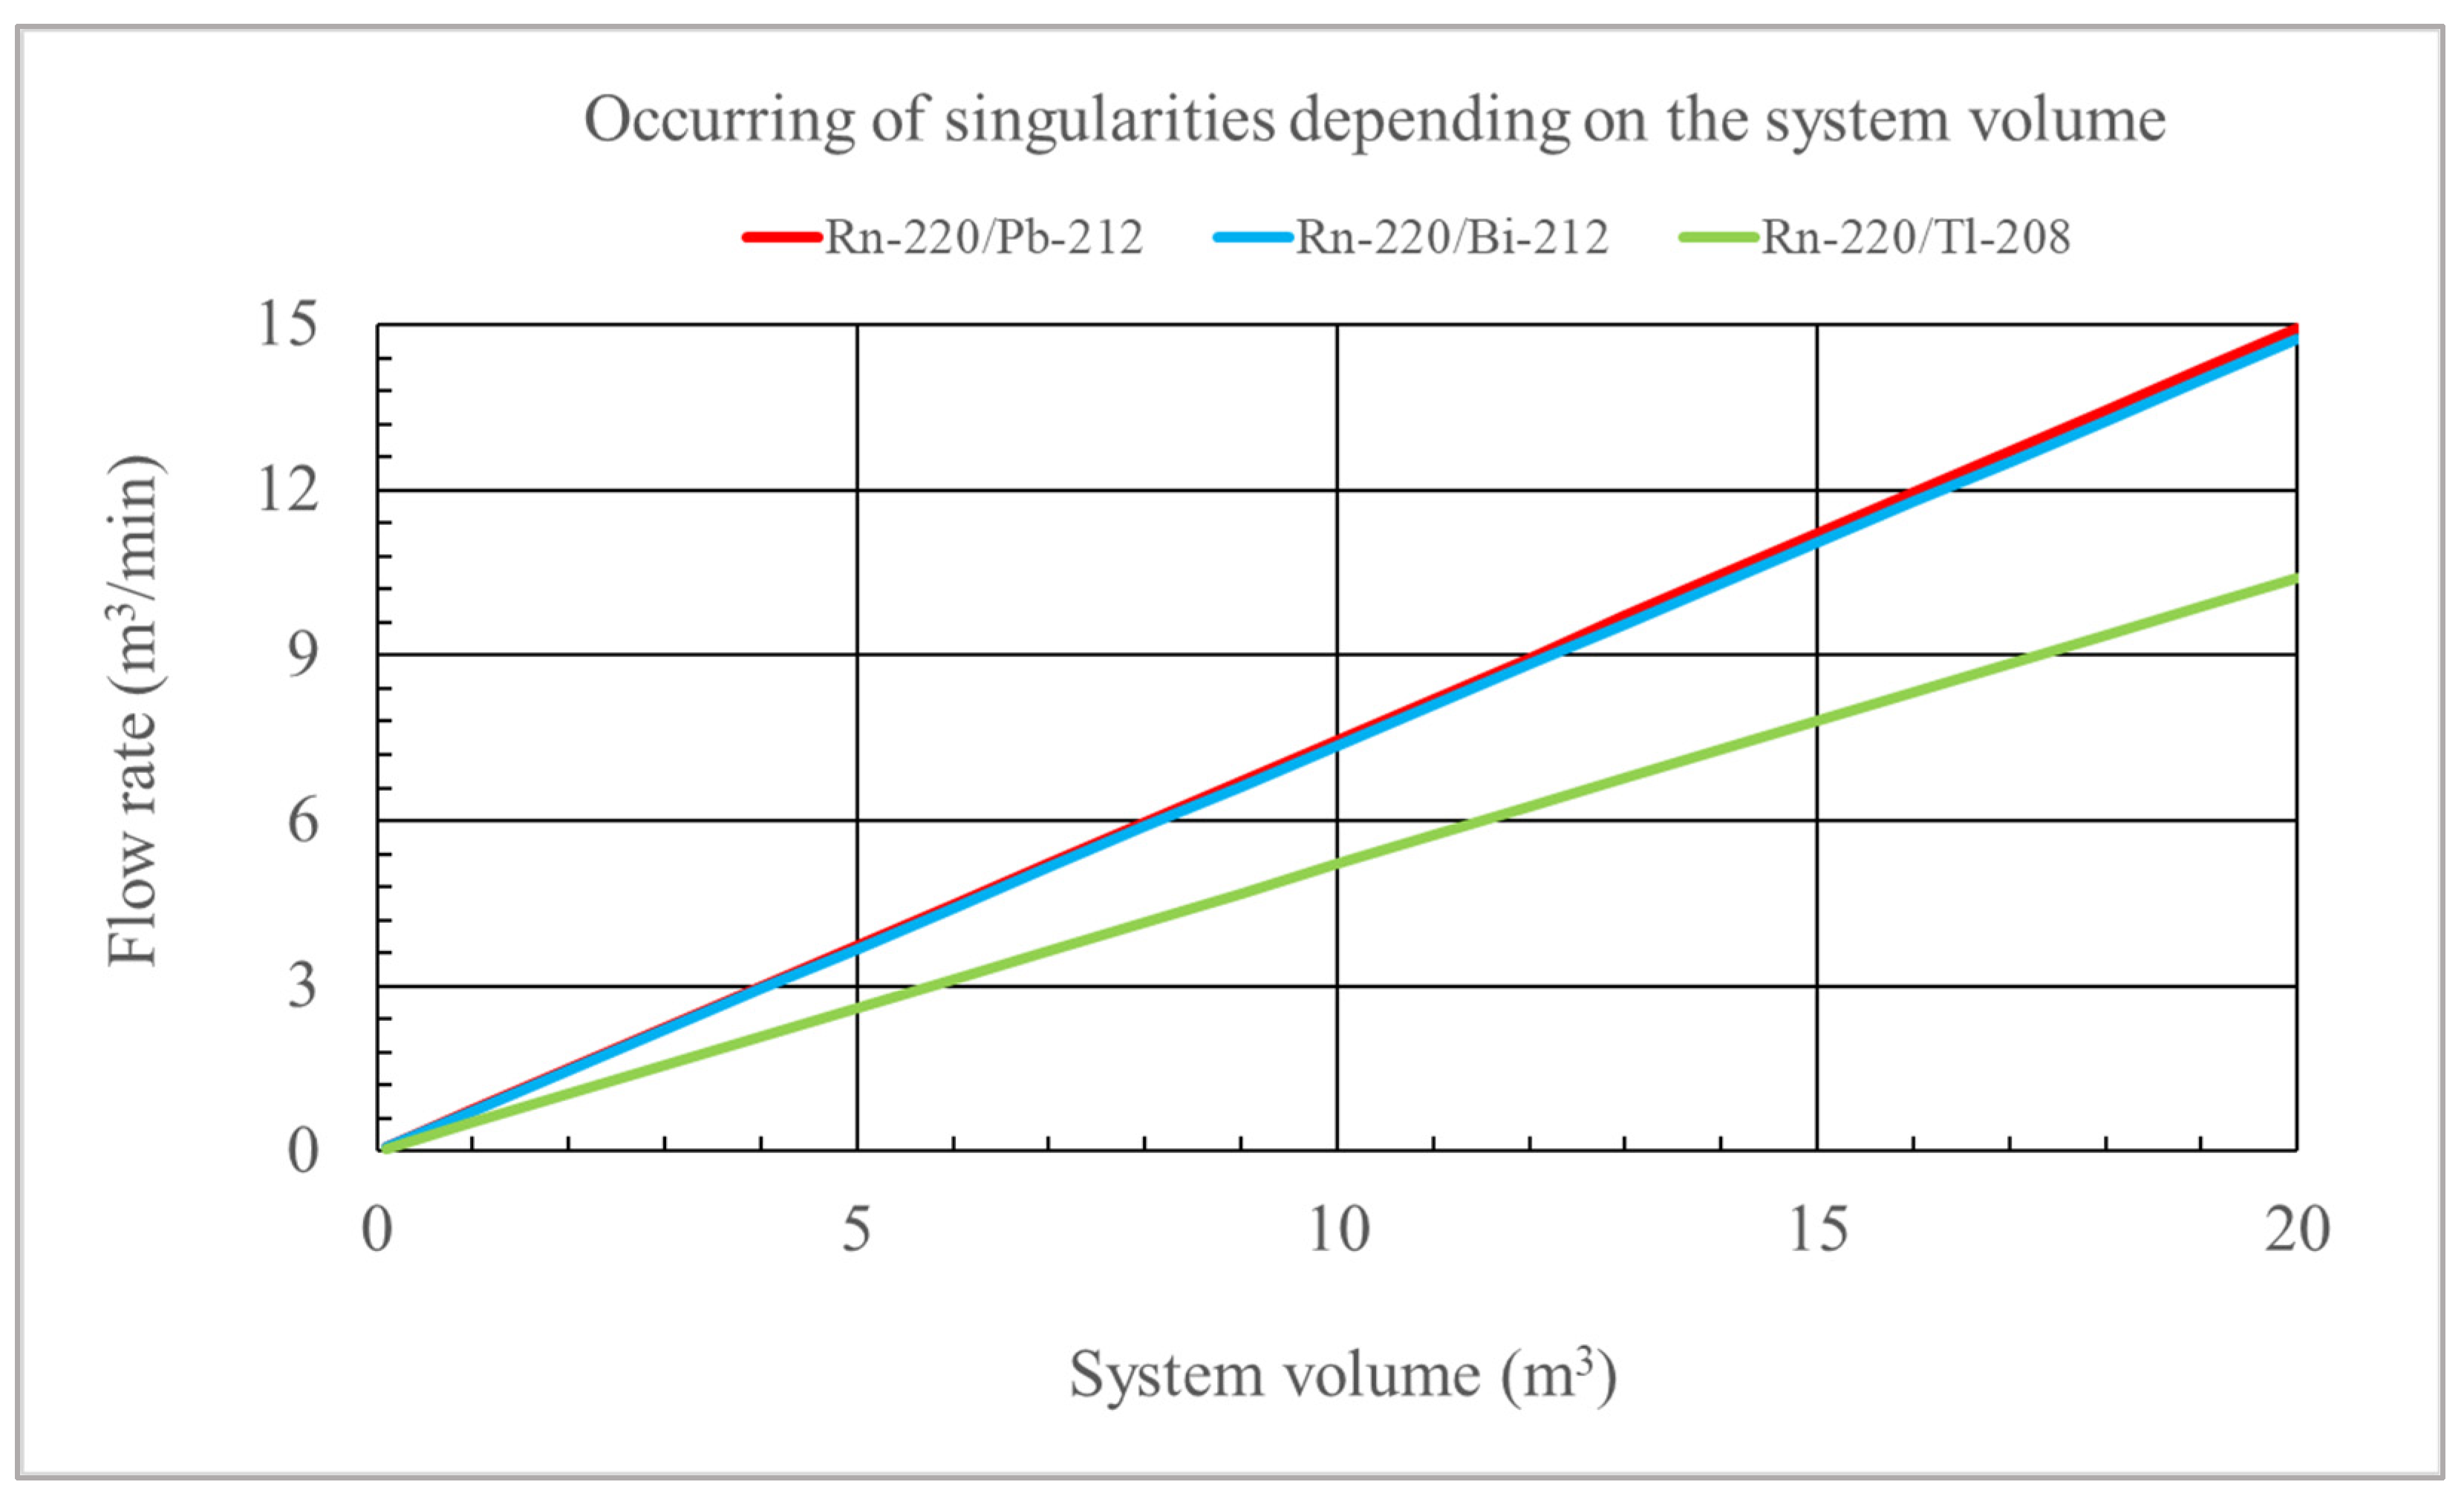
RD). In the case of high filtration intensity, the reduction in concentration will not be supplemented by factors increasing their activity within a given space, and then these singularities will appear. In practice, however, this is excluded. For example, considering the volume of 20 m
3, the air flow in the filtering device would have to reach 15 m
3/min (
F=100%), and then such a singularity would occur for the concentrations of
C3 and
C4 in the thoron chain and for
C5 (Tl-208) at a flow of 10 m
3/min. For a volume of 1 m
3, this would occur at flow rates of 0.75 m
3/min (
C3 and
C4 concentrations) and 0.5 m
3/min (
C5 concentration for Tl-208).
Figure 4 shows the relationship between the system volume and the flow rate for which a singularity would occur in the solutions of the differential equation system considering Rn-220/Pb-212, Rn-220/Bi-212, and Rn-220/Tl-208 nuclides. For the Rn-220/Pb-212 and Rn-220/Bi-220 relationship, the graph would not differ significantly. Flow rate values for which singularities occur are also displayed when working with the tool file related to these solutions.
The differential equations do not include the possible reduction of the activity concentrations due to diffusion, especially in relation to the ultrafine particles (below 100 nm in size), as well as the inertial or gravitational deposition of aerosols in relation to larger particles and motion. If diffusion, inertia, and gravity do not matter much, the equations may be applied to predict the conditions inside the space with the defined volume or at least to design the calibration procedure.
4. Results and Discussion
With a constant inflow of radon or thoron from the outside and an outflow of the same flow rate, the maximum activity concentration of these nuclides in the system with volume
V reaches, according to the solutions, the value:
If the initial activity concentration of these isotopes in the system is
Co1 = 0, then 90% of the maximum value will be reached after time:
However, the activity concentrations of radon and thoron inside the system with volume
V will never be equal to the concentration of these isotopes in the incoming stream because it is the limit when the volume becomes smaller and smaller:
where
E1/
QOut is the activity concentration in the inflowing air stream to the system, in a situation where the inflow and outflow rates are the same.
Table 2 shows the
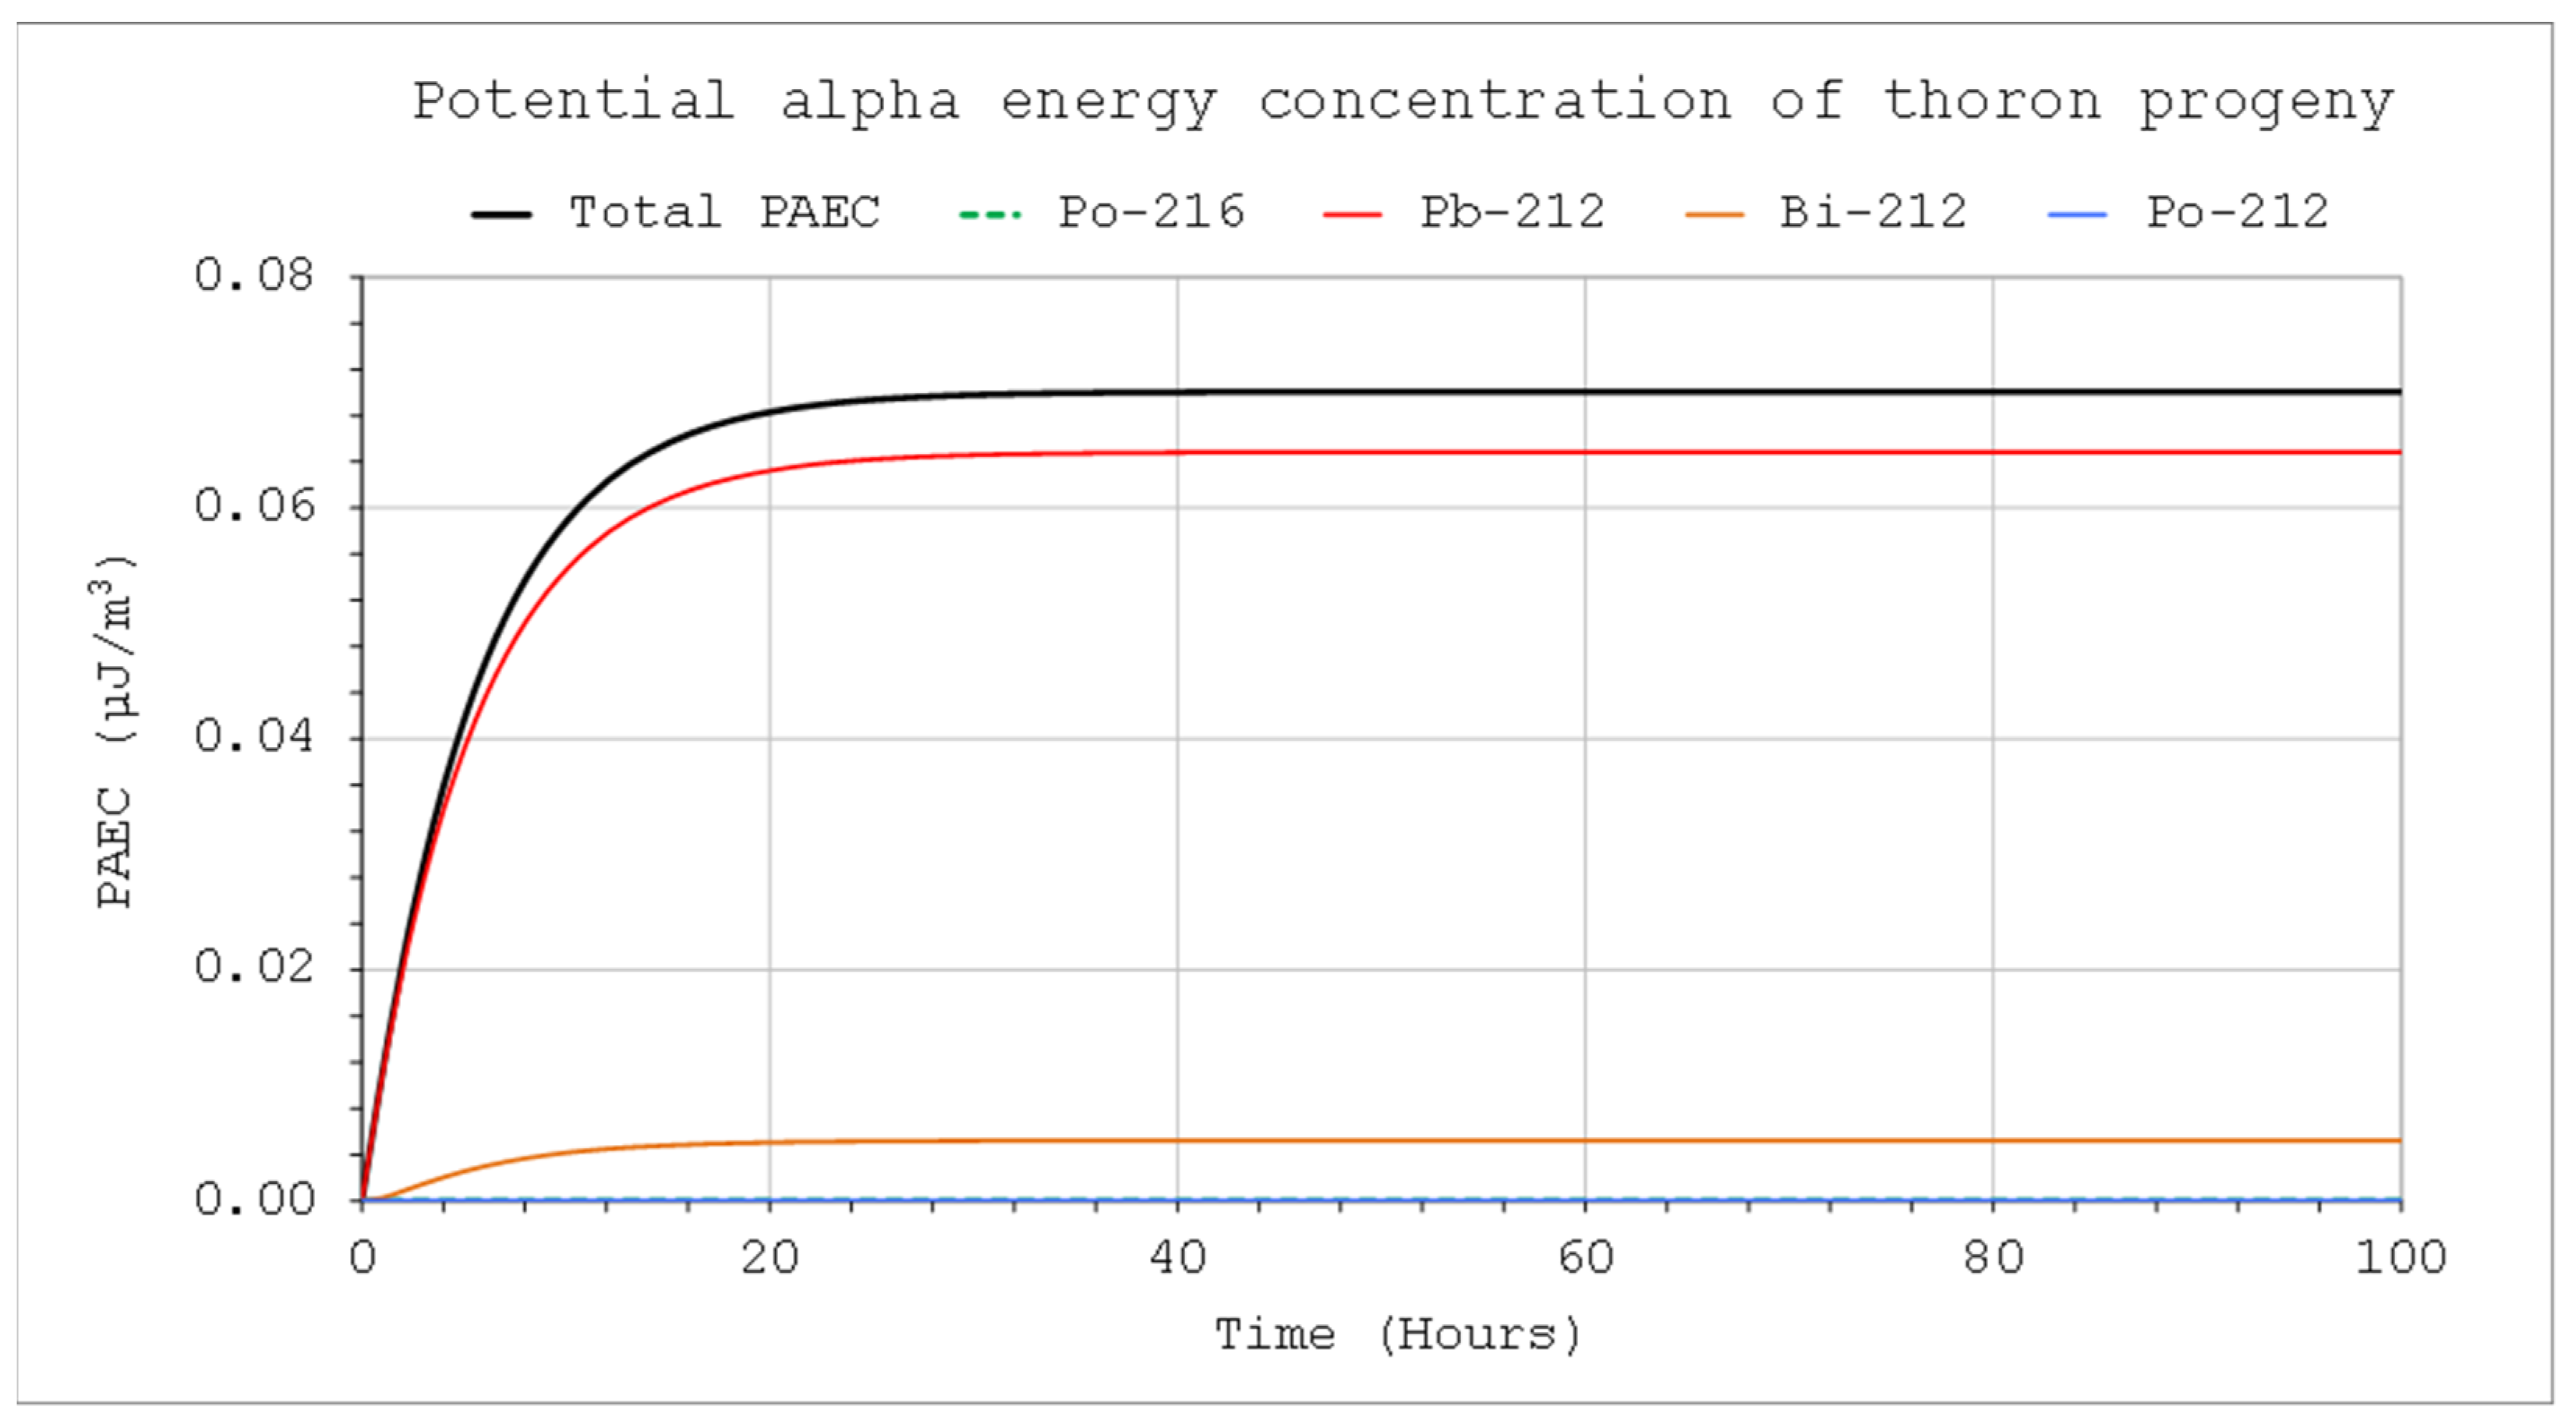
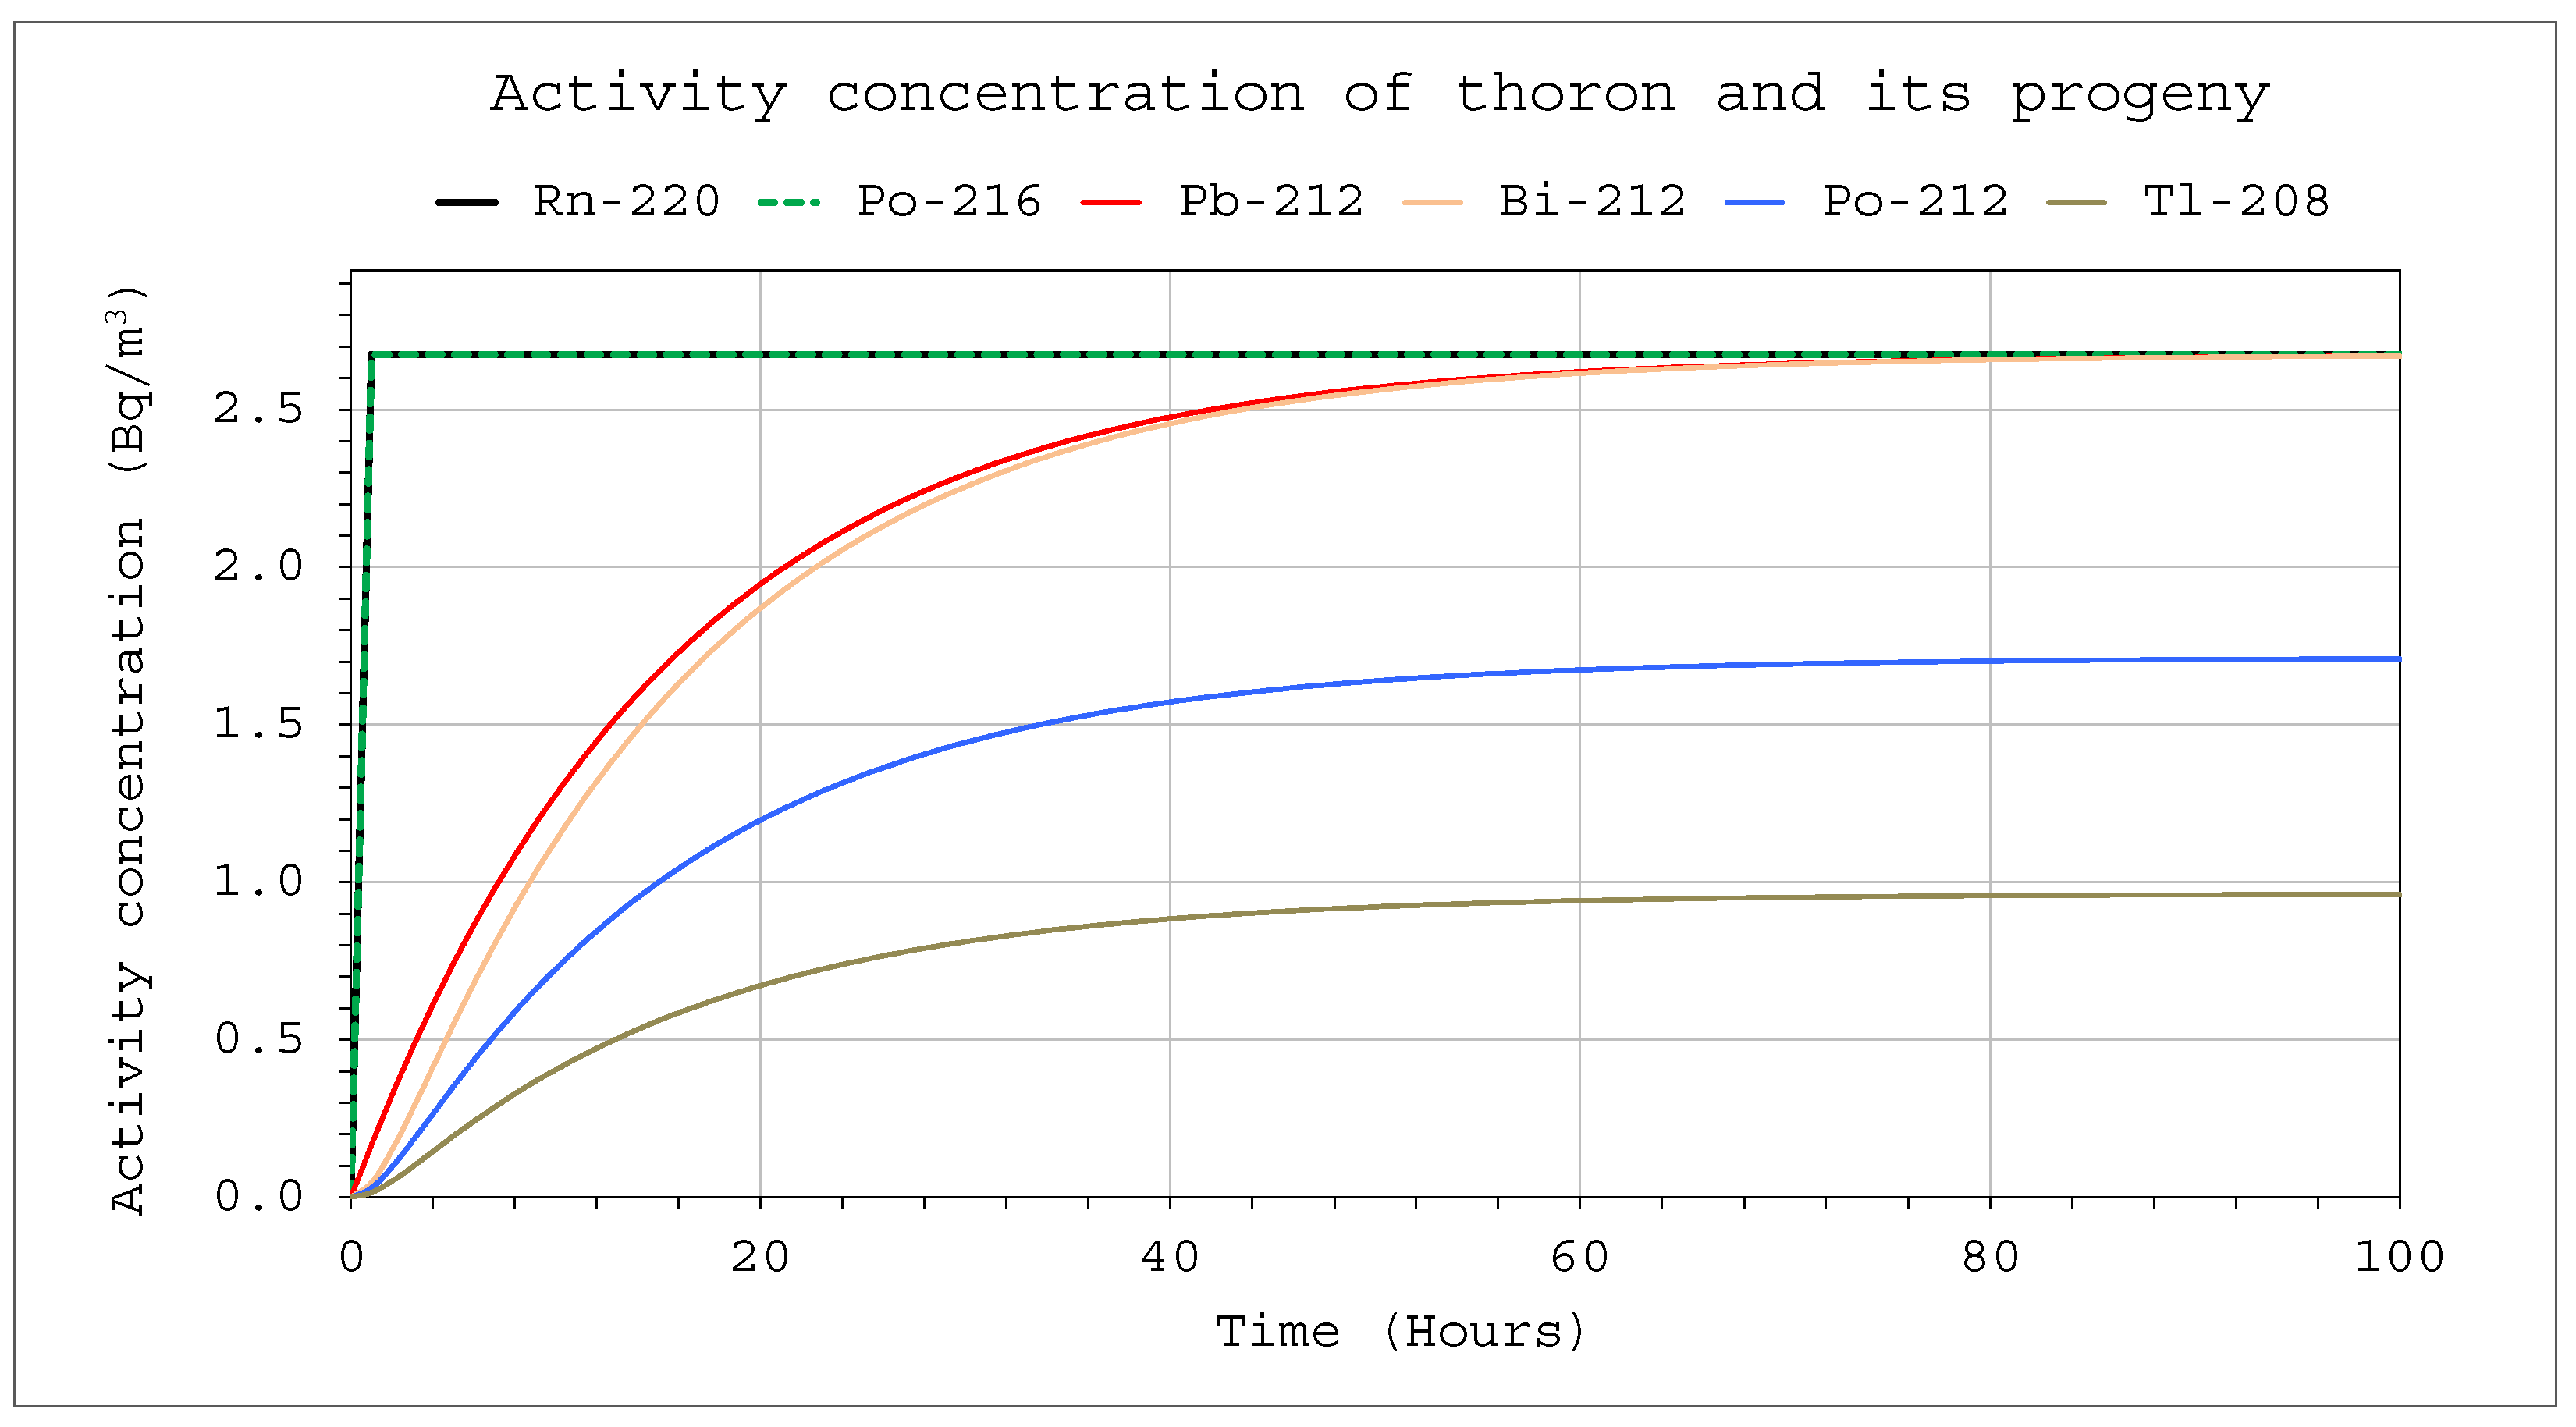
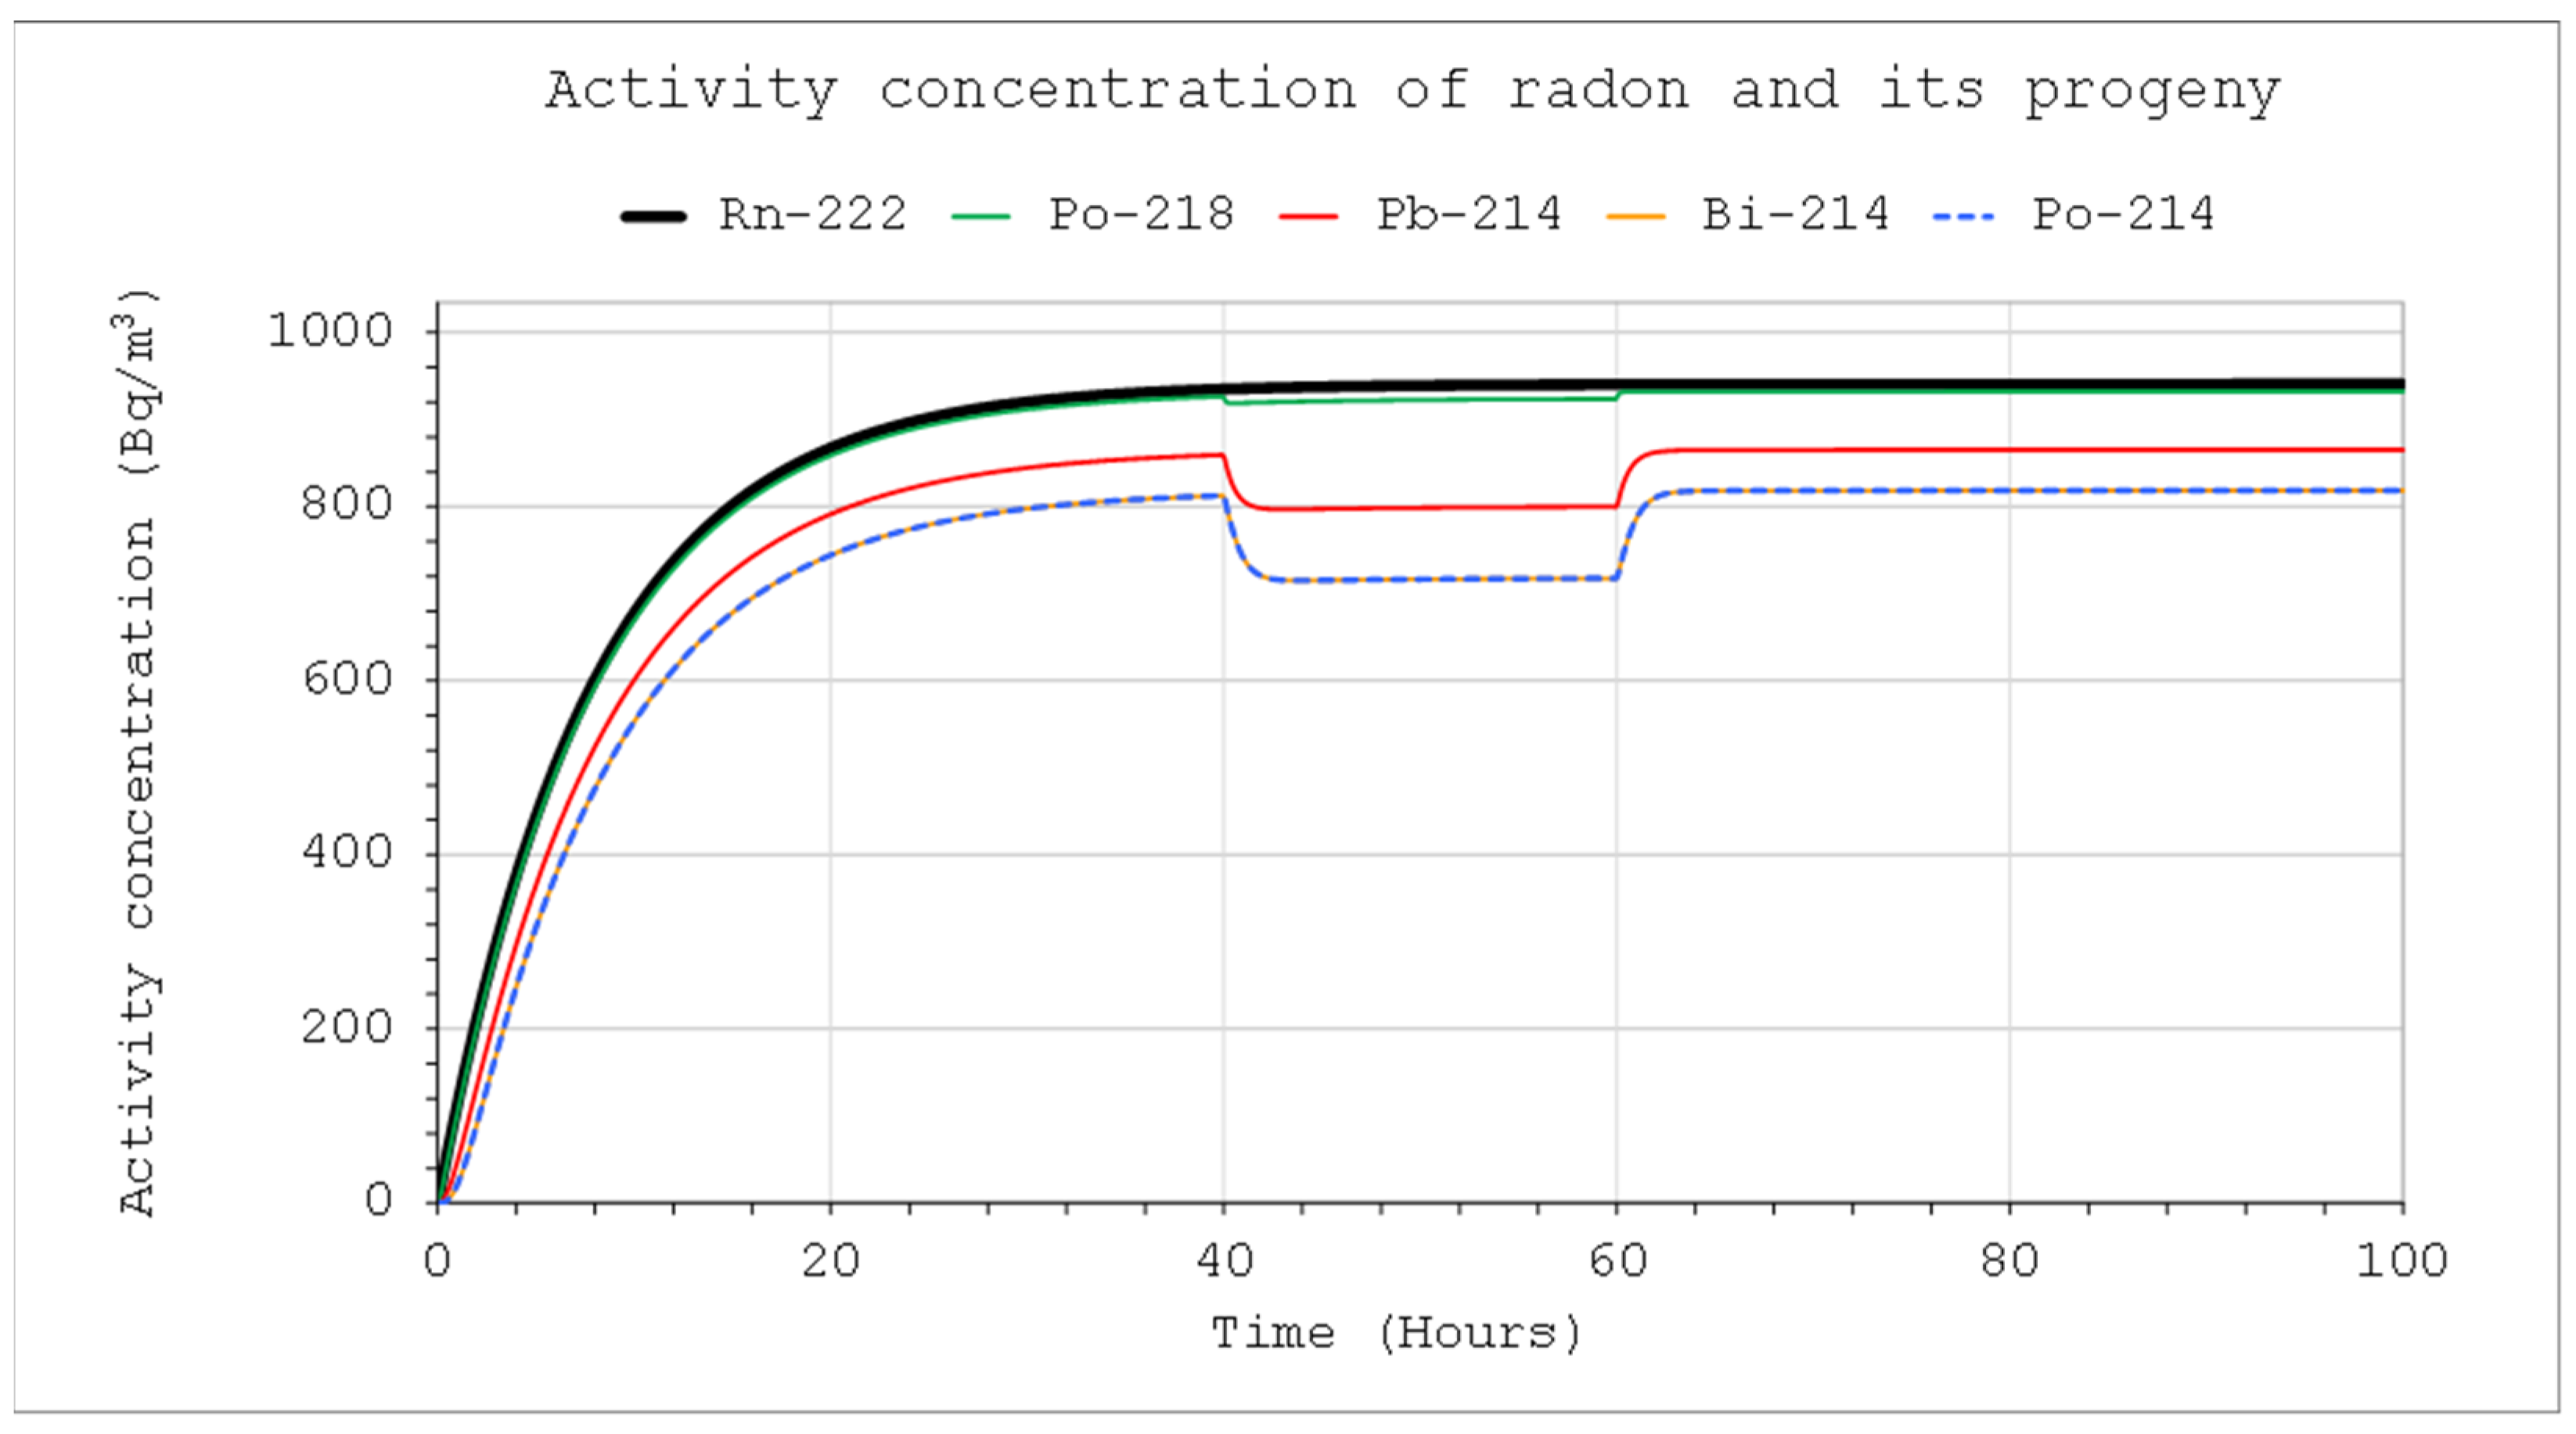
C1Max concentrations in the systems for the three different volumes. Due to the differences in half-time, concentrations close to the maximum will be reached faster in the case of thoron. At the same time, however, for this nuclide, the values will be much lower compared to the activity concentration in the incoming air stream. These necessitate the use of much more active sources in the case of calibration, especially if the devices intended for measuring the alpha potential energy concentration are calibrated (
Figure 5 and
Figure 6). The activity concentrations and potential alpha energy concentration for radon and its progeny are considerably higher (
Figure 7 and
Figure 8). The increase in the inflow rate will not increase the maximum value but will shorten the time until it is reached.
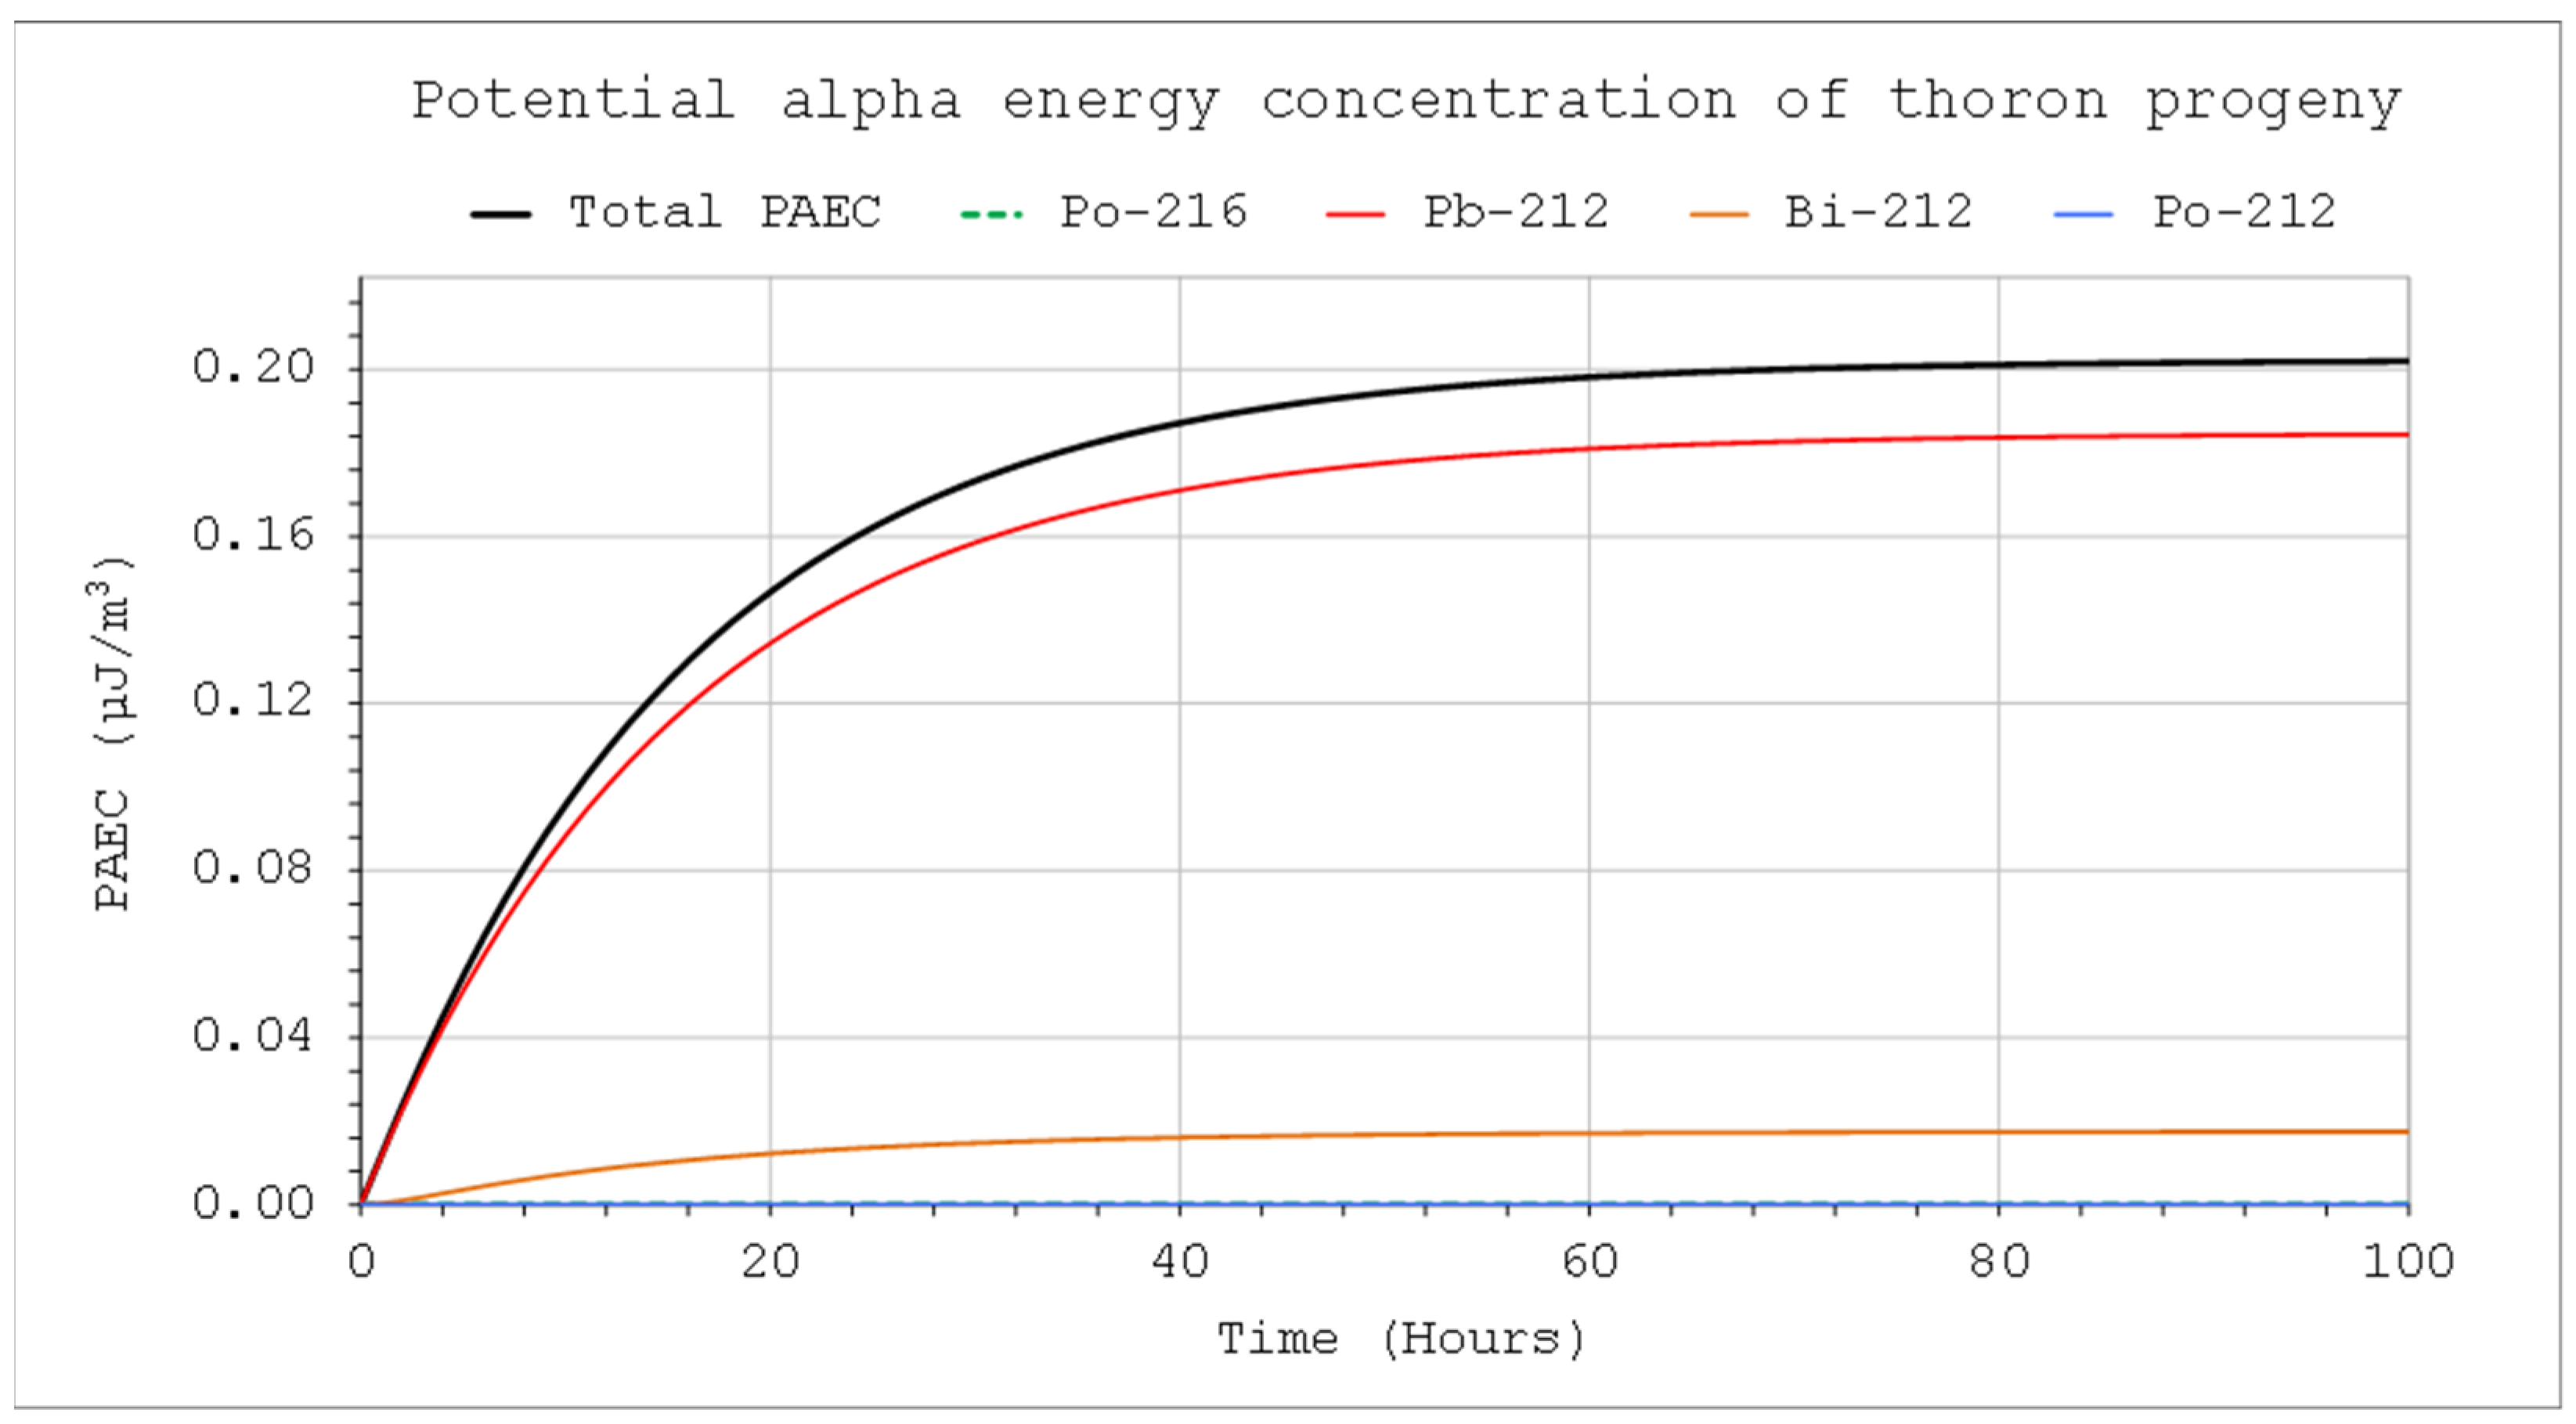
If the chamber works in a closed system, the decay nuclides flowing out of the system flow back into the chamber. In such cases,
Coi ≠ 0, which will increase their activity concentration in the system. Such a case of the through-flow closed system corresponds mathematically to a situation where
ROut = 0, if there is no significant loss in the meantime between outflow and inflow air travel because of the radioactive decay or filtration. That is not true for very short-lived nuclides such as Po-216 and Po-212. However, the potential alpha energy concentration is mainly influenced by isotopes with a longer half-life. Moreover, they will be in radioactive equilibrium with their longer-lived parents. Therefore, in practice, their radioactive decay can be neglected in the available flow-through systems. Such calculations, assuming
ROut = 0, are presented in
Figure 9 and
Figure 10. In such a case, activity concentration will be higher, and the corresponding potential alpha energy concentration is approximately three times as high as in the case where the air is not returned (
Figure 6 vs.
Figure 10). A precise solution to this problem requires the formulation of much more complex differential equations, and the results will not be very different.
An alternative to the use of the through-flow chamber can be a closed one with a thoron or radon emanation source. Then, the maximum of radon or thoron activity concentration in such a closed system is:
Table 3 shows the values of the maximum concentrations that are achievable in systems of three different volumes, assuming that the activity rate is 0.167 Bq/s, which is the same as in
Table 1, but there is no outflow stream from the system. This will not change the situation for the thoron, as the activity concentration is at the same level as for the flow-through system. However, both the activity concentration of thoron progeny (but Po-216) and the corresponding potential alpha energy concentration will be several times higher. The conditions inside will be the same as those presented in
Figure 9 and
Figure 10. For radon, the activity concentrations will be much higher, while the times for reaching the maximum values will be longer, but for each volume, they will be the same, according to Formula (12).
The presence of the air-filtering devices inside the system can significantly change the activity concentrations, especially if its volume is not large.
Figure 11 and
Figure 12 illustrate this impact (also
Figure 5 vs.
Figure 11, and
Figure 7 vs.
Figure 12). It is clearly greater in the case of thoron than radon.
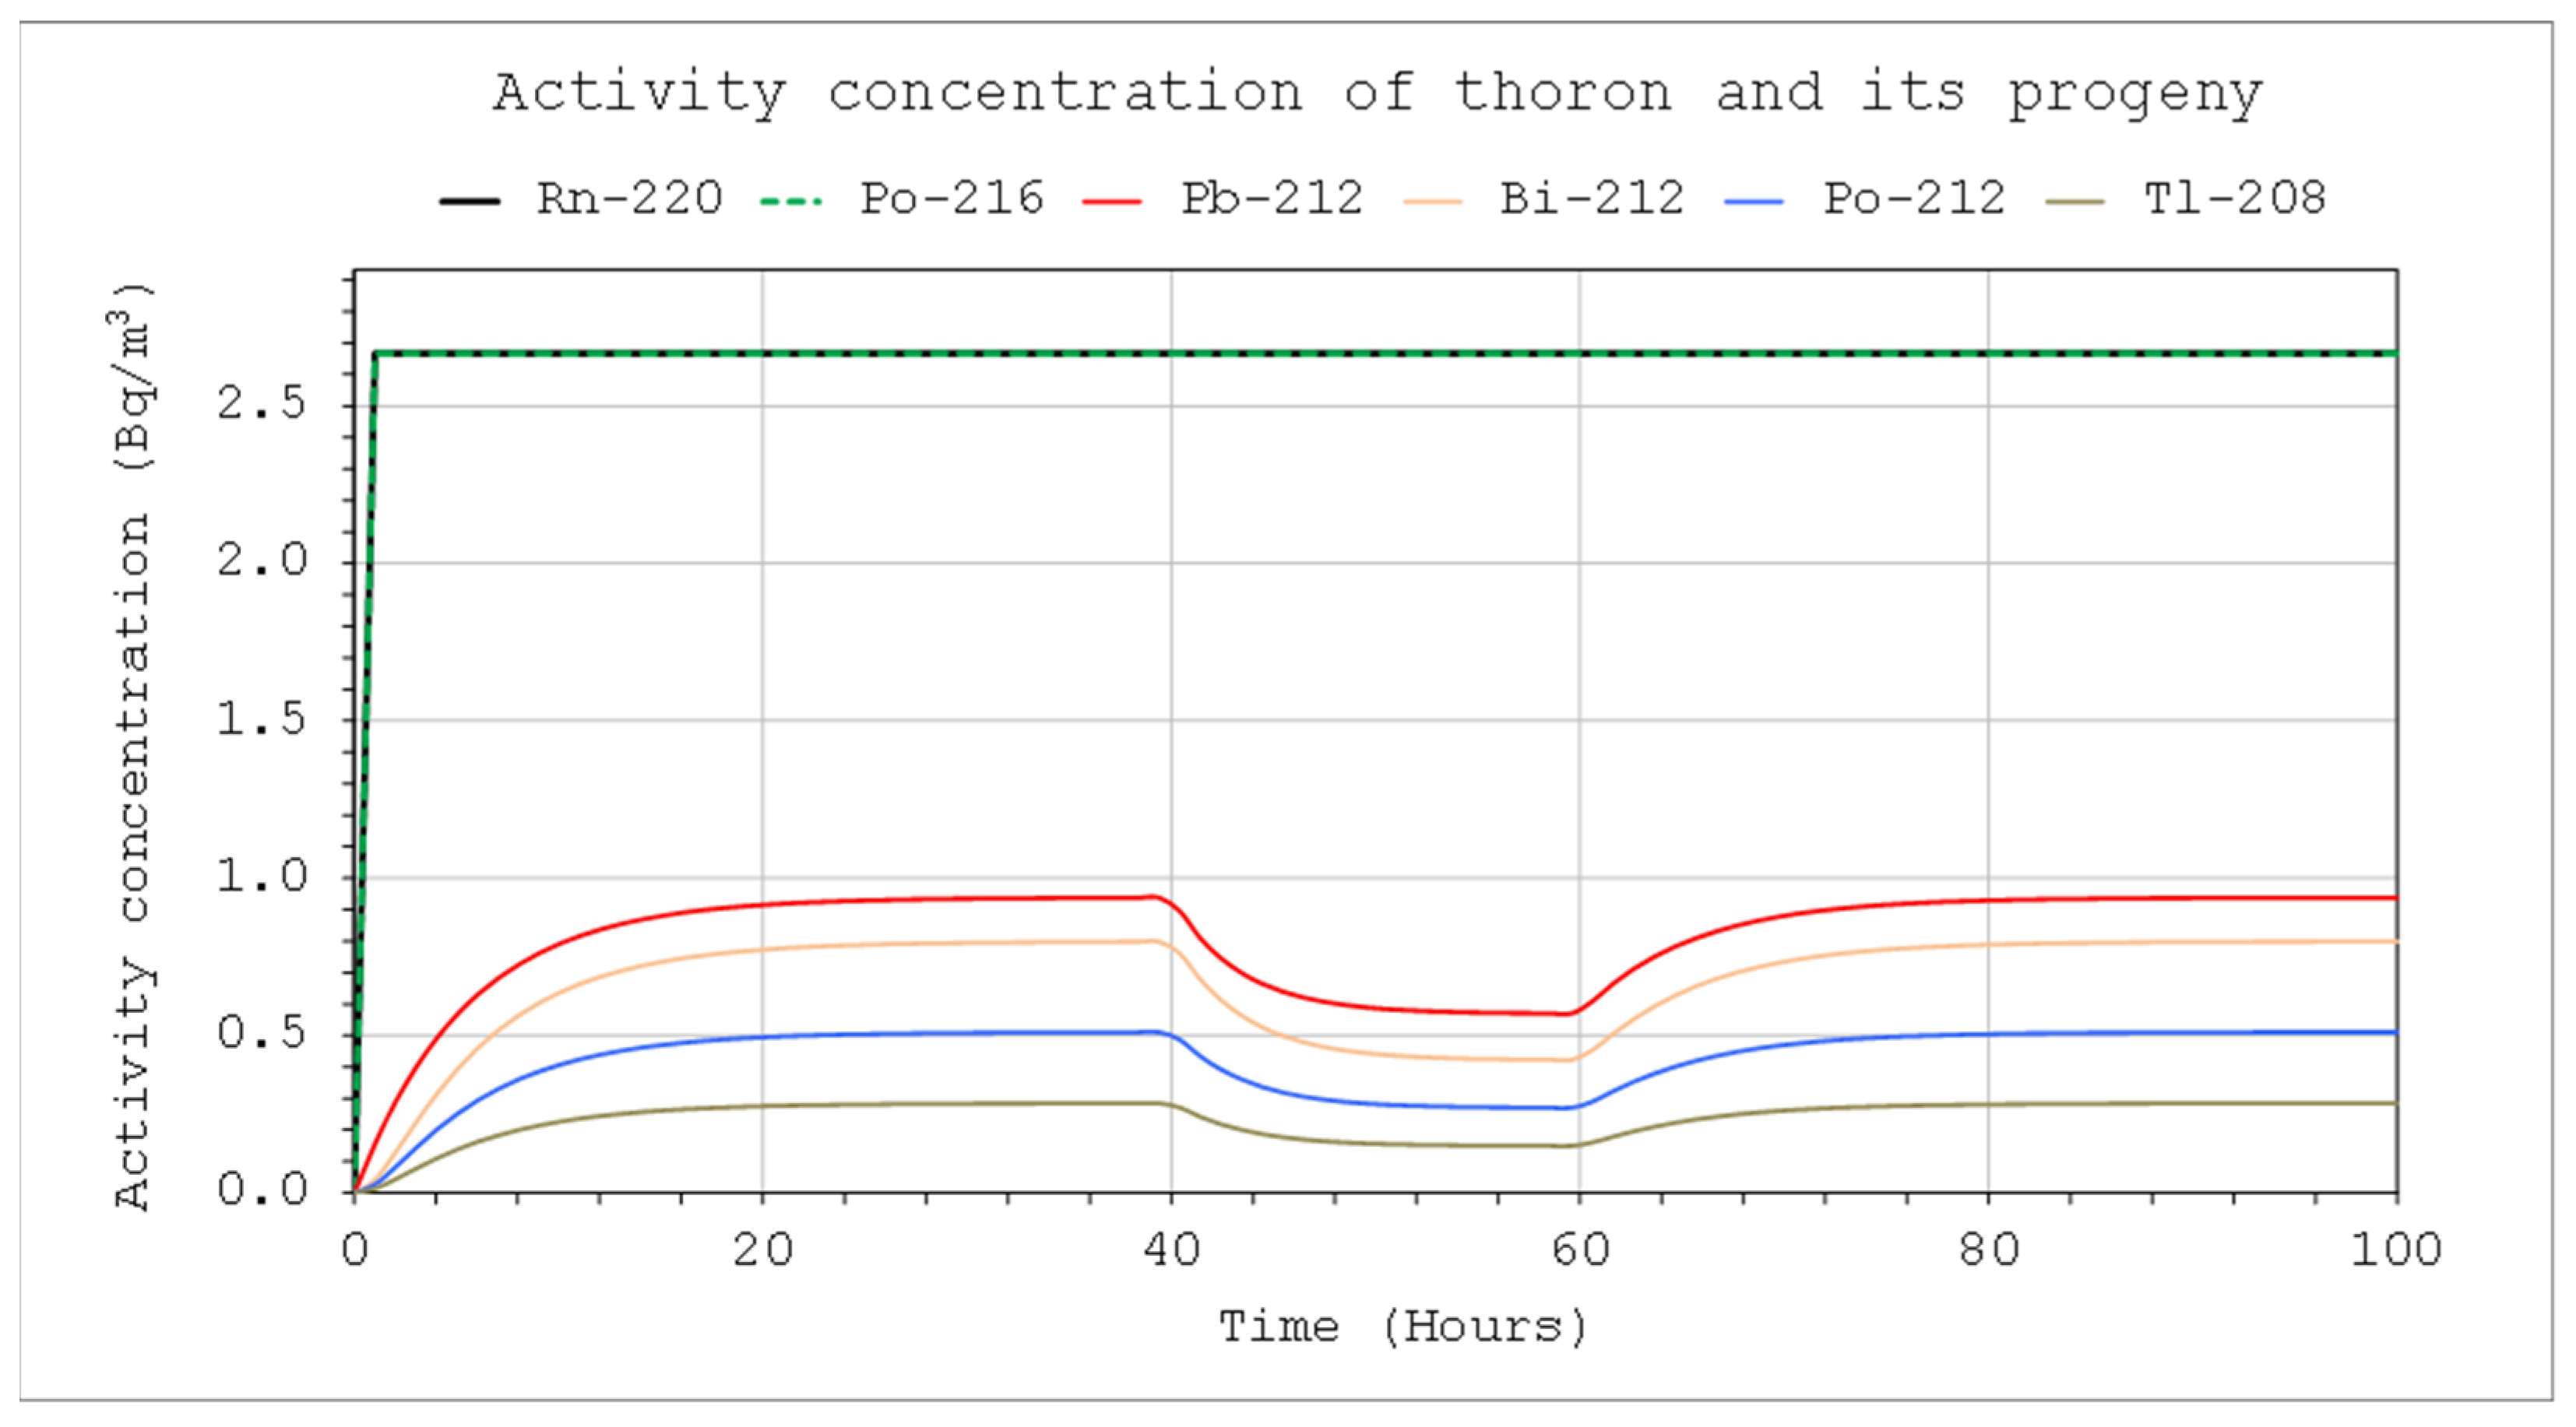
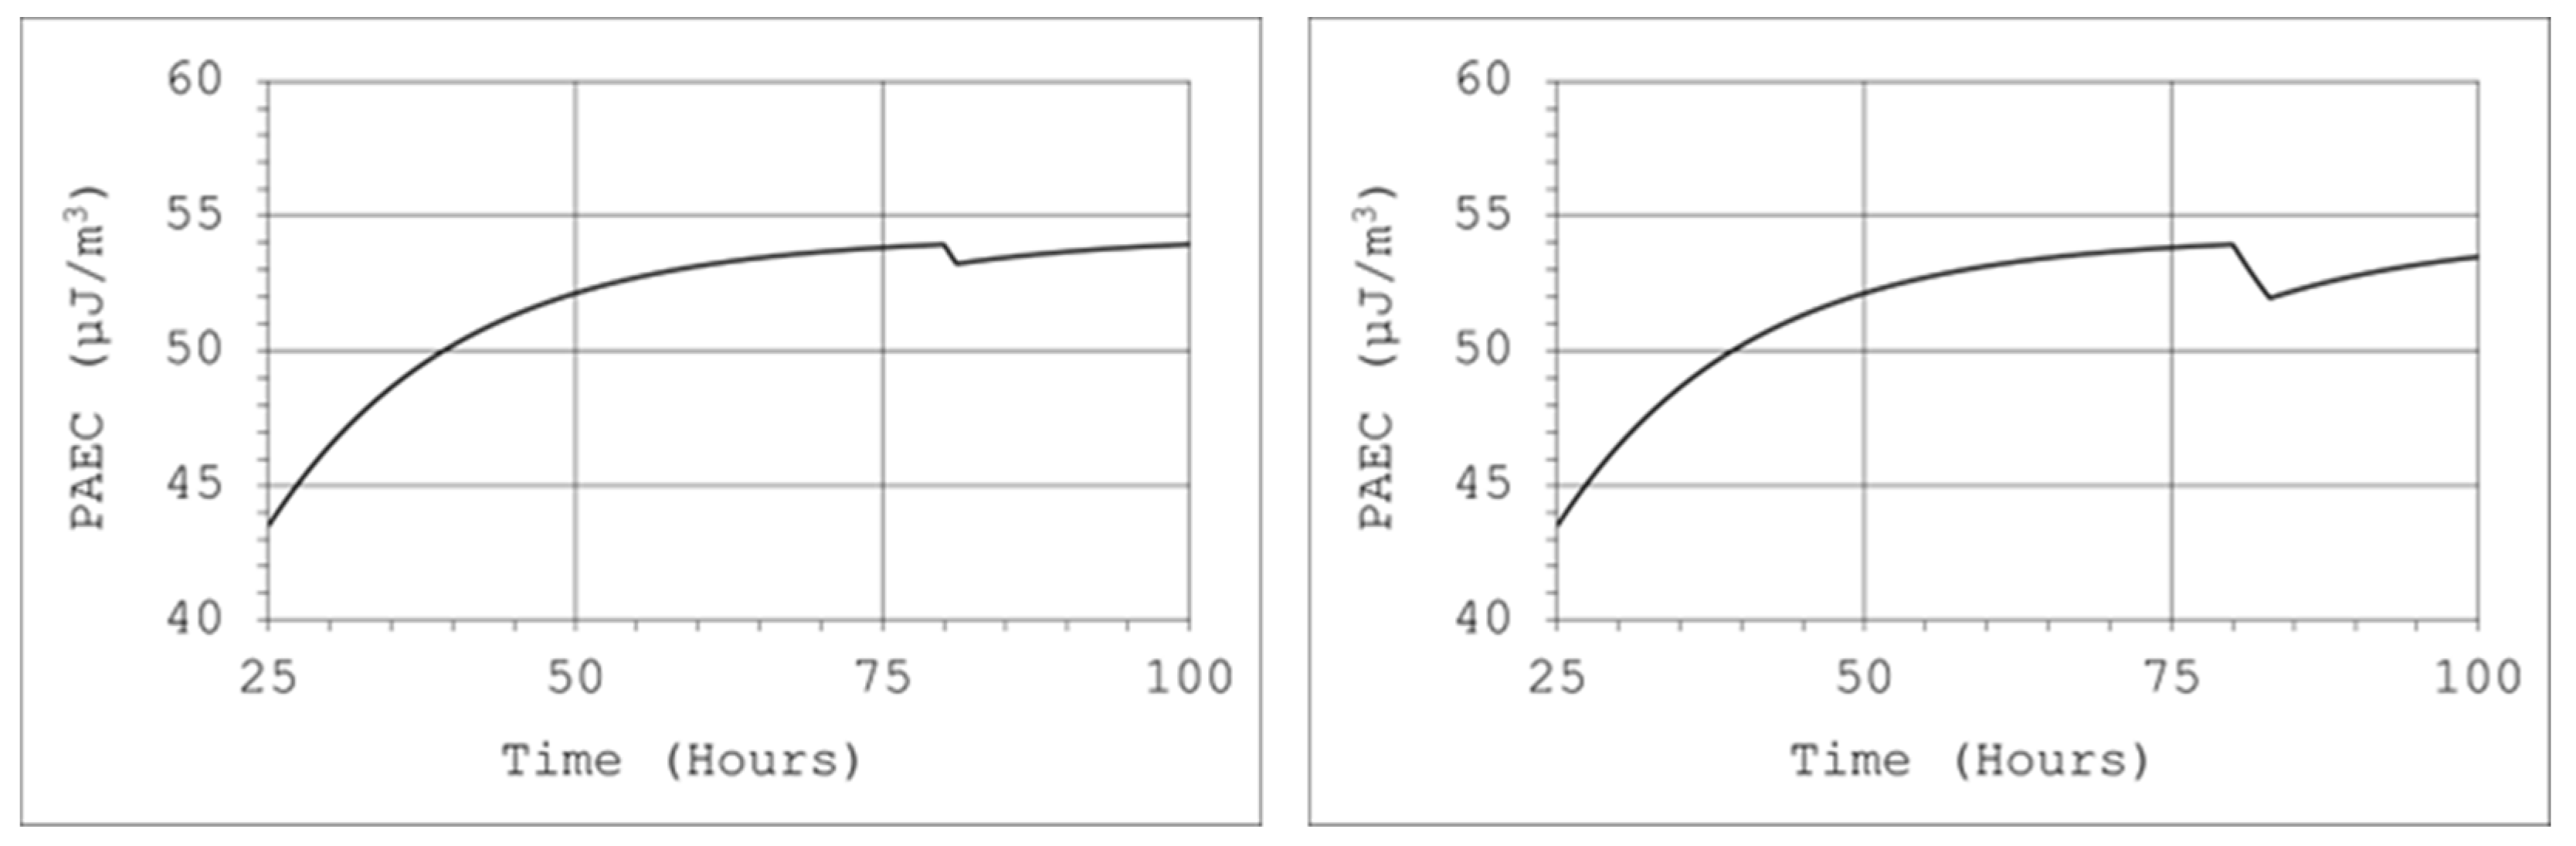
With the help of the tool for the practical application of the model, the efficiency of the source, which was used to generate the appropriate atmosphere inside the calibration chamber, can be determined. Thoron was supplied to the system continuously, and calibrations were performed successively, one after another. Despite the large volume and relatively small air flow through the calibrated and reference devices, visible decreases in the concentration of radon decay products were observed inside the chamber. Our institute had a climatic chamber with a capacity of 17 m
3. The generation of a thoron atmosphere with a sufficiently high concentration of thoron decay products in a chamber with such capacity required the use of a sufficiently strong source. Due to the short half-life of thoron, the generation of a stable atmosphere in the chamber was ensured by a single injection of nuclides or its short-term transmission from the source. For this purpose, a 50 mL thorium chloride solution was used, in which the actinium (Ac-228) activity was 300 Bq/g. Air was passed through the solution at a rate of 2 L/min, but this stream was filtered, which meant that only thoron could enter the chamber. Then, after approximately 80 h from the beginning of thoron transfer, the potential alpha energy concentration of thoron progeny reached 54 µJ/m
3. Therefore, from the equation, it can be concluded that achieving such a concentration level in a 17 m
3 volume chamber requires a constant supply of thoron to the chamber at a constant activity rate inflow of about 150 Bq/s. During the one-hour calibration procedure, the devices were operated at an air flow rate of 4 L/min and filtration efficiency close to 99%. In such conditions, the decrease in the concentration of potential alpha energy would be small (
Figure 13, left chart). However, if this procedure was repeated three times, the decrease would reach about 5% (
Figure 13, right chart).
Achieving the same level of potential alpha energy concentration for radon decay products in such a chamber would require a source with an efficiency of 0.35 Bq/s (Rn-222).
During the calibration, the average size of generated aerosols was 200–300 nm (candles or 1% NaCl solution), which was larger than the maximum size of ultrafine aerosols and much larger than the average size of the unattached fraction of 1.2 nm [
30], and the corresponding diffusion coefficients were much less. Moreover, the settling time of such aerosols under the influence of gravity was about 140 h from a height of 1–1.5 m, which is a lot, considering the possible calibration time.
Models concerning the occurrence of radon hazards most often refer to radon itself [
31,
32] and less frequently to thoron and its decay products [
9]. However, the examples indicated did not consider changes in these concentrations over time, and as a result of their application, a "picture" of hazards was obtained when the equilibrium state was already achieved and the situation was stabilized. These models also did not take into account the possibility of air filtration. A similar approach to the model described in the paper was used in the publication [
33]. Differential equations were formulated that took into account the possibility of air exchange. However, also in this case, it was limited only to radon and its decay products. Moreover, the possibility of isotope inflow and their filtration was not included in these equations.
5. Conclusions
The presented model makes it possible to calculate the activity concentrations inside such systems if the inflowing activity rate is known. It also considers the influence of devices operating inside, equipped with the filter modules and the outflow of air stream from the system of the defined volume. The solutions can also be applied to objects occurring in an environment of known and limited volume or to evaluate the radon or thoron source capacity by measuring their activity concentration inside the chamber and then fitting the corresponding activity rate to the obtained measurement results.
The differential equations were formulated for the case when radon and thoron nuclides and their decay products flow to a system of a certain volume, and at the same time, an air stream containing these nuclides can flow from it. In addition, it was assumed that there could be air-filtering devices inside this system. All these variants can be used optionally by excluding or including them in calculations, and the results obtained allow the prediction of how both the activity concentrations and the corresponding potential alpha energy concentrations will change over time inside the system. Therefore, it is a flexible model that can be used both for a separate space in the environment (mines, caves, buildings, etc.) and for installations in which devices intended for the assessment of radon (thoron) exposure are calibrated. Some of the results presented in the article show that obtaining stable conditions for device calibration is easier in the case of radon than thoron. If these are active devices, equipped with a filtration system, the installation should be more spacious. Then, however, the thoron source must also have a sufficiently high capacity so that the concentrations inside the installation are stable and sufficiently high. Regardless of whether the thoron flows to the chamber from an external flow-through source and air flows outside with the same flow rate or if there is an emanation thoron source of the same efficiency and the installation is isolated, the activity concentration of thoron will be at the same level. However, in the case of an emanation source, the activity concentrations of the decay products after reaching equilibrium conditions will be, except for Po-216, several times higher. A similar effect in the case of a flow-through source can be achieved when the outflowing air is returned to the installation. An application based on Excel and VBA language was created to support model-based calculations. The developed tool can be used to assess the possibility of a calibration installation, considering its capacity and the type of calibrated devices.


