Abstract
Recent observations have increasingly challenged the conventional understanding of atmospheric NH3 and its potential sources in remote environments. Laboratory studies suggest that the microdroplet redox generation of NH3 could offer an alternative explanation. However, key questions remain: (1) Can microdroplet redox generation of NH3 occur in ambient air? (2) Is it restricted by the presence of specific catalysts? (3) What factors determine the efficiency of ambient NH3 generation via microdroplet redox reactions? We investigate these questions based on adiabatic-expansion-induced perturbation observations performed in various atmospheres over the last decade. Our results indicate the adiabatic-expansion-induced generation of NH3 + HNO3 at ultrafast formation rates, with campaign-dependent stable stoichiometric ratios of HNO3 to NH3, as well as highly variable occurrence frequencies and efficiencies. These findings suggest that microdroplet redox reactions are more likely responsible for the generation of NH3 + HNO3 than conventional atmospheric NH3 chemistry. Moreover, our analysis suggests that the line speed of microdroplets may be one of the key factors in determining the occurrence, stoichiometric ratio and efficiency of the redox reaction. Additionally, the presence of sea salt aerosols and low ambient temperature, rather than the specific catalysts, may significantly influence these processes. However, the current observational data do not allow us to derive a functional relationship between the redox reaction rate and these parameters, nor to fully detail the underlying chemistry. Comprehensive and controlled laboratory experiments, similar to our adiabatic-expansion-induced observations but utilizing state-of-the-art highly sensitive analyzers, would be necessary, though such experiments are beyond our current capabilities.
1. Introduction
Ammonia (NH3) dominates the gas-phase alkaline species in the atmosphere and acts as the major contributor to neutralize atmospheric acids secondarily generated from natural and anthropogenic precursors [1,2,3]. Atmospheric NH3 is widely recognized as being derived from various natural and anthropogenic sources in surface environments on the earth, including chemical fertilizers, livestock, natural soils, oceans, etc. [1,4,5,6]. NH3 is primarily removed from the troposphere through gas–aerosol partitioning, forming ammonium salts, as well as through deposition onto vegetation, water and soil surfaces [1,4]. The slow oxidation of NH3 by OH radicals plays only a minor role in its atmospheric removal [7]. Additionally, recent computational studies on chemical kinetics have shown that although NH3 can participate in reactions forming important atmospheric species such as nitric acid (HNO3) and isocyanic acid, these reactions are unlikely to occur under typical ambient conditions due to the high-activation-energy barriers involved [8,9,10]. However, satellite measurements have detected significant concentrations of NH3 (above 15 pptv) in the upper troposphere and lower stratosphere (UTLS) over the subtropical regions of the southeastern Asian continent (20–30° N, 70–110° E) during the summer monsoon season, along with abundant neutralized NH4NO3 in the UTLS over remote oceanic zones, while the puzzle remains poorly understood [11,12,13]. In addition, whether oceans act as a net source or a net sink for NH3 in remote, clean marine atmospheres is also a topic of ongoing debate [14,15,16,17]. Could these remote atmospheres harbor unrecognized sources of NH3? This question, with its inherent complexity, may extend far beyond the conventional paradigm on NH3 budgets in the atmosphere [18,19].
Excluding the biogenic release of atmospheric NH3, as well as the burning of fossil fuels and biomass, industrial NH3 synthesis on Earth typically requires harsh operating conditions, such as high pressure, high temperature and highly efficient catalysts [1,5]. To circumvent these harsh conditions, there has been significant interest in the electrochemical reduction of NO and N2 [19,20]. However, this process is severely restricted by the lack of efficient catalysts. Recently, Song et al. [18] reported a novel method for generating NH3 under ambient conditions without the application of external electric potential or irradiation, i.e., spraying water microdroplets onto a magnetic iron oxide (Fe3O4) and Nafion-coated graphite mesh using compressed N2 or air. The extremely strong perturbation signals of NH4NO3 reported in the companion paper [21] raise two questions: (1) Does the microdroplet-driven generation of NH3 occur widely in cold, moist ambient air? (2) Is the efficiency of microdroplet ammonia synthesis determined by the line speed of moving droplets, regardless of the presence of specific catalysts?
Nitric acid (HNO3) plays an important role in ozone chemistry, atmospheric nitrogen cycling and the formation of secondary inorganic aerosols [3,22,23]. As one of the end products of nitrogen oxides (NOx), HNO3 is mainly formed through the oxidation of NO2 by OH radical or via heterogeneous hydrolysis of N2O5 in the atmosphere [24,25]. It is typically present in the boundary layer at concentrations of less than 2 ppbv [26,27,28,29]. Due to its low volatility and strong acidity, HNO3 readily reacts with NH3 to form NH4NO3. This gas-to-aerosol conversion is highly efficient and thermodynamically favored under conditions of lower ambient temperature and higher relative humidity, which enhance the partitioning of HNO3 to the particle phase [3].
In this study, we attempt to explore four key issues: (1) Whether the extremely strong perturbation signals of NH4NO3 resulted from the microdroplet redox generation reaction of NH3 and HNO3, followed by perturbation formation of NH4NO3. (2) Whether the microdroplet redox reaction of NH3 and HNO3 is independent of catalysts. (3) Whether the line speed of moving droplets determines the probability for occurring redox reactions of NH3 and HNO3, or the oxidation reactions of HNO3 alone or organic nitrate. (4) What future studies are needed for microdroplet ammonia synthesis and the development of a new paradigm for atmospheric NH3, particularly in marine atmospheres abundant in fast-moving microdroplets?
2. Experimental Section
This study includes data collected from coastal and marine atmospheres during nine distinct campaigns. Campaigns 1–7 were defined identically to those in the companion paper, i.e., four coastal campaigns performed in Qingdao, China, during the heating seasons in 2013, 2015 and 2022 (Campaigns 2–4), as well as the non-heating season in 2013 (Campaign 1), and three marine campaigns as Campaigns 5–7 over the marginal seas of China in November–December 2012, 2013 and July–August 2016 [21], respectively. Campaign 8 was performed at a coastal site <1 km away from that used for Campaign 4, with nine sets of samples collected during the summer of 2019 on 11, 20, 21 July, and 1, 4, 5, 6, 12 and 13 August. The chemical analysis was consistent with that detailed in Yu et al. [30]. In addition, some Nano-MOUDI results from the spring and summer marine campaigns of 2015, as reported by Yu et al. [30], were also referenced for discussion. Campaign 9 was performed over the South China Sea (SCS, a tropical region) from 29 March to 2 May 2017. Eleven sets of Nano-MOUDI samples were collected during the campaign, with two sets intentionally gathered on 15 and 18 April to capture strong self-vessel combustion emissions. The remaining samples were collected on 30 March (en route to the South China Sea from the anchor port), 2, 7, 11, 21, 22, 23, 26, and 29 April. Note that 0.5–1.0% high-sulfur-content diesel was commonly used on research vessels at that time in China.
An Ambient Ion Monitor−Ion Chromatograph (AIM-IC, URG-9000D) was used for simultaneous sampling during Campaign 3 and part of Campaign 4 but not in the other campaigns. Moreover, the E-AIM model was employed to calculate the gas–aerosol partitioning of semi-volatile species [31] (http://www.aim.env.uea.ac.uk/aim/aim.php, last access: 20 January 2025). For the cruise campaigns, meteorological data were obtained from an automatic meteorological station on the vessel. For the coastal campaigns, the meteorological data were download from the China Meteorological Data Service Centre (https://data.cma.cn/, last access: 25 January 2025).
3. Results and Discussion
3.1. Perturbation Formation of Comparable NH4NO3 and Organic Nitrate in Campaigns 8 and 9
In Campaign 8, the strongest perturbation formation of NH4NO3 was detected at a size bin of 0.032–0.056 µm on 20 July 2019 (Figure 1a,b). The existence of higher NH4NO3 concentrations in atmospheric particles within the 0.032–0.056 µm size range, compared to the 0.056–0.10 µm size range with an identical dlogDp value, was theoretically and practically impossible due to the size-dependent Kelvin effect and the universally observed larger surface area of atmospheric particles in the latter size range [3,32]. The Kelvin effect has also been reported to result in higher SO42− concentrations than NO3− in atmospheric particles smaller than 100 nm [33] and did not support that over a one-order-of-magnitude-higher concentration of NO3− (23 neq m−3) than that of SO42− (0.47 neq m−3) observed at 0.032–0.056 µm size range (Figure 1a,c). Surprisingly, the detected molar concentration of NH4+ at that size bin only accounted for approximately 1/4 of the corresponding NO3− concentration. This raised the possibility of the perturbation formation of organic nitrate, which was commonly detected in ambient air [34,35], to account for the NO3− unexplained by NH4+. Organic nitrate might have dissolved into the deionized water and been detected through ion chromatography as NO3−. On the same day, the strong perturbation formation of MSA− was also detected but not for SO42− and DMAH+. On the remaining days of Campaign 8, the substantially weak perturbation formation of particulate nitrate was mostly observed at the 0.018–0.032 µm size bin. Again, the detected amount of NH4+ via perturbation formation was insufficient to explain the corresponding NO3− values.
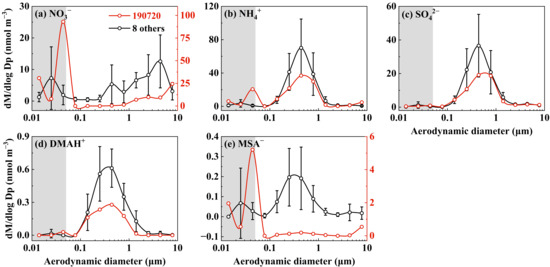
Figure 1.
Molar concentration size distributions of five ions in atmospheric particles collected at a coastal site of Qingdao in 2019 (the data on 20 July are highlighted in red; the data on 11 and 21 July, and 1, 4, 5, 6, 12, 13 August, were averaged and are marked in black; the error bars represent the standard deviation in different samples).
In Campaign 9, the strongest perturbation formation of NH4NO3 was detected at the 0.032–0.056 µm size bin on 21 April 2017 (Figure 2a,b). However, similar to Campaign 8, the detected amount of NH4+ (2.9 neq m−3) in this size range accounted for only about 1/5 of the corresponding NO3−value (15.5 neq m−3). This suggested that approximately 80% of the detected NO3− might have existed as organic nitrate. The same can be said for the perturbation formation of organic nitrate on 15 and 18 April, when the self-vessel combustion plumes were deliberately observed. However, the perturbation signals were substantially weaker on these two days than those on 21 April. On the remaining days, the perturbation signals for NO3− were generally too weak to confirm, and the same was true for SO42− and DMAH+. The lower occurrence frequency of the perturbation formation of NH4NO3 and insufficient amount of NH3 formed could be related to the reduced line speeds of air streams, as discussed in Section 3.4.
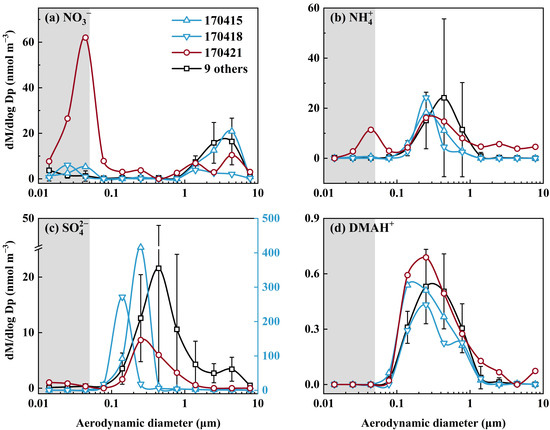
Figure 2.
Molar concentration size distributions of four ions in atmospheric particles collected over the South China Sea in 2017 (the data on 21 April are highlighted in red; the data on 15 and 18 April were featured by largely increased concentrations of SO42− derived from self-vessel combustion and are highlighted in blue; the data on 30 March, 2, 7, 11, 21, 22, 23, 26, 29 April were averaged and are marked in black; the error bars represent the standard deviation in different samples).
3.2. Is Adiabatic Perturbation Alone Sufficient to Explain NO3− and NH4+ Detected in the Last Three Stages of Nano-MOUDI Sampling in Cold Coastal Atmospheres?
To determine whether enhanced gas–aerosol partitioning alone is sufficient to generate the perturbation amount of NH4NO3 in the last three stages of Nano-MOUDI sampling in coastal atmospheres, additional simultaneous measurements of HNO3 and NH3 gases, along with their counterparts in PM2.5, are required. Therefore, the perturbation formation of NH4NO3 during Campaign 3 was selected to examine the hypothesis (Figure 3). To increase the dataset for correlation analysis, two samples collected over the Yellow Sea and the Bohai Sea, taken two and a half months prior to Campaign 3, were also included, as their perturbation characteristics were more similar to those observed in Campaign 3 rather than in other marine campaigns. The strong perturbation formation of particulate NO3− was observed in 5 of 11 samples, with NO3− concentrations in PM0.010–0.056 exceeding those in PM0.056–1.0 by more than double (Figure 3a,b). The perturbation was, however, negligible in 2 out of 11 samples, with the remaining samples falling between these two extremes.
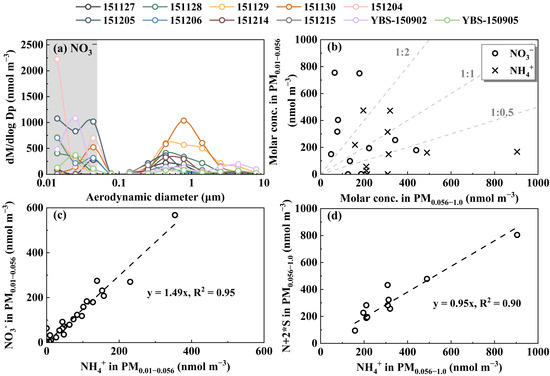
Figure 3.
Molar concentration size distributions of NO3− (a), and correlations between different variables for NO3− and NH4+ in PM0.010–0.056 vs. the corresponding values in PM0.056–1.0 (b), NO3− vs. NH4+ in different sized PM0.010–0.056 (c), and N + 2 * S vs. NH4+ in PM0.056–1.0 (d) during Campaign 3. The letters N and S in (d) represent concentrations of NO3− and SO42−, respectively (YBS-150902 and YBS-150905 samples were collected in marine atmospheres over the Yellow Sea and Bohai Sea during a cruise campaign in September 2015).
As shown in Figure 4 and analyzed in detail below, the perturbation caused by the thermodynamic equilibrium shift alone cannot explain most of the higher concentrations of NO3− in PM0.010–0.056 than the corresponding values in PM2.5, as well as some of NH4+ with higher concentrations in PM0.010–0.056. When gas–aerosol thermodynamic equilibrium analyses were conducted using the particulate concentrations of chemical species measured by the AIM-IC in PM2.5 and by the Nano-MOUDI in PM0.010–3.2, respectively, along with gaseous species measured by the AIM-IC, the modeled results indicated that the gas–aerosol equilibrium was reasonably achieved (Figure 4a,b,d,e). The slightly over-predicted equilibrium concentrations of NO3− and under-predicted NH4+ in PM2.5 might be attributed to the exclusion of NH4Cl and ammonium organics in PM2.5 from the modeling. This argument was supported by the consistent equilibrium concentrations of NO3− and NH4+ in PM0.010–3.2 with the corresponding observed values, which were significantly higher than those in PM2.5. This increase likely reduced the impact of the exclusion on the modeled equilibrium concentrations.
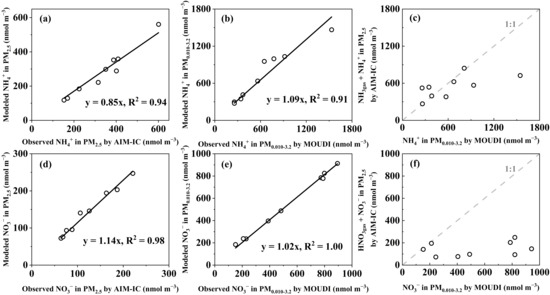
Figure 4.
Correlations between modeled NH4+ vs. observed NH4+ in PM2.5 collected by AIM-IC (a), modeled NH4+ vs. observed NH4+ in PM0.010–3.2 collected by MOUDI (b), (NH3gas + NH4+ in PM2.5) measured by the AIM-IC vs. the corresponding NH4+ in PM0.010–3.2 measured by MOUDI (c), modeled NO3− vs. observed NO3− in PM2.5 collected by AIM-IC (d), modeled NO3− vs. observed NO3− in PM0.010–3.2 collected by MOUDI (e), (HNO3gas + NO3− in PM2.5) measured by the AIM-IC vs. the corresponding NO3− in PM0.010–3.2 measured by MOUDI (f).
With the gas–aerosol thermodynamic equilibria to be achieved, adiabatic-expansion-induced perturbation would cause a shift in the equilibrium, leading to additional gaseous NH3 and HNO3 partitioning into the particle phase (Figure 4c,f). This is clearly demonstrated in Figure 4c, where the concentrations of (NH3gas + NH4+ in PM2.5) measured by the AIM-IC were plotted against the corresponding NH4+ in PM0.010–3.2, with four data points aligning along the 1:1 line. On 14 and 15 December 2015, two data points aligned with the 1:1 line when the concentrations of (HNO3gas + NO3− in PM2.5) measured by the AIM-IC were plotted against the corresponding NO3− in PM0.010–3.2. On these two days, the data points in Figure 4c slightly scattered above the 1:1 line. However, seven out of nine data points in Figure 4f and two out of nine data points in Figure 4c scattered far below the 1:1 line. In these cases, additional ultrafast oxidation and/or redox reactions definitely occurred, resulting in the formation of (HNO3 + NH3) and organic nitrate in the last three-stage sampling.
Based on the size distributions presented in Figure 3a, the maximum NO3− concentration via perturbation formation occurred across various size bins. By considering the sampling flow, the diameters (~200 μm) and numbers of nozzles (2940), the maximum line speed of air streams passing through the last three-stage nozzles can be roughly estimated as ~5 × 10² m s−1. Given this estimation, the observed perturbation formation of NO3− must have occurred at an ultrafast rate, within approximately 1 × 10⁻⁴ s. However, the line speed of air streams should largely decrease after they leave the nozzle outlet. The ultrafast redox and oxidation reactions of NH3, HNO3 and organic nitrate differ from those traditionally recognized reactions in atmospheric chemistry included in various air quality or climate modeling [3]. These reactions likely occurred via microdroplet chemistry when the microdroplets were sprayed at an ultrafast moving speed [18,36,37]. While the contribution of vacuum ionization cannot be entirely ruled out [38], it is likely a minor factor due to the incomplete vacuum condition in the last three stages of MOUDI (~0.4 atm). In addition, NO, one of the gaseous pollutants primarily emitted from vehicle exhaust, industrial plants, or thermal power stations, can be converted to NH3 using three-way catalysts equipped on vehicles [39]. The simultaneously observed concentrations of NO and NO2, as shown in Figure S1, could be sufficient to generate NH3, HNO3 and organic nitrate via microdroplet chemistry; however, we did not measure microdroplets directly. Moreover, there were no significant correlations between the average ambient temperature or relative humidity and the perturbation-formed particulate nitrate (Figure S1). Note that the theory on spontaneous microdroplet redox chemistry has only recently become available [40]. Therefore, it is unsurprising that the unexpectedly high concentrations of NO3− and NH4+ observed at the last three stages cannot be easily explained.
When the concentrations of NO3− in the 0.010–0.056 μm size bins were plotted against the corresponding NH4+ values (Figure 3c), a good correlation was obtained, with a slope of 1.49. This slope also suggested that 1/3 of the observed NO3− via perturbation formation likely existed as organic nitrate. However, the ratio of N + 2 * S to NH4+ in PM0.056–1.0 was 0.95 (Figure 3d), implying that NO3− and SO42− in this size range were primarily associated with NH4+ and were almost completely neutralized.
In addition, some samples exhibited a distinct droplet mode of NO3− at 1–2 μm (Figure S2), conventionally attributed to the fog processing of aerosols [3]. This unique feature suggests the possibility that microdroplet chemistry may have occurred in larger-sized bins for some samples in Campaign 3. Based on the observational data, we artificially assumed that microdroplet chemistry could cause 100% of the positive artifacts in the first four samples collected on 27–30 November 2015. Under this assumption, we surprisingly gained good new correlations as follows (Figure S3): [NH4+]PM2.5 = 0.92 * [NH4+*]PM0.056–3.2, R2 = 0.94, p < 0.01; [SO42−]PM2.5 = 1.02 * [SO42−*]PM0.056–3.2, R2 = 0.97, p < 0.01; [NO3−]PM2.5 = 0.69 * [NO3−*]PM0.056–3.2, R2 = 0.98, p < 0.01. The tested results, however, require further validation in future studies.
3.3. Adiabatic Perturbation Superimposed Ultrafast Formation of Huge Amounts of NH4NO3 and Organic Nitrate at the Last Three Stages of Nano-MOUDI Sampling in Marine Atmospheres
In Campaign 5, the strong perturbation formation of NH4NO3 was observed in 4 out of 14 samples (Figure 5a–c). The maximum perturbations occurred at a size range of 0.032–0.056 µm and 0.018–0.032 µm, respectively. A strong correlation with a unity slope was found when the concentrations of NO3− in PM0.010–0.056 were plotted against corresponding NH4+ concentrations, indicating no detectable perturbation formation of organic nitrate. Although simultaneous measurements of NH3gas and HNO3gas were not available during this period, our observations from the marine atmosphere in April 2018 and December 2019 suggested that the adiabatic perturbation alone cannot account for the observed NH4NO3 formation. Alternatively, ultrafast redox reactions of NH3 and HNO3 were required. During the 2012 cruise campaign, SO42− and NO3− in PM0.056–1.0 appeared to be completely neutralized by NH4+ (Figure 5d).
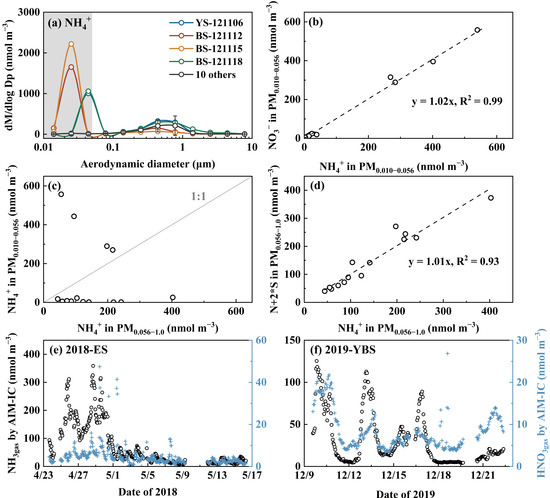
Figure 5.
Molar concentration size distributions of NH4+ (a), NO3− vs. NH4+ in PM0.010–0.056 (b), NH4+ in PM0.010–0.056 vs. that in PM0.056–1.0 (c), N + 2 * S vs. NH4+ in PM0.056–1.0 (d) during Campaign 5; time series of NH3gas and HNO3gas in the marine atmosphere over the East China Sea (ES) measured by the AIM-IC in April 2018 [16] (e), same as (e) but over the Yellow Sea and Bohai Sea (YBS) in December 2019 [41] (f). The letters N and S in (d) represent concentrations of NO3− and SO42−, respectively.
Even stronger perturbation formation of NH4NO3 occurred during Campaign 6 (Figure 6a–c). Again, no detectable organic nitrate was found concurrently with the perturbation formation of NH4NO3 (Figure 6d). It is interesting that the perturbation formation of NH4NO3 was negligible on the first two days (6–7 November 2013) but intensified in the following days, with the maximum perturbation occurring for various size bins. In 8 out of 15 samples in Campaign 6, the perturbation formation of NH4NO3 ≥ 140 µg m−3 (with NO3− reaching 202 ± 71 μg m−3 and NH4+ at 61 ± 4 μg m−3). The substantial amount of NH4NO3 and ~10−4 s residence time of air streams definitely required ultrafast redox reactions of NH3 and HNO3 during sampling. It also indicated that such ultrafast redox reactions of NH3 practically occurred under mild conditions without the need for additional electricity consumption. Unlike in Campaign 5, SO42− and NO3− in PM0.056–1.0 were likely incompletely neutralized by NH4+ in Campaign 6 (Figure 6e).
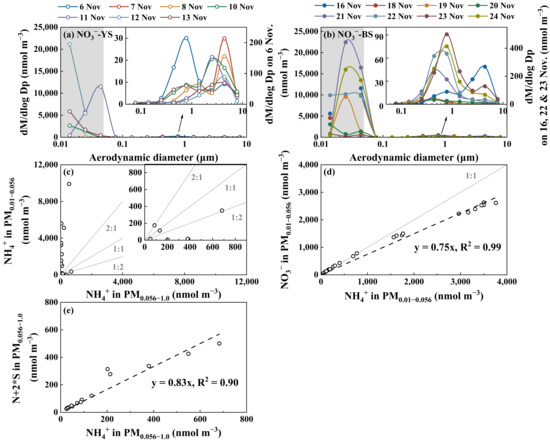
Figure 6.
Molar concentration size distributions of NO3− on 6–13 November 2013 (a), those on 16–24 November 2013 (b), NH4+ in PM0.010–0.056 vs. that in PM0.056–1.0 (c), NO3− in PM0.010–0.056 vs. NH4+ in PM0.010–0.056 (d), N + 2 * S vs. NH4+ in PM0.056–1.0 (e) during Campaign 6. The letters N and S in (e) represent concentrations of NO3− and SO42−, respectively.
3.4. Key Factors in Determining Ultrafast Formation of (HNO3 + NH3) and Organic Nitrate: Evidence and Uncertainties
To comply with the Second Law of thermodynamics, the ultrafast formation of (HNO3 + NH3) and organic nitrate must be driven either by catalytic reactions or by the highly efficient conversion of energy from microdroplet motion into the electrochemical energy required. To investigate the occurrence of catalytic reactions, we compared the chemical comparisons between the 8th-stage and 12th-stage micro-orifice nozzle plates. The internal and external surface chemical compositions of the 8th-stage (S8) and 12th-stage (S12) plates, corresponding to size bins of 0.18–0.32 μm and 0.018–0.032 μm, respectively, are shown in Figure 7. Both plates were primarily composed of aluminum and oxygen, which together accounted for 61–76% of the total weight on internal and external surfaces, followed by sulfur, contributing 5.8% ± 0.7% of the total weight. No significant differences in these major components were detected between the internal and external surfaces of each plate. However, more Fe and Ni were detected on 12th-stage plates, accounting for 6.2% and 3.0% of the total weight, respectively. The role of these minor components as potential catalysts needs further investigation. However, potential catalytic reactions cannot explain the ultrafast formation of (HNO3 + NH3) and organic nitrate being overwhelmed in a certain stage, e.g., Figure 4a and Figure 5b.
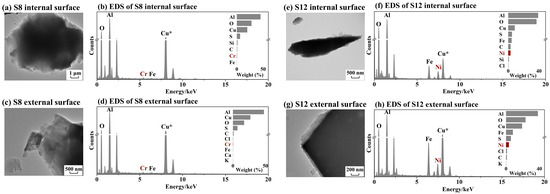
Figure 7.
Morphology and main chemical composition of micro-orifice nozzle plates at S8 and S12: TEM image of internal surface of S8 (a), EDS spectrum of internal surface of S8 (b); the same as (a,b) but of external surface of S8 (c,d), of internal surface of S12 (e,f), and of external surface of S12 (g,h). Asterisk represents that Cu was excluded from the EDS spectrum because of the copper material of TEM grids.
Considering the conversion of energy from microdroplet motion into the electrochemical energy required for microdroplet chemistry, the high line speed of microdroplets might increase the microdroplet surface electric voltage and subsequently enhance ultrafast reactions [42]. Various perturbation levels of NO3− in PM0.010–0.056 under different MOUDI sampling flow rates are, thus, analyzed in Figure 8. The perturbation levels are thoroughly defined in the companion paper [21], i.e., negligible and unconfirmable perturbation formation for levels 0–1, moderate perturbation formation for level 2, strong and extremely strong perturbation formation for levels 3–4. The efficiency of (HNO3 + NH3) and organic nitrate generation expectedly increased with increasing air stream line speed through the nozzles. Additionally, sea salt aerosols and lower ambient temperature may further enhance the ultrafast reactions, as presented below.
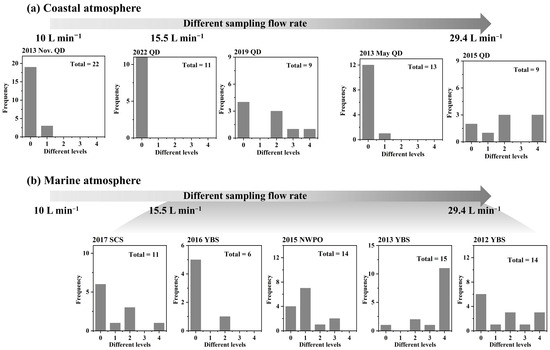
Figure 8.
Different levels of NO3− perturbation formation in size bins 0.010–0.056 μm in coastal atmospheres (a) and marine atmosphere (b).
(1) The efficiency of NH4NO3 perturbation generation via microdroplet chemistry was found to be dependent on the air stream line speed through the nozzles, which was determined by the MOUDI sampling flow rate (Figure 7 and Figure S4). For example, strong to extremely strong perturbation generation was observed during the 2015 coastal campaign and the 2012 and 2013 marine campaigns at a MOUDI (Model 122) flow rate of 29.4 L min−1, corresponding to an air stream nozzle-outlet line speed of at least 5 × 10² m s−1. In contrast, no microdroplet chemistry was detected at a sampling flow rate of 10 L min−1 (using a different MOUDI, Model 125) during the November 2013 coastal campaign. However, the perturbation generation of organic nitrate was likely less influenced by the air stream line speed, as indicated by the presence of NO3− perturbation generation during the 2019 coastal campaign.
(2) The presence of ultrafine sea salt aerosol significantly enhanced the efficiency of perturbation generation for (HNO3 + NH3) and organic nitrate. As illustrated in Figure 8, the frequency of NO3− perturbation generation was higher in marine atmospheres than in coastal atmospheres. Specifically, 29 out of 60 samples collected from marine atmospheres were classified as levels 2–4, whereas only 11 out of 64 samples from coastal atmospheres reached these levels. Additionally, the intensity of perturbation was greater in marine atmospheres, with 12 out of 15 samples falling into levels 3–4 during the 2013 marine campaign, compared to only 3 out of 9 samples during the 2015 coastal campaign.
(3) Higher ambient temperature likely disfavored the perturbation generation of (HNO3 + NH3) and organic nitrate, as evidenced by the absence of NH4NO3 perturbation generation during the May 2013 coastal campaign and the July 2016 marine campaign. However, it is also possible that higher ambient temperatures disfavored gas–aerosol partitioning. In such cases, the microdroplet-generated (HNO3 + NH3) and organic nitrate gases may have passed directly through the nozzles rather than being captured on the filters.
Overall, an innovative and controllable experiment system is necessary to examine the uncertainties. For example, to study the impact of air stream line speed on the efficiency of perturbation generation for (HNO3 + NH3) and organic nitrate, a water microdroplet could be sprayed into a NO2/N2-filled (or NO/NO2/N2-filled) chamber through a nozzle at varying air stream line speeds, with temperature and pressure controlled. Ionic concentrations would be dynamically monitored to observe changes. Additionally, spraying NaCl-containing microdroplets and adjusting the system’s temperature would enable further investigation into the effects of sea salt aerosol and ambient temperature on the efficiency of perturbation generation. Although our current experiments lacked the high temporal resolution to detect dynamic changes in microdroplets, this limitation may not pose a significant issue for the broader research community.
4. Implication
This study reports unique findings on the ultrafast redox reactions of generating substantial amounts of (HNO3 + NH3) or organic nitrate in adiabatic-expanded ambient air within a time scale of approximately 10−4 s. Such ultrafast and highly efficient redox reactions of (HNO3 + NH3) or organic nitrate have definitely not been previously recognized in the atmospheric chemistry community and are not currently included in air quality and climate models. However, these reactions may occur due to microdroplet chemistry under ultrafast moving speeds of microdroplets.
There remain numerous uncertainties regarding these new findings, including the following: (1) Does low ambient temperature enhance the redox reaction of (HNO3 + NH3) or organic nitrate? (2) What factors control the ratio of (HNO3 + NH3) to organic nitrate in the ultrafast redox reactions in addition to the line speeds of microdroplets? (3) To what extent does sea salt aerosol significantly increase the efficiencies of redox reactions via microdroplet generation? (4) Does NH3 generation occur from N2, NO, NO2 or a mixture? (5) Is this process critical for marine nitrogen cycling, particularly given the presence of microdroplets during typhoon periods or strong cumulus convection? This may also apply to the upper atmosphere. (6) Is the NH3 emitted from on-road vehicles generated by ultrafast-moving microdroplets or ambient temperature dependent? (7) Does microdroplet chemistry influence the formation of secondary species in freshly emitted combustion plumes within the initial seconds, and does it proceed in an ambient temperature- and/or RH-dependent way?
Supplementary Materials
The following supporting information can be downloaded at: https://www.mdpi.com/article/10.3390/atmos16050544/s1, Figure S1: Daily average of gases molar concentrations for SO2, O3, NO, NO2 (a), and of temperature and relative humidity (b) in 2015; Figure S2: Molar concentration size distributions for NO3− on 28, 29, and 30 November 2015. The green, orange, and red shaded areas represent the droplet mode fitted by a normal distribution in the size distributions of these three samples; Figure S3: Correlations between ionic concentrations in PM2.5 measured by AIM-IC and those in PM0.056–3.2 measured by MOUDI for NH4+ (a), SO42− (b), and NO3− (c) in the samples collected on 27, 28, 29, and 30 November 2015. NH4+*, SO42−*, and NO3−* in (a–c) represent the corrected concentrations considering the 100% of the positive artifacts of these four samples in MOUDI sampling; Figure S4: Different levels of NH4+ perturbation formation in size bins 0.010–0.056 μm in coastal atmospheres (a) and marine atmosphere (b).
Author Contributions
Conceptualization, X.Y.; methodology, Y.G. (Yating Gao), Q.F., H.S. and Q.Y.; validation, X.Y. and Y.G. (Yating Gao); data curation, X.Y. and Y.G. (Yating Gao); writing—original draft preparation, Y.G. (Yating Gao); writing—review and editing, Q.F., Y.Z., H.S., Q.Y., Y.G. (Yang Gao), H.G. and X.Y.; supervision, X.Y.; funding acquisition, X.Y. All authors have read and agreed to the published version of the manuscript.
Funding
This research was funded by the Natural Science Foundation of China, grant number 42276036, and the Hainan Provincial Natural Science Foundation of China, grant number 422MS098.
Institutional Review Board Statement
Not applicable.
Informed Consent Statement
Not applicable.
Data Availability Statement
The original data presented in the study are openly available at https://data.mendeley.com and should be cited as follows: Gao, Yating; Fan, Qinchu; Zhu, Yujiao; Shen, Hengqing; Yuan, Qi; Gao, Yang; Gao, Huiwang; Yao, Xiaohong (2025), “Nano MOUDI-II sampling data from Qingdao and China’s marginal seas in 2012–2022 (2)”, Mendeley Data, V1, doi: 10.17632/96wn552btc.1.
Conflicts of Interest
The authors declare no conflicts of interest.
Abbreviations
The following abbreviations are used in this manuscript:
| AIM-IC | Ambient Ion Monitor–Ion Chromatograph |
| DMAH+ | particulate dimethylaminium |
| EDS | Energy-Dispersive Spectrometer |
| ES | the East China Sea |
| E-AIM | Extended AIM Aerosol Thermodynamics Model |
| MSA− | particulate methanesulfonic acid |
| Nano MOUDI-II | Nano Micro-Orifice Uniform-Deposit Impactor, second generation |
| N + 2 * S | the sum of the molar concentration of nitrate and twice the molar concentration of sulfate |
| PM2.5 | particulate matter with the aerodynamic diameter below 2.5 μm collected by AIM-IC |
| PM0.010–0.056/PM0.010–3.2/PM0.056–1.0/PM0.056–3.2 | particulate matter with the aerodynamic diameter of 0.010–0.056/0.010–3.2/0.056–1.0/0.056–3.2 μm collected by Nano MOUDI-II |
| SCS | the South China Seat |
| S8/S12 | the 8th or 12th stage of Nano MOUDI-II |
| TEM | Transmission Electron Microscope |
| UTLS | upper troposphere and lower stratosphere |
| YBS | the Yellow Sea and the Bohai Sea |
References
- Behera, S.N.; Sharma, M.; Aneja, V.P.; Balasubramanian, R. Ammonia in the atmosphere: A review on emission sources, atmospheric chemistry and deposition on terrestrial bodies. Environ. Sci. Pollut. R 2013, 20, 8092–8131. [Google Scholar] [CrossRef]
- Peng, J.; Hu, M.; Shang, D.; Wu, Z.; Du, Z.; Tan, T.; Wang, Y.; Zhang, F.; Zhang, R. Explosive secondary aerosol formation during severe haze in the North China Plain. Environ. Sci. Technol. 2021, 55, 2189–2207. [Google Scholar] [CrossRef] [PubMed]
- Seinfeld, J.H.; Pandis, S.N. Atmospheric Chemistry and Physics: From Air Pollution to Climate Change, 3rd ed.; John Wiley & Sons, Inc.: Hoboken, NJ, USA, 2016. [Google Scholar]
- Altieri, K.E.; Fawcett, S.E.; Hastings, M.G. Reactive nitrogen cycling in the atmosphere and ocean. Annu. Rev. Earth Planet. Sci. 2021, 49, 523–550. [Google Scholar] [CrossRef]
- Lan, Z.; Lin, W.; Zhao, G. Sources, Variations, and effects on air quality of atmospheric ammonia. Curr. Pollut. Rep. 2024, 10, 40–53. [Google Scholar] [CrossRef]
- Nair, A.A.; Yu, F. Quantification of atmospheric ammonia concentrations: A review of its measurement and modeling. Atmosphere 2020, 11, 1092. [Google Scholar] [CrossRef]
- Renard, J.J.; Calidonna, S.E.; Henley, M.V. Fate of ammonia in the atmosphere—A review for applicability to hazardous releases. J. Hazard. Mater. 2004, 108, 29–60. [Google Scholar] [CrossRef]
- Parandaman, A.; Tangtartharakul, C.B.; Kumar, M.; Francisco, J.S.; Sinha, A. A computational study investigating the energetics and kinetics of the HNCO + (CH3)2NH reaction catalyzed by a single water molecule. J. Phys. Chem. A 2017, 121, 8465–8473. [Google Scholar] [CrossRef]
- Arathala, P.; Musah, R.A. Catalytic effect of water and formic acid on the reaction of carbonyl sulfide with dimethyl amine under tropospheric conditions. Phys. Chem. Chem. Phys. 2021, 23, 8752–8766. [Google Scholar] [CrossRef]
- Sarkar, S.; Bandyopadhyay, B. Theoretical investigation of the relative impacts of water and ammonia on the tropospheric conversion of N2O5 to HNO3. Phys. Chem. Chem. Phys. 2021, 23, 6651–6664. [Google Scholar] [CrossRef]
- Froyd, K.D.; Murphy, D.M.; Sanford, T.J.; Thomson, D.S.; Wilson, J.C.; Pfister, L.; Lait, L. Aerosol composition of the tropical upper troposphere. Atmos. Chem. Phys. 2009, 9, 4363–4385. [Google Scholar] [CrossRef]
- Ge, C.; Zhu, C.; Francisco, J.S.; Zeng, X.C.; Wang, J. A molecular perspective for global modeling of upper atmospheric NH3 from freezing clouds. Proc. Natl. Acad. Sci. USA 2018, 115, 6147–6152. [Google Scholar] [CrossRef]
- Höpfner, M.; Volkamer, R.; Grabowski, U.; Grutter, M.; Orphal, J.; Stiller, G.; von Clarmann, T.; Wetzel, G. First detection of ammonia (NH3) in the Asian summer monsoon upper troposphere. Atmos. Chem. Phys. 2016, 16, 14357–14369. [Google Scholar] [CrossRef]
- Altieri, K.E.; Spence, K.A.M.; Smith, S. Air-sea ammonia fluxes calculated from high-resolution summertime observations across the Atlantic Southern Ocean. Geophys. Res. Lett. 2021, 48, e2020GL091963. [Google Scholar] [CrossRef]
- Bouwman, A.F.; Lee, D.S.; Asman, W.A.H.; Dentener, F.J.; Van Der Hoek, K.W.; Olivier, J.G.J. A global high-resolution emission inventory for ammonia. Glob. Biogeochem. Cycles 1997, 11, 561–587. [Google Scholar] [CrossRef]
- Chen, D.; Yao, X.; Chan, C.K.; Tian, X.; Chu, Y.; Clegg, S.L.; Shen, Y.; Gao, Y.; Gao, H. Competitive uptake of dimethylamine and trimethylamine against ammonia on acidic particles in marine atmospheres. Environ. Sci. Technol. 2022, 56, 5430–5439. [Google Scholar] [CrossRef] [PubMed]
- Paulot, F.; Jacob, D.J.; Johnson, M.; Bell, T.G.; Baker, A.R.; Keene, W.C.; Lima, I.D.; Doney, S.C.; Stock, C.A. Global oceanic emission of ammonia: Constraints from seawater and atmospheric observations. Glob. Biogeochem. Cycles 2015, 29, 1165–1178. [Google Scholar] [CrossRef]
- Song, X.; Basheer, C.; Zare, R.N. Making ammonia from nitrogen and water microdroplets. Proc. Natl. Acad. Sci. USA 2023, 120, e1993761176. [Google Scholar] [CrossRef]
- Zhang, L.; Zhou, Q.; Liang, J.; Yue, L.; Li, T.; Luo, Y.; Liu, Q.; Li, N.; Tang, B.; Gong, F.; et al. Enhancing electrocatalytic NO reduction to NH3 by the CoS nanosheet with sulfur vacancies. Inorg. Chem. 2022, 61, 8096–8102. [Google Scholar] [CrossRef]
- Liu, Q.; Xu, T.; Luo, Y.; Kong, Q.; Li, T.; Lu, S.; Alshehri, A.A.; Alzahrani, K.A.; Sun, X. Recent advances in strategies for highly selective electrocatalytic N2 reduction toward ambient NH3 synthesis. Curr. Opin. Electrochem. 2021, 29, 100766. [Google Scholar] [CrossRef]
- Gao, Y.; Yao, X. An adiabatic-expansion-induced perturbation study on gas-aerosol partitioning in ambient air—Dimethylamine and trimethylamine (1). 2025. Unpublished work.
- Neuman, J.A.; Gao, R.S.; Fahey, D.W.; Holecek, J.C.; Ridley, B.A.; Walega, J.G.; Grahek, F.E.; Richard, E.C.; McElroy, C.T.; Thompson, T.L.; et al. In situ measurements of HNO3, NOy, NO, and O3 in the lower stratosphere and upper troposphere. Atmos. Environ. 2001, 35, 5789–5797. [Google Scholar] [CrossRef]
- Xu, M.; Kasahara, K.; Sorimachi, A.; Matsuda, K. Nitric acid dry deposition associated with equilibrium shift of ammonium nitrate above a forest by long-term measurement using relaxed eddy accumulation. Atmos. Environ. 2021, 256, 118454. [Google Scholar] [CrossRef]
- Tie, X.; Emmons, L.; Horowitz, L.; Brasseur, G.; Ridley, B.; Atlas, E.; Stround, C.; Hess, P.; Klonecki, A.; Madronich, S.; et al. Effect of sulfate aerosol on tropospheric NOx and ozone budgets: Model simulations and TOPSE evidence. J. Geophys. Res. Atmos. 2003, 108, 8364. [Google Scholar] [CrossRef]
- Takegawa, N.; Kondo, Y.; Koike, M.; Chen, G.; Machida, T.; Watai, T.; Blake, D.R.; Streets, D.G.; Woo, J.H.; Carmichael, G.R.; et al. Removal of NO and NO in Asian outflow plumes: Aircraft measurements over the western Pacific in January 2002. J. Geophys. Res. Atmos. 2004, 109, D23S04. [Google Scholar] [CrossRef]
- Kita, K.; Morino, Y.; Kondo, Y.; Komazaki, Y.; Takegawa, N.; Miyazaki, Y.; Hirokawa, J.; Tanaka, S.; Thompson, T.L.; Gao, R.; et al. A chemical ionization mass spectrometer for ground-based measurements of nitric acid. J. Atmos. Ocean. Tech. 2006, 23, 1104–1113. [Google Scholar] [CrossRef]
- Nojiri, R.; Osada, K.; Kurosaki, Y.; Matsuoka, M.; Sadanaga, Y. Variations in gaseous nitric acid concentrations at Tottori, Japan: Long-range transport from the Asian continent and local production. Atmos. Environ. 2022, 274, 118988. [Google Scholar] [CrossRef]
- Kim, K.; Lee, C.; Choi, D.; Han, S.; Eom, J.; Han, J. A study on the formation reactions and conversion mechanisms of HONO and HNO3 in the atmosphere of Daejeon, Korea. Atmosphere 2024, 15, 267. [Google Scholar] [CrossRef]
- Wespes, C.; Hurtmans, D.; Herbin, H.; Barret, B.; Turquety, S.; Hadji-Lazaro, J.; Clerbaux, C.; Coheur, P. First global distributions of nitric acid in the troposphere and the stratosphere derived from infrared satellite measurements. J. Geophys. Res. Atmos. 2007, 112, D13311. [Google Scholar] [CrossRef]
- Yu, P.; Hu, Q.; Li, K.; Zhu, Y.; Liu, X.; Gao, H.; Yao, X. Characteristics of dimethylaminium and trimethylaminium in atmospheric particles ranging from supermicron to nanometer sizes over eutrophic marginal seas of China and oligotrophic open oceans. Sci. Total Environ. 2016, 572, 813–824. [Google Scholar] [CrossRef]
- Clegg, S.L.; Kleeman, M.J.; Griffin, R.J.; Seinfeld, J.H. Effects of uncertainties in the thermodynamic properties of aerosol components in an air quality model—Part 1: Treatment of inorganic electrolytes and organic compounds in the condensed phase. Atmos. Chem. Phys. 2008, 8, 1057–1085. [Google Scholar] [CrossRef]
- Kittelson, D.B. Engines and nanoparticles: A review. J. Aerosol Sci. 1998, 29, 575–588. [Google Scholar] [CrossRef]
- Cass, G.R.; Hughes, L.A.; Bhave, P.; Kleeman, M.J.; Allen, J.O.; Salmon, L.G. The chemical composition of atmospheric ultrafine particles. Philos. Trans. R. Soc. A 2000, 358, 2581–2592. [Google Scholar] [CrossRef]
- Gaffney, J.S.; Marley, N.A. The impacts of peroxyacetyl nitrate in the atmosphere of megacities and large urban areas: A historical perspective. Acs Earth Space Chem. 2021, 5, 1829–1841. [Google Scholar] [CrossRef]
- Liu, T.; Wang, Y.; Cai, H.; Wang, H.; Zhang, C.; Chen, J.; Dai, Y.; Zhao, W.; Li, J.; Gong, D.; et al. Complexities of peroxyacetyl nitrate photochemistry and its control strategies in contrasting environments in the Pearl River Delta region. Npj Clim. Atmos. Sci. 2024, 7, 116. [Google Scholar] [CrossRef]
- Heindel, J.P.; LaCour, R.A.; Head-Gordon, T. The role of charge in microdroplet redox chemistry. Nat. Commun. 2024, 15, 3670. [Google Scholar] [CrossRef]
- Yuan, X.; Zhang, D.; Liang, C.; Zhang, X. Spontaneous reduction of transition metal ions by one electron in water microdroplets and the atmospheric implications. J. Am. Chem. Soc. 2023, 145, 2800–2805. [Google Scholar] [CrossRef] [PubMed]
- Qin, Y.; Wingen, L.M.; Finlayson-Pitts, B.J. Toward a molecular understanding of the surface composition of atmospherically relevant organic particles. Proc. Natl. Acad. Sci. USA 2022, 119, e2085833177. [Google Scholar] [CrossRef] [PubMed]
- Liu, T.; Wang, X.; Wang, B.; Ding, X.; Deng, W.; Lü, S.; Zhang, Y. Emission factor of ammonia (NH3) from on-road vehicles in China: Tunnel tests in urban Guangzhou. Environ. Res. Lett. 2014, 9, 64027. [Google Scholar] [CrossRef]
- Lee, J.K.; Samanta, D.; Nam, H.G.; Zare, R.N. Micrometer-sized water droplets induce spontaneous reduction. J. Am. Chem. Soc. 2019, 141, 10585–10589. [Google Scholar] [CrossRef]
- Chen, D.; Shen, Y.; Wang, J.; Gao, Y.; Gao, H.; Yao, X. Mapping gaseous dimethylamine, trimethylamine, ammonia, and their particulate counterparts in marine atmospheres of China’s marginal seas—Part 1: Differentiating marine emission from continental transport. Atmos. Chem. Phys. 2021, 21, 16413–16425. [Google Scholar] [CrossRef]
- Xiong, H.; Lee, J.K.; Zare, R.N.; Min, W. Strong electric field observed at the interface of aqueous microdroplets. J. Phys. Chem. Lett. 2020, 11, 7423–7428. [Google Scholar] [CrossRef]
Disclaimer/Publisher’s Note: The statements, opinions and data contained in all publications are solely those of the individual author(s) and contributor(s) and not of MDPI and/or the editor(s). MDPI and/or the editor(s) disclaim responsibility for any injury to people or property resulting from any ideas, methods, instructions or products referred to in the content. |
© 2025 by the authors. Licensee MDPI, Basel, Switzerland. This article is an open access article distributed under the terms and conditions of the Creative Commons Attribution (CC BY) license (https://creativecommons.org/licenses/by/4.0/).