Article

Environmental Monitoring in Uranium Deposit and Indoor Radon Survey in Settlements Located near Uranium Mining Area, South Kazakhstan

1
Scientific Research Institute of Radiobiology and Radiation Protection, NJSC “Astana Medical University”, Astana 010000, Kazakhstan
2
Department of Medical Genetics and Molecular Biology, NJSC “Astana Medical University”, Astana 010000, Kazakhstan
*
Author to whom correspondence should be addressed.
Atmosphere 2025, 16(5), 536; https://doi.org/10.3390/atmos16050536
Submission received: 17 March 2025 / Revised: 24 April 2025 / Accepted: 27 April 2025 / Published: 1 May 2025

Abstract

:
In the late 1960s, a uranium province was explored in the Shu-Sarysu depression in southern Kazakhstan. These mining operations can lead to potential contamination of the environment and pose health risks to the population. The aim of this study is to carry out environmental monitoring in uranium deposits and assess indoor radon levels in settlements located in the uranium mining area in the southern region of Kazakhstan. Elevated outdoor ambient equivalent dose rates (0.5–1.2 µSv/h) were detected beyond the buffer zone, particularly near a preserved self-flowing well, where the highest activity concentrations of natural radionuclides were recorded (226Ra—2350 Bq/kg, 232Th—270 Bq/kg, 40K—860 Bq/kg), exceeding background levels. Indoor ambient equivalent dose rates in the settlements of Taukent, Zhuantobe, Tasty, and Shu ranged from 0.04 to 0.15 μSv/h, while outdoor levels varied from 0.03 to 0.1 μSv/h, remaining within global and regional average values. Radon concentrations were highest in Tasty and Shu but did not exceed the permissible level. However, Shu exhibited the highest radiation exposure dose (>4 mSv/y), approaching the lower range of recommended action levels (3–10 mSv/y). These findings highlight the necessity for continuous monitoring and potential mitigation strategies in areas with naturally elevated radiation levels.

1. Introduction

Humans have always been subjected to natural radiation from both internal and external sources. Since geological and geographical factors primarily influence natural environmental radiation, the dose rates of cosmic and terrestrial radiation can vary significantly depending on the location of the measurements [1]. Among all sources of background radiation that deliver significant doses to the tissues or cells of the respiratory tract, the inhaled radon progeny is dominant. Radon (Rn) is a decay product of radium (Ra), which is a member of the uranium (U) decay chain. The physical and chemical properties of radon, such as its colorless, odorless, and tasteless radioactive nature, make it difficult to detect without special equipment [2,3]. Three radioactive series are the primary sources of radon: 222Rn originates from the 238U series, 220Rn from the 232Th series, and 219Rn from the 235U series [4].
The first industrial uranium deposit in Kazakhstan (Kordai) was explored in 1951. The most significant discoveries were made later. In the late 1960s, a uranium province was explored in the Shu-Sarysu and Ili depressions in southern Kazakhstan, which became the world’s largest uranium ore reserves. According to these discoveries, Kazakhstan became a global leader in explored uranium reserves suitable for in-situ leaching (ISL) [5].
Among the Central Asian countries, Kazakhstan has the strongest economy and a fast-increasing uranium production. It is estimated that approximately 20% of the world’s uranium reserves are in Kazakhstan [6]. Kazakhstan holds 67% of the world’s explored uranium reserves suitable for ISL. Consequently, NAC Kazatomprom possesses a unique resource base, including the world’s largest explored and prospective uranium reserves. Extraction of 100% of these reserves can be done using the ISL method.
The uranium deposits identified in Kazakhstan vary in formation conditions and practical significance. Based on geological similarities, genetic characteristics, and territorial distinctiveness, Kazakhstan’s deposits can be classified into six uranium-bearing provinces: Shu-Sarysu, Syrdarya, North Kazakhstan, Pre-Caspian, Pre-Balkhash, and Ili provinces [7]. Currently, out of 56 explored deposits with balance reserves of uranium, 14 are being developed, while the remaining 42 are in reserve [8].
In-situ leaching is the most environmentally friendly and virtually waste-free method of extracting and initially processing radioactive raw materials. This method eliminates the need for ore and rock mass extraction to the surface, the creation of waste rock dumps and tailing storage facilities for hydrometallurgical ore processing, the discharge of contaminated underground drainage water into surface water bodies, and air pollution with dust (from open pits, dumps, and roads) and harmful gases (such as nitrogen oxides) [9].
Essentially, all the technological impact of in-situ leaching is confined to the ore-hosting aquifers, where natural formation waters are replaced by productive working solutions during operation. Upon completion of metal extraction, these solutions transform into so-called “residual” solutions. Both working and residual solutions exhibit high acidity or alkalinity, as well as elevated concentrations of uranium (industrial levels in working solutions and non-industrial levels in residual solutions) and several accompanying elements such as selenium, vanadium, tungsten, molybdenum, and others [10].
The main objective of this study is to carry out environmental monitoring in uranium deposits and assess indoor radon levels in settlements located in the uranium mining area in the southern region of Kazakhstan.

2. Materials and Methods
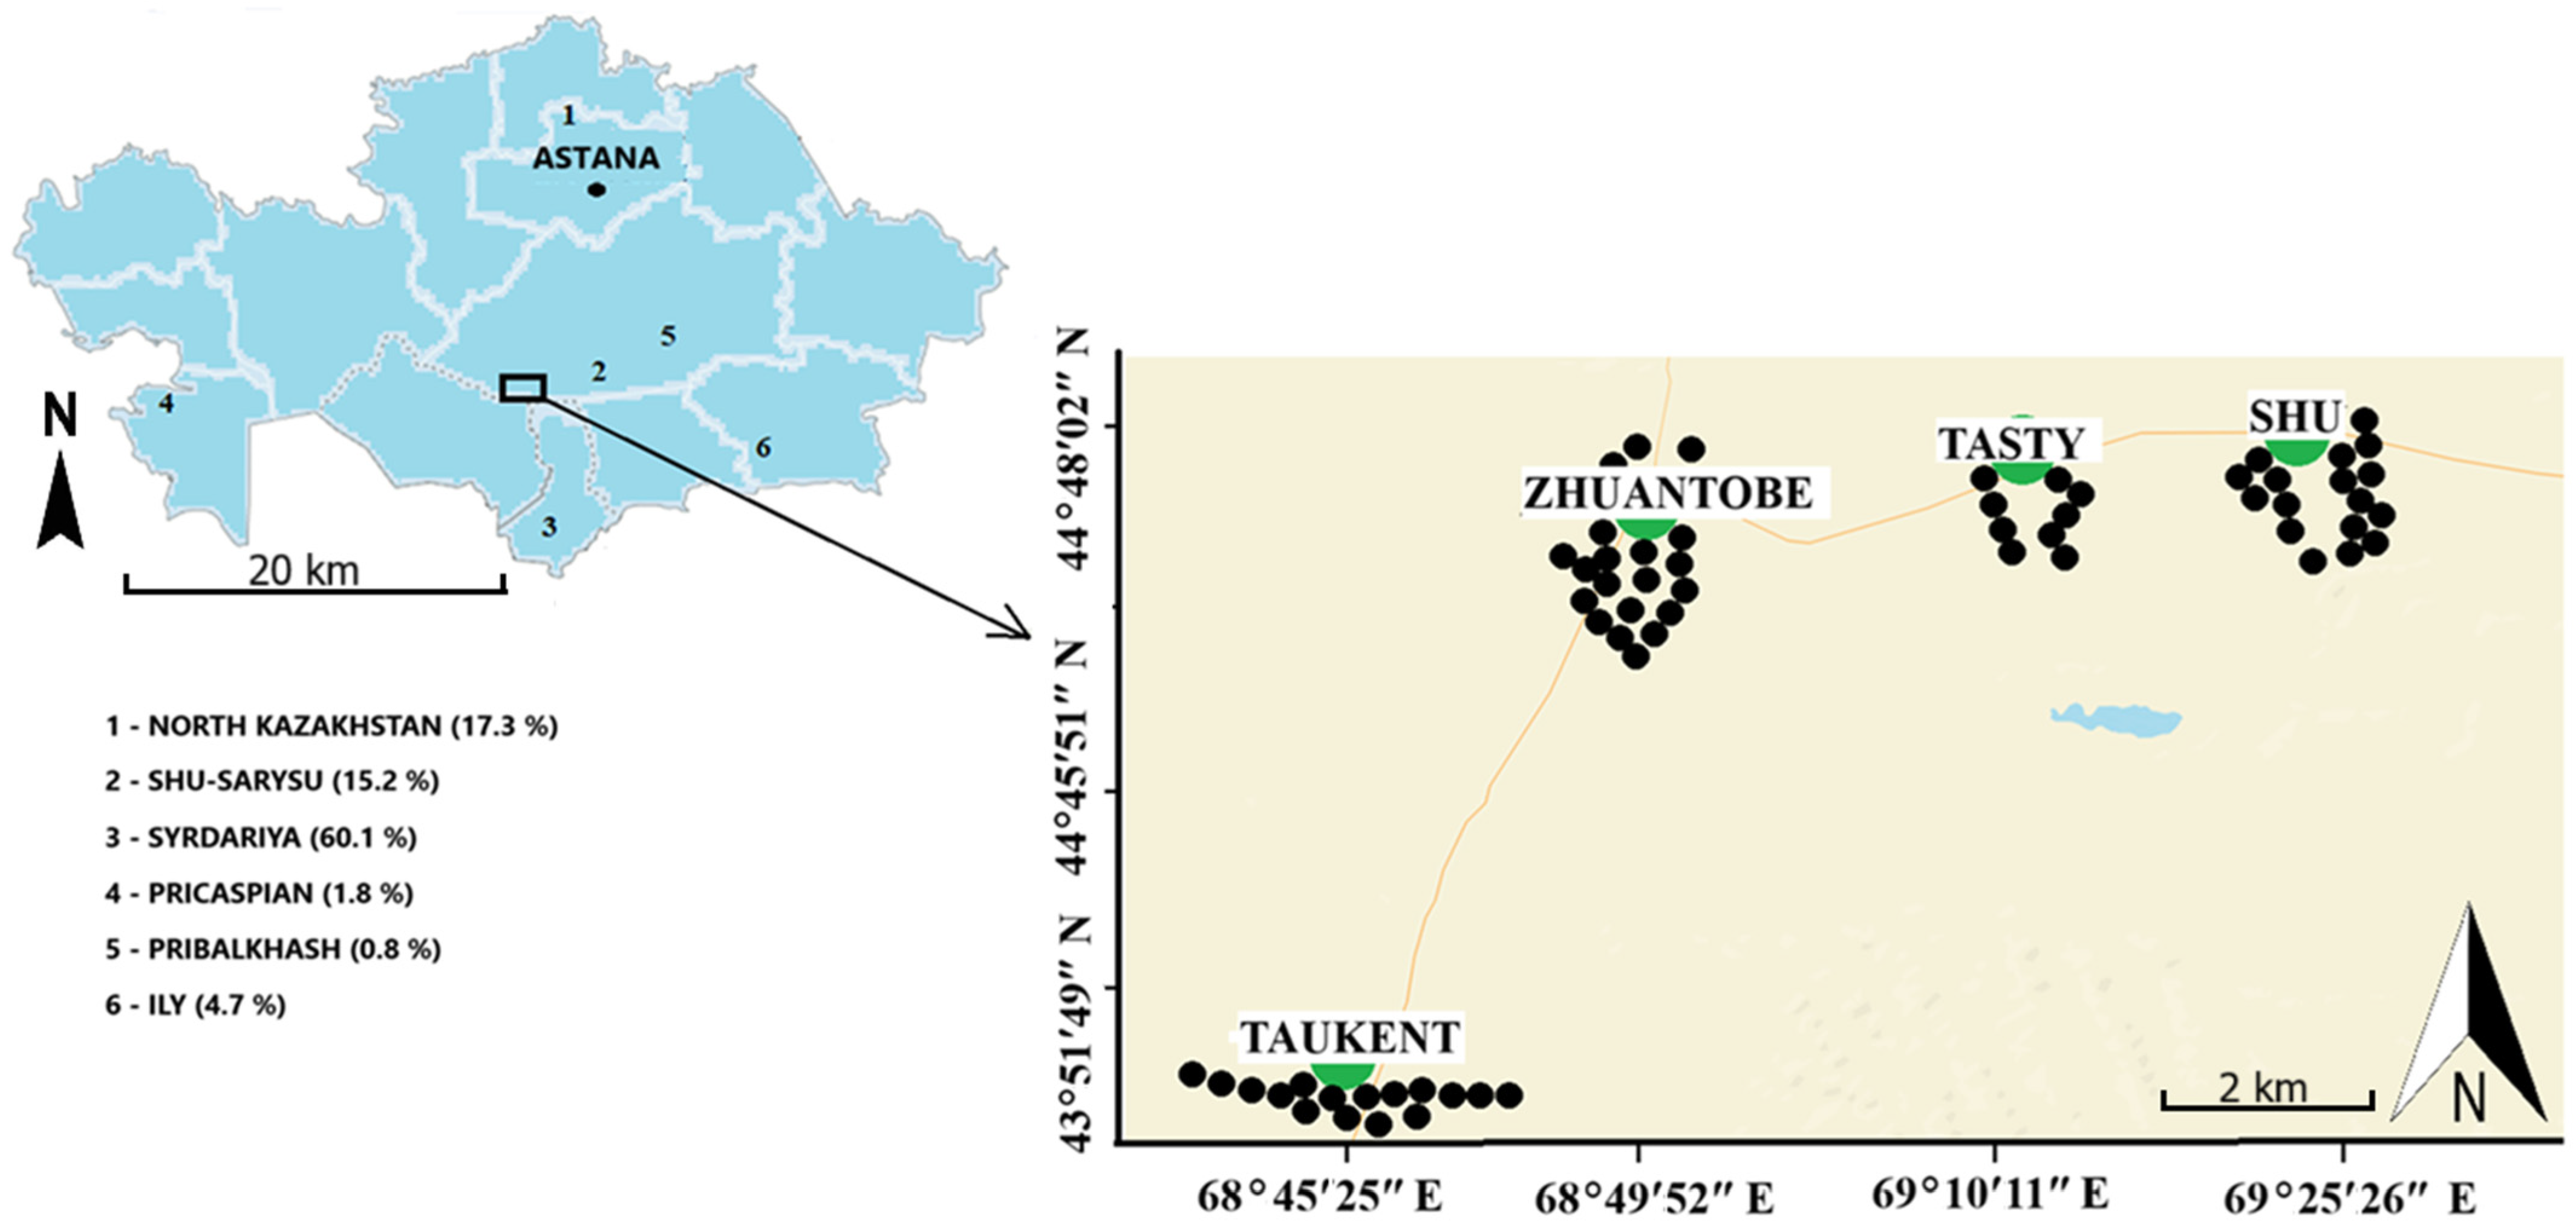
2.1. Study Area

The research area of the Shu-Sarysu uranium ore province is situated in South Kazakhstan (which includes three regions: Turkestan, Kyzylorda, and Zhambyl) and measures up to 250 km in width, extending for at least 600 km from the foothills of the Tien Shan Mountains to the SE and south to the flats of the Aral Sea depression to the NW (Figure 1).
Yazikov [11] describes a total record of 973,000 tU for the basin. Most deposits occur in two districts in the basin: the Kenze–Budenovskaya district in the central western part and the Uvanas–Kanzhugan district in the central southern part. Mineralization is controlled by dynamic redox fronts in arenaceous strata, mainly as the roll front sandstone type and less commonly as the tabular sandstone type [12]. Uranium ore in the Shu–Sarysu Basin is mainly monometallic, although, locally, some areas contain rhenium and/or selenium in sufficiently high enough grades to warrant mining [13]. Deposits comprise several individual orebodies disconnected by barren or weakly mineralized ground. In situ, ore has grades in the range <0.01–0.4% U and locally higher, while average deposit grades vary from 0.02 to 0.07% U [14].
Examination was conducted in 4 settlements (Figure 1) in the Turkestan region in the south of Kazakhstan. Dwellings for the population are constructed from mud and bricks. The main occupation of the population in these settlements is growing agricultural crops, and livestock herding is one of the main activities in these areas. A summary of investigated settlements and the number of radiation measurements conducted in the south region of Kazakhstan is described in Table 1.

2.2. Gamma Fields Measurements

The number of gamma field measurements conducted outdoors and indoors is presented in Table 1. Measurements were taken at a height of 1 m above the ground. For these measurements, the survey locations were divided into five points corresponding to the main geographical directions: North, South, East, West, and the center. Approximately 20 readings were collected at various points within each settlement [15]. However, to measure outdoor and indoor gamma field settlement, buildings were selected randomly. Preferentially, the ground level was mixed (grassy and covered with stones). Readings were obtained in the middle of the day. These measurements were carried out during the autumn months, September to October 2024.
Table 1 presents the number of investigated sites. Outdoor gamma fields were measured in terms of ambient equivalent dose rates ( H ˙ (10)) at 1m above the soil surface. Depending on the dimensions of the rooms, gamma radiation was measured at 8–10 spots at 1 m above the floor, and an average of the results was taken. The dose rate was measured outdoors at a distance of 5 m from the outer walls, at a height of 1 m at 8–10 points, and the average of these measurements was then taken into account. Measurements were performed with dosimeters DKS-AT-1123 (ATOMTEX Scientific Production Unitary Enterprise, Minsk, Republic of Belarus) and MKS-AT-1117M (ATOMTEX Scientific Production Unitary Enterprise, Minsk, Republic of Belarus). The instrumental relative uncertainty of dosimeters DKS-AT-1123 is 25%. All measurements were done according to IAEA Guidelines [16]. The relative uncertainty of H ˙ (10) estimation, taking into account repeatability of in-situ measurements MKS-AT-1117M, was about 20%.

2.3. Determination of Natural Radionuclides in the Soils of the Study Area

Soil samples were collected from territories of uranium deposits beyond the buffer zone exhibiting elevated gamma radiation and randomly selected dwelling territories within the settlements, as well as from background locations for comparison. Sampling was conducted using a clean plastic scoop, and approximately 2 kg of soil was collected from each site and stored in polyethylene bags.
In the laboratory, the samples underwent a pre-treatment process before analysis. Organic materials, roots, vegetation, and pebbles, if present, were removed. The samples were initially air-dried by spreading them in trays and subsequently oven-dried at 110 °C for up to 24 h until a constant dry weight was achieved. To allow secular equilibrium between progenies of the 238U and 232Th decay series, the dried samples were sealed in standard Marinelli plastic beakers and stored for 30 days, following the guidelines of the International Atomic Energy Agency (IAEA) on radionuclide measurements in food and the environment [17].
The activity concentrations of 226Ra, 232Th, and 40K in the soil samples were determined using a Progress-BG beta–gamma spectrometer equipped with a 6.3 cm × 6.3 cm NaI(Tl) detector (SIE Doza, Moscow, Russia). The detector operated within an energy range of 0.2 to 2.8 MeV and had an energy resolution of 9% at the 662 keV peak of 137Cs. Minimum detectable specific activities in standard geometry are 8 Bq/kg for 232Th and 226Ra and 40 Bq/kg for 40K. A high-voltage power supply provided the necessary bias to the detection system. Data acquisition and analysis of gamma-emitting radionuclides were performed using a multichannel analyzer (MCA) and PCA software.

Soil Sampling Depth Rationale

In locations where elevated gamma dose rates were identified, soil samples were collected at two depth intervals: 0–5 cm and 5–10 cm. These intervals were selected to evaluate the distribution of radionuclides within the surface soil layer, which is most susceptible to contamination from historical mining activities. The 0–5 cm layer captures radionuclides deposited through atmospheric fallout, wind-blown tailings, and surface runoff, which are typical dispersal pathways in legacy uranium mining regions. The 5–10 cm layer was chosen to assess the initial downward migration of radionuclides and to determine whether surface contamination has begun to penetrate the subsurface, potentially affecting groundwater or deeper soil systems. These two intervals provide a practical yet informative profile of radionuclide distribution while maintaining consistency across multiple sampling locations.

2.4. Measurement of Radon in the Indoor Air

The Equivalent Equilibrium Radon Concentration (EERC) of radon in indoor air was determined using the AlphaRad Plus portable radon monitor, a high-sensitivity device designed for real-time detection and quantification of radon gas [18]. The AlphaRad Plus radon monitor uses a semiconductor detector to measure EERC. The AlphaRad Plus monitor detects alpha particles emitted from radon and its short-lived progeny (218Po and 214Po), allowing for the determination of radon concentration and the calculation of EERC. The EERC represents the activity concentration of radon progeny in equilibrium with radon gas in air, expressed in Bq/m3. Based on manufacturer specifications and typical measurement conditions, the MDA for the AlphaRad Plus in measuring EERC of radon in indoor air is approximately 5–10 Bq/m3. Measurements were done in accordance with ASTM D6327-10 [19].
To assess indoor radon concentration, the EERC of radon was measured. The EERC of radon represents the concentration of short-lived radon progeny (decay products) in air, expressed in units of Bq/m3, and is used to estimate the radiation dose more accurately in environments where equilibrium between radon gas and its progeny may not be fully established. The EERC was derived using the following relation:
E E R C = C R n × F
where
C R n is the measured radon concentration in Bq/m3, and
F is the equilibrium factor, typically assumed to be 0.4 for residential indoor environments according to UNSCEAR recommendations [15].
The EERC of the radon parameter provides a more realistic basis for calculating the annual effective dose, since most of the radiation dose from inhaled radon arises from its decay products rather than the radon gas itself.

2.5. Radiation Dose Assessment from Indoor Radon

Internal exposure to radon occurs primarily through inhalation of radon gas and its radioactive decay products (radon progeny). Assessing radiation dose from EERC is critical for evaluating health risks and is carried out according to the following formula:
E R n = E E R C × O × T × D C F
where
E E R C is the Equivalent Equilibrium Radon Concentration in Bq/m3;
O is the occupancy factor, representing the fraction of time spent indoors (e.g., O = 0.8 for residential premises);
T is the total hours per year (T = 8760 h/y);
DCF (dose conversion factor) is 9 nSv (Bq/h m3), [15].

2.6. Statistical Analysis

All data analysis was performed using OriginLab 2021 software for checking the data distribution.

3. Results and Discussions

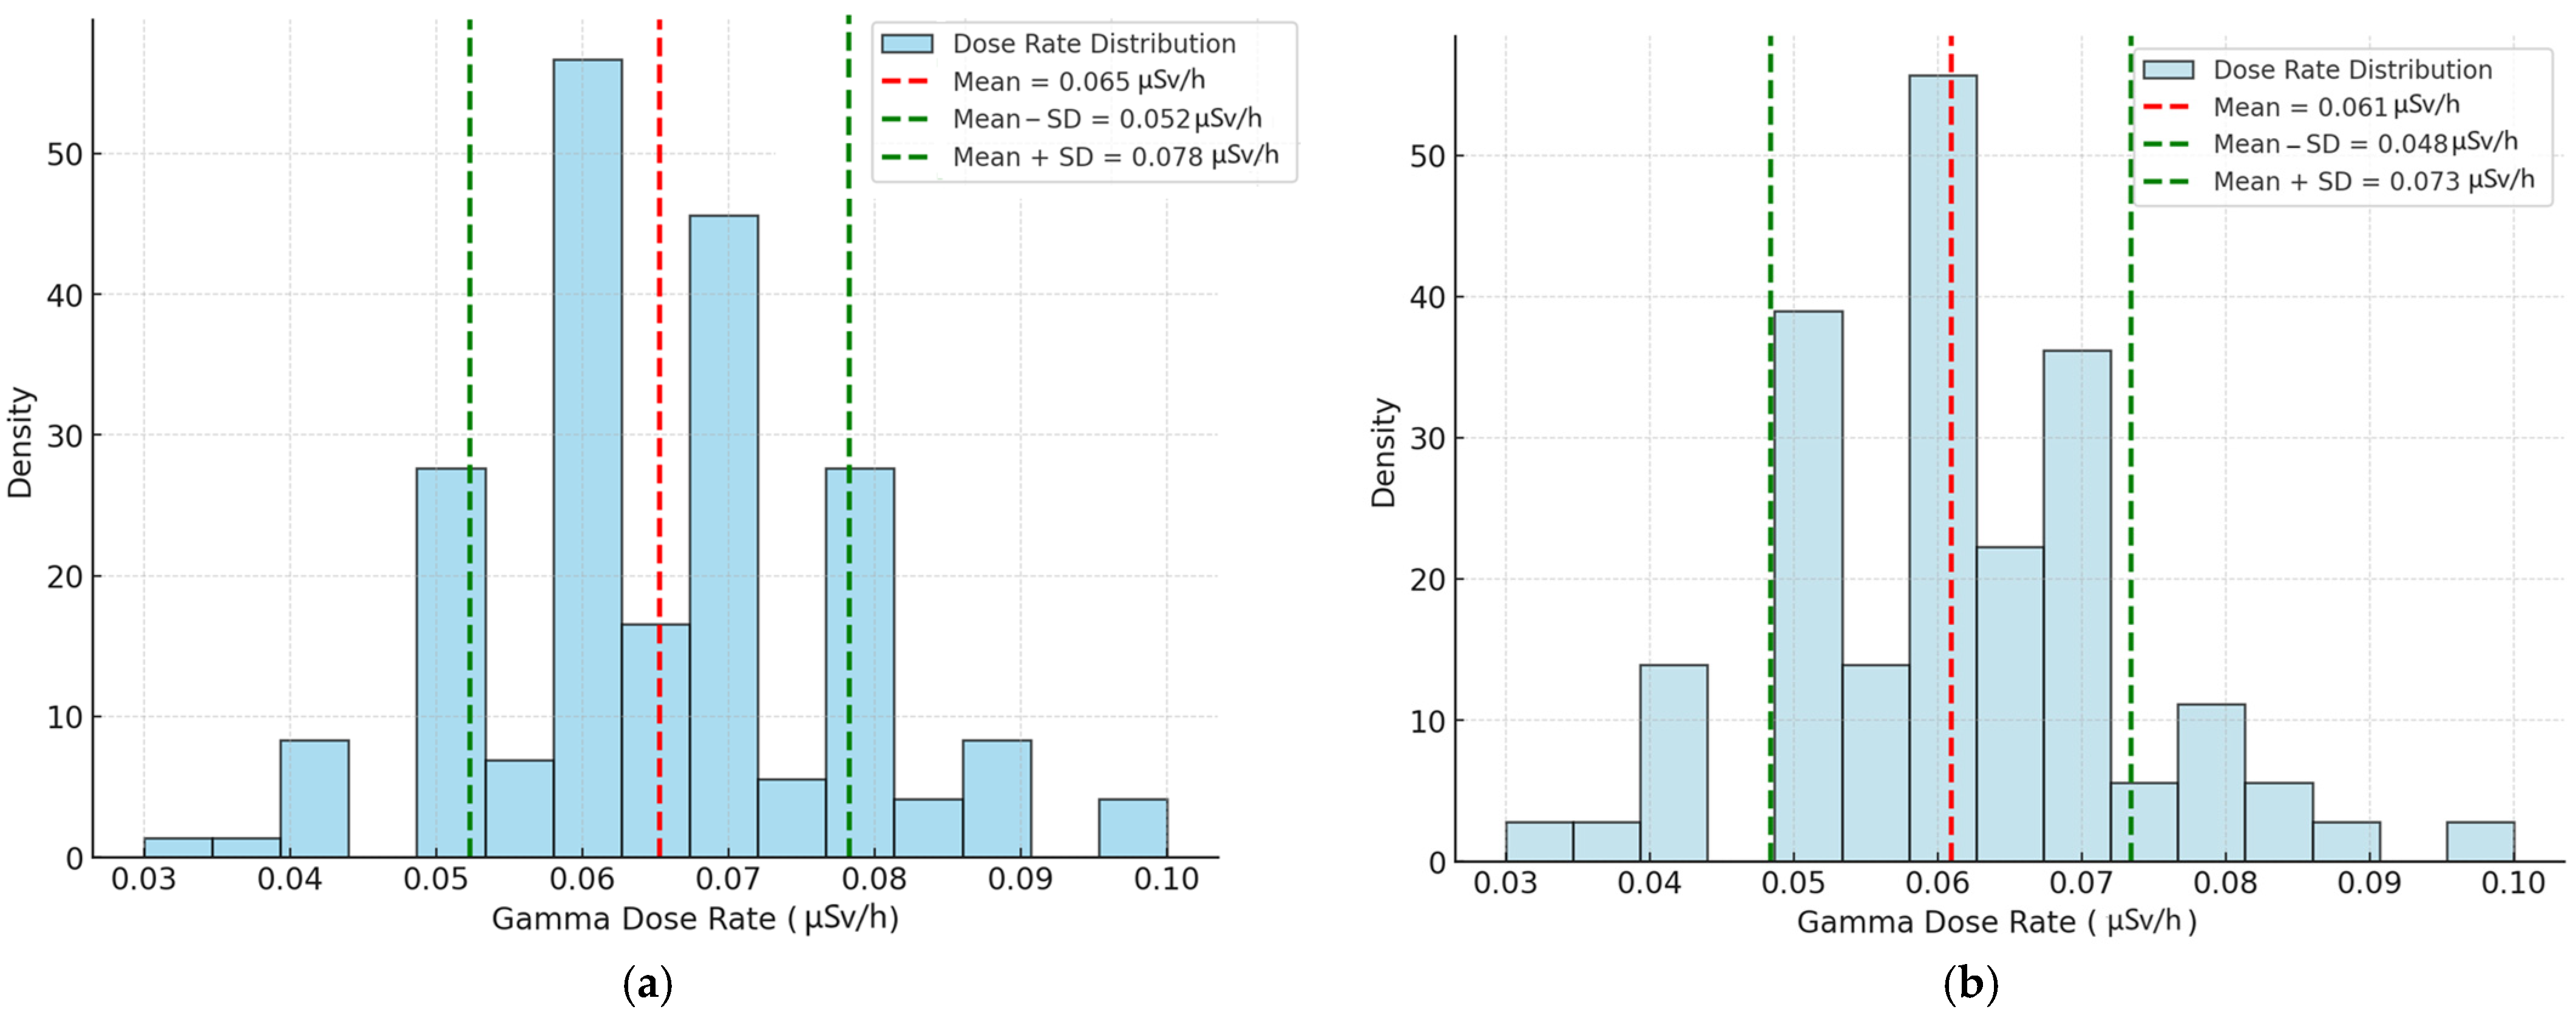
3.1. Indoor and Outdoor Ambient Equivalent Dose Rate

Gamma exposure rates generally vary according to geographic locations, altitude, etc., and are specific to indoors, according to different types of dwellings and ventilation patterns. The variation of outdoor H ˙ (10) in the territory beyond the buffer zone of the uranium deposit is shown in Figure 2. Figure 2 presents a detailed map of the outdoor H ˙ (10) around that site.
Figure 2 shows that the H ˙ (10) exhibit considerable variability, with a mean value of 0.16 ± 0.05 µSv/h. The range of observed values spans from 0.08 µSv/h to 1.2 µSv/h, indicating localized areas of increased radiation exposure. The dataset shows a right-skewed distribution due to the presence of elevated values, particularly the peak at 1.2 µSv/h, which significantly exceeds the background radiation levels.
Approximately 75% of the measurements fall below 0.1 µSv/h, which is within the typical environmental gamma radiation range. However, the maximum recorded H ˙ (10) suggests potential localized contamination or naturally occurring radioactive material (NORM) enrichment in specific areas.
The high outdoor H ˙ (10) were not distributed homogeneously. Rather, they appeared in the local area around the uranium deposit beyond the buffer zone. The maximum H ˙ (10) (0.5–1.2 µSv/h) was obtained near the preserved self-flowing well beyond the buffer zone. These findings indicate that the source of the 238U series elements contributing to the high H ˙ (10) is concentrated in the ground at the measurement points.
Figure 3a,b shows a histogram portraying the frequency distribution of the mean values of indoor and outdoor H ˙ (10) in different types of settlements (A) and territories (B) located near uranium deposits.
As can be seen from Figure 3, the descriptive statistics refer to the overall dataset; the indoor H ˙ (10) in Taukent varies from 0.06 to 0.15 μSv/h with a mean value of 0.08 ± 0.03 μSv/h; in Zhuantobe—0.05 to 0.08 μSv/h with a mean value of 0.06 ± 0.02 μSv/h; in Tasty—0.05 to 0.085 μSv/h with a mean value of 0.06 ± 0.02 μSv/h; in Shu—0.04 to 0.09 μSv/h with a mean value of 0.07 ± 0.03 μSv/h. The outdoor H ˙ (10) in Taukent varies from 0.05 to 0.1 μSv/h with a mean value of 0.07 ± 0.03 μSv/h; in Zhuantobe—0.04 to 0.07 μSv/h with a mean value of 0.05 ± 0.02 μSv/h; in Tasty—0.04 to 0.07 μSv/h with a mean value of 0.05 ± 0.02 μSv/h; in Shu—0.03 to 0.08 μSv/h with a mean value of 0.06 ± 0.02 μSv/h. The measured values do not exceed the worldwide average [20].
The observed variability in outdoor gamma dose rates, ranging from 0.08 µSv/h to 1.2 µSv/h, aligns with studies that have documented significant spatial fluctuations in gamma radiation near uranium mining areas [21]. Elevated levels detected near the preserved self-flowing well beyond the buffer zone suggest that residual uranium-series radionuclides contribute to localized radiation hotspots. Similar patterns have been reported in uranium mining regions of Canada and Namibia, where waste deposits and groundwater movement influence gamma radiation distribution [22,23].
In comparison, a study assessing environmental radioactivity in the proposed Lambapur and Peddagattu uranium mining areas in India (open-pit (open-cast) mining) reported H ˙ (10) ranging from 1211 to 3255 μGy/h, with a mean of 2524 ± 395 μGy/h. These values correspond to approximately 0.14 to 0.37 μSv/h, with a mean of about 0.29 μSv/h, which are higher than the gamma H ˙ (10) observed in Taukent, Zhuantobe, Tasty, and Shu [24].
Furthermore, the International Atomic Energy Agency (IAEA) has reported that in areas surrounding uranium production facilities, average H ˙ (10) can exceed 1 μSv/h above background levels, with maximum spot doses surpassing 2.5 μSv/h. In contrast, the maximum H ˙ (10) observed in the studied settlements was 1.2 μSv/h, which, while elevated, is still within the range reported by the IAEA for areas near uranium production sites [25].
In summary, while the settlements of Taukent, Zhuantobe, Tasty, and Shu are located near uranium deposits, their H ˙ (10) are generally lower than those reported in other uranium mining areas. This suggests that the radiological impact on these settlements is relatively minimal compared to other regions where uranium mining activities may be related to the use of ISL uranium mining.

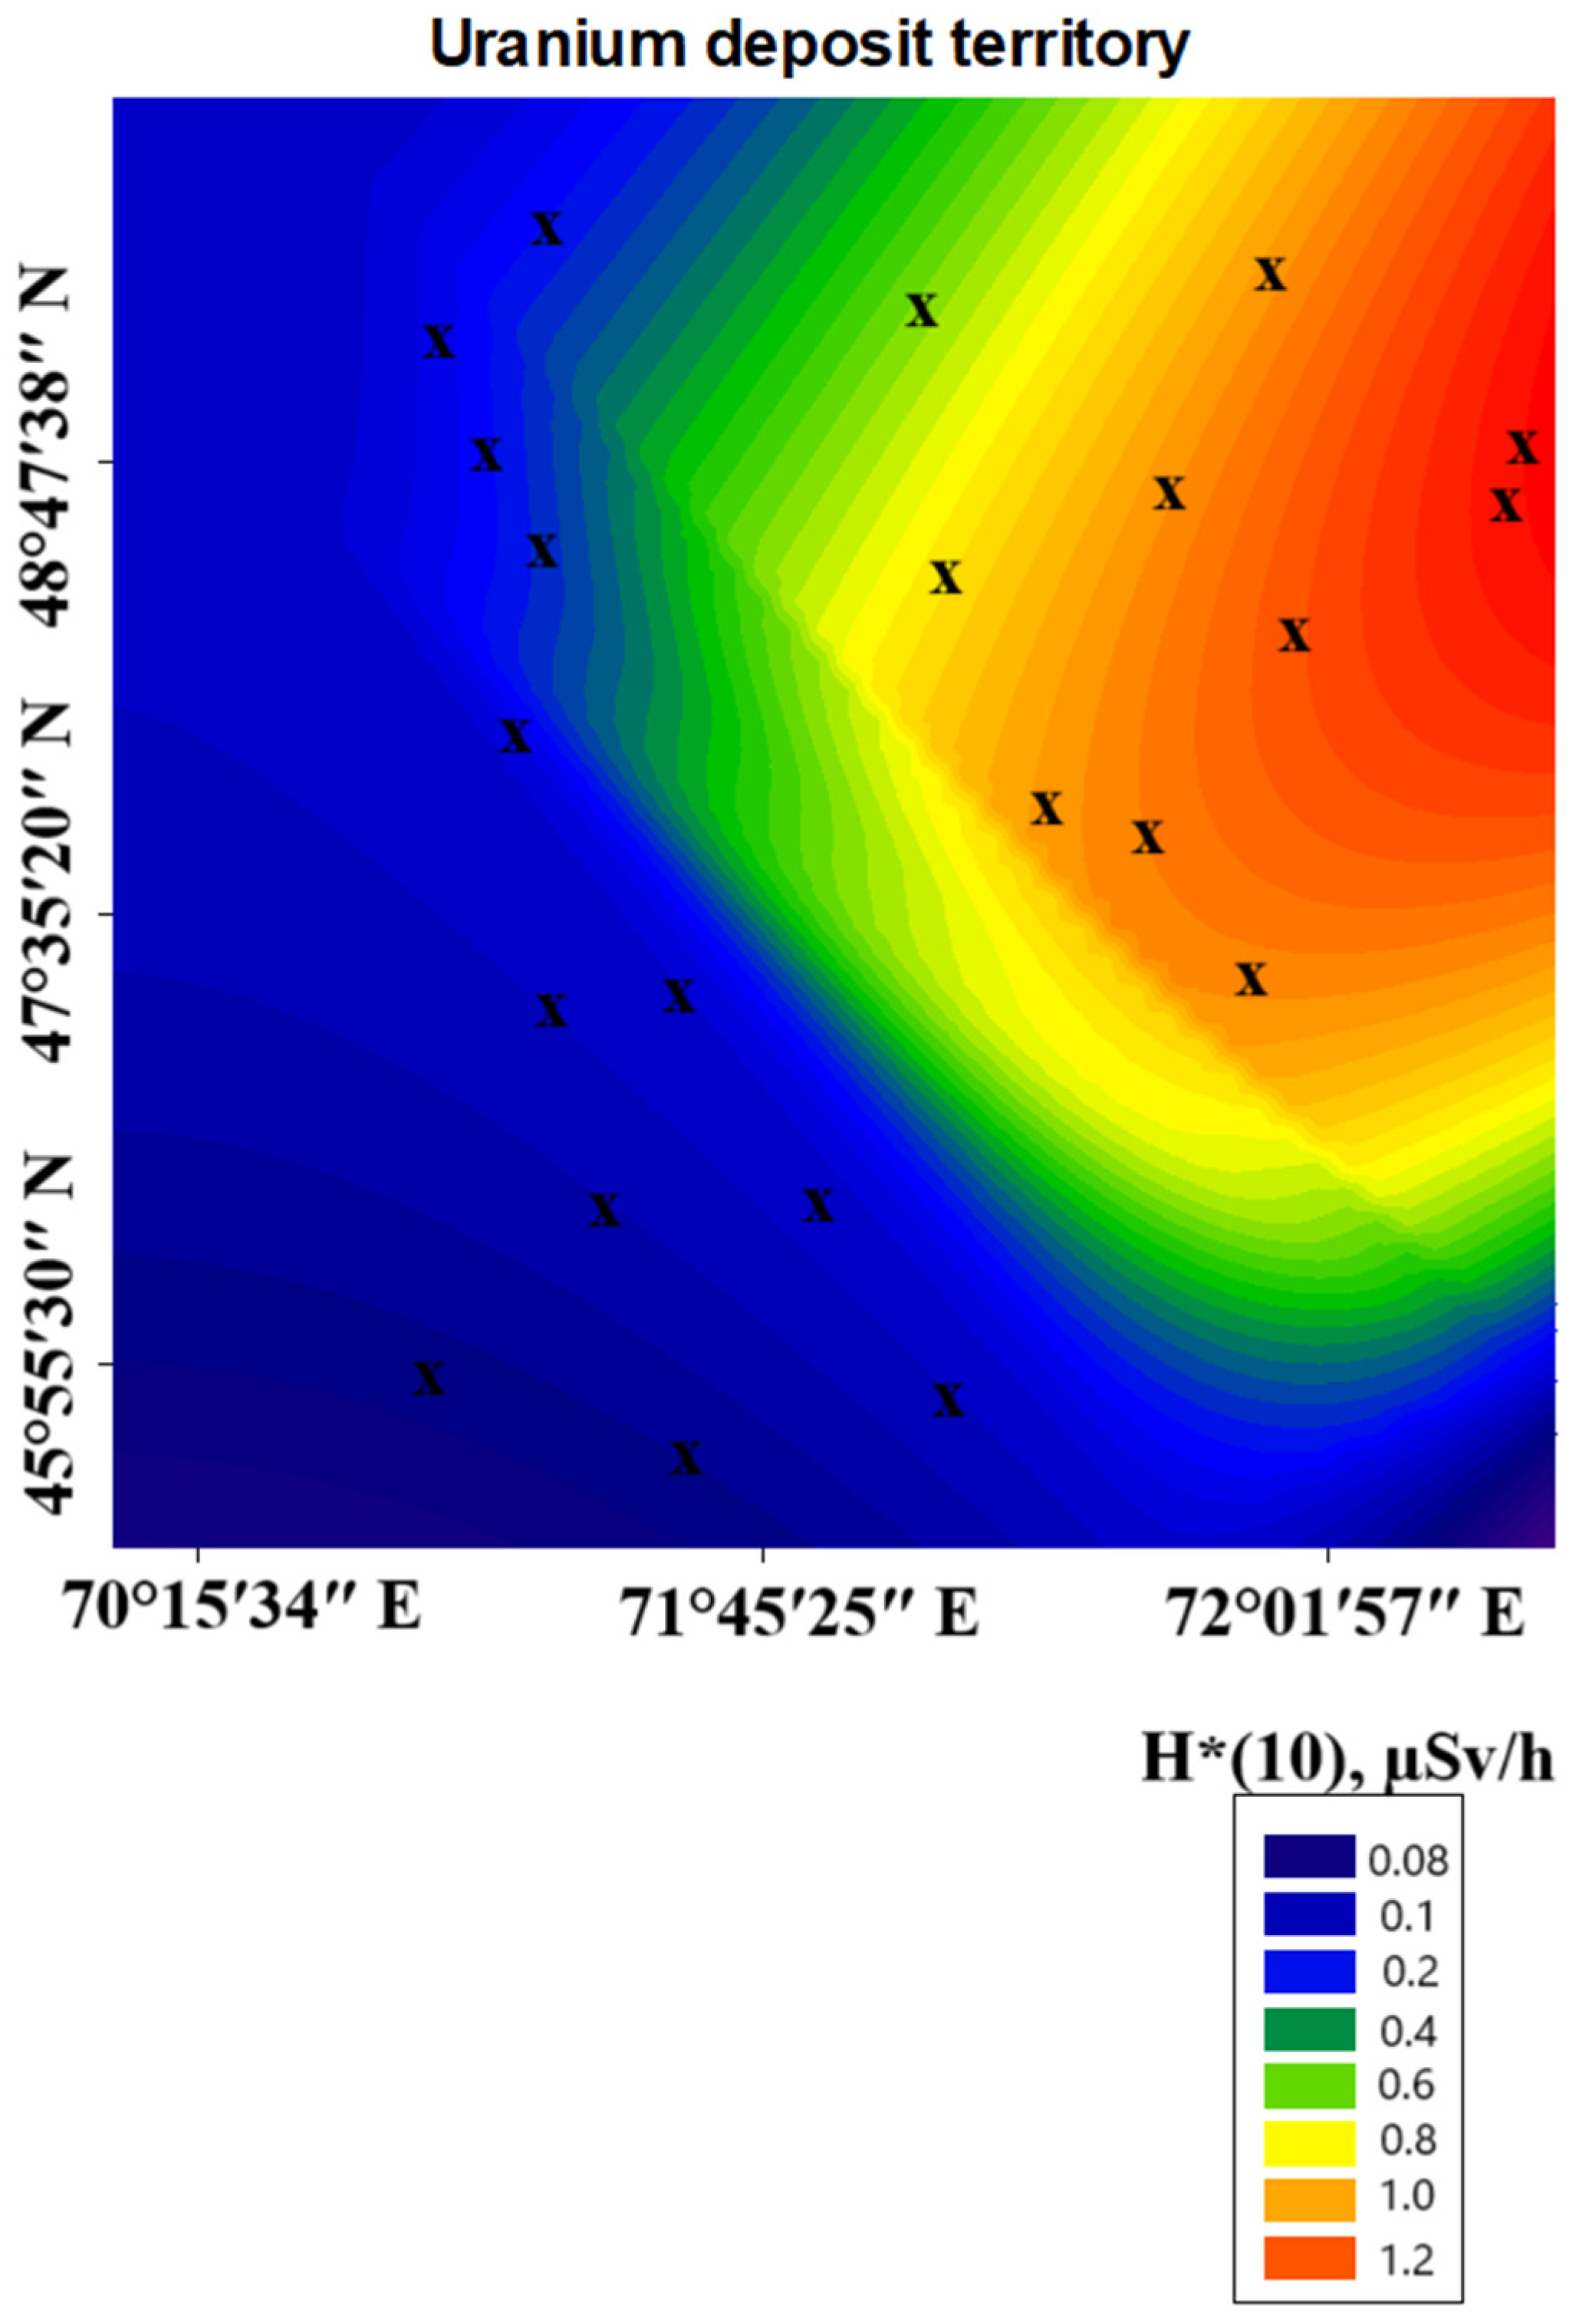
3.2. Radioactivity in the Soil in Territory of Uranium Deposit

Soils beyond the buffer zone were sampled at 0–10 cm depths to determine the concentrations of natural radionuclides (226Ra, 232Th, and 40K elements). At selected locations with elevated gamma dose rates, soil samples were collected at two shallow depth intervals (0–5 cm and 5–10 cm) to gain initial insight into the potential vertical distribution of radionuclide concentrations. However, as these depth intervals were not consistently collected from the same exact sampling points, the observed variability may reflect a combination of both spatial differences between locations and depth-dependent variation. Therefore, the findings provide a preliminary indication of vertical distribution patterns rather than a definitive depth profile at specific sites (Table 2).
As can be seen from Table 2, the activity concentrations of 226Ra, 232Th, and 40K in the soil samples (5 cm depth of soil surface), which were collected in abnormal areas, were found to be in the range of 11–2350 Bq/kg, 9–270 Bq/kg, and 150–860 Bq/kg, respectively. The most polluted territories were contaminated up to2350 Bq/kg (226Ra), 270 Bq/kg (232Th), and860 Bq/kg (40K). Maximum contamination, which exceeds the background level, was detected in the preserved, self-flowing well [15].
Maximum variation in radionuclide activity concentrations was observed at the soil surface, likely due to current human activities. In contrast, the lowest variation was found in the deepest soil layers (less than 15 cm). The vertical distribution pattern is primarily influenced by the surface deposition of radionuclides from historical mining operations. Airborne particulates, dust emissions, and surface runoff during active and post-mining periods likely contribute to the accumulation of radionuclides in the uppermost soil layer. Furthermore, the relatively low mobility of ²²⁶Ra and ²3²Th under normal environmental conditions limits their downward migration, resulting in their retention in surface soils.
The activity concentrations in the soil in the territories of Aqsu, located in former gold-mining territories and near the tailing dump, were 4060 Bq/kg(226Ra), 1170 Bq/kg (232Th), and 4080 Bq/kg (40K), exceeding the worldwide range by an order of magnitude for the Aqmola region soils of Northern Kazakhstan [26]. In this region, there is no natural reduction of the radionuclide activity concentration with depth. This fact excludes the atmospheric radionuclide transport from the tailing area of Stepnogorsk Mining Chemical Enterprise as a primary source of Aqsu settlement contamination. In addition, the materials of building and road constructions may also contribute to dose rates and radon emanation [27].
Radionuclide activity concentrations in soil samples varied widely, with maximum 226Ra levels reaching 2350 Bq/kg. These concentrations significantly exceed the global average range of 12–120 Bq/kg [15], indicating localized contamination. Similar findings have been reported in uranium tailing areas in Kazakhstan and Kyrgyzstan, where legacy mining activities have led to increased radionuclide concentrations in the topsoil [28,29]. The variation in activity with depth suggests anthropogenic redistribution, likely due to historical uranium extraction and surface runoff [30].
Unintended inhalation or ingestion of uranium and radium can pose health risks. Studies have indicated that certain uranium deposits may be near the ground surface, making them easily accessible to residents and animals, including livestock [31]. Subsurface soils are typically oxic, conditions under which uranium tends to dissolve into water [32]. Consequently, dissolved uranium can leach into soil moisture, surface water, and aquifers, potentially being absorbed by plants (including crops), animals, and ultimately humans [33]. Research has shown that plants can absorb radium from the soil, with some studies finding that the uptake of radium by plants exceeds that of uranium [34]. However, the uranium and radium content in airborne particles and foodstuffs was not examined in these studies. Such measurements are necessary to fully understand the health effects of uranium-series elements on residents in the affected areas.

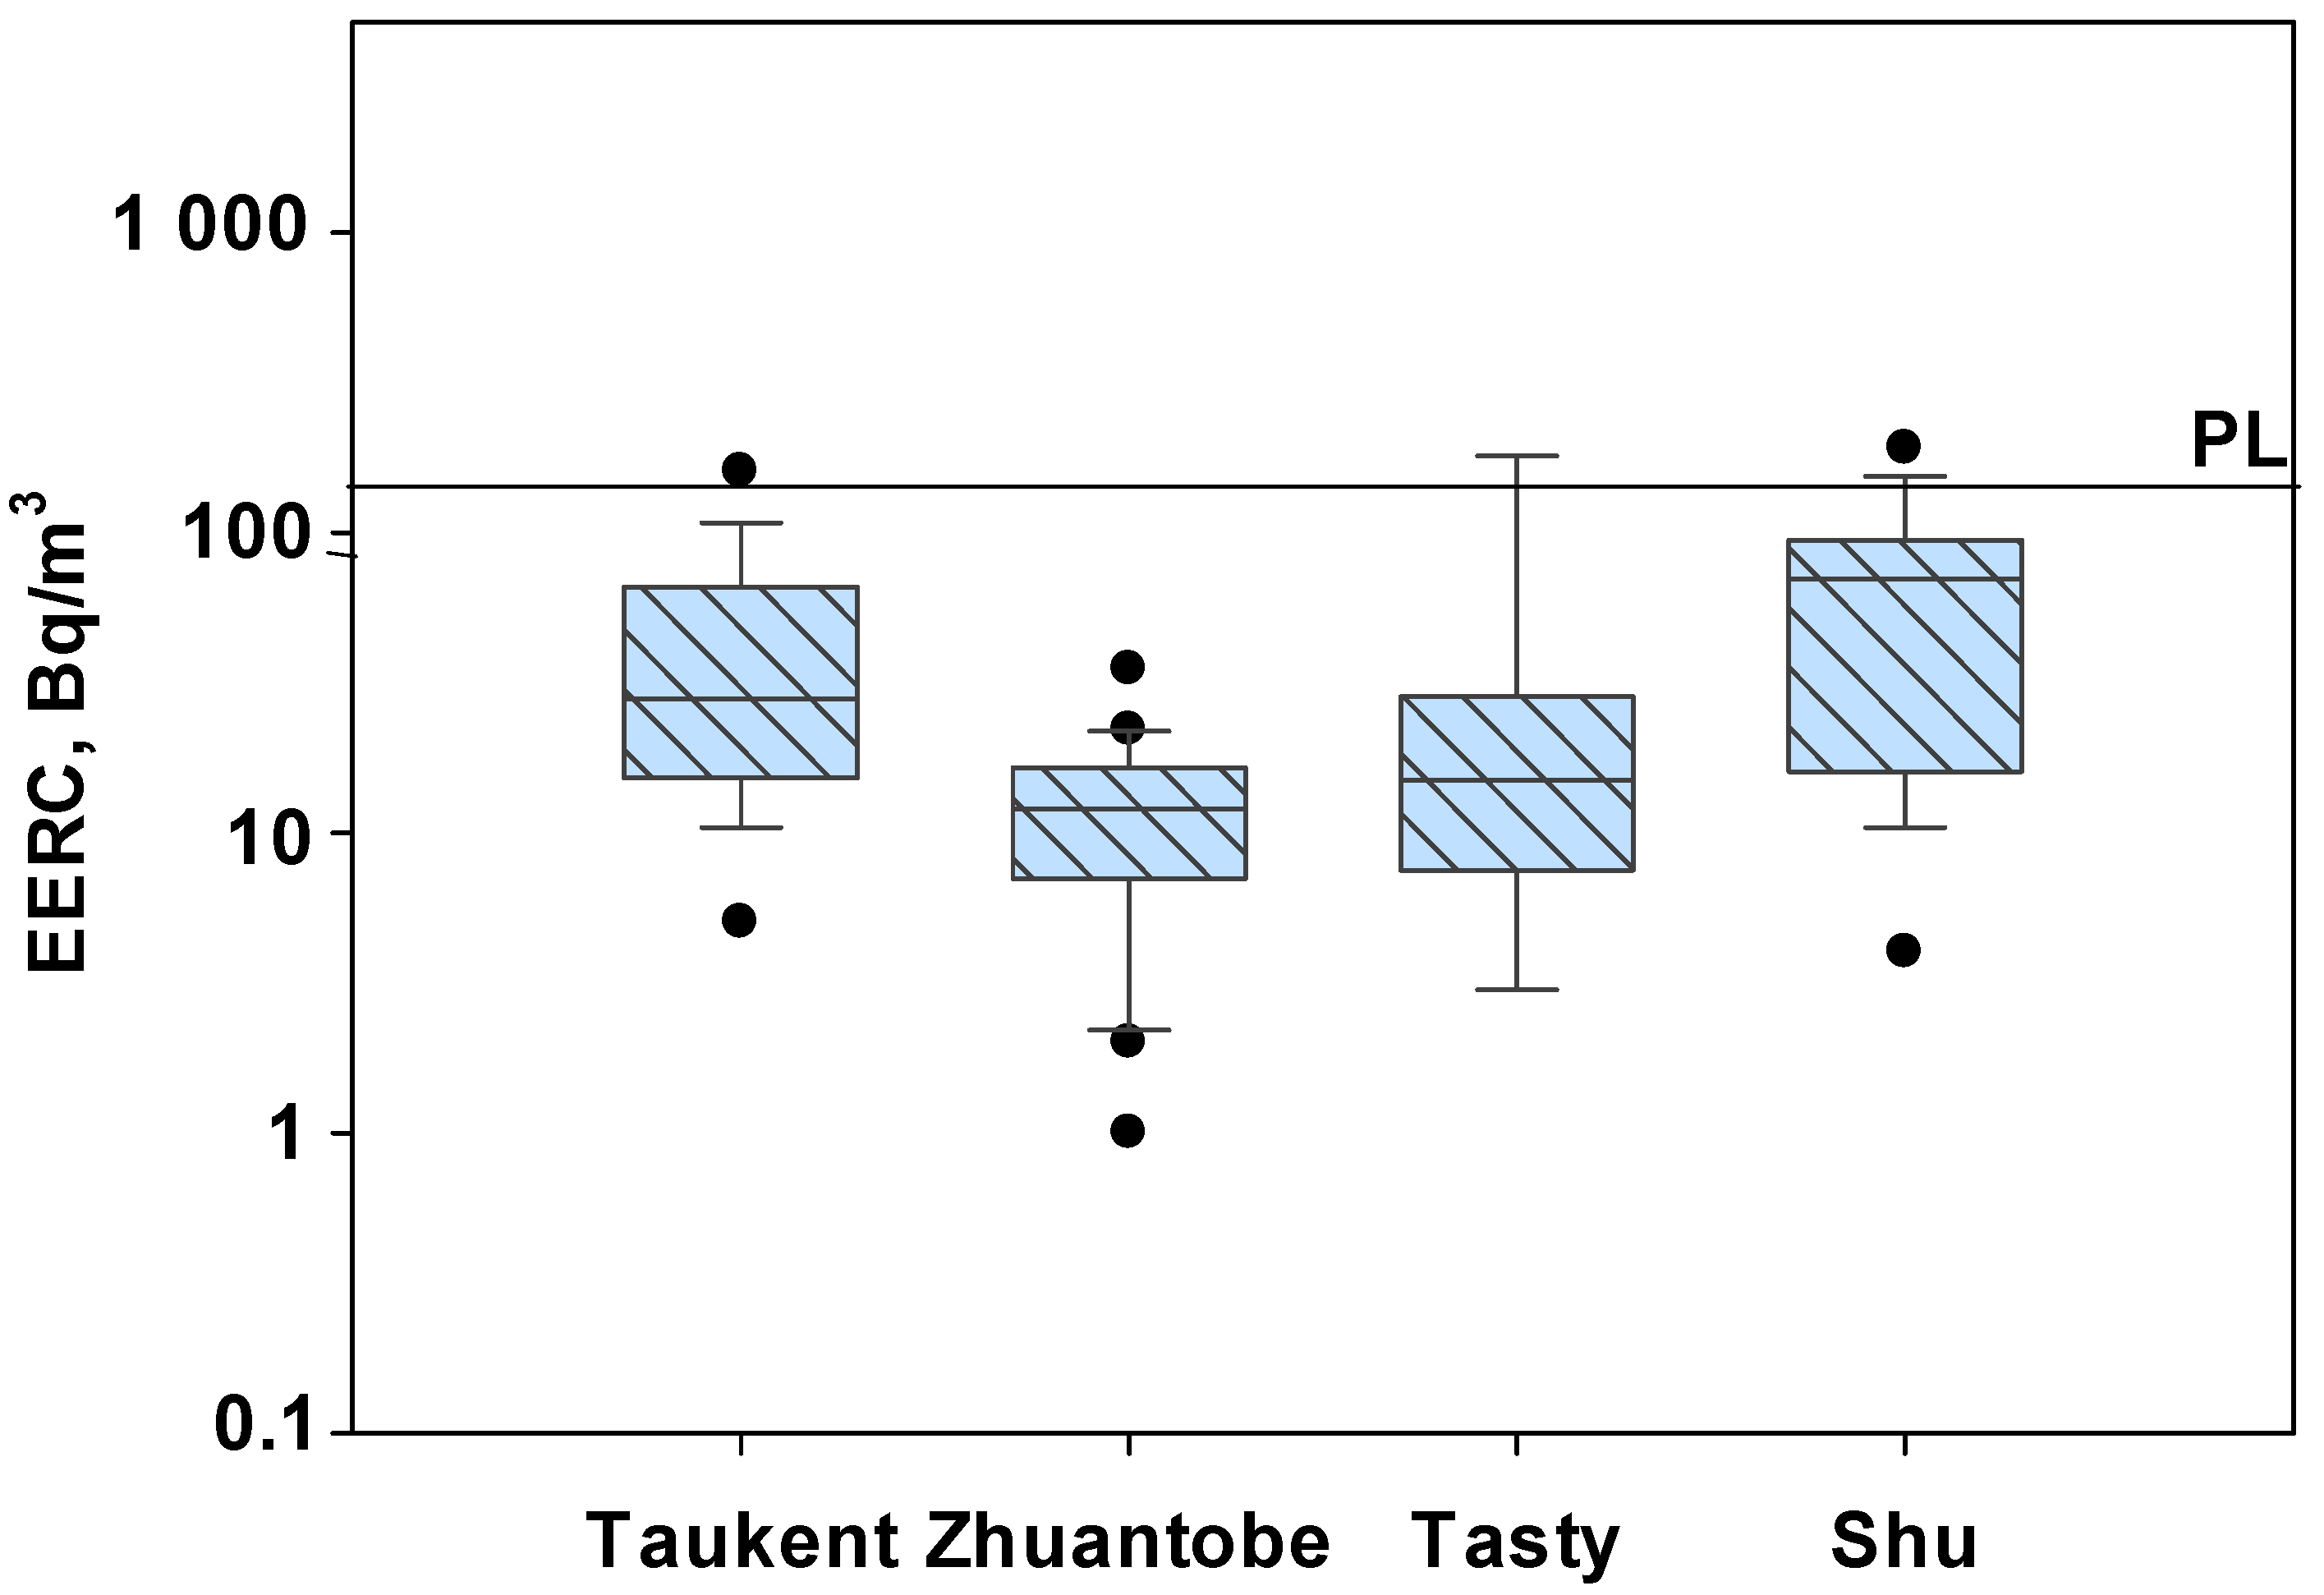
3.3. Indoor Radon Estimation and Annual Effective Dose

Radon is present everywhere in the air in varying concentrations and is the main contributor to an annual effective dose. The comparison of the distribution of the EERC of radon measured is shown in Figure 4. The result is not representative of the whole settlement, as the distribution of examined houses is not even.
As can be seen from Figure 4, the smallest values of the EERC were found in the Zhuantobe (1–35 Bq/m3); the mean (and error of mean) is equal to 12 ± 4 Bq/m3; the median is equal to 12 Bq/m3. This suggests that either the local soil and rock composition contribute minimally to indoor radon levels or that the ventilation and structural characteristics of the buildings in this area effectively mitigate radon accumulation. In contrast, Taukent displayed higher radon levels, ranging from 5 to 160 Bq/m3; the mean was 44 ± 15 Bq/m3; the median is equal to 28 Bq/m3. The wider range and increased median indicate greater variability in radon exposure, possibly due to differences in ventilation efficiency between houses. The highest radon levels were recorded in Tasty and Shu, with maximum values of 180 Bq/m3 and 191 Bq/m3, respectively. The median EERC values in these settlements were 15 Bq/m3 for Tasty and 70 Bq/m3 for Shu, with corresponding means of 33 ± 10 Bq/m3 and 64 ± 22 Bq/m3. Despite these relatively high values, all measured concentrations remained below the permissive level (100 Bq/m3) recommended by the International Commission on Radiological Protection (ICRP) [35]. This suggests that while some households may experience elevated radon exposure, the general levels remain within acceptable limits for radiological safety.
The presence of outliers in the dataset highlights the localized nature of radon accumulation, which may be influenced by factors such as soil permeability, underground radon sources, and variations in building ventilation. Notably, all investigated premises used similar construction materials (slag stones, red and adobe bricks), with identical heating systems and base constructions. Despite this uniformity, significant variations in the EERC of indoor radon were observed across settlements. These findings suggest that local geological conditions, rather than construction-related factors, play a dominant role in determining indoor radon concentrations in the studied areas.
The previous studies conducted in Kazakhstan have also reported elevated indoor radon concentrations, particularly in uranium-rich regions. For example, Tokonami et al. (2023) [36] found radon levels in the Aqsu settlement ranging from 4 to >2000 Bq/m3 across several settlements, with a mean concentration of 290 ± 173 Bq/m3. In the Aqsu, where uranium tailings are located nearby, 70% of dwellings exceeded 300 Bq/m3, while only 5% of homes in Astana surpassed that threshold [37]. According to Ibrayeva et al. (2020), the radon EERC (indoor) in Zavodskoy and Aqsu reaches the values of 313–858 Bq/m3 in the buildings located close to former gold mining sites [26]. According to Stegnar et al. (2013), based on a total of 23 measurements at the Kurdai site in the Muzbel settlement, the indoor radon concentrations ranged from 130 to 1200 Bq/m3 [37]. Compared to previous studies in Kurdai and Aqsu, which reported significantly higher indoor radon levels, the current findings suggest moderate exposure risks influenced uranium mining using the ISL method for the South region. This reinforces the need for site-specific monitoring and mitigation, especially in areas with historical or active mining activities, while confirming that radon levels in the studied settlements fall within the lower to mid-range of national measurements.
Although the results of soil analysis revealed very high concentrations of ²²⁶Ra in areas surrounding the former uranium deposit—reaching up to 2350 Bq/kg—the corresponding radon concentrations in indoor air within nearby settlements remained comparatively low, as shown by the EERC values in premises located in Zhuantobe, Taukent, Tasty, and Shu. This contrast suggests that while the soil is significantly enriched in radium due to historical uranium mining, local geological and structural conditions—such as low soil permeability, reduced radon emanation, and effective building ventilation—likely limited the migration and accumulation of radon indoors. These findings emphasize the importance of direct radon monitoring in homes, as high soil radioactivity alone does not necessarily indicate high indoor exposure.
In summary, the radon levels observed in Zhuantobe, Taukent, Tasty, and Shu are consistent with findings from other studies and fall within internationally recognized safety limits. However, ongoing surveillance and adherence to building practices that minimize radon accumulation are recommended to maintain low exposure levels.
According to Formula (2), the annual effective dose from the EERC of radon was for Zhuantobe (0.8 mSv/y), Taukent (3 mSv/y), Tasty (2 mSv/y), and Shu (4 mSv/y). According to the ICRP, the recommended annual exposure limit for the general public due to radon is 1000 µSv/y (1 mSv/y), while the action level for intervention is typically set between 3–10 mSv/y [38].
Zhuantobe falls below the recommended public exposure limit of 1 mSv/y, indicating minimal health risks. Taukent, Tasty, and Shu exceed the 1 mSv/y recommended limit, suggesting a need for further assesFsment and potential mitigation measures. Shu has the highest exposure dose, exceeding 4 mSv/year, which approaches the lower range of action levels (3–10 mSv/year), indicating that mitigation strategies such as improved ventilation and radon-resistant building materials may be necessary.
Uranium mining areas in India (Lambapur-Peddagattu) reported annual inhalation doses ranging from 2.5 to 10 mSv/y, with certain locations exceeding 10 mSv/y [24]. This suggests that while the exposure in Shu (4.04 mSv/y) is elevated, it is still within a range observed in similar environments. A study in Germany’s former uranium mining regions found that radon inhalation doses ranged from 1 to 5 mSv/y, depending on ventilation and soil permeability [25]. The exposure levels in Taukent, Tasty, and Shu are comparable to the lower range of these findings.
The findings highlight the need for targeted mitigation strategies in settlements with higher inhalation doses, particularly Shu, where radon exposure approaches internationally recommended action levels. Further investigation and long-term monitoring are essential to assess seasonal variations and the effectiveness of mitigation measures.
Further research is needed to assess seasonal variations in gamma exposure rates and indoor radon levels, as well as the potential contribution of radon emanation from building materials. Longitudinal studies could provide deeper insights into long-term radiation trends and their potential health effects on local populations. Additionally, advanced geospatial modeling techniques, such as GIS-based radiation mapping, could enhance the understanding of radionuclide distribution and identify high-risk areas for targeted mitigation [39,40]. Investigating the bioavailability of uranium-series elements in soil and water would also be crucial for assessing environmental and human exposure pathways.

4. Conclusions

The present research showed that the results of radioecological studies conducted in the settlements of Zhuantobe, Taukent, Tasty, and Shu allow us to conclude that, according to all radiation monitoring parameters, the current situation in these settlements appears to be relatively favorable.
The high outdoor gamma dose rates appeared in the local area around the uranium deposit beyond the buffer zone. The maximum gamma dose rate (0.5–1.2 µSv/h) was obtained near the preserved self-flowing well beyond the buffer zone. Maximum contamination of activity concentration of natural radionuclides in the soil to 226Ra (2350 Bq/kg), 232Th (270 Bq/kg), and 40K (860 Bq/kg), respectively, was detected in the preserved self-flowing well, which exceeds the background level.
The gamma exposure rates measured in the settlements of Taukent, Zhuantobe, Tasty, and Shu exhibit variability across both indoor and outdoor environments. Indoor gamma exposure rates ranged from 0.04 to 0.15 μSv/h. Outdoor rates varied from 0.03 to 0.1 μSv/h; these values do not exceed the worldwide average and the regional average level. The highest radon levels were recorded in Tasty and Shu, with maximum values of 180 Bq/m3 and 191 Bq/m3, which do not exceed the permissive level. Shu has the highest exposure dose, exceeding 4 mSv/y, which approaches the lower range of action levels (3–10 mSv/y).
This pilot study showed the necessity of detailed monitoring of other settlements’ territory in the Shu-Sarysu uranium ore province and finding out the impact of uranium activities. Further investigations shall be devoted to wide surveys of groundwater contamination, determination of individual doses of the public to NORMs, and evaluation of those health risks.

Author Contributions

Conceptualization, M.B. and D.I.; data curation, M.B.; formal analysis, M.B. and D.I.; software, A.S. and A.T.; funding acquisition, M.B.; methodology, M.B., D.I., M.A., A.S., P.K., and N.A.; writing—original draft preparation, M.B. and D.I.; investigation, A.T., P.K., N.A., and M.A.; validation, A.S., A.T., N.A., and M.A.; writing—review and editing, M.B., Y.K., and D.I.; resources, D.I., M.A., and Y.K. All authors have read and agreed to the published version of the manuscript.

Funding

This research was funded by the Committee of Science of the Ministry of Science and Higher Education of the Republic of Kazakhstan, grant number IRN AP23488056, “Assessment of the radiation situation and development of measures to reduce negative radiation factors on the environment in the Shu-Sarysu uranium province” (2024–2026).

Institutional Review Board Statement

Not Applicable.

Informed Consent Statement

Not Applicable.

Data Availability Statement

The data presented in this study are available upon request from the first author, Bakhtin Meirat, and the correspondence author, Danara Ibrayeva.

Conflicts of Interest

The authors declare no conflicts of interest.

References

  1. Kurnaz, A.; Kuecuekoemeroglu, B.; Cevik, U.; Celebi, N. Radon level and indoor gamma doses in dwellings of Trabzon, Turkey. Appl. Radiat. Isot. 2011, 69, 1554–1559. [Google Scholar] [CrossRef] [PubMed]
  2. Pantelić, G.; Čeliković, I.; Živanović, M.; Vukanac, I.; Nikolić, J.K.; Cinelli, G.; Gruber, V. Qualitative overview of indoor radon surveys in Europe. J. Environ. Radioact. 2019, 204, 163–174. [Google Scholar] [CrossRef] [PubMed]
  3. Deiana, G.; Dettori, M.; Masia, M.D.; Spano, A.L.; Piana, A.; Arghittu, A.; Castiglia, P.; Azara, A. Monitoring Radon Levels in Hospital Environments. Findings of a Preliminary Study in the University Hospital of Sassari, Italy. Environments 2021, 8, 28. [Google Scholar] [CrossRef]
  4. Chalmers, B.; Mangiaterra, V.; Porter, R. WHO principles of perinatal care: The essential antenatal, perinatal, and postpartum care course. Birth 2001, 28, 202–207. [Google Scholar] [CrossRef] [PubMed]
  5. Available online: https://ru6.kazatomprom.kz/ru/content/geologicheskaya-razvedka (accessed on 3 February 2025).
  6. International Atomic Energy Agency (IAEA). The Uranium Mining Remediation Exchange Group (UMREG) Selected Papers 1995–2007; International Atomic Energy Agency (IAEA): Vienna, Austria, 2011; pp. 1–305. [Google Scholar]
  7. OECD/IAEA. Environmental Activities in Uranium Mining and Milling; OECD Publishing: Paris, France, 1999; p. 172. [Google Scholar] [CrossRef]
  8. Ratov, B.T.; Khomenko, V.L.; Kuttybayev, A.E.; Togizov, K.S.; Utepov, Z.G. Innovative drill bit to improve the efficiency of drilling operations at uranium deposits in Kazakhstan. News Natl. Acad. Sci. Repub. Kazakhstan Ser. Geol. Technol. Sci. 2024, 4, 224–236. [Google Scholar] [CrossRef]
  9. Baipisheva, D.S.; Domarenko, V.A. Comprehensive assessment of environmental impact during exploration and operation of the Inkai deposit (Shu-Sarysu uranium ore province, republic of Kazakhstan). Sci. Bull. Siberia. 2012, 5, 1–6. (In Russian) [Google Scholar]
  10. Oecd Nuclear Energy Agency; International Atomic Energy Agency. Uranium 2020: Resources, Production and Demand; OECD: Paris, France, 2020. [Google Scholar]
  11. Yazikov, V.G. Uranium raw material base of the Republic of Kazakhstan and prospects of using in situ leach mining for its development, T1-TC-975. In Proceedings of the IAEA Tech. Mtg on In Situ Leach Uranium Mining, Almaty, Kazakhstan, 9–12 September 1996. [Google Scholar]
  12. Adams, S.S.; Cramer, R.T. Data-Process-Criteria Model for Roll-Type Uranium Deposits; Geological Environments of Sandstone-type Uranium Deposits, IAEA-TECDOC-328; IAEA: Vienna, Austria, 1985; pp. 383–399. [Google Scholar]
  13. Oecd Nuclear Energy Agency; International Atomic Energy Agency. Uranium 2001: Resources, Production and Demand; OECD: Paris, France, 2002. [Google Scholar]
  14. Dahlkamp, F.J. Uranium Deposits of the World: Asia; Springer: Berlin/Heidelberg, Germany, 2009; p. 493. [Google Scholar]
  15. Sources and Effects of Ionizing Radiation; Report to the General Assembly; UNSCEAR: New York, NY, USA, 2000.
  16. Guidelines for Radioelement Mapping Using Gamma Ray Spectrometry Data; IAEA-TECDOC-1363; IAEA: Vienna, Austria, 2003.
  17. International Atomic Energy Agency. Measurement of Radionuclides in Food and the Environment; IAEA: Vienna, Austria, 1989. [Google Scholar]
  18. Available online: https://www.doza.ru/en/catalog/pribori_kontrolia_electromagnitnih_poley/Alpharad-plus/ (accessed on 15 January 2025).
  19. ASTM D6327; 10 Standard Test Method for Determination of Radon Decay Product Concentration and Working Level in Indoor Atmospheres by Active Sampling on a Filter. ASTM International: West Conshohocken, PA, USA, 2016.
  20. Informational Bulletin on the State of the Environment of the Republic of Kazakhstan for 2015; Ministry of Energy of the Republic of Kazakhstan. RSE “Kazgidromet”, Department of Environmental Monitoring: Astana, Kazakhstan, 2015.
  21. UNSCEAR (United Nation Scientific Committee on the Effects of Atomic Radiation Report), Sources, Effects and Risks of Ionizing Radiation; Report to the General Assembly, with Scientific Annexes; UNSCEAR, United Nations: New York, NY, USA, 2016.
  22. International Atomic Energy Agency. IAEA Annual Report; IAEA: Vienna, Austria, 2018. [Google Scholar]
  23. IAEA Safety Standards. Regulatory Control of Radioactive Discharges to the Environment; General Safety Guide No. GSG-9; IAEA: Vienna, Austria, 2018. [Google Scholar]
  24. Reddy, K.; Reddy Ch Sagar, D.; Reddy, P.; Reddy, R. Environmental radioactivity studies in the proposed Lambapur and Peddagattu uranium mining areas of Andhra Pradesh, India. Radiat Prot Dosim. 2012, 151, 290–298. [Google Scholar] [CrossRef] [PubMed]
  25. Environmental Contamination from Uranium Production Facilities and Their Remediation; IAEA: Vienna, Austria, 2005; pp. 1–255.
  26. Ibrayeva, D.; Bakhtin, M.; Kashkinbayev, Y.; Kazymbet, P.; Zhumadilov, K.; Altaeva, N.; Aumalikova, M.; Shishkina, E. Radiation situation in the territories affected by mining activities in Stepnogorsk areas, Republic of Kazakhstan: Pilot study. Radiat Prot Dosim. 2020, 189, 517–526. [Google Scholar] [CrossRef] [PubMed]
  27. Ibrayeva, D.; Ilbekova, K.; Aumalikova, M.; Kazymbet, P.; Zhumadilov, K.; Bakhtin, M.; Hoshi, M. Studies on gamma dose rates in outdoor environment and assessment of external exposure to public in Stepnogorsk area, northern Kazakhstan. Radiat. Prot. Dosim. 2022, 198, 1387–1398. [Google Scholar] [CrossRef] [PubMed]
  28. Uranium Tailings in Central Asia: Local Problems, Regional Consequences, Global Solution: Joint Declaration; Palace of Nations: Geneva, Switzerland, 2009.
  29. Buckley, P.B.; Ranville, J.; Honeyman, B.D.; Smith, D.K.; Rosenberg, N.; Knapp, R.B. Progress Toward Remediation of Uranium Tailings in Mailuu-Suu, Kyrgyzstan; Department of Energy, Lawrence Livermore National Laboratory: Livermore, CA, USA, 2003; pp. 1–9.
  30. Strømman, G.; Skipperud, L.; Rosseland, B.; Heier, L.; Lind, O.; Oughton, D.; Lespukh, E.; Uralbekov, B.; Kayukov, P. Legacy of Uranium Mining Activities in Central Asia—Contamination, Impact and Risks; UMB report; UBM: Oslo, Norway, 2011. [Google Scholar]
  31. Committee on Uranium Mining in Virginia; Committee on Earth Resources; National Research Council. Uranium Mining in Virginia: Scientific, Technical, Environmental, Human Health and Safety, and Regulatory Aspects of Uranium Mining and Processing in Virginia; National Academies Press (US): Washington, DC, USA, 2011. [Google Scholar]
  32. Agency for Toxic Substances Disease Registry (ATSDR). Uranium | Public Health Statement; U.S. Department of Health and Human Services: Washington, DC, USA, 2013. Available online: https://wwwn.cdc.gov/TSP/PHS/PHS.aspx?phsid=438&toxid=77 (accessed on 10 February 2025).
  33. Shtangeerc, I. Uptake of uranium and thorium by native and cultivated plants. J. Environ. Radioact. 2010, 101, 458–463. [Google Scholar] [CrossRef] [PubMed]
  34. Agency for Toxic Substances Disease Registry (ATSDR). Radium | Public Health Statement; U.S. Department of Health and Human Services: Washington, DC, USA, 1999. Available online: https://wwwn.cdc.gov/TSP/PHS/PHS.aspx?phsid=789&toxid=154 (accessed on 10 February 2025).
  35. ICRP. Radiological Protection against Radon Exposure. ICRP Publication 126. Ann. ICRP 2014, 43, 5–73. [Google Scholar]
  36. Tokonami, S.; Kranrod, C.; Kazymbet, P.; Omori, Y.; Bakhtin, M.; Poltabtim, W.; Musikawan, S.; Pradana, R.; Kashkinbayev, Y.; Zhumadilov, K.; et al. Residential radon exposure in Astana and Aqsu, Kazakhstan. J. Radiol. Prot. 2023, 43, 023501. [Google Scholar] [CrossRef] [PubMed]
  37. Stegnar, P.; Shishkov, I.; Burkitbayev, M.; Tolongutov, B.; Yunusov, M.; Radyuk, R.; Salbu, B. Assessment of the radiological impact of gamma and radon dose rates at former U mining sites in Central Asia. J. Environ. Radioact. 2013, 123, 3–13. [Google Scholar] [CrossRef] [PubMed]
  38. ICRP. Occupational Intakes of Radionuclides: Part 3. ICRP Publication 137. Ann. ICRP 2017, 46, 5–491. [Google Scholar]
  39. Kashkinbayev, Y.; Kazymbet, P.; Bakhtin, M.; Khazipova, A.; Hoshi, M.; Sakaguchi, A.; Ibrayeva, D. Indoor Radon Survey in Aksu School and Kindergarten Located near Radioactive Waste Storage Facilities and Gold Mines in Northern Kazakhstan (Akmola Region). Atmosphere 2023, 14, 1133. [Google Scholar] [CrossRef]
  40. Altendorf, D.; Grünewald, H.; Liu, T.L.; Dehnert, J.; Trabitzsch, R.; Weiß, H. Decentralised ventilation efficiency for indoor radon reduction considering different environmental parameters. Isot. Environ. Health Stud. 2022, 58, 195–213. [Google Scholar] [CrossRef] [PubMed]
Figure 1. The scheme showed the settlements’ location and Kazakhstan uranium provinces with uranium reserve distribution.
Atmosphere 16 00536 g001
Figure 2. The H ˙ (10) in the territory beyond the buffer zone of the uranium deposit in the Turkestan region of South Kazakhstan.
Atmosphere 16 00536 g002
Figure 3. Indoor (a) and outdoor (b) gamma exposure rates in settlements territories.
Atmosphere 16 00536 g003
Figure 4. Results of measurement of EERC of radon in inhabited premises of settlements in Bq/m3. The upper and lower borders of boxes correspond to 25–75% of EERC; whiskers border 90% confidence interval. Horizontal lines in the boxes are the median values. Dots are outliers. PL —permissive level.
Atmosphere 16 00536 g004
Table 1. Summary of the investigated settlements and the number of radiation measurements conducted in the southern region of Kazakhstan.
NSettlementDistance from the Uranium Deposits, kmPopulationNumber of Investigated Locations
Gamma FieldsRadon in the Indoor Air
OutdoorIndoor
1Shu35700151717
2Zhuantobe401650202121
3Tasty25112010129
4Taukent507000202519
Table 2. The range of radionuclide activity concentrations in the soil beyond the buffer zone of the uranium deposit (mean concentration in the soil ± uncertainty, using coverage factor k = 2).
Location NameConcentration in Soil, Bq/kg
226Ra±(k = 2)232Th±(k = 2)40K±(k = 2)
P-1 (10 cm)1730±169155±50150±48
P-1-II Contaminated area (5 cm)2350±235270±35860±285
P-2-II-Contaminated area (10 cm)1200±11965±15540±220
P-2 near well №6 (5 cm)35±636±5650±125
P-3 Closed well (5 cm)145±1625±5850±140
P-4 Salt deposition11±59±3366±106
Worldwide range *12–120 10–220 100–1200
* UNSCEAR (2000) [15].
Disclaimer/Publisher’s Note: The statements, opinions and data contained in all publications are solely those of the individual author(s) and contributor(s) and not of MDPI and/or the editor(s). MDPI and/or the editor(s) disclaim responsibility for any injury to people or property resulting from any ideas, methods, instructions or products referred to in the content.

