Abstract
This study aimed to assess the long-term trends in PM10, PM2.5, and hazardous trace elements in Makkah from 2020 to 2024, evaluating seasonal variations, health risks, and potential mitigation strategies. The results indicated that the PM10 concentrations ranged from a minimum of 127.7 ± 14.2 µg/m3 (2020) to a maximum of 138.3 ± 15.7 µg/m3 (2024), while PM2.5 levels varied between 100.7 ± 18.7 µg/m3 and 109.8 ± 21.3 µg/m3. A seasonal analysis showed the highest PM10 and PM2.5 levels during winter (147.8 ± 16.4 µg/m3 and 119.5 ± 21.7 µg/m3 in 2024, respectively), coinciding with lower wind speeds and reduced dispersion. Among the nine trace elements analyzed, Cr VI exhibited the highest increase from 0.008 ± 0.001 µg/m3 (2020) to 0.012 ± 0.001 µg/m3 (2024), while Cd and Ni also rose significantly. The excess cancer risk (ECR) associated with these pollutants exceeded the recommended threshold, with a strong correlation between PM10 and ECR (r = 0.85–0.93, p < 0.01). These findings highlight the need for enhanced air quality monitoring and sustainable urban planning. Future research should focus on identifying the dominant pollution sources and assessing the long-term health impacts to support evidence-based air quality management in Makkah.
1. Introduction
Air pollution remains a significant environmental and public health concern, with particulate matter (PM) posing serious risks to human health. Particulate matter is categorized based on aerodynamic diameter, with PM10 (≤10 µm) classified as coarse particles and PM2.5 (≤2.5 µm) as fine particles [1]. These pollutants originate from both natural sources, such as desert dust and volcanic activity, and anthropogenic activities, including industrial emissions, vehicular exhaust, and combustion processes [2]. The small size of PM2.5 allows for its deep penetration into the respiratory system and systemic circulation, exacerbating conditions such as cardiovascular diseases and respiratory ailments and causing increased mortality rates [3,4].
In addition to PM levels, both the particle size and chemical composition of airborne particles are critical factors in assessing their toxicity, as smaller particles can penetrate deeper into the respiratory tract, and certain elements may contribute to cytotoxic and genotoxic effects. Recent studies have highlighted DNA damage (e.g., using the comet assay) and cellular toxicity (e.g., to lung epithelial cells) as key outcomes of PM exposure [5,6]. Among the hazardous pollutants in ambient air, certain trace elements, such as cadmium (Cd), chromium (Cr), arsenic (As), beryllium (Be), and nickel (Ni), are known for their carcinogenic properties. These metals are primarily emitted by industrial operations, the combustion of fossil fuels, and traffic-related sources, persisting in the atmosphere and contributing to long-term health risks [7,8]. Exposure to these elements through inhalation has been associated with an increased likelihood of lung cancer, kidney dysfunction, and other chronic diseases [9]. Regulatory agencies such as the Environmental Protection Agency (EPA) and the International Agency for Research on Cancer (IARC) classify some of these trace metals as known or probable human carcinogens, with Cd and Cr (VI) categorized as Group 1 carcinogens and As and Ni as probable carcinogens [10].
Makkah, one of the most densely populated cities in Saudi Arabia, experiences fluctuating air quality due to its rapid urbanization, its high population density, and large-scale annual religious pilgrimages such as Hajj and Umrah. These mass gatherings significantly contribute to air pollution through transportation emissions, increased energy demand, and overcrowding [11,12]. Additionally, the city’s arid climate, combined with frequent sandstorms, further elevates PM concentrations, impacting the overall air quality and public health [13]. Despite these challenges, there is a scarcity of long-term data on the trends in PM and the associated trace elements in the region, necessitating comprehensive exposure assessments.
This study aims to analyze the long-term trends in PM10, PM2.5, and selected trace elements in Makkah’s ambient air from 2020 to 2024. By evaluating pollutant concentrations and estimating potential health risks, particularly cancer risk due to inhalation exposure, this research provides insights into air pollution trends and their long-term health implications. The findings will support evidence-based policymaking for air quality management, offering recommendations to mitigate exposure and improve public health outcomes [14,15,16,17].
2. Materials and Methods
2.1. The Study Area and Sampling Location
This study was conducted long-term from December 2020 to December 2024 in the Abdyiah area, Makkah, Saudi Arabia, with continuous monitoring of meteorological variables and particulate matter throughout the study period. Latitude (21.4264° N) and longitude (39.8244° E) (Abdyiah District, Makkah) coordinates were determined based on the location of the air quality monitoring station situated in Abdyiah District, Makkah, and verified using Google Maps (2025) and OpenStreetMap (2025). This area experiences significant air pollution due to the high population density during Hajj season and the moderate density during Umrah, vehicular emissions, and ongoing construction activities. The region is particularly vulnerable to elevated levels of PM10, PM2.5, and trace elements, making it an ideal site for assessing long-term air pollution trends. The sampling site was strategically chosen to reflect the ambient air quality, ensuring minimal interference from localized pollution sources.
2.2. Meteorological Measurements
Meteorological parameters were continuously monitored using Davis Instruments’ 6163 Vantage Pro2 Plus (Davis Instruments Corp., Hayward, CA, USA), a high-precision atmospheric measurement system. The key parameters recorded included air temperature, wind speed, wind direction, relative humidity, barometric pressure, rainfall rate, and UV radiation levels. The system was installed at a standardized height, in compliance with USEPA’s Quality Assurance Handbook for Air Pollution Measurement Systems, Volume IV: Meteorological Measurements (2017) [18]. Data were recorded at one-minute intervals and automatically stored in a data logger for retrieval and further analysis.
2.3. PM10 and PM2.5 Sampling and Analysis
Ambient air samples were collected using a Mini-Vol Portable Air Sampler (Airmetrics, Springfield, OR, USA) positioned at a 10 m height to ensure accurate measurements of airborne particulate matter. The sampler functioned at a flow rate of 16.6 L/min over a 24 h sampling period, following USEPA’s standard method 29/2000 [19]. The PM10 and PM2.5 samples were collected on 47 mm Teflon filters (Whatman, Marlborough, MA, USA) and stored in controlled conditions before and after sampling to prevent contamination.
A gravimetric analysis of the PM concentrations was performed using a high-precision microbalance (Denver, CO, USA). The filters were weighed before and after sampling under controlled temperature (35–40 °C) and humidity (60–70 ± 5%) conditions to minimize measurement errors.
2.4. Trace Element Analysis
The collected PM10 samples were analyzed for carcinogenic trace elements using Inductively Coupled Plasma Mass Spectrometry (ICP-MS) a Perkin Elmer 7300 (PerkinElmer, Inc., Waltham, MA, USA). The filters were subjected to microwave-assisted acid digestion using 7 mL of nitric acid (HNO3) and 2 mL of ultra-pure water to ensure complete dissolution of the metal constituents. The instrument operating conditions were optimized to enhance the detection sensitivity and minimize errors [20].
Calibration was performed using CertiPUR ICP Multi-Element Standard Solution VI (10 mg/L, Perkin Elmer, MA, USA), and procedural blanks were included to account for background contamination. The detection limits for trace metals were maintained at ≤3 ng/m3, with a recovery efficiency exceeding 95%. The following carcinogenic trace elements were measured: cadmium (Cd), chromium (Cr VI), arsenic (As), beryllium (Be), nickel (Ni), lead (Pb), cobalt (Co), antimony (Sb), and manganese (Mn).
These elements were selected based on their classification as hazardous air pollutants by the USEPA and WHO given their known carcinogenic effects and the potential health risks of inhalation exposure to them [20].
2.5. Excess Cancer Risk (ECR) Assessment
The excess cancer risk (ECR) associated with long-term exposure to trace elements in ambient air was estimated following the USEPA Framework for Metals Health Risk Assessment (EPA 120/R/001—March 2007) [21]. The ECR was calculated using the equation
where ECR = the excess cancer risk, Cpollutant = the annual mean concentration of the trace element in the air (µg/m3), and IUR = the inhalation unit risk factor obtained from the USEPA Integrated Risk Information System (IRIS) [21]. The specific IUR values used in the assessment are presented in Table 1.
ECR = Cpollutant × IUR

Table 1.
Inhalation unit risk (IUR) for carcinogenic trace elements.
2.6. Statistical Analysis
The data analysis included using both descriptive and inferential statistical techniques to assess the long-term trends in air quality and health risk. Descriptive statistics included the mean, standard deviation, median, and interquartile range, while the normality of the data distribution was assessed using the Shapiro–Wilk test and visual inspection of Q-Q plots. Based on the results, parametric testing was deemed appropriate, while the inferential analysis involved a one-way ANOVA for seasonal variations and a Pearson’s correlation analysis to explore the relationships between pollutant levels and meteorological conditions.
Additionally, multivariable linear regression models were developed to identify the key predictors of air pollution trends and assess the impact of meteorological parameters on PM concentrations. The regression models helped determine significant contributors to the variability in pollution in the study area.
2.7. Quality Assurance and Control
Rigorous quality assurance and control measures were implemented to ensure the data’s reliability. Instrument calibration was performed daily using certified standards, and procedural blanks were analyzed alongside real samples to verify contamination-free conditions. The analytical precision of the ICP-MS system was maintained through a triplicate sample analysis, ensuring that the relative standard deviation remained below 4% [20].
All of the data acquisition and processing adhered to the USEPA, WHO, and ISO air quality monitoring standards [18], ensuring the scientific validity and international comparability of our results. The integration of a high-resolution particulate matter analysis, trace element evaluation, and risk assessment models provides a robust framework for understanding the long-term air pollution trends and their associated health risks in Makkah.
3. Results
3.1. Meteorological Parameters (2020–2024)
The meteorological parameters in Abdyiah, Makkah, were recorded over five years (2020–2024) to analyze their seasonal variations and influence on air pollution dispersion. Table 2 revealed that wind speed ranged from 2.8 m/s (winter 2020) to 4.2 m/s (summer 2024), with peak wind gusts reaching 8.8 m/s in 2024. Temperature levels showed an increasing trend, with summer months consistently recording the highest values (38.2 °C in 2024), indicating worsening heat conditions. UV radiation also displayed an upward trend, peaking at 320 W/m2 in summer 2024, while rainfall varied across seasons, with winter generally experiencing the highest precipitation (32 mm in 2020 and 25 mm in 2024). Over the five-year period (2020–2024), the relative humidity in Makkah demonstrated consistent seasonal patterns, with higher averages observed during winter and autumn (approximately 50–60%) and lower levels seen during summer (ranging from 30–40%). These humidity trends align with the region’s arid desert climate. These environmental variations may have influenced the levels and dispersion of PM10, PM2.5, and trace elements in the region.
Table 2.
Seasonal meteorological parameters in Makkah (2020–2024).
3.2. Annual PM10 and PM2.5 Concentrations (2020–2024)
The average annual concentrations of PM10 and PM2.5 showed fluctuations over the five-year period. PM10 concentrations increased from 127.7 ± 14.2 µg/m3 in 2020 to 138.3 ± 15.7 µg/m3 in 2024, while the PM2.5 levels ranged from 100.7 ± 18.7 µg/m3 in 2020 to 109.8 ± 21.3 µg/m3 in 2024, as presented in Figure 1. The 95%confidence intervals (CIs) certainly indicate a gradual increase in PM levels over time (p < 0.01), reflecting worsening air quality. Table 3 presents a statistical breakdown of the PM10 and PM2.5 levels, including their standard deviations and confidence intervals.
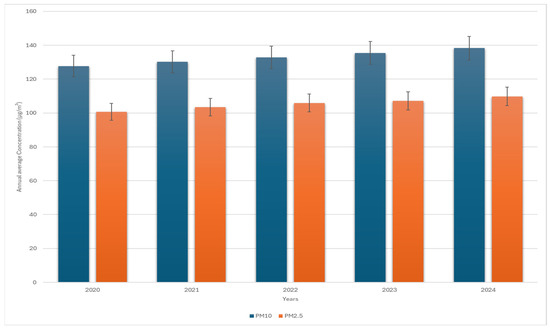
Figure 1.
Temporal trends in PM10 and PM2.5 concentrations across the sampling site in Makkah (2020–2024).
Table 3.
Annual average PM10 and PM2.5 concentrations (2020–2024).
3.3. Annual Trace Element Concentrations in PM10 (2020–2024)
Nine trace elements were analyzed in the ambient air samples, with their annual mean concentrations summarized in Table 4. The cadmium (Cd) concentrations ranged from 0.098 ± 0.012 µg/m3 in 2020 to 0.115 ± 0.015 µg/m3 in 2024. Chromium VI (Cr VI) exhibited a steady increase, reaching 0.012 ± 0.001 µg/m3 in 2024. The arsenic (As) concentrations ranged from 0.016 ± 0.002 µg/m3 in 2020 to 0.020 ± 0.002 µg/m3 in 2024. Other metals, including lead (Pb) and nickel (Ni), also showed noticeable increases.
Table 4.
Annual trace element concentrations in PM10 (2020–2024) (µg/m3 ± SD).
3.4. Association Between PM10, Trace Elements, and Cancer Risk (2020–2024)
The association between PM10 concentrations, trace element exposure, and the estimated excess cancer risk (ECR) was analyzed over the five-year period (2020–2024). The results, as presented in Table 5, indicate a steady increase in PM10 concentrations from 127.7 µg/m3 in 2020 to 138.3 µg/m3 in 2024, accompanied by a corresponding rise in the total ECR values from 1.12 × 10⁻³ to 1.42 × 10⁻³ over the same period.
Table 5.
Correlation between PM10 and excess cancer risk (ECR) for trace elements (2020–2024).
Among the trace elements contributing to cancer risk, chromium (VI) exhibited the highest carcinogenic potential, with its ECR increasing from 7.21 × 10⁻⁴ in 2020 to 8.47 × 10⁻⁴ in 2024. Cadmium (Cd), lead (Pb), and nickel (Ni) also demonstrated considerable contributions to cancer risk, highlighting the significance of these toxic metals in the ambient air. The observed increase in ECR values suggests potential worsening of air quality and an increasing health burden associated with long-term exposure to fine particulate matter and hazardous metals.
A strong positive correlation was found between the PM10 concentrations and total ECR values (r = 0.85 to 0.93, p < 0.01) across all five years, indicating that rising PM10 levels are directly linked to an increased risk of cancer due to metal inhalation exposure. This significant association underscores the critical need for continuous air quality monitoring, pollution control measures, and mitigation strategies to reduce exposure to airborne carcinogens.
3.5. Seasonal Variations in PM10, PM2.5, and Trace Elements (2020–2024)
To evaluate the short-term variability in air quality, the seasonal averages of PM10, PM2.5, and nine carcinogenic trace elements were analyzed from 2020 to 2024. As shown in Table 6, pollutant concentrations were consistently higher during winter and autumn, with a noticeable decrease during the summer months. These seasonal differences coincide with the reduced wind speeds and slightly more stable atmospheric conditions during winter, which may limit vertical dispersion and promote pollutant accumulation. PM10 reached 147.8 µg/m3 and Cr VI rose to 0.012 µg/m3 in winter 2024. Despite Makkah’s generally hot and arid climate, this seasonal fluctuation highlights the influence of meteorological parameters on particulate behavior.
Table 6.
Seasonal average concentrations of PM10, PM2.5, and trace elements (µg/m3)—(2020–2024).
4. Discussion
4.1. Long-Term Trends in PM10 and PM2.5 Concentrations
The study findings indicate an increasing trend in PM10 and PM2.5 5 levels from 2020 to 2024, with the PM10 concentrations rising from 127.7 ± 14.2 µg/m3 in 2020 to 138.3 ± 15.7 µg/m3 in 2024 and the PM2.5 levels increasing from 100.7 ± 18.7 µg/m3 to 109.8 ± 21.3 µg/m3 over the same period. These values exceed the WHO recommended annual mean guideline of 15 µg/m3 for PM2.5 and 45 µg/m3 for PM10 [22]. The annual Hajj pilgrimage, one of the world’s largest mass gatherings, is held in Makkah during the Islamic month of Dhul-Hijjah. Between 2020 and 2024, it consistently occurred during the summer, specifically in July (2020–2022) and June (2023–2024), aligning with peak temperature periods. These conditions may have affected the atmospheric dynamics and elevated the risk of pollutant accumulation. In comparison, Umrah is observed year-round without seasonal limitations, contributing to a steady but more dispersed flow of visitors. Unlike Umrah, Hajj involves a highly concentrated number of pilgrims over a short span, which can lead to more significant and immediate effects on the particulate matter concentrations due to increased human activity and transportation within a confined time frame. Several studies have reported similar trends in urban and industrialized areas, attributing the increase to population growth, vehicular emissions, and ongoing construction activities [23,24]. Comparable studies, including one from China in 2020 [25] and another from Thailand in 2025 [26], have demonstrated that elevated PM levels are strongly influenced by meteorological factors such as wind speed, temperature, and atmospheric pressure, which play a crucial role in pollutant dispersion and accumulation. Similar to the findings from Jinan in China, our study highlights that seasonal patterns and emission-related socioeconomic factors significantly influence the PM10 and PM2.5 concentrations in Makkah [27].
Sampling was conducted at a height of 10 m in accordance with USEPA’s Quality Assurance Handbook for Air Pollution Measurement Systems, Volume IV: Meteorological Measurements (2017) [18]), which was intended to ensure the data’s comparability and minimize the interference from local ground-level disturbances. While a gradual increase in PM10 and PM2.5 levels was observed from 2020 to 2024, the overlapping standard errors between years suggest that some of the year-to-year fluctuations may not have been statistically significant.
4.2. Trace Element Concentrations in PM10
The presence of carcinogenic trace elements in the PM10 samples further raises concerns regarding air quality and health risks. This study observed increasing annual mean concentrations of key hazardous metals, including cadmium (Cd), chromium VI (Cr VI), arsenic (As), beryllium (Be), nickel (Ni), lead (Pb), cobalt (Co), antimony (Sb), and manganese (Mn). Among these, Cr VI exhibited the highest carcinogenic potential, with its concentrations increasing from 0.008 ± 0.001 µg/m3 in 2020 to 0.012 ± 0.001 µg/m3 in 2024. These values align with global research showing that Cr VI, Cd, and Ni are among the most hazardous airborne pollutants due to their persistent nature and bioaccumulation potential [28,29]. Studies in highly urbanized settings have shown that prolonged exposure to these metals increases the risk of respiratory diseases, cardiovascular disorders, and carcinogenesis [30,31].
4.3. Meteorological Influences on Air Pollution
Meteorological conditions significantly influence air pollutant dispersion, and this study found that wind speed, temperature, and UV radiation had substantial seasonal variability. The highest wind speeds (4.2 m/s) were recorded in summer, contributing to pollutant transport, while the lower wind speeds in winter (2.8 m/s) favored pollutant accumulation. Similar patterns have been observed in other urban environments, where weak wind speeds and temperature inversions contribute to higher PM concentrations [32,33,34]. Rising temperatures, from an average of 32.5 °C in 2020 to 34.5 °C in 2024, may also contribute to secondary pollutant formation, including ozone and photochemically active compounds, worsening air quality [35]. The role of UV radiation in atmospheric photochemical reactions further highlights the complexity of the pollution dynamics in Makkah.
4.4. The Association Between PM10 and Trace Elements
A significant positive correlation (r = 0.85 to 0.93, p < 0.01) was found between the PM10 concentrations and total excess cancer risk (ECR), confirming that airborne trace elements contribute significantly to carcinogenic risks. Cr VI had the highest contribution to cancer risk, with its ECR increasing from 7.21 × 10⁻⁴ in 2020 to 8.47 × 10⁻⁴ in 2024, followed by that of Cd and Ni. These findings align with previous studies in Makkah conducted by Adly et al. in 2017 and 2019, where Cr VI and Cd were identified as dominant airborne carcinogens [36,37]. Studies have also demonstrated that inhalation exposure to Ni, Pb, and As is associated with increased risks of lung cancer, chronic bronchitis, and DNA damage [38,39].
4.5. Public Health and Policy Implications
Given the significant regulations and public health efforts that the Kingdom is implementing, alongside its remarkable achievements aligned with Vision 2030 Health Goals, immediate intervention is required. Implementing stricter emission regulations, promoting sustainable urban planning, and enforcing vehicle emission controls should be prioritized. Additionally, increasing green spaces and vegetation cover can serve as natural air filters, reducing ambient pollutant concentrations. Technological advancements such as real-time air quality monitoring and early warning systems should be integrated into public health policies to mitigate exposure risks. Public awareness campaigns should also be strengthened to educate the population about the health impacts of air pollution and encourage protective measures, such as wearing masks during high-pollution periods. From a public health perspective, increasing access to healthcare services and regular health screenings for residents and pilgrims should be considered, particularly for individuals at higher risk of air-pollution-related diseases. Future research should focus on identifying specific pollution sources, evaluating mitigation strategies, and assessing the long-term health effects of exposure to particulate matter and toxic trace elements in Makkah.
4.6. Study Limitations
This study was limited to analyzing the trace elements in the PM10 fraction only, without chemical characterization of PM2.5. The measurements were conducted at a single urban site, which may not have captured the spatial variability across the city. Additionally, no source distribution analysis was performed, which restricts the conclusions about specific emission sources.
5. Conclusions
This study presents a five-year evaluation of the air quality trends in Makkah (2020–2024), focusing on the concentrations of PM10 and PM2.5 and selected trace elements, with seasonal peaks observed during winter and autumn. PM10 reached 147.8 ± 16.4 µg/m3 and PM2.5 reached 119.5 ± 21.7 µg/m3 in winter 2024, compared to 131.8 ± 15.2 µg/m3 and 104.9 ± 19.6 µg/m3 during the summer, with seasonal variations shaped by climate factors and periods of increased human activity. Trace elements such as Cr VI and Cd also peaked during winter, reaching 0.012 µg/m3 and 0.117 µg/m3, respectively, in winter 2024, compared to 0.009 µg/m3 and 0.103 µg/m3 during the summer. Saudi Arabia continues to advance its national goals for environmental protection, investing in emission control measures, expanding air monitoring infrastructure, and raising public health awareness. These efforts are especially relevant in cities such as Makkah, which experience a high population density during Hajj and Umrah seasons. The outcomes of this research align with the Kingdom’s Vision 2030 initiatives, particularly the National Environment Strategy and the Quality-of-Life Program. By offering long-term, evidence-based insights into air pollutant behavior, this study contributes to the knowledge base that supports decision-making in environmental policy, urban planning, and public health. Strengthening the connection between scientific research and policy development will enhance sustainable practices and health outcomes across the region further.
Author Contributions
Conceptualization, H.M.A. and S.A.K.S.; methodology, H.M.A. and S.A.K.S.; software, S.A.K.S.; validation, S.A.K.S.; formal analysis, S.A.K.S.; investigation, H.M.A.; resources, S.A.K.S.; data curation, S.A.K.S.; writing—original draft preparation, H.M.A. and S.A.K.S.; writing—review and editing, H.M.A. and S.A.K.S.; visualization, H.M.A. and S.A.K.S.; supervision, H.M.A. and S.A.K.S.; project administration, S.A.K.S.; funding acquisition, H.M.A. and S.A.K.S. All authors have read and agreed to the published version of the manuscript.
Funding
This research was funded by Umm Al-Qura University, Saudi Arabia, under grant number 25UQU4240001GSSR02.
Institutional Review Board Statement
Not applicable.
Informed Consent Statement
Not applicable.
Data Availability Statement
The data are available upon request from authors.
Acknowledgments
The authors extend their appreciation to Umm Al-Qura University, Saudi Arabia, for funding this research work through grant number 25UQU4240001GSSR02.
Conflicts of Interest
The authors declare no conflicts of interest.
Abbreviations
The following abbreviations are used in this manuscript:
| PM10 | Particulate matter with an aerodynamic diameter ≤ 10 µm |
| PM2.5 | Particulate matter with an aerodynamic diameter ≤ 2.5 µm |
| ECR | Excess cancer risk |
| IUR | Inhalation unit risk |
| Cr VI | Hexavalent chromium |
| Cd | Cadmium |
| As | Arsenic |
| Be | Beryllium |
| Ni | Nickel |
| Pb | Lead |
| Co | Cobalt |
| Sb | Antimony |
| Mn | Manganese |
| USEPA | United States Environmental Protection Agency |
| WHO | World Health Organization |
| ICP-MS | Inductively Coupled Plasma Mass Spectrometry |
| UV | Ultraviolet radiation |
| ANOVA | Analysis of variance |
| IRIS | Integrated Risk Information System |
| ATSDR | Agency for Toxic Substances and Disease Registry |
| ISO | International Organization for Standardization |
| HNO3 | Nitric acid |
| µg/m3 | Micrograms per cubic meter |
| m/s | Meters per second |
| °C | Degrees Celsius |
References
- Thangavel, P.; Park, D.; Lee, Y.C. Recent Insights into Particulate Matter (PM2.5)-Mediated Toxicity in Humans: An Overview. Int. J. Environ. Res. Public Health 2022, 19, 7511. [Google Scholar] [CrossRef] [PubMed]
- Thiagarajan, V.; Nah, T.; Xin, X. Impacts of Atmospheric Particulate Matter Deposition on Phytoplankton: A Review. Sci. Total Environ. 2024, 950, 175280. [Google Scholar] [CrossRef] [PubMed]
- Basith, S.; Manavalan, B.; Shin, T.H.; Park, C.B.; Lee, W.S.; Kim, J.; Lee, G. The Impact of Fine Particulate Matter 2.5 on the Cardiovascular System: A Review of the Invisible Killer. Nanomaterials 2022, 12, 2656. [Google Scholar] [CrossRef]
- Maciejczyk, P.; Chen, L.-C.; Thurston, G. The Role of Fossil Fuel Combustion Metals in PM2.5 Air Pollution Health Associations. Atmosphere 2021, 12, 1086. [Google Scholar] [CrossRef]
- Li, B.; Ma, Y.; Zhou, Y.; Chai, E. Research progress of different components of PM2.5 and ischemic stroke. Sci. Rep. 2023, 13, 15965. [Google Scholar] [CrossRef]
- Agibayeva, A.; Guney, M.; Karaca, F.; Kumisbek, A.; Kim, J.R.; Avcu, E. Analytical Methods for Physicochemical Characterization and Toxicity Assessment of Atmospheric Particulate Matter: A Review. Sustainability 2022, 14, 13481. [Google Scholar] [CrossRef]
- Mitra, S.; Chakraborty, A.J.; Tareq, A.M.; Emran, T.B.; Nainu, F.; Khusro, A.; Idris, A.M.; Khandaker, M.U.; Osman, H.; Alhumaydhi, F.A.; et al. Impact of Heavy Metals on the Environment and Human Health: Novel Therapeutic Insights to Counter the Toxicity. J. King Saud Univ. Sci. 2022, 34, 101865. [Google Scholar] [CrossRef]
- Holme, J.A.; Vondráček, J.; Machala, M.; Lagadic-Gossmann, D.; Vogel, C.F.A.; Le Ferrec, E.; Sparfel, L.; Øvrevik, J. Lung Cancer Associated with Combustion Particles and Fine Particulate Matter (PM2.5)—The Roles of Polycyclic Aromatic Hydrocarbons (PAHs) and the Aryl Hydrocarbon Receptor (AhR). Biochem. Pharmacol. 2023, 216, 115801. [Google Scholar] [CrossRef]
- International Agency for Research on Cancer (IARC). A Review of Human Carcinogens. Part C: Arsenic, Metals, Fibres, and Dusts. IARC Monographs on the Evaluation of Carcinogenic Risks to Humans 2012, 100C, Lyon, France. Available online: https://monographs.iarc.who.int/agents-classified-by-the-iarc/ (accessed on 12 February 2025).
- Simpson, I.J.; Aburizaiza, O.S.; Siddique, A.; Barletta, B.; Blake, N.J.; Gartner, A.; Khwaja, H.; Meinardi, S.; Zeb, J.; Blake, D.R. Air Quality in Mecca and Surrounding Holy Places in Saudi Arabia during Hajj: Initial Survey. Environ. Sci. Technol. 2014, 48, 8529–8537. [Google Scholar] [CrossRef]
- Habeebullah, T.M.A. Chemical Composition of Particulate Matters in Makkah—Focusing on Cations, Anions and Heavy Metals. Aerosol Air Qual. Res. 2016, 16, 336–347. [Google Scholar] [CrossRef]
- Habeebullah, T.M.; Nagarani, N.; Kumaraguru, A.K.; Devi, V.J.; Devi, C.A. An Analysis of Air Pollution in Makkah—A Viewpoint of Source Identification. Atmos. Environ. 2013, 45, 163–172. [Google Scholar]
- Farahat, A.; Chauhan, A.; Al Otaibi, M.; Singh, R.P. Air Quality Over Major Cities of Saudi Arabia During Hajj Periods of 2019 and 2020. Earth Syst. Environ. 2021, 5, 101–114. [Google Scholar] [CrossRef] [PubMed]
- Vilcassim, R.; Thurston, G.D. Gaps and Future Directions in Research on Health Effects of Air Pollution. eBioMedicine 2023, 93, 104668. [Google Scholar] [CrossRef]
- Li, J.; Deng, Z.; Soerensen, S.J.C.; Kachuri, L.; Cardenas, A.; Graff, R.E.; Leppert, J.T.; Langston, M.E.; Chung, B.I. Ambient Air Pollution and Urological Cancer Risk: A Systematic Review and Meta-Analysis of Epidemiological Evidence. Nat. Commun. 2024, 15, 5116. [Google Scholar] [CrossRef] [PubMed]
- Tainio, M.; Andersen, Z.J.; Nieuwenhuijsen, M.J.; Hu, L.; de Nazelle, A.; An, R.; Garcia, L.M.T.; Goenka, S.; Zapata-Diomedi, B.; Bull, F.; et al. Air Pollution, Physical Activity and Health: A Mapping Review of the Evidence. Environ. Int. 2021, 147, 105954. [Google Scholar] [CrossRef] [PubMed]
- United States Environmental Protection Agency (USEPA). Research on Health Effects from Air Pollution. Available online: https://www.epa.gov/air-research/research-health-effects-air-pollution (accessed on 26 January 2025).
- United States Environmental Protection Agency (USEPA). Quality Assurance Handbook for Air Pollution Measurement Systems Volume II. Ambient Air Quality Monitoring Program 2017. Available online: https://www.epa.gov/sites/default/files/2020-10/documents/final_handbook_document_1_17.pdf (accessed on 26 January 2025).
- United States Environmental Protection Agency (USEPA). Method 29: Determination of Metal Emissions from Stationary Sources; Report No.: EPA/625/R-96/010b; USEPA: Washington, DC, USA, 2000.
- Perkin Elmer ICP Procedure. Optima 7300 V ICP-OES HF Version. Available online: https://resources.perkinelmer.com/lab-solutions/resources/docs/SPC_Optima7300VICP-OES.pdf (accessed on 26 January 2025).
- United States Environmental Protection Agency (USEPA). Integrated Risk Information System (IRIS). Available online: https://iris.epa.gov (accessed on 28 January 2025).
- World Health Organization (WHO). WHO Global Air Quality Guidelines. Available online: http://apps.who.int/iris (accessed on 28 January 2025).
- Wang, L.; Niu, D.; Fan, H.; Long, X. Urban Configuration and PM2.5 Concentrations: Evidence from 330 Chinese Cities. Environ. Int. 2022, 161, 107129. [Google Scholar] [CrossRef] [PubMed]
- Kumar, P.G.; Lekhana, P.; Musini, T.; Chandrakala, S. Effects of Vehicular Emissions on the Urban Environment—A State of the Art. Mater. Today Proc. 2020, 45, 738–745. [Google Scholar] [CrossRef]
- Chen, Z.; Chen, D.; Zhao, C.; Kwan, M.P.; Cai, J.; Yan, Z.; Zhao, B.; Wang, X.; Chen, B.; Yang, J.; et al. Influence of Meteorological Conditions on PM2.5 Concentrations Across China: A Review of Methodology and Mechanism. Environ. Int. 2020, 139, 105558. [Google Scholar] [CrossRef] [PubMed]
- Nakyai, T.; Santasnachok, M.; Thetkathuek, A.; Phatrabuddha, N. Influence of Meteorological Factors on Air Pollution and Health Risks: A Comparative Analysis of Industrial and Urban Areas in Chonburi Province, Thailand. Environ. Adv. 2025, 19, 100608. [Google Scholar] [CrossRef]
- Guo, Q.; He, Z.; Wang, Z. Change in Air Quality during 2014–2021 in Jinan City in China and Its Influencing Factors. Toxics 2023, 11, 210. [Google Scholar] [CrossRef] [PubMed]
- Nazir, R.; Shah, M. Study of Pollution Status and Health Risks for Selected Metals in PM10 from Islamabad, Pakistan. Int. J. Environ. Sci. Technol. 2024, 21, 10059–10074. [Google Scholar] [CrossRef]
- Shaltout, A.; Kadi, M.; Abd Elkader, O.; Boman, J. Environmental and Health Risks of Potentially Toxic Elements in Ambient PM10 in Jeddah, Saudi Arabia. Int. J. Environ. Sci. Technol. 2024, 21, 6261–6274. [Google Scholar] [CrossRef]
- Lamas, G.A.; Bhatnagar, A.; Jones, M.R.; Mann, K.K.; Nasir, K.; Tellez-Plaza, M.; Ujueta, F.; Navas-Acien, A. Contaminant Metals as Cardiovascular Risk Factors: A Scientific Statement from the American Heart Association. J. Am. Heart Assoc. 2023, 12, e029852. [Google Scholar] [CrossRef]
- Wang, M.; Yan, L.; Dou, S.; Yang, L.; Zhang, Y.; Huang, W.; Li, S.; Lu, P.; Guo, Y. Blood Multiple Heavy Metals Exposure and Lung Function in Young Adults: A Prospective Cohort Study in China. J. Hazard. Mater. 2023, 459, 132064. [Google Scholar] [CrossRef]
- Merenda, B.; Drzeniecka-Osiadacz, A.; Sówka, I.; Sawiński, T.; Samek, L. Influence of Meteorological Conditions on the Variability of Indoor and Outdoor Particulate Matter Concentrations in a Selected Polish Health Resort. Sci. Rep. 2024, 14, 19461. [Google Scholar] [CrossRef]
- Seo, J.; Park, D.S.R.; Kim, J.Y.; Youn, D.; Lim, Y.B.; Kim, Y. Effects of Meteorology and Emissions on Urban Air Quality: A Quantitative Statistical Approach to Long-Term Records (1999–2016) in Seoul, South Korea. Atmos. Chem. Phys. 2018, 18, 16121–16137. [Google Scholar] [CrossRef]
- Guo, Q.; He, Z.; Wang, Z. The Characteristics of Air Quality Changes in Hohhot City in China and their Relationship with Meteorological and Socio-economic Factors. Aerosol Air Qual. Res. 2024, 24, 230274. [Google Scholar] [CrossRef]
- Zhang, G.; Yu, X.; Yin, H.; Feng, C.; Ma, C.; Sun, S.; Cheng, H.; Wang, S.; Shang, K.; Liu, X. Heatwave-Amplified Atmospheric Oxidation in a Multi-Province Border Area in Xuzhou, China. Front. Environ. Sci. 2024, 12, 1496584. [Google Scholar] [CrossRef]
- Adly, H.; Saleh, S.; Saati, A.; Fatani, S. Cancer Risk of Inhalation Exposure to Cd, Cr, As, Be, and Ni in Ambient Air. J. Environ. Prot. 2017, 8, 290–300. [Google Scholar] [CrossRef][Green Version]
- Adly, H.; Saleh, A.K.; Saati, A.A.; Fatani, S.H. Airborne Carcinogenic Trace Elements Distribution Associated with Long-Term Exposure in Makkah Population. Open Environ. Res. J. 2019, 12, 1–7. [Google Scholar] [CrossRef]
- Lee, H.W.; Jose, C.C.; Cuddapah, S. Epithelial-Mesenchymal Transition: Insights into Nickel-Induced Lung Diseases. Semin. Cancer Biol. 2021, 76, 99–109. [Google Scholar] [CrossRef]
- Alves, N.O.; Pereira, G.M.; Di Domenico, M.; Costanzo, G.; Benevenuto, S.; Fonoff, A.M.O.; Costa, N.S.X.; Ribeiro, G.; Kajitani, G.S.; Moreno, N.C.; et al. Inflammation Response, Oxidative Stress and DNA Damage Caused by Urban Air Pollution Exposure Increase in the Lack of DNA Repair XPC Protein. Environ. Int. 2020, 145, 106150. [Google Scholar] [CrossRef]
Disclaimer/Publisher’s Note: The statements, opinions and data contained in all publications are solely those of the individual author(s) and contributor(s) and not of MDPI and/or the editor(s). MDPI and/or the editor(s) disclaim responsibility for any injury to people or property resulting from any ideas, methods, instructions or products referred to in the content. |
© 2025 by the authors. Licensee MDPI, Basel, Switzerland. This article is an open access article distributed under the terms and conditions of the Creative Commons Attribution (CC BY) license (https://creativecommons.org/licenses/by/4.0/).