1. Introduction
In recent years, extreme weather events have become frequent and serious. Disasters pose long-lasting consequences for agriculture, such as the loss of harvests. Between 2008 and 2018, approximately
$280 billion was lost, resulting from declines in global rice and livestock production [
1]. According to agricultural statistics from the Ministry of Agriculture in Taiwan, crop losses due to disasters amounted to nearly
$3.44 million from 2014 to 2023, with approximately 43% of the losses attributed to typhoons.
To mitigate such losses, the WMO (2019) highlighted and promoted the idea that the application of meteorological and climate information services can help farmers make optimal decisions. It is estimated that this could generate an additional
$30 billion in global annual output or reduce asset losses by
$2 billion. The estimated benefit-cost ratios are approximately 10 to 1, with some cases showing even higher values [
2].
Both the impact of meteorological information on climate-sensitive sectors (especially agriculture) and the benefits generated by climate services are critical. However, these require infrastructure, software, and talent cultivation, all of which can be costly. Given limited resources, assessing the potential value generated by applying meteorological information becomes essential.
The value of information is not a singular, uniform concept [
3]. For the purpose of this paper, the value chain of meteorological information services can be categorized into three interconnected stages: data collection and processing, information dissemination, and end-user application [
3,
4]. In the data collection and processing stage, meteorological agencies and data providers gather raw meteorological data through observation networks, automated systems, and forecasting models, forming the foundation for subsequent services. The information dissemination stage involves service providers transmitting processed meteorological data through multiple channels, including agricultural weather networks, mobile applications, and mass media, ensuring timely and accessible delivery to relevant stakeholders. Finally, in the end-user application stage, decision-makers, such as those in climate-sensitive sectors like agriculture, utilize meteorological information for disaster prevention, resource allocation, and operational planning, resulting in tangible economic and social benefits.
In addition, decisions based on climate information may generate broader economic value [
5]. For example, farmers may avoid disaster-related losses, leading to increased yields and reduced production costs for food producers. We refer to the value generated directly from the information service as the “direct value”, while the broader economic value or macroeconomic value will be termed the “indirect value”. This study will focus on evaluating the direct value of meteorological information services application in typhoon disaster prevention within the agricultural sector.
Since the impact of disasters and weather prediction accuracy are uncertain, and end-users’ decisions of disaster prevention, resource allocation, and operational planning are costly, the expected returns of acting according to weather forecasting information need to outweigh the cost to make decision-makers act. Therefore, this study will employ the cost-loss model to evaluate the value of meteorological information services. Our model provides a structured and quantifiable approach to consider the probability of an adverse weather event occurring based on Bayesian decision theory and allows decision-makers to assess the difference in expected net returns between taking action and not. By comparing the expected value of different outcomes, the model helps determine the criteria to take action and the value of typhoon forecasting services.
This study’s contribution lies in addressing the detailed information requirements of the cost-loss framework, which often encounters challenges due to the lack of specific and accurate data, such as prevention costs, disaster losses, and forecasting accuracy [
5]. These data are typically gathered through field surveys. The impact of the same disaster can vary across different locations, making each survey dataset unique and invaluable. However, disaster losses, which were previously estimated using survey-based methods, are now assessed through the concept of Average Annual Loss (AAL). As climate change drives shifts in disaster patterns, such as frequency and severity, uncertainty increases. To address this uncertainty, the AAL framework has been introduced, providing a more robust approach for quantifying potential disaster losses.
This paper is organized as follows.
Section 2 provides literature reviews discussing various methods assessing the value of meteorological services and goods.
Section 3 covers materials and methods.
Section 4 analyzes empirical results.
Section 5 and
Section 6 offer discussion and conclusions.
2. Literature Reviews
The meteorological value chain starts with the collection of meteorological data, followed by processing and analysis, and ultimately delivering the information to users [
4]. This study evaluates the value generated by meteorological services in guiding farmers’ decisions on whether to implement disaster prevention measures against typhoon damage.
There are several methods for assessing the value of meteorological services, which can be broadly categorized as follows [
4,
6,
7,
8]. A summary of these methods is provided in
Table 1, offering a comprehensive overview of how value is assessed in the context of meteorological services and goods. The first category is market prices, where meteorological services are treated as private goods that can be sold in the market. Strictly, market prices offer insights into the marginal benefits for private goods–like specialized forecasts, where consumers pay based on perceived value. However, for public goods such as general forecasts and warnings, market failures occur due to non-rival consumption and high exclusion costs. This method is particularly suitable for assessing the direct economic value of services that are “tradable” [
8].
The second category involves normative or prescriptive decision-making models, which are commonly used to guide decisions under conditions of imperfect information about weather or climate. These models are ideal for evaluating decision-making processes where optimization is needed to manage risks or uncertainty, such as in agricultural or disaster management planning. For instance, the study assessed the benefits of flood warning systems by cost-loss model. One practical example is from the Overlee gauging station in the UK, resulting in an expected annual flood damage of GBP 394,695 per year [
9]. There is also literature that discusses the distinction between forecast quality and economic value [
10]. Additionally, the cost-loss model could be applied to decide whether to implement ferritization. An example includes estimating the value of these forecasts to optimize fertilizer application in wheat enterprises in Western Australia, ranging from AUD 418 million to AUD 780 million annually. However, when extending this model to all cropping across Australia, the estimated value increases to between AUD 800 million and AUD 1491 million, suggesting that the broader application may overstate the benefits due to regional differences and variations in crop types [
5].
The third approach is descriptive behavioral response studies, which estimate the value of meteorological services by observing the behavior of individuals, businesses, or governments through surveys, experiments, and regression analysis. This method is well-suited for understanding how different groups respond to weather-related information and the indirect value they place on such services. A study employed a descriptive behavioral response approach to examine the impact of natural hazard risks on residential rents. Utilizing a hedonic pricing framework and analyzing 18,339 dwellings across Switzerland, the study estimated that properties exposed to moderate flood hazards experience a 1.4% rental discount, indicating that tenants are less willing to pay for homes located in risk-prone areas [
11]. Similar studies applied a hedonic pricing framework to estimate valuation effects, finding that properties in flood-prone areas experience a 1–3% discount, with land values declining by 2–5% [
12].
Table 1.
Summary of research on methods.
Table 1.
Summary of research on methods.
| Source | Objective | Method |
|---|
| [8] | The marginal benefits to users of some types of meteorological services | Market prices: Public good properties of non-rival consumption |
| [5] | Analysis of the benefits of improved seasonal climate forecasting from the agricultural sector in Australia | Prescriptive decision-making models: Cost-loss model |
| [9] | Estimate the benefits of (imperfect) FFWRSs (flood forecasting warnings) in reducing flood risk | prescriptive decision-making models: Cost-loss model |
| [11] | Examine the relationship between residential rents and exposure to five different climate-related natural hazards | Descriptive behavioral approach: Hedonic pricing |
| [12] | Tests if contemporary house prices reflect the flood vulnerability of properties | Descriptive behavioral approach: Hedonic pricing |
| [13] | Value of meteorological information services for Taiwan’s capture fishery industry | Contingent valuation method: CVM |
| [14] | Value of meteorological information services from agricultural producers in Taiwan | Contingent valuation method: CVM |
Finally, contingent valuation methods aim to determine the willingness to pay for specific levels of public good by creating hypothetical market scenarios through surveys. These methods provide valuable insights into how people and organizations perceive the value of weather-related services. The study applied the contingent valuation method (CVM) to assess the economic benefits of meteorological information services for Taiwan’s capture fishery industry, estimating a median willingness to pay of NTD 2111.12 per practitioner annually and a total economic value of NTD 376–496 million [
13]. Similar studies have also evaluated the economic benefits of meteorological information services in different fields [
14].
For the purpose of the analysis, this paper applies the cost-loss model, which is considered a form of normative or prescriptive decision-making model, as an approach. It applies Bayesian decision theory to assess the expected net return of an activity, comparing scenarios where actions are taken versus those where no action is taken while accounting for the occurrence or non-occurrence of weather-related events.
The cost-loss model for assessing the value of meteorological services or goods relies on several key parameters. These include the probability of an event occurring (p), the probability of a correct forecast (h), the probability of a false alarm (f), the probability of a miss (m), the prevention cost (C), and the losses (L) caused by an event occurring. Considering that even with prevention measures in place, losses cannot be completely avoided, the total loss is further divided into avoidable losses (L
a) and unavoidable losses (L
u) [
5,
9].
Due to the inherent uncertainty in disaster events, the parameters used to estimate losses can fluctuate over time and under varying circumstances. To address this uncertainty, the method of Average Annual Loss (AAL) is utilized to estimate long-term disaster-related losses. AAL is a vital risk analysis tool for estimating expected losses from extreme weather events such as droughts, floods, and hurricanes. It is calculated by multiplying the probability of an event occurring by its expected loss and summing over all potential events [
7,
15,
16].
This approach establishes a continuous relationship between the frequency and severity of extreme weather events and their associated production losses, offering a more reliable estimate of economic impacts over time. For example, if a specific region experiences an agricultural loss of 100 million units due to a hurricane, with a 1 in 100 years probability of occurrence, the expected annual loss for this event would be calculated as 100 million * (1/100) = 1 million units.
Last but not least, before calculating the AAL, it is crucial to estimate loss functions for agricultural product losses. However, the dependent variable, agricultural losses resulting from typhoon occurrences, may be zero-inclusive. Specifically, in some cases where a typhoon impacted Taiwan but did not cause losses exceeding the threshold for official disaster claims, losses may be missing or unrecorded. In such instances, applying Ordinary Least Squares (OLS) estimation could introduce bias due to data censoring [
17]. To figure out the issue, the Tobit model is employed as a more suitable approach for estimating the damage function, ensuring a more precise and reliable assessment of potential agricultural losses.
While previous studies have applied the cost-loss model to assess the economic value of meteorological services, they often rely on data based on assumptions. For instance, some studies calculate yield profits by assuming a specific price per hectare of wheat [
5]. Part of the study estimates the loss through a linear relationship between flood depth and the number of properties affected by different water levels [
9]. However, the disaster loss data derived from such assumptions or models can be prone to estimation errors due to climate change, which can affect disaster patterns and outcomes.
The novelty of this study lies in its approach to disaster loss estimation through the Average Annual Loss (AAL) framework. By applying AAL, this study offers a more robust and long-term method for quantifying potential disaster losses, addressing the uncertainties introduced by climate change, and providing a more reliable approach to evaluating the economic value of meteorological services for disaster prevention.
The main aim of this research is to provide a quantifiable and robust assessment of the value of meteorological information services in supporting agricultural decision-making processes. Specifically, this study focuses on understanding how meteorological services influence disaster preparedness decisions, which can mitigate the financial impacts of typhoons on agricultural production.
In summary, this study fills a critical gap in the literature by applying an advanced decision-making model to assess the value of meteorological services in agriculture, particularly in the context of typhoon disaster prevention. The novelty lies in the integration of a cost-loss model and the AAL framework to account for uncertainties in disaster forecasting, making the findings more robust and applicable to real-world decision-making.
3. Data and Methods
The initial step in this study involves the estimation of the damage function, which aims to identify and quantify the relationships between various independent variables and the dependent variable. This step is crucial in estimating the average disaster loss resulting from a single typhoon event. Given the inherent uncertainty in the frequency of typhoons affecting Taiwan each year, the Average Annual Loss (AAL) methodology is employed to estimate the potential annual disaster losses associated with typhoons, considering the probability of occurrence for each event.
Following this, we will integrate survey data with the previously estimated average annual typhoon-related losses. This will enable the application of a cost-loss model, which is instrumental in evaluating the potential value that farmers can derive from utilizing meteorological information in their decision-making processes related to disaster preparedness, specifically for typhoon events. By applying this model, we aim to quantify the economic benefits of leveraging weather forecasts for improving risk management and disaster response strategies in the agricultural sector. The following sections will provide a brief overview of the various methods used in this study, along with key data sources essential to the analysis.
3.1. Estimation of Loss Function
The primary aim of estimating the loss function is to quantify the average agricultural losses attributable to typhoon events. To estimate these losses, we first refer to employing the Cultivation Calendar of Crop Disaster Prevention (Cultivation Calendar of Crop Disaster Prevention outlines the potential disasters that specific crops may face at different time points, the preventive measures that can be implemented, and post-disaster recovery methods, published by the Ministry of Agriculture in Taiwan. Retrieved from:
https://disaster.tari.gov.tw/ARI/public/crop_disaster, accessed on 15 March 2025). to identify potential explanatory variables. Subsequently, we consult with experts to refine and gather the most pertinent data. The final model incorporates the explanatory variables including typhoon intensity, characterized by maximum average wind speed and maximum 24 h accumulated rainfall, landfall trajectory, and regional dummy variables that account for the affected areas. Once the relationship between these exogenous variables and agricultural losses is established, it becomes possible to estimate disaster-related losses for various agricultural products across the northern, central, southern, and eastern regions. The formula is like Equation (1).
In Equation (1),
ln yc represents the natural logarithm of agricultural product losses caused by typhoons, where subscript
c denotes different product categories, including rice, cereal, special crops, vegetables, fruits, and other horticultural products;
and
represent the intercept term and coefficient of typhoon characteristics, respectively;
ln w denotes the natural logarithm of the maximum average wind speed;
ln pp represents the natural logarithm of the maximum 24 h accumulated rainfall.
is a set of dummy variables representing the four regions (north, central, south, and east), where
= 1 indicates the northern region,
= 1 indicates the central region, and
= 1 indicates the southern region, while all three being 0 represents the eastern region.
represents the coefficients of the regional dummy variables.
is a dummy variable for the typhoon trajectory, classified into 10 categories according to the Central Weather Administration’s classification, with Category 1 (trajectory 1) serving as the reference group for comparison.
represents the coefficients of the typhoon trajectory dummy variables. The results of the loss function estimation can be found in
Appendix A.
3.2. Calculation of Annual Average Loss
In this study, the calculation of Average Annual Loss (AAL) is based on the estimation of loss exceedance probabilities, which are quantified using the Occurrence Loss Exceedance Probability (OEP). The OEP curve represents the probability of exceeding the maximum loss from a single disaster event in a given year, a concept commonly used in infrastructure design. For instance, the exceedance probability is 1 when the maximum loss is set to 0 in a given year. As the loss increases, the exceedance probability decreases accordingly.
Traditionally, the Occurrence Loss Exceedance Probability (OEP) curve has been used in designing flood control and water infrastructure, focusing on the maximum loss from a single event each year. However, this approach is limited when multiple disasters occur within a year, as the losses from these events accumulate. With the growing attention in various fields such as disaster insurance, decision-makers now need to estimate the total potential losses from all possible events in a given year. This shift has led to an increasing focus on Aggregate Loss Exceedance Probability (AEP), which considers cumulative losses from multiple events, offering a more comprehensive view of disaster risk.
Actually, AEP provides insight into the likelihood of experiencing different levels of loss due to various disaster scenarios, but it only reflects the probability, not the actual loss amount. To transform this probability into a meaningful loss estimate, we use Average Annual Loss (AAL). AAL is derived from the AEP curve by multiplying the probability of each possible disaster event (as defined by AEP) by its corresponding expected loss and then summing the results across all potential events.
For the estimation of AAL, we first construct an Event Loss Table (ELT) in
Table 2. The events are categorized based on typhoon characteristics, specifically the maximum 24 h accumulated rainfall, arranged in ascending order. Each category is associated with an expected loss (
), derived from a loss function, representing the average loss per typhoon. Additionally, it is linked to the average annual occurrence rate
. For further details, please refer to
Appendix B.
Assuming that each event follows an independent Poisson process, the number of occurrences () in a given period is simulated using Monte Carlo simulation with the parameter To enhance the statistical robustness and accuracy of the results, we perform 10,000 simulations (M = 10,000), with each simulation representing a potential realization of disaster occurrences within a year.
The simulated loss (
) for each event is calculated using Formula (2). It is important to note that
represents the accumulated loss for a specific magnitude (rainfall range) within a year.
Subsequently, the aggregate loss for the year is computed using Formula (3). Thus, we obtain 10,000 values of
, representing the aggregate losses over 10,000 years, reflecting the average aggregate loss in the short term.
Finally, the aggregate losses are arranged in descending order, where each loss denotes the k-th largest value in the sorted list. The probability of exceeding the k-th value of loss is given by k/M, where M represents the total number of simulations. By following this procedure, the AEP curve can be effectively constructed. The AAL is then obtained by multiplying the AEP with the corresponding aggregate loss (
). It gives the weighted average loss over the long term, reflecting the risk-adjusted expected loss. The estimation of AAL is provided in
Appendix C.
3.3. Cost-Loss Model
The cost-loss model is an analytical approach derived from Bayesian decision theory [
5,
9]. It could be imagined as a contingency table like
Table 3. There are four different outcomes.
When the meteorological service issues a typhoon warning in advance (A) and the typhoon does indeed impact the area (P), the joint probability is denoted by H. In this case, farmers incur short-term prevention costs (C) for taking precautionary measures, and they also face unavoidable losses (Lu) as these measures cannot completely prevent all damage.
If the meteorological service does not issue a warning (A) and the typhoon does not impact the area (1 − P), the joint probability is represented by Q. In this scenario, farmers do not take any preventive actions and thus do not incur any losses (0).
Conversely, if the meteorological service does not issue a warning (1 − A) but the typhoon does impact the area (P), the joint probability is denoted by M. In this case, farmers not having taken any preventive measures do not incur related costs but will face both avoidable losses (La) and unavoidable losses (Lu).
If the meteorological service issues an early warning (1 − A) but the typhoon does not impact the area (1 − P), the joint probability is represented by F. Farmers will take preventive actions, incurring prevention costs (C), but since the typhoon does not make landfall, no damage occurs.
There are relationships between these parameters, for example, P = H + M, and H + F + M + Q = 1; the accuracy of the forecast (A), which refers to the overall probability of a correct forecast, that is, the probability that the forecast correctly predicts either the occurrence (H) or non-occurrence (Q) of the event.
To assess the economic value of decision-making after applying to the meteorological services and goods, we can consider three scenarios: (1) The scenario with no weather forecasts (expected annual damage with no warning, EAD
nowarn): There is no forecast information before the disaster, and farmers do not take any preventive measures, so the expected loss value solely depends on the probability of a typhoon occurring, as shown in Equation (4); (2) The scenario with perfect forecasts (EAD
perfect): Regardless of whether a disaster occurs or not, the meteorological service organization can make a 100% accurate forecast. In this case, A is 100%, and the expected loss value is as shown in Equation (5); (3) The scenario with existing (imperfect) forecasts EAD
system: There is weather forecasting, but the information is not 100% accurate, so the expected loss value is as shown in Equation (6).
Using these scenarios, we can define the relative economic value (REV) of the current weather information service, which is the contribution of existing weather information to reducing the expected loss value compared to a perfect weather forecast and a scenario with no weather information, as shown in Equation (7).
By substituting Equations (4) to (6) into Equation (7), we obtain Equation (8):
In other words, REV measures the economic value of the current meteorological information, considering its accuracy, in comparison to the value of information that is 100% accurate.
The model uses these parameters to calculate the expected value of taking action (e.g., implement some preventive measures avoiding harvests from damage) or not taking action under different scenarios and determines whether action should be taken based on the expected value. Action should only be taken if the expected value of taking action exceeds the expected value of not taking action.
To guide this decision-making process, the cost-loss ratio is incorporated, as shown in Equation (9):
The cost-loss ratio r compares the cost of preventive actions to the potential losses that could be avoided. If the ratio r is greater than 1, it means the expected value of the avoided losses (La) outweighs the cost of prevention (C), making it economically beneficial to take preventive action. In contrast, if the ratio is less than 1, the cost of prevention exceeds the benefit, and no action would be taken.
3.4. Data Collection
3.4.1. Questionnaire Survey
The data for the cost-loss model parameters, such as the probability of a correct forecast (A), the avoidable disaster loss ratio (La), unavoidable loss ratio (Lu), and prevention costs (C), were collected through a questionnaire survey. This survey was funded by the Central Weather Administration (CWA) of the Ministry of Transportation and Communications (MOTC) in Taiwan under grant number MOTC-CWB-1082065B.
To assess the demand for meteorological forecast services and disaster prevention investments among agricultural practitioners, a structured survey was conducted across four major regions in Taiwan: north, central, south, and east. The survey targeted representative Farmers’ Associations in Hsinchu County, Changhua County, Kaohsiung City, and Hualien County, selected based on their regional agricultural significance. Data collection was carried out through in-person interviews using a structured questionnaire, covering topics such as meteorological awareness, economic benefits, disaster experiences, and demographic information. A total of 420 responses were collected and distributed as follows: Hsinchu (75), Changhua (49), Kaohsiung (194), and Hualien (102). After excluding 67 protest zero samples, 353 valid samples were used for further analysis.
The questionnaire was divided into four sections. The first assessed respondents’ awareness and experience with agricultural meteorological forecasts, including information usage frequency and preferred sources. The second examined the perceived economic benefits of using meteorological information services. The third explored experiences with meteorological disasters and mitigation measures. The final section collected demographic data, including age, education, farming methods, and income. The following will show the key results of data collection.
- (1)
Probability of a correct forecast (A)
Generally speaking, the accuracy of meteorological information can be divided into two types: subjective and objective definitions. The former refers to the accuracy based on the user’s past experiences and personal judgment of the information’s reliability, while the latter combines historical forecasting events and observational data to calculate the accuracy rate.
It is important to note that the focus of this study is to evaluate the overall economic and social impacts driven by the avoidable losses resulting from the application of meteorological information services by farmers for typhoon prevention. Therefore, the users’ confidence and willingness to use, also known as the “subjective accuracy rate of weather forecasting”, are the key points of this research.
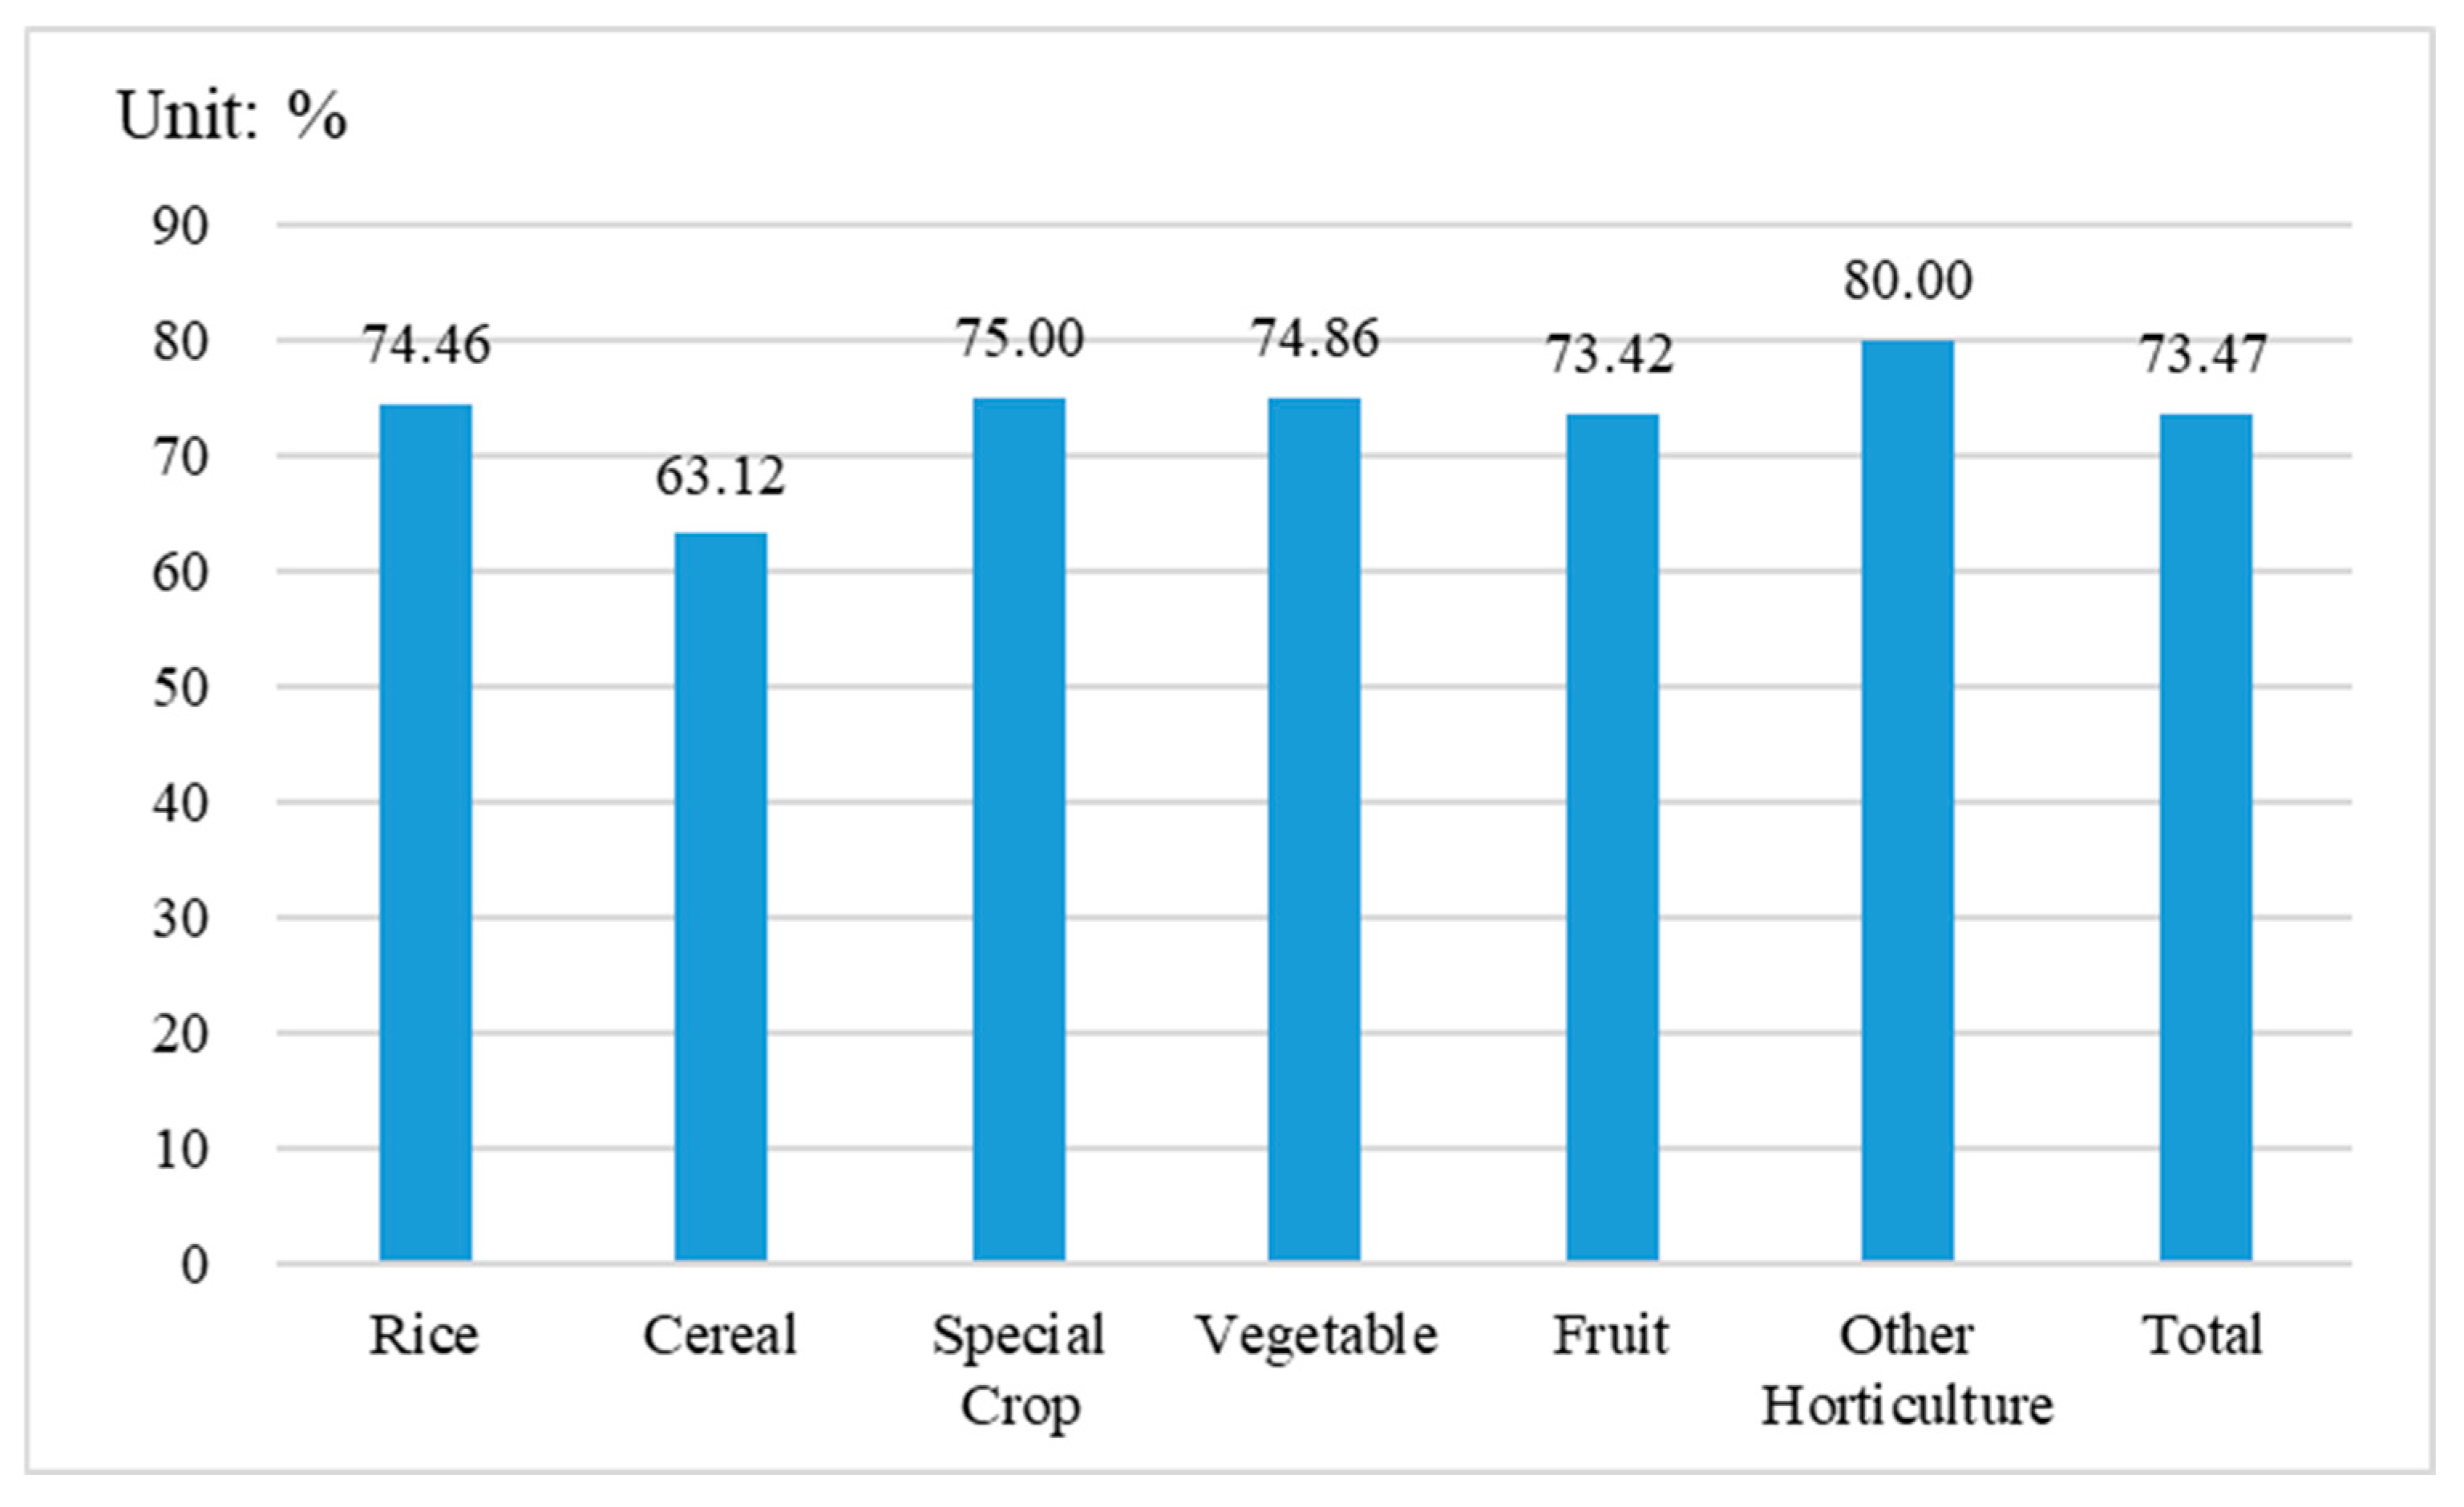
Through a survey, the participants rated the overall accuracy of meteorological forecasts, with scores ranging from 0 to 100, where 0 means completely inaccurate and 100 means completely accurate. Overall, most respondents considered the accuracy of weather forecasts to be at least 70 points or higher. As shown in
Figure 1, the accuracy rates for rice, cereal, special crops, vegetables, fruits, and other horticulture were 76, 65, 75, 75, 75, 80, and 76, respectively.
- (2)
Ratio of Avoidable Losses
As shown in
Table 4, the survey results indicate that the proportions of avoidable losses for the six major crops are as follows: 40.21% for rice, 19.16% for cereals, 48.61% for specialty rice, 1.48% for vegetables, 9.82% for fruits, and 99.59% for other horticultural products.
By multiplying the survey results by the proportion of avoidable losses with the AAL, we can determine the losses that can be prevented through short-term disaster prevention measures (La) and the unavoidable losses (Lu).
- (3)
Prevention Costs (C)
Since the time between the weather forecast issuance and the typhoon’s landfall is relatively short, only short-term disaster prevention measures (such as clearing drainage channels) are included in the statistics.
As shown in
Table 5, total prevention costs are approximately NTD 7 million, with those of rice, vegetables, and fruits being NTD 3 million, NTD 1 million, and NTD 2 million, respectively. It should be noted that the absence of an amount may indicate either the lack of short-term disaster prevention measures or that the cost of implementing such measures is extremely low.
3.4.2. Official Statistics
The probability of a typhoon making landfall in Taiwan (P) generally refers to the likelihood of a typhoon causing damage to the country’s agriculture. Since typhoons (or hurricanes) commonly form in the western North Atlantic, the Indian Ocean, and the western Pacific, including typhoons generated in the western Atlantic and the Indian Ocean in the calculation would result in an underestimation of the typhoon landfall probability for Taiwan, as these typhoons will never directly impact agriculture output.
In light of this, this study compiles data from Taiwan’s Meteorological Bureau database and uses the number of typhoon warnings issued (including land warnings and sea warnings) as the denominator for the probability calculation, with the actual number of typhoons making landfall as the numerator. For example, if 10 typhoons form near Taiwan’s seas in one year and sea warnings are issued, but only 2 of them actually make landfall, the probability of a typhoon making landfall would be 20%.
According to the typhoon database, from 1999 to 2023, Taiwan issued a total of 125 typhoon warnings, with 72 of those typhoons making landfall. Therefore, this study assumes the probability of a typhoon making landfall in Taiwan to be 57.60%.
4. Empirical Results
This study obtains the parameters for Equations (1) to (6) through various methods. First, the objective probability P of a typhoon making landfall in Taiwan is derived over the past 25 years (1999–2023) of typhoon warning records. During this period, there were 125 typhoons that triggered warnings, with 72 actually making landfall, resulting in an estimated probability of occurrence of 57.60%.
Second, based on survey results, farmers’ satisfaction with the overall accuracy of meteorological information services (A) for six major rice categories ranges from approximately 63.12% to 80.00%, depending on the rice type. These data are used to establish the (subjective) accuracy of meteorological forecasts in this study.
Next, disaster prevention costs and the proportion of avoidable losses were collected through surveys, allowing for the calculation of the expected losses under three scenarios: no weather forecast, perfect forecast, and the existing (imperfect) forecast. Taking rice as an example, the annual average losses are estimated at NTD 79.10 million. The survey results indicate that 40.21% of rice-related losses are avoidable (La) and 59.79% are unavoidable (Lu), corresponding to NTD 31.80 million and NTD 47.29 million, respectively. With a typhoon probability (P) of 57.60%, substituting these values into Equation (1) yields an estimated annual average loss of NTD 45.56 million in the absence of meteorological information services.
Applying the same method to Equations (2) and (3), the expected annual losses under the “perfect forecast” scenario and the “existing (imperfect) forecast” scenario are calculated to be NTD 29.16 million and NTD 33.71 million, respectively. Based on EAD
nowarn and EAD
system, the economic benefits that rice farmers can obtain from using existing meteorological services are determined. Similar calculations are applied to other rice. The estimated economic benefits of meteorological information services for rice, cereals, specialty crops, vegetables, fruits, and other horticulture are approximately NTD 11.85 million, NTD 3.94 million, NTD 7.26 million, NTD 2.21 million, NTD 29.37 million, and NTD 22.64 million, respectively (
Table 6). Overall, the direct economic value generated from farmers’ use of meteorological information services for disaster preparedness decisions is estimated to be approximately NTD 77.28 million per year.
5. Discussion
On the purpose of the paper, it is valuable to discuss how to enhance the value generated from the application of meteorological information services by farmers. According to cost-loss theory, the present economic value of meteorological information services is derived from the variable such as disaster occurrence probability (P), prevention costs (C), unavoidable loss (Lᵤ), and probability of a correct forecast (A). However, it is intuitive that the disaster occurrence probability (P) cannot be directly controlled by human actions. Additionally, prevention costs (C) are relatively inflexible due to the short leading time, typically not exceeding two days between the issuance of a typhoon warning and landfall, limiting the availability of precautionary measures. Therefore, the focus of the following discussion will be on unavoidable loss (Lᵤ) and probability of a correct forecast (A).
For instance, if innovative meteorological services were able to extend the leading time for preparedness, this would create more opportunities for disaster prevention. Specifically, a longer leading time would allow farmers to make more informed decisions, such as whether to proceed with cultivation, thereby reducing disaster losses. In this scenario, unavoidable losses would decrease, while avoidable losses could increase.
We assume that other conditions remain unchanged and assess the impact on present economic value when the proportion of avoidable losses increases by 10%, 20%, 30%, 40%, and 50% because of innovative meteorological services application. The simulation results indicate that when the proportion of avoidable disaster losses increases by 10%, the present economic value of meteorological applications rises from 77.28 to 83.19, reflecting an 8% increase (
Table 7).
This increase pertains to all agricultural products, demonstrating the potential value of meteorological services in reducing overall agricultural losses. This pattern continues with progressively larger increases in economic value as the proportion of avoidable losses grows.
From a practical perspective, unless all the outputs are grown indoors like horticultural crops, the increase in the proportion of avoidable losses mentioned earlier is indeed limited.
Therefore, another potential development direction for future meteorological information services is to improve the probability of a correct forecast (subjective accuracy of weather forecasts). According to interview data, it is widely believed by Taiwanese farmers that the current weather information services have a forecast accuracy rate of 73.18% (national average).
Some farmers, however, believe there is potential for improvement due to the differences between the locations of weather observation stations and their own farming areas or residences. To address this, if the government promotes the establishment of observation stations in rural areas to enhance the objective accuracy of weather forecasts, it could boost farmers’ confidence in utilizing weather services. Therefore, assuming other conditions remain unchanged, we examine the impact on the present economic value of meteorological information services when the accuracy of weather forecasts improves (through government efforts to encourage farmers to recognize and use these services), leading to a 10%, 20%, 30%, 40%, and 50% improvement in the probability of a correct forecast.
The simulation results are shown in
Table 8. Specifically, the present economic value rises from 77.28 to 103.76, representing a 10% increase at 10% improvement in forecast accuracy and up to a 34% increase at 40% and 50% improvements.
However, it is important to note that the potential for further improvement is limited, as some farmers’ subjective accuracy of weather forecasts may already be at 100%. In such cases, no further improvements can be made, which explains why the economic value shows only a marginal increase between 40% and 50% improvement in forecast accuracy.
In conclusion, the findings of this study align with the existing literature, reinforcing the notion that increasing the proportion of avoidable losses and improving the accuracy of weather forecasts can substantially enhance the economic value of meteorological services. Specifically, this study examines how the application of meteorological information services can increase economic value for farmers, with particular focus on reducing avoidable losses and improving forecast accuracy. Previous research underscores the significance of early warning systems (EWSs) and their capacity to provide sufficient lead time for disaster preparedness [
18]. By comparing these systems with the results of the current study, it becomes evident that increasing the proportion of avoidable losses through better preparedness could significantly reduce overall disaster-related damage. This finding aligns with studies that suggest early warnings enhance preparedness and mitigate the impacts of disasters [
3,
19].
Moreover, the literature highlights the critical importance of improving forecast accuracy. Some of the studies emphasize the crucial role of accurate weather forecasts in augmenting the value of meteorological services [
19,
20]. These insights resonate with the results of the present study, which indicate that enhancing the accuracy of weather forecasts can significantly improve the economic value derived from meteorological information services, further supporting the notion that precise forecasting is an essential tool for disaster risk management.
6. Conclusions and Suggestions
This study aims to evaluate the economic value of meteorological information services for agricultural disaster prevention and to provide recommendations for enhancing the effectiveness of such services. Specifically, this study assesses the potential impact of innovative meteorological services on improving the proportion of avoidable losses and the accuracy of weather forecasts.
The research findings indicate that the current economic value of meteorological services for typhoon preparation is significant, with an estimated annual value of NTD 77.28 million. This study also highlights the potential for improving these services through two key factors: increasing the proportion of avoidable losses and enhancing the accuracy of weather forecasts.
Based on the simulation results, increasing the proportion of avoidable losses by 10% leads to an 8% increase in the present economic value of meteorological services, as shown in
Table 7. Further increases in the proportion of avoidable losses yield even greater economic benefits, with a 50% increase in avoidable losses corresponding to a 38% rise in the economic value. This demonstrates the significant potential of meteorological services in reducing agricultural losses, particularly when farmers are provided with more accurate and timely information. Note that from a practical perspective, unless agricultural output is completely protected from weather events (such as indoor horticultural crops), the potential for reducing avoidable losses remains limited.
Additionally, the current average forecast accuracy reported by farmers is approximately 73.18%, which indicates room for improvement. By promoting the establishment of additional weather observation stations, especially in rural areas, the government can enhance the objective accuracy of forecasts, thereby increasing farmers’ trust in meteorological services. This would not only improve subjective confidence but also boost the adoption of weather services, further raising the proportion of avoidable losses. In fact, the economic value could rise by up to 34% with a 40% improvement in forecast accuracy, as shown in
Table 8. As such, these efforts could help optimize the use of meteorological information services, maximizing their impact in reducing agricultural losses and improving disaster preparedness, particularly among Taiwan’s rural farming communities.


