1. Introduction
Climate change has intensified the frequency and impact of typhoons globally. This has significantly increased the complexity of multi-hazard disasters, including strong winds, extreme rainfall, storm surges, and air quality deterioration [
1,
2]. The Korean Peninsula, a region highly susceptible to tropical cyclones, has experienced significant socio-economic disruptions due to these escalating impacts. Warming trends in the western Pacific Ocean—with Sea Surface Temperatures (SST) rising faster than the global average—have further heightened the probability of stronger and more destructive typhoons [
3,
4].
Despite recent advancements, traditional forecasting systems predominantly emphasize meteorological factors, often overlooking critical socio-economic vulnerabilities such as population density, aging infrastructure, and urbanization levels [
5].
This research builds upon prior studies and seeks to refine impact-based forecasting approaches, providing a scalable and adaptable model for mitigating the escalating effects of climate change-driven typhoons.
2. Typhoon Development and Configuration
2.1. Overview of the Typhoon-Ready System
The Typhoon-Ready System (TRS) was designed to overcome the limitations of conventional forecasting systems by integrating hazard and vulnerability factors into a unified framework. The TRS incorporates high-resolution meteorological models alongside socio-economic indicators, enabling comprehensive risk assessments tailored for the Korean Peninsula [
6,
7,
8].
2.2. Componets of TRS
2.2.1. Hazard Factors
The TRS framework incorporates multiple hazard factors through advanced numerical modeling techniques to provide comprehensive risk assessments. For a strong wind risk evaluation, the TRS employs 3-s gust data simulated using the Weather Research and Forecasting (WRF) model, enabling the precise capture of extreme wind conditions during typhoon events. The WRF model used in this study underwent sensitivity analysis for the grid and domain, data settings [
9,
10,
11]. We confirmed that the selected domain and grid resolution have a minimal impact on the results, supporting the reliability of the TRS analysis outcomes. The assessment of heavy rainfall risks relies on Probable Maximum Precipitation (PMP) calculations derived from the WRF model, which provides critical data for flood risk estimation. Storm surge analysis is conducted using the Storm Surge Hazard Potential Index (SSHPI), incorporating both tidal levels and atmospheric pressure changes to identify vulnerable coastal areas. Additionally, the system evaluates air pollution risks through the Community Multi-scale Air Quality (CMAQ) model, specifically focusing on PM10 concentration variations that occur during typhoon events. This integration of multiple hazard assessment tools enables the TRS to provide a more nuanced and comprehensive understanding of typhoon-related risks across different dimensions (
Table 1).
2.2.2. Vulnerability Factors
The performance of the TRS was evaluated through detailed analyses of four major typhoon events that significantly impacted the Korean Peninsula: Lingling (2019), Rusa (2002), Maemi (2003), and Mitak (2019). These cases were selected based on their diverse characteristics and documented impacts, providing a comprehensive validation framework for the TRS system. The vulnerability factors considered in the TRS are crucial for comprehensive risk assessments. These factors include the following:
Population density: utilizing the latest census data to identify areas with high human exposure;
Proportion of old buildings: calculating the regional percentage of structures over 30 years old to assess structural vulnerability;
Urbanization level: based on impervious surface ratio and land use patterns to evaluate flood risk and urban heat island effects;
River density: measuring the river length per unit area to assess flood vulnerability.
These factors are integrated into each risk index calculation with appropriate weightings. For example, the Strong Wind Index (SWI) combines 3-s gust data with the distribution of old buildings, while the Heavy Rainfall Index (HRI) incorporates Probable Maximum Precipitation (PMP) [
12], river density, and the impervious surface area. By integrating these vulnerability factors with hazard data, the TRS provides a more nuanced and accurate risk assessment than traditional forecasting systems. This approach enables the identification of high-risk zones that may not be apparent when considering meteorological factors alone, thus supporting more effective disaster preparedness and mitigation strategies. The incorporation of these vulnerability factors allows the TRS to capture the complex interactions between natural hazards and socio-economic conditions, providing a more holistic view of typhoon-related risks across different regions of the Korean Peninsula.
2.3. Case Study Intergration
The performance of the TRS was validated based on four major typhoon events—Lingling (2019), Rusa (2002), Maemi (2003), and Mitak (2019)—each showcasing unique hazard–vulnerability interactions. These case studies emphasize TRS’s ability to provide actionable, region-specific insights for disaster preparedness and mitigation efforts.
3. Selection Criteria and Overview of Typhoon Case Studies
The TRS framework was validated using the methodologies detailed in Na and Jung (2024) through case studies of four major typhoons: Lingling (2019), Rusa (2002), Maemi (2003), and Mitak (2019). These analyses confirm TRS’s applicability for disaster preparedness and responses in the Korean Peninsula. These studies demonstrate the system’s capability of identifying high-risk regions by integrating meteorological hazards with socio-economic vulnerabilities. The findings underscore TRS’s practical utility for proactive disaster planning and mitigation efforts, particularly in areas where traditional forecasting methods may underestimate potential impacts due to their focus on meteorological factors alone.
3.1. Case Study Selection
To validate the performance of the TRS, four significant typhoon events affecting the Korean Peninsula were analyzed (
Figure 1):
Typhoon Lingling (2019): characterized by severe wind impacts;
Typhoon Rusa (2002): notable for extreme rainfall events;
Typhoon Maemi (2003): demonstrated significant storm surge effects;
Typhoon Mitak (2019): unique for its air quality impacts.
These cases were chosen for their diverse hazard characteristics, providing a robust framework to evaluate the system’s adaptability and effectiveness.
The typhoons analyzed in this study are classified according to the Saffir–Simpson Hurricane Wind Scale as follows:
Typhoon Lingling (2019): Category 3 with maximum wind speed of 49.3 m/s;
Typhoon Rusa (2002): Category 2 with maximum wind speed of 41 m/s Typhoon;
Typhoon Maemi (2003): Category 4 with maximum wind speed of 54 m/s;
Typhoon Mitag (2019): Category 1 with maximum wind speed of 39 m/s.
3.1.1. Overviews of Typhoon Lingling: Strong Winds
Typhoon Lingling was the 13th typhoon of 2019, known for its severe wind impacts across South Korea. With a central pressure of 965 hPa and maximum wind speeds of 39 m/s, it passed west of Mokpo and made landfall near Haeju, North Korea. Lingling caused extensive wind damage, particularly in metropolitan areas, like Seoul and Incheon, where older buildings and infrastructure were vulnerable to high wind speeds. Notably, maximum wind speeds of 49.3 m/s were recorded in Bukgeoryeolbi-do, demonstrating the destructive potential of Lingling’s strong winds.
3.1.2. Overviews of Typhoon Rusa: Heavy Rainfall
Typhoon Rusa, classified as one of the most destructive typhoons to strike the Korean Peninsula, brought unprecedented rainfall. On 31 August 2002, Gangneung recorded 870.5 mm of rainfall in a single day—62% of its annual average—setting a record in South Korea’s meteorological history. The heavy rainfall led to large-scale river flooding and urban inundation, particularly in the Yeongdong region and areas around Jirisan Mountain. Rusa’s impacts highlighted the critical importance of incorporating regional hydrological vulnerabilities into risk assessments.
3.1.3. Overviews of Typhoon Maemi: Storm Surge
Typhoon Maemi, the 14th typhoon of 2003, demonstrated the devastating effects of storm surges exacerbated by coastal vulnerabilities. With a central pressure of 954 hPa and maximum wind speeds of 48 m/s, Maemi struck the southern coast near Sacheon City and generated record-breaking storm surges. In Masan Port, the sea level rose by over 60 cm due to a combination of a high tide and strong winds, resulting in significant destruction to port facilities and the surrounding infrastructure. This event underscored the need for comprehensive coastal risk assessments.
3.1.4. Overviews of Typhoon Mitak: Air Quality
Typhoon Mitak, the 18th typhoon of 2019, was unique in its impact on air quality. As it moved across South Korea, it disrupted atmospheric circulation patterns, leading to a sharp increase in PM10 concentrations in industrial and urban areas, like Incheon and Ulsan. The high pollution levels persisted even after the typhoon’s passage, emphasizing the secondary environmental risks associated with typhoons and the importance of integrating air quality assessments into disaster-management frameworks.
3.2. Case Study
This study analyzed the performance of the Typhoon-Ready System (TRS) by comparing its risk indices with actual damage data from four significant typhoon cases: Lingling, Rusa, Maemi, and Mitak. The results demonstrate that the TRS provides a more comprehensive and accurate assessment of regional disaster risks compared to traditional hazard-focused forecasting systems.
3.2.1. Results of Typhoon Lingling: Strong Winds
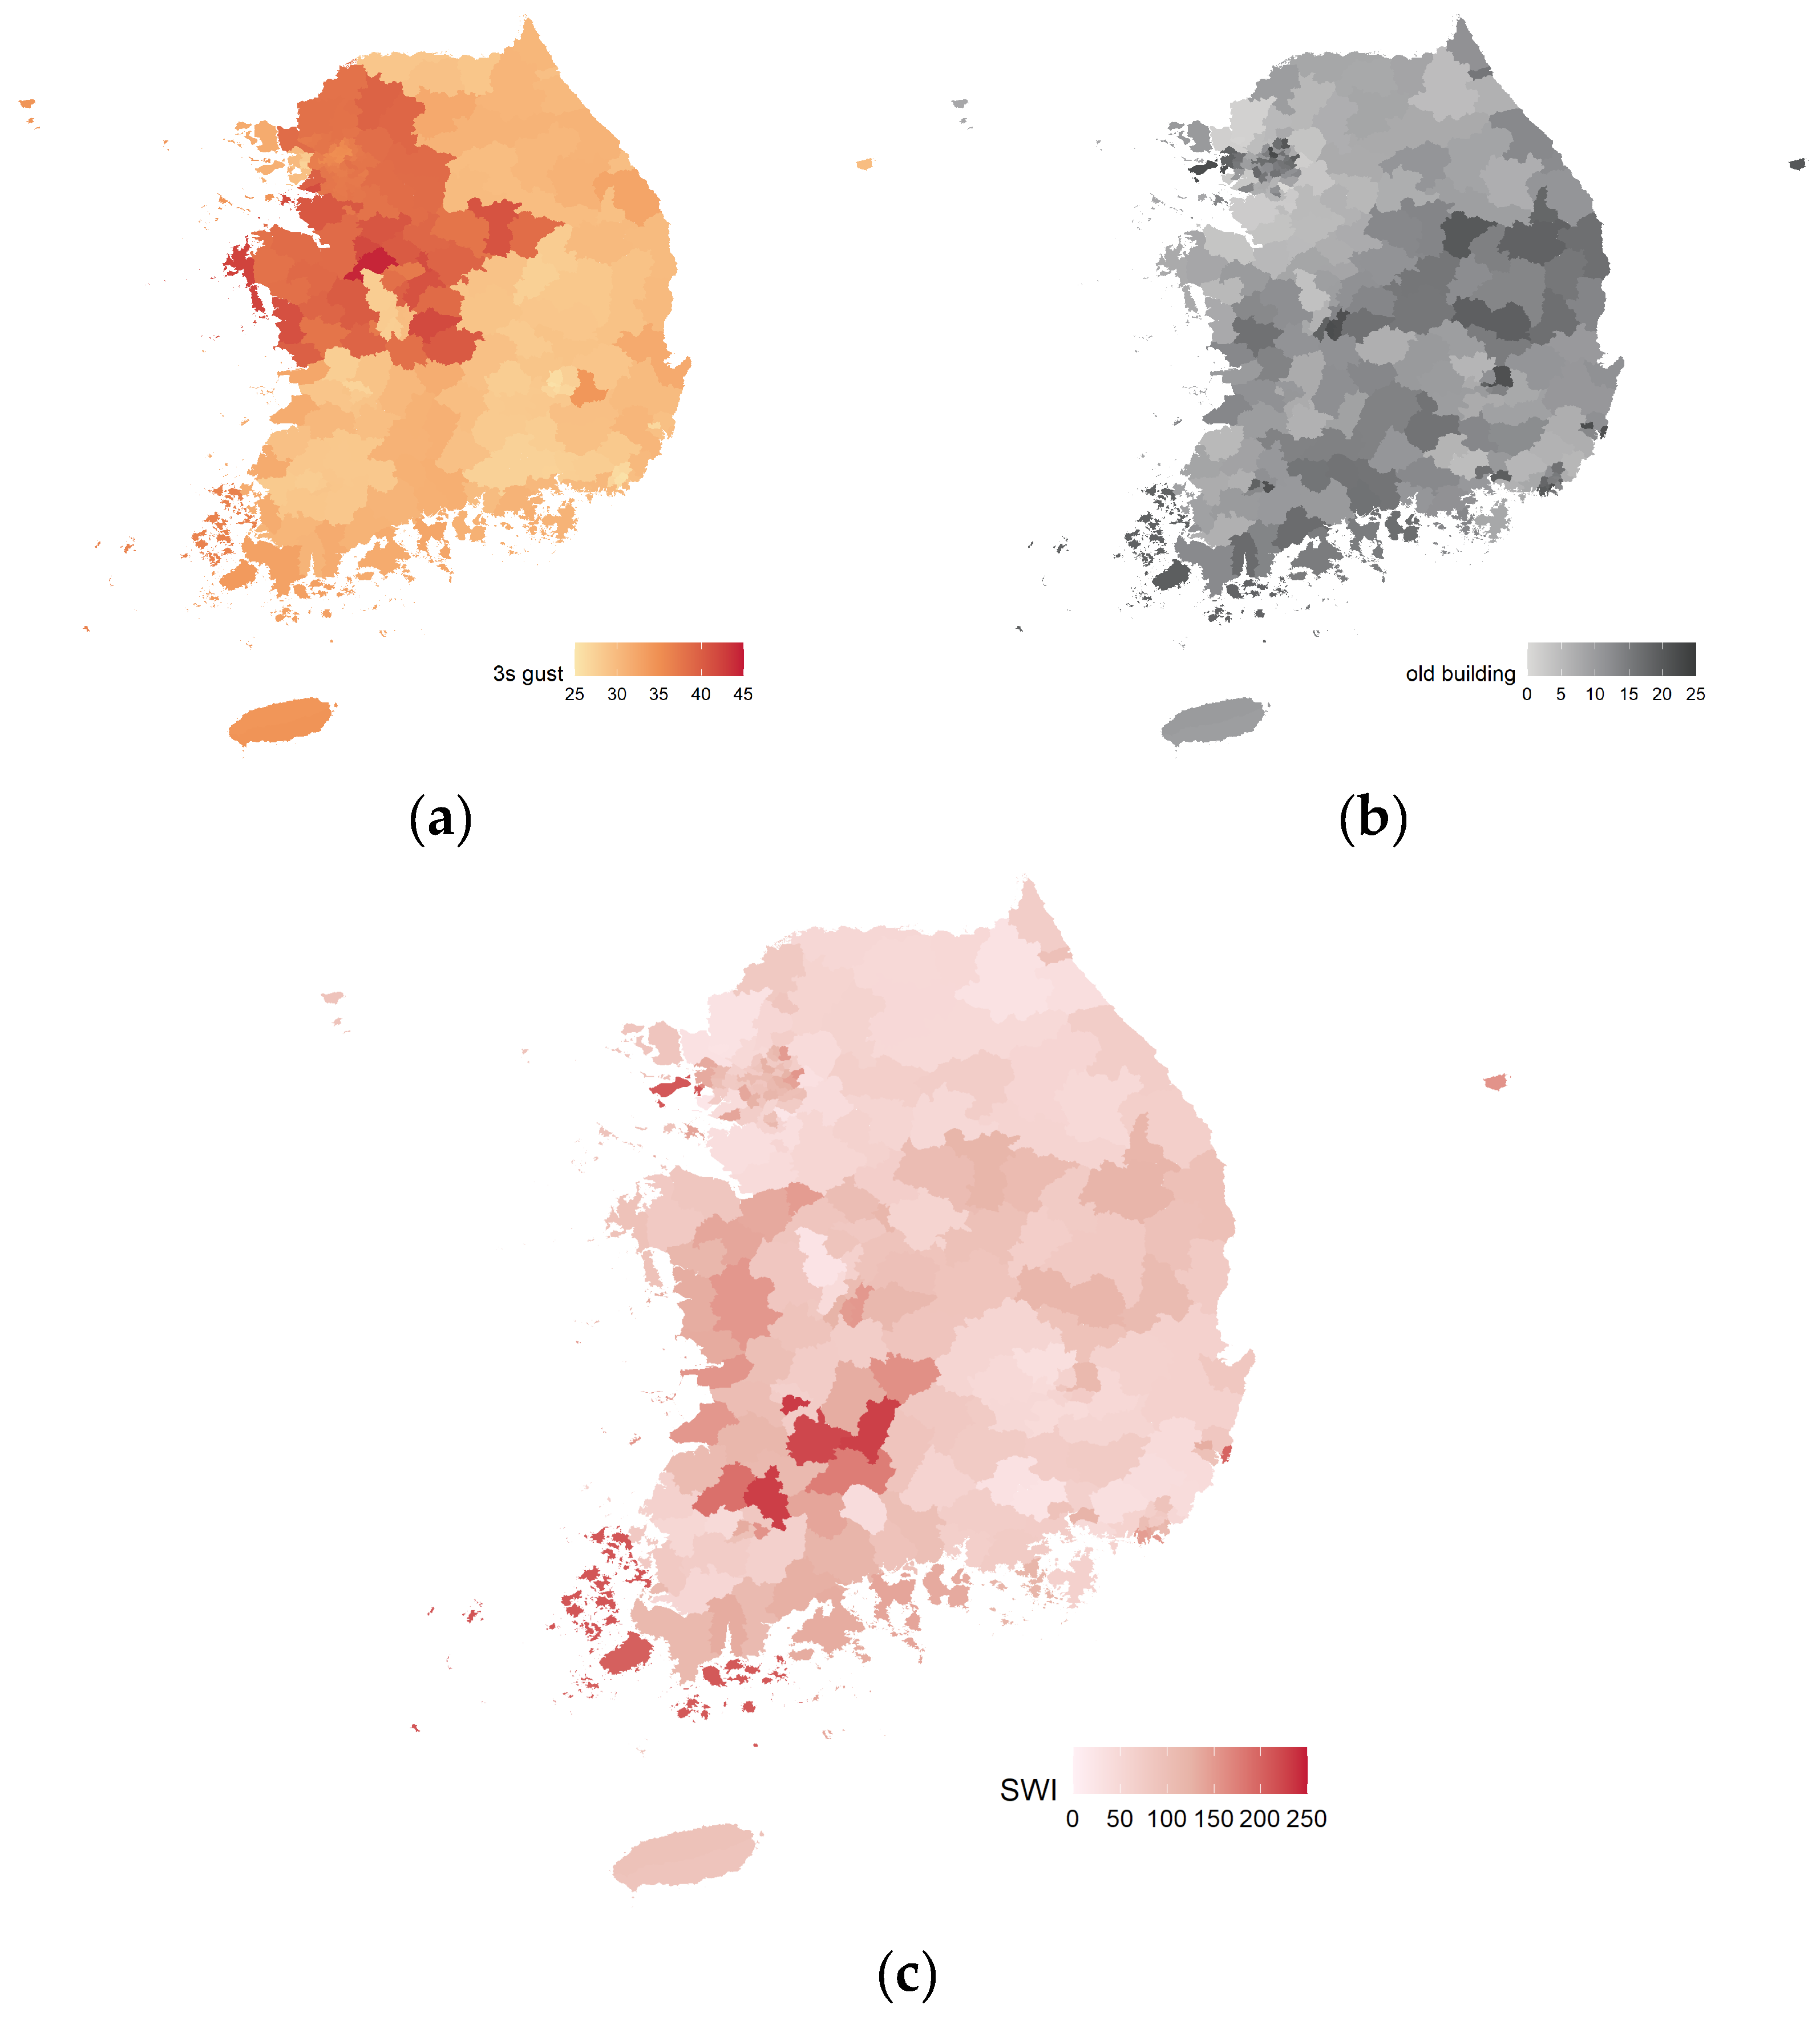
The Strong Wind Index (SWI) of the TRS is calculated by combining the 3-s gust with the distribution of old buildings (
Figure 2). High SWI values were observed in Seoul and Incheon areas, which corresponded well with actual damage cases. In contrast to existing forecasts, SWI delivered more accurate risk predictions by accounting for the structural vulnerability of regions. For example, while traditional hazard-based forecasts predicted high wind risks in western coastal and metropolitan areas along Lingling’s path, they lacked a consideration of regional vulnerabilities and could not specifically assess the potential for structural damage. TRS’s SWI results showed high risk indices in Seoul and Incheon where old buildings are concentrated, aligning with actual cases of building damage and casualties in these areas during Typhoon Lingling. The SWI also indicated a high risk in coastal areas, like Pyeongtaek and Gunsan, as shown in
Figure 2c. which have concentrations of old buildings, correlating with reported damage to vinyl greenhouses and crops. These results suggest that TRS’s SWI, by combining hazard and vulnerability factors, can enable more reliable, region-specific disaster-prevention strategies, serving as a practical tool to complement existing forecast systems in the era of climate change.
3.2.2. Results of Typhoon Rusa: Heavy Rainfall
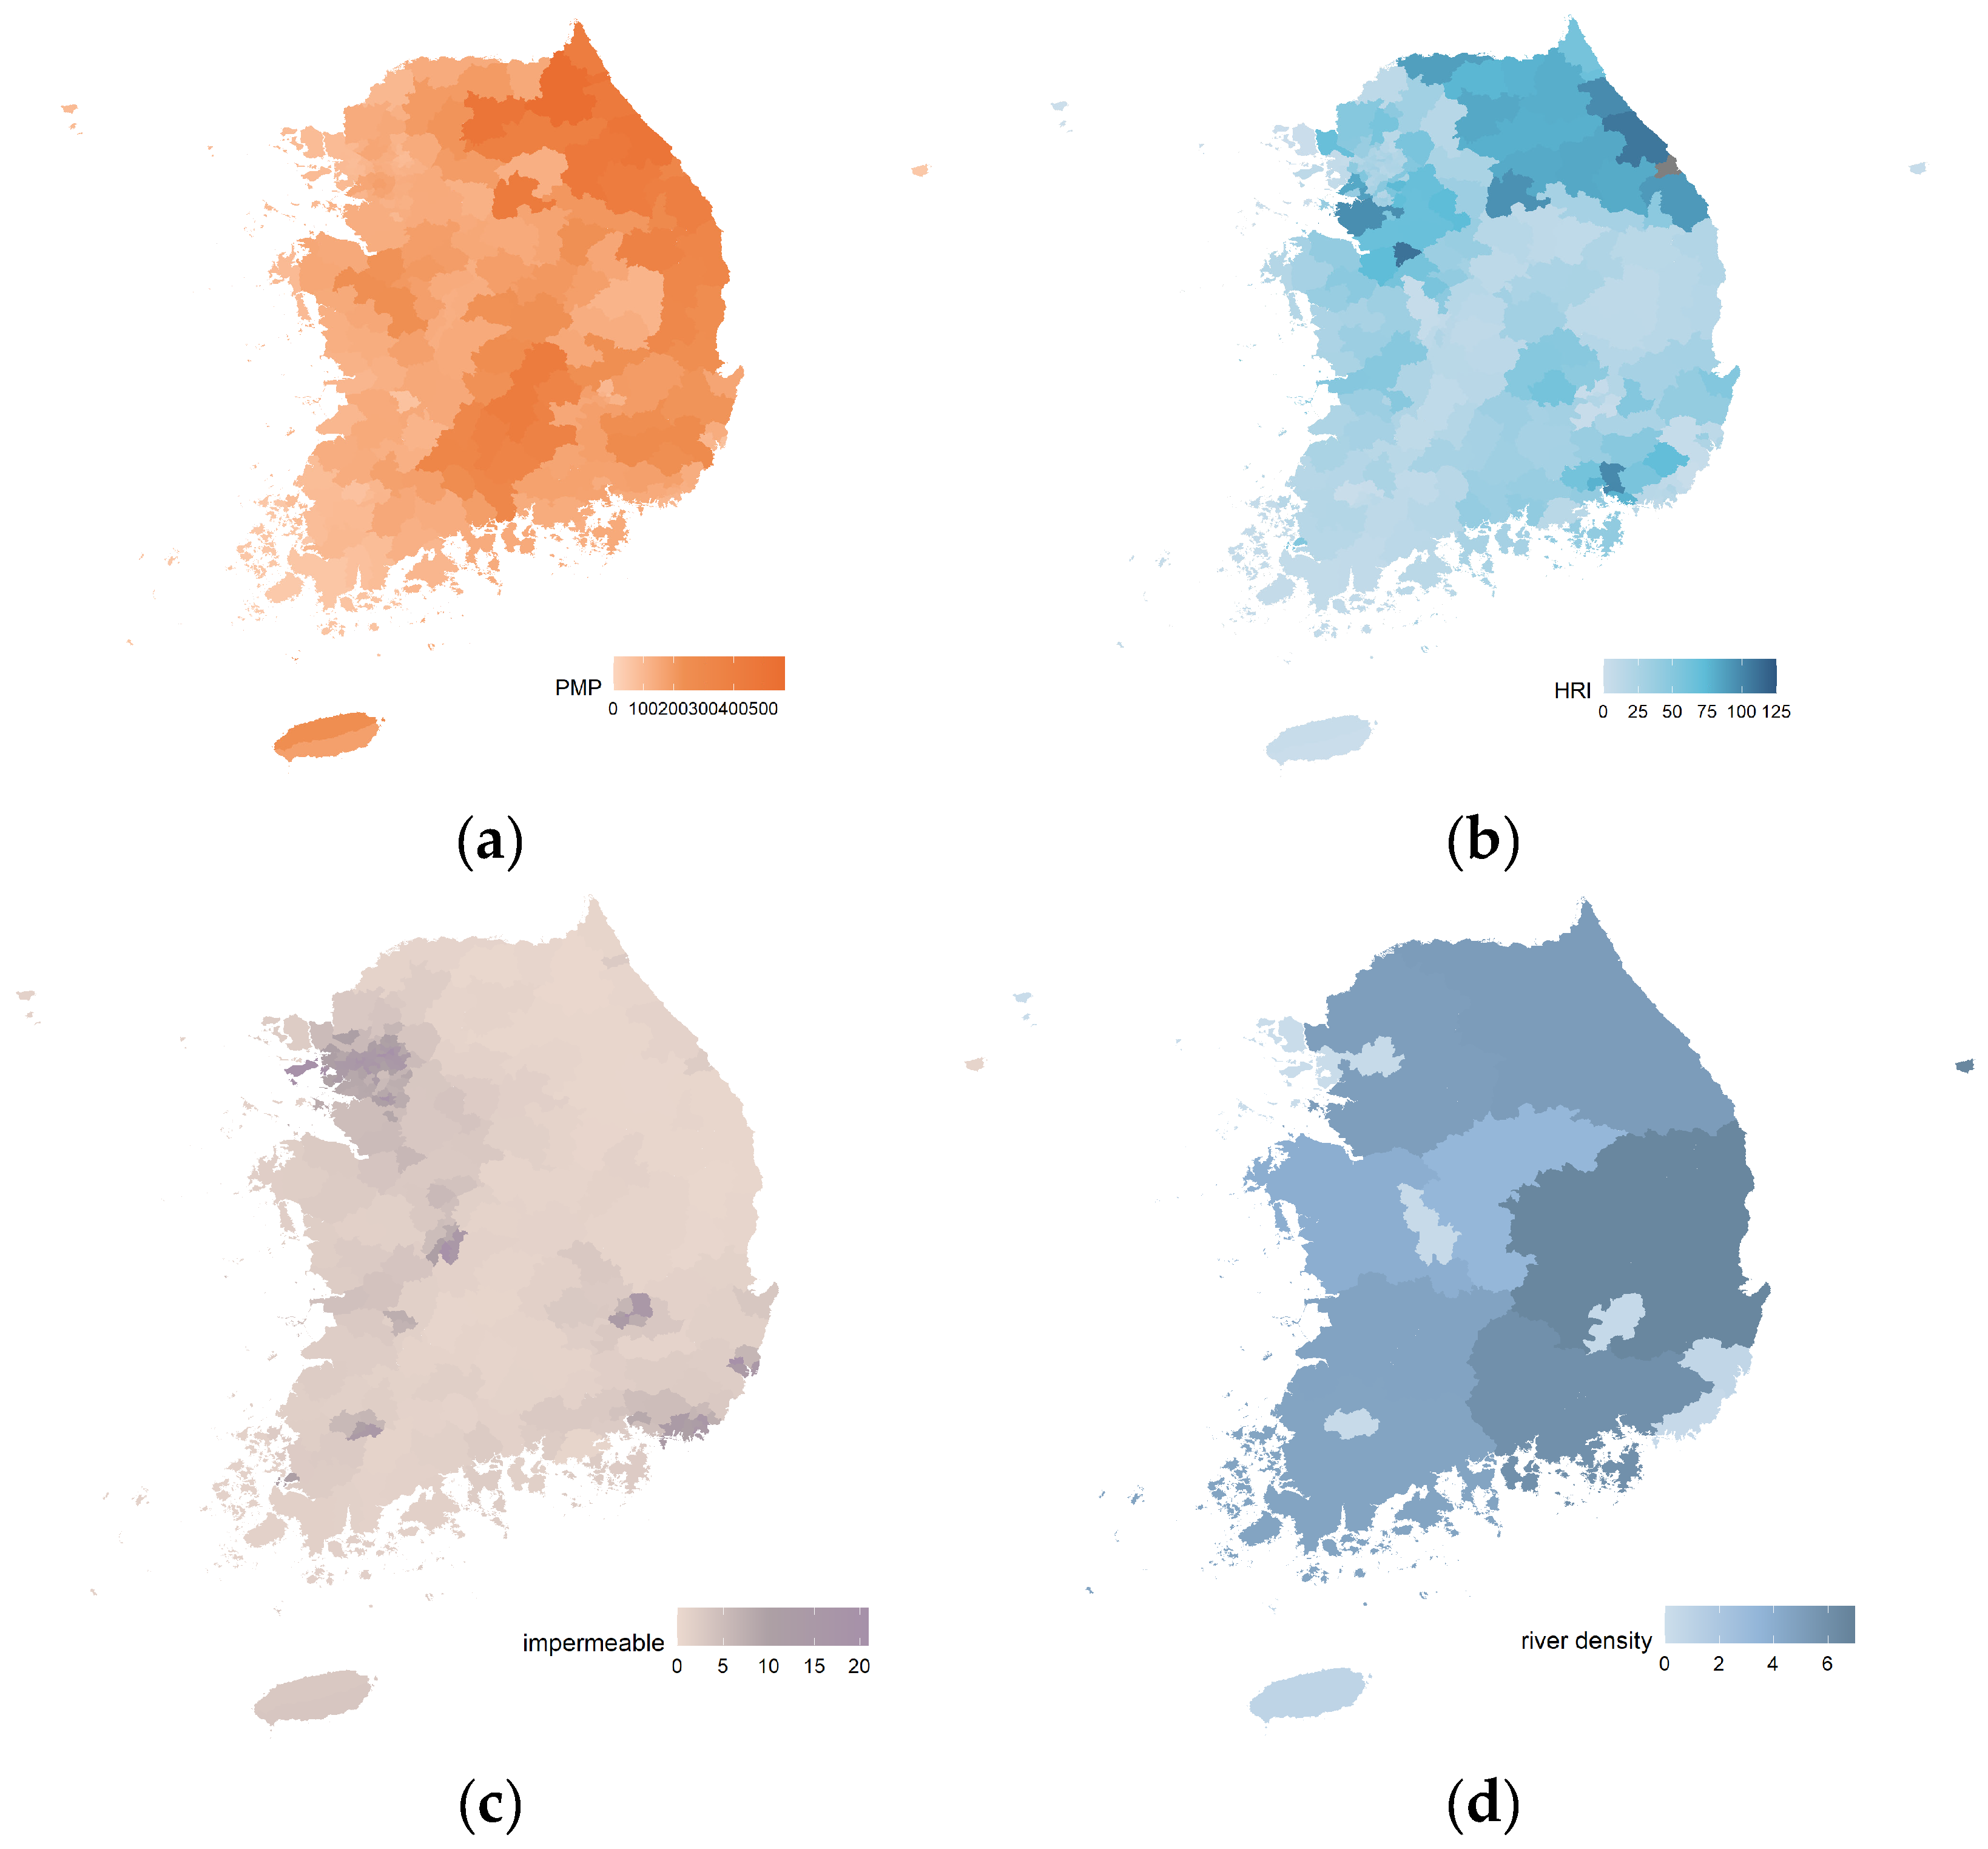
The Heavy Rainfall Index (HRI) is calculated considering the Probable Maximum Precipitation (PMP), river density, and impervious surface area (
Figure 3). High HRI values were observed in the Gangneung and Samcheok areas of Gangwon-do, which aligned with the actual large-scale river flooding and urban inundation damages. While the record-breaking rainfall in Gangwon-do could be predicted through PMP, HRI provided a more accurate assessment of the flood and inundation risk by considering areas with a high river density and increased impervious surface due to urbanization. For instance, Gangneung and Samcheok not only had very high PMP values but also a high river density and increased impervious surface in some urban areas. TRS’s HRI results showed high risk indices in these areas, corresponding well with the actual large-scale river overflow and urban flooding that occurred during Rusa. The HRI also calculated relatively high-risk indices for some areas where rainfall was not particularly high, reflecting vulnerability factors that were overlooked in existing PMP-based forecasts. This demonstrates HRI’s potential to complement existing rainfall-forecast systems and contribute to tailored disaster-prevention strategies, particularly in urban areas and regions with high river density.
3.2.3. Results of Typhoon Maemi: Storm Surge
The Storm Surge Index (SSI) is calculated by combining the Storm Surge Hazard Potential Index (SSHPI), tidal levels, topography, and urbanization rate (
Figure 4). Very high SSI values were observed in Masan Port, which corresponded to the record-breaking storm surge damage. Masan Port recorded a storm surge height of 5.16 m, causing massive destruction to port facilities and the surrounding infrastructure. This historic level of damage highlighted the limitations of existing SSHPI-based forecasts, which focus solely on the physical intensity and fail to account for regional vulnerabilities. The SSI effectively captured the high risk in Masan Port by integrating hazard factors (SSHPIs) with vulnerability factors, such as high tidal levels, the low-lying coastal topography, and the high urbanization rate. This comprehensive approach allowed the SSI to quantitatively predict the potential for damage in areas like Masan Port, where existing SSHPI-based forecasts could not accurately assess the scale of potential impact. The Masan Port case clearly demonstrates SSI’s ability to complement existing physical-intensity-based forecast systems by incorporating vulnerability factors, providing a more nuanced and region-specific risk assessment. This makes SSI a valuable tool for enhancing preparedness and response strategies for storm surge risks, particularly in highly vulnerable coastal urban areas.
3.2.4. Results of Typhoon Mitak: Air Quality
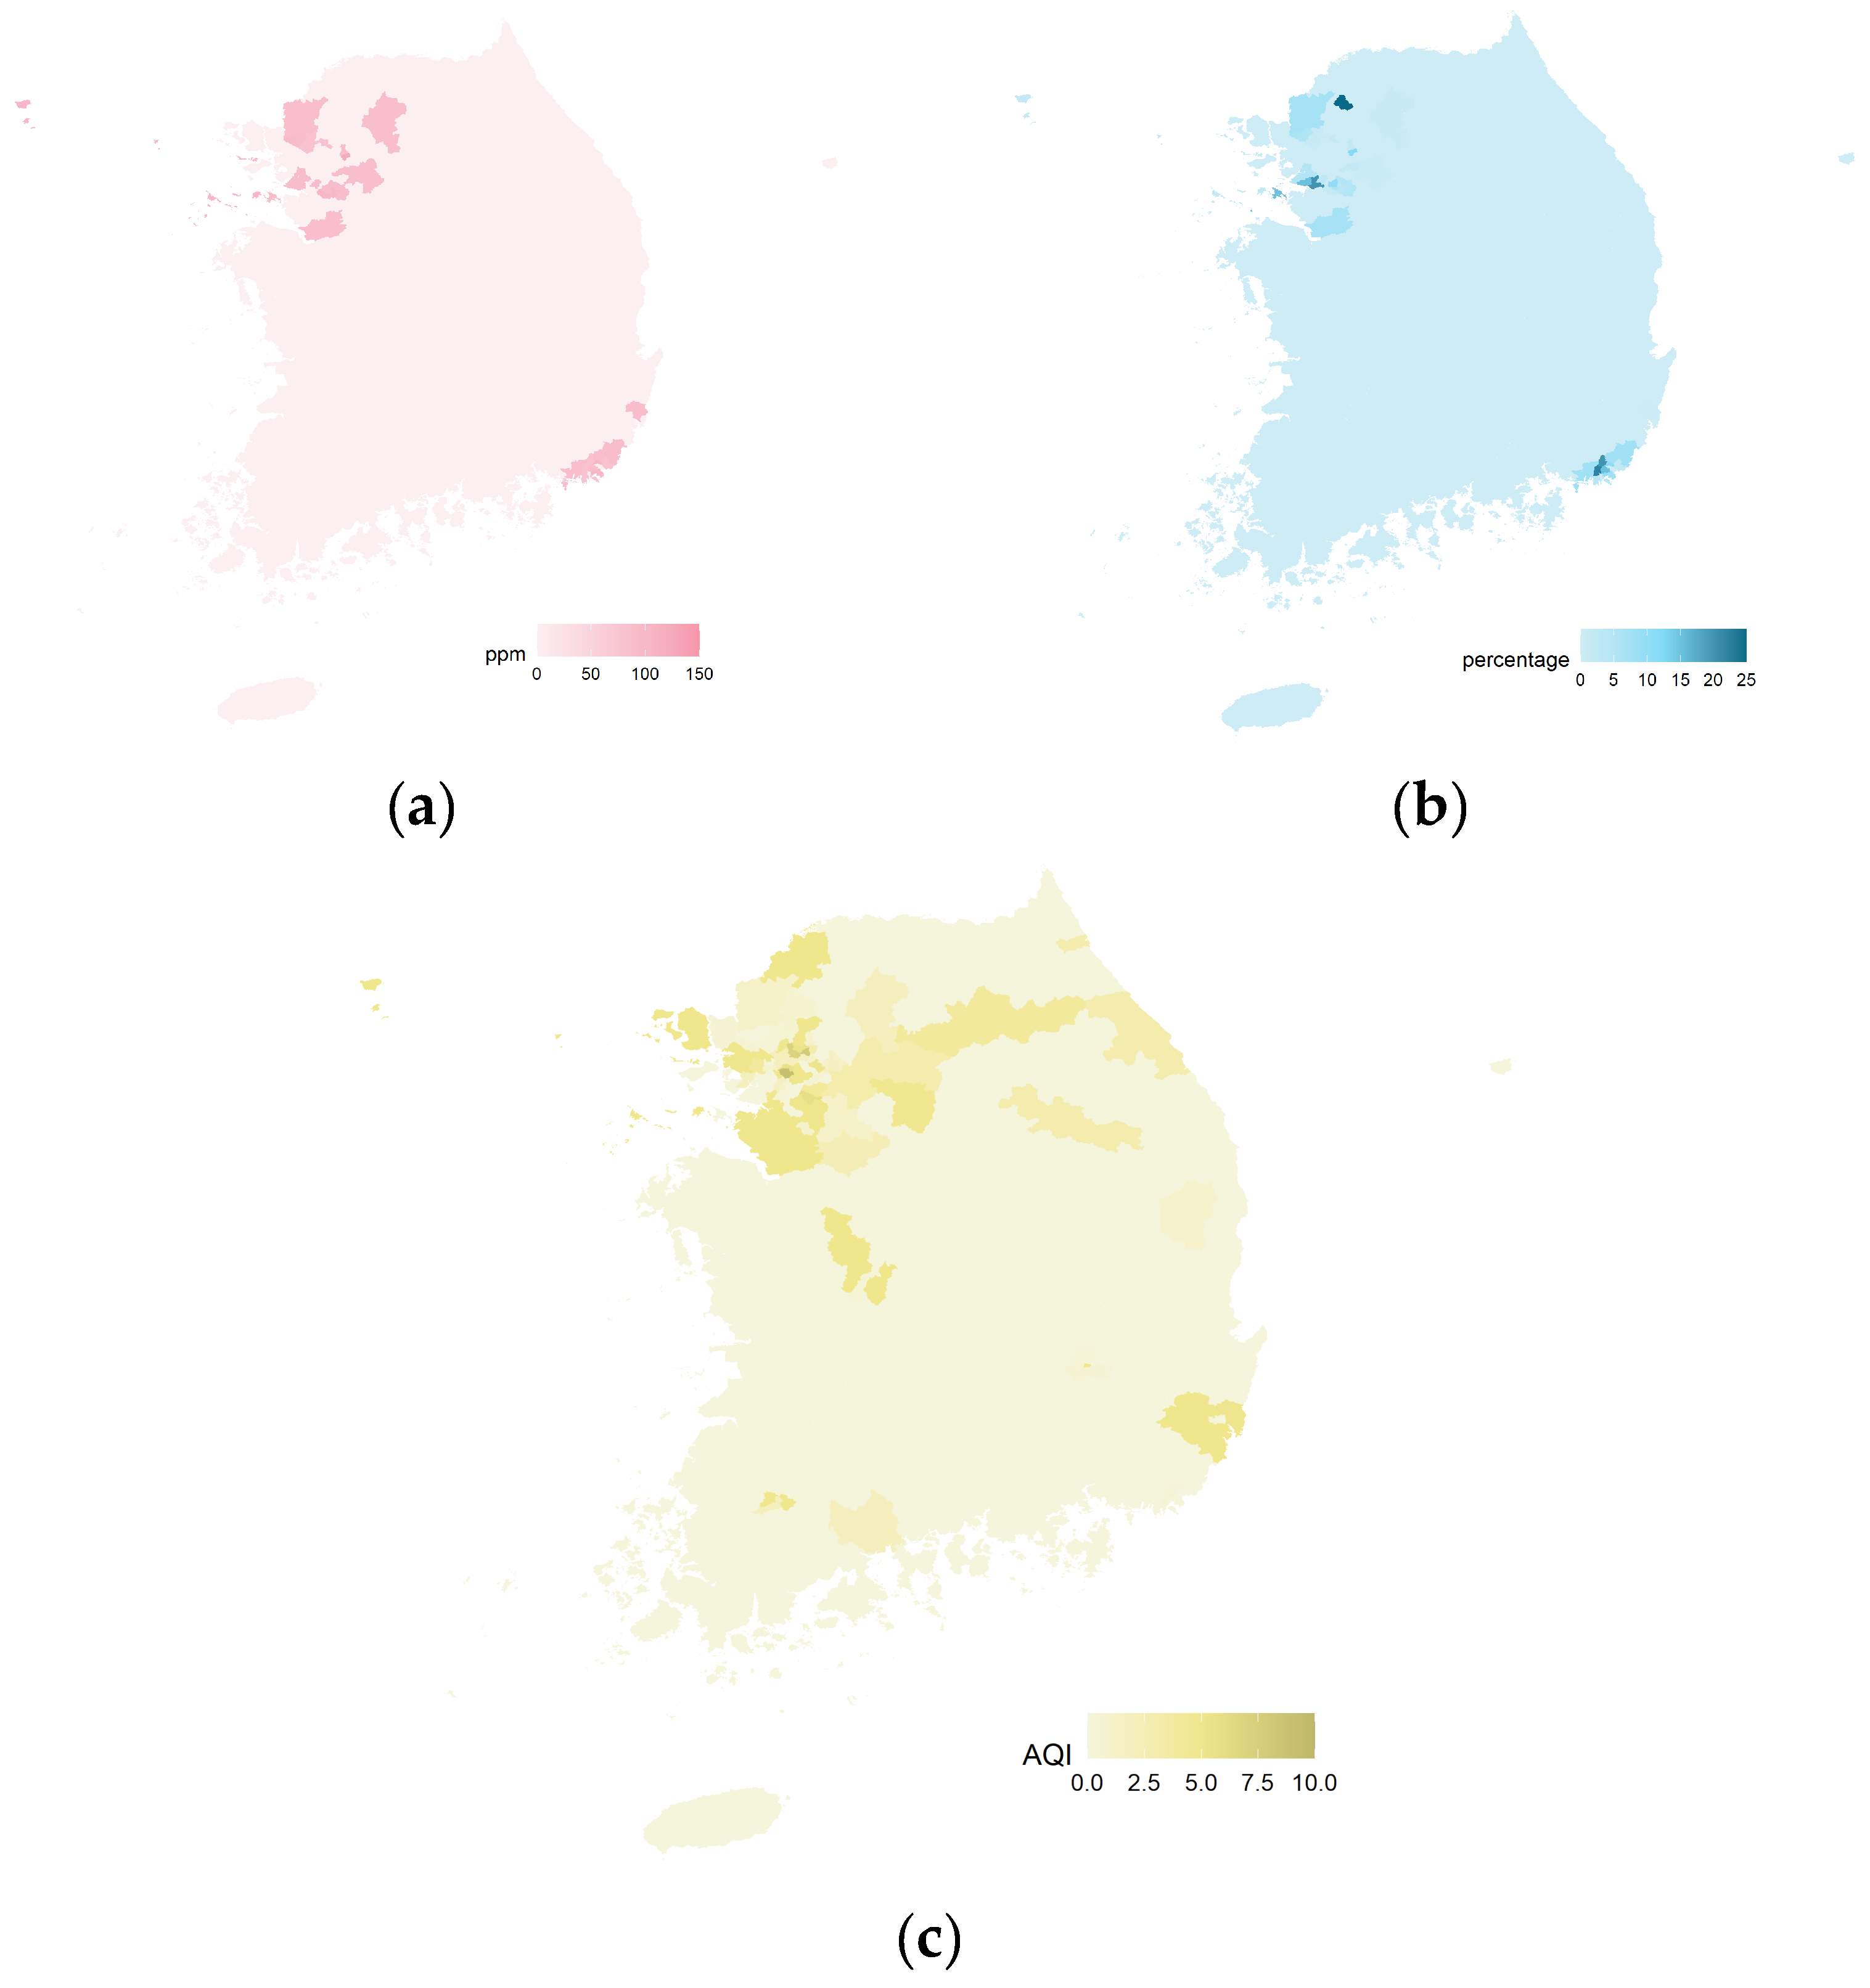
The Air Quality Index (AQI) is calculated considering the PM10 concentration changes, population density, and industrial activity levels (
Figure 5). High AQI values were observed in Seoul, the metropolitan area, Incheon, and Ulsan, which aligned with actual cases of air quality deterioration after the typhoon. Typhoon-induced air pollution is influenced not only by physical changes due to strong winds and rainfall but also by regional vulnerability factors, such as the population density and industrial activity levels. TRS’s AQI focuses on quantitatively assessing the potential for air pollution damage during typhoon events by combining these hazard and vulnerability factors. For example, as shown in
Figure 5c, PM10 concentrations increased rapidly in Seoul and the metropolitan area, which have high population densities, after the typhoon passed. Additionally, in industrial areas, like Incheon and Ulsan, the re-dispersion of pollutants after the typhoon led to air quality deterioration, which corresponded with the high AQI values calculated using the TRS. This case demonstrates that TRS’s AQI can provide a more realistic assessment of regional air pollution risks during typhoon events by considering both hazard factors and regional vulnerabilities, offering valuable information for air quality management and public-health-protection strategies.
4. Summary and Conclusions
This study builds upon and extends the methodologies presented in previous research [
8] The TRS framework integrates high-resolution numerical weather models with socio-economic datasets to calculate risk indices that capture the multi-hazard nature of typhoons. Its modular design allows for the incorporation of various hazard and vulnerability factors, ensuring adaptability to diverse regional contexts.
The system quantifies hazard factors using advanced numerical modeling techniques. Strong wind risks are evaluated using 3-s gust data simulated by the WRF model. Heavy rainfall risks are assessed using Probable PMP calculations derived from the WRF model. Storm surges are analyzed using the SSHPI, incorporating tidal levels and atmospheric pressure changes. Air pollution risks are examined using the CMAQ model, focusing on PM10 concentration variations.
To account for regional vulnerabilities, the TRS integrates critical socio-economic and environmental indicators. Population density is analyzed to evaluate human exposure levels. The proportion of the aging infrastructure and impervious surfaces provides insights into structural vulnerabilities and flood risks. Urbanization levels are considered to capture the amplified risks in highly developed areas prone to severe inundation and compounded impacts.
The TRS framework has been validated through case studies of major typhoons impacting Korea, such as Lingling (2019) and Rusa (2002). These studies demonstrated the system’s ability to identify high-risk regions by integrating meteorological hazards with socio-economic vulnerabilities. The findings highlight the critical importance of the practical utility of TRS for proactive disaster planning and mitigation efforts.
This study confirms that the Typhoon-Ready System (TRS), validated through case studies and leveraging methodologies, serves as an effective disaster-management system for the Korean Peninsula. By integrating physical hazards with socio-economic vulnerabilities, the TRS provides a robust tool for enhancing disaster preparedness and resilience against climate change-induced typhoon impacts. TRS offers a scalable and adaptable model that can be extended to other typhoon-prone regions globally, providing a valuable tool for addressing the escalating impacts of climate-change-driven disasters.
Author Contributions
Conceptualization, H.N. and W.-S.J.; Methodology, H.N. and W.-S.J.; Writing—original draft, H.N.; Writing—review & editing, W.-S.J.; Supervision, W.-S.J. All authors have read and agreed to the published version of the manuscript.
Funding
This work was supported by the National Research Foundation of Korea (NRF) grant funded by the Korea government (MSIT) (No. RS-2023-00212688).
Institutional Review Board Statement
Not applicable.
Informed Consent Statement
Not applicable.
Data Availability Statement
The original contributions presented in this study are included in the article. Further inquiries can be directed to the corresponding author.
Conflicts of Interest
The authors declare no conflict of interest.
References
- Emanuel, K. Response of global tropical cyclone activity to increasing CO2: Results from downscaling CMIP6 models. J. Clim. 2021, 34, 57–70. [Google Scholar] [CrossRef]
- IPCC. Climate Change 2021: The Physical Science Basis; Cambridge University Press: Cambridge, UK, 2021. [Google Scholar]
- Knutson, T.R.; McBride, J.L.; Chan, J.; Emanuel, K.; Holland, G.; Landsea, C.; Held, I.; Kossin, J.P.; Srivastava, A.K.; Sugi, M. Tropical cyclones and climate change. Nat. Geosci. 2010, 3, 157–163. [Google Scholar] [CrossRef]
- Kossin, J.P.; Knapp, K.R.; Olander, T.L.; Velden, C.S. Global increase in major tropical cyclone exceedance probability over the past four decades. Proc. Natl. Acad. Sci. USA 2020, 117, 11975–11980. [Google Scholar] [CrossRef] [PubMed]
- Lee, H.; Park, J. Application of typhoon risk indices for evidence-based disaster management: A comparative study of coastal cities in South Korea. Sustainability 2024, 16, 1032. [Google Scholar]
- Mendelsohn, R.; Emanuel, K.; Chonabayashi, S.; Bakkensen, L. The impact of climate change on global tropical cyclone damage. Nat. Clim. Chang. 2012, 2, 205–209. [Google Scholar] [CrossRef]
- Walsh, K.J.; McInnes, K.L.; McBride, J.L. Tropical cyclones and climate change. Wiley Interdiscip. Rev. Clim. Chang. 2016, 7, 65–89. [Google Scholar] [CrossRef]
- Na, H.; Jung, W. A Study on the Pre-Survey and Plan for the Establishment of the Korean Typhoon Impact-Based Forecast. Atmosphere 2024, 15, 1236. [Google Scholar] [CrossRef]
- Na, H.; Jung, W. A Study on Improving the Prediction Accuracy of a Typhoon Disaster Prevention Model Part I: Sensitivity of the WRF Model to High-Resolution SST Data and Meteorological Data Assimilation. J. Korean Soc. Atmos. Environ. 2019, 35, 303–317. [Google Scholar] [CrossRef]
- Na, H.; Jung, W. A Study on Improving the Prediction Accuracy of a Typhoon Disaster Prevention Model Part II: Sensitivity of the WRF Model to GDAPS, RDAPS, GFS Data. J. Korean Soc. Atmos. Environ. 2020, 36, 522–532. [Google Scholar] [CrossRef]
- Na, H.; Jung, W. A Study on Improving the Prediction Accuracy of a Typhoon Disaster Prevention Model Part III: Sensitivity of the WRF Model to Soil Data. J. Korean Soc. Atmos. Environ. 2021, 37, 248–262. [Google Scholar] [CrossRef]
- Hershfield, D.M. Estimating the probable maximum precipitation. J. Hydraul. Div. 1961, 87, 99–106. [Google Scholar] [CrossRef]
Figure 1.
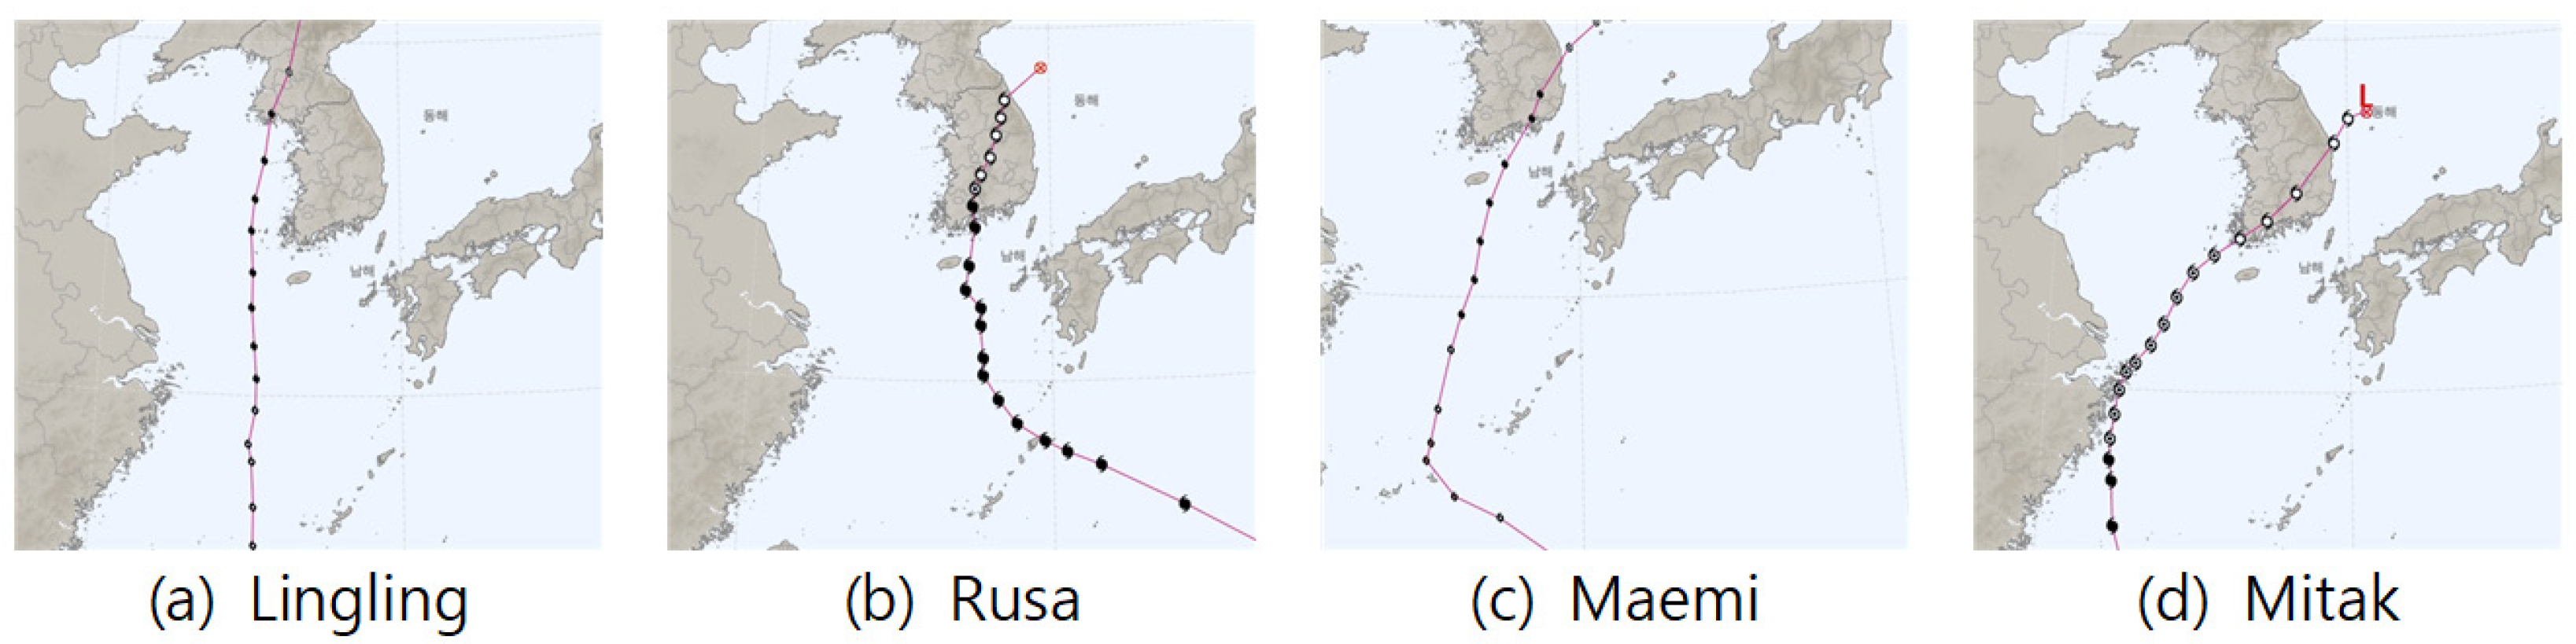
This figure illustrates the tracks of four major typhoons—Lingling (a), Rusa (b), Maemi (c), and Mitak (d) analyzed in this study. Each track highlights the distinct paths and impacts of these events, representing key hazards: strong winds (Lingling), heavy rainfall (Rusa), storm surges (Maemi), and air pollution (Mitak). The visualized paths provide essential context for understanding regional vulnerabilities and validating the Typhoon-Ready System’s (TRS’s) risk assessment capabilities across varied meteorological conditions.
Figure 1.
This figure illustrates the tracks of four major typhoons—Lingling (a), Rusa (b), Maemi (c), and Mitak (d) analyzed in this study. Each track highlights the distinct paths and impacts of these events, representing key hazards: strong winds (Lingling), heavy rainfall (Rusa), storm surges (Maemi), and air pollution (Mitak). The visualized paths provide essential context for understanding regional vulnerabilities and validating the Typhoon-Ready System’s (TRS’s) risk assessment capabilities across varied meteorological conditions.
Figure 2.
This figure depicts the calculation process of the Strong Wind Risk Index (SWI) by integrating hazard and vulnerability factors. (a) Shows the distribution of 3-s gust wind speeds, representing the primary hazard factor. (b) Illustrates the regional distribution of old buildings, which serves as a key vulnerability indicator, highlighting areas with greater structural susceptibility to wind damage. (c) Presents the final SWI map, combining both hazard and vulnerability factors to identify high-risk regions. This visualization emphasizes the importance of integrating multi-dimensional data to generate a more accurate and region-specific risk assessment.
Figure 3.
This figure demonstrates the calculation process for the Heavy Rainfall Risk Index (HRI), integrating hazard and vulnerability factors. (a) Illustrates the distribution of Probable Maximum Precipitation (PMP), representing the primary hazard factor derived from the WRF model. (b) Highlights river density as a key vulnerability factor, reflecting areas prone to river flooding. (c) Shows the distribution of impervious surfaces, which exacerbate urban flooding by reducing water absorption. Finally, (d) presents the HRI map, which combines the hazard and vulnerability factors to identify regions at the highest risk of flooding due to heavy rainfall. This visualization underscores the importance of combining hydrological and urban characteristics for accurate and localized flood risk assessments.
Figure 4.
This figure outlines the process of calculating the Storm Surge Risk Index (SSI) by combining hazard and vulnerability factors specific to coastal areas. (a) Depicts the Storm Surge Hazard Potential Index (SSHPI), representing the primary hazard factor based on the storm surge intensity. (b) Shows the distribution of tidal levels, a critical factor influencing storm surge impacts. Finally, panel (c) integrates all of these factors into the SSI map, identifying high-risk coastal zones. This visualization emphasizes the importance of combining physical and socio-environmental data to improve the storm surge risk assessment and coastal disaster management.
Figure 5.
This figure illustrates the calculation process of the Air Quality Risk Index (AQI), which evaluates the impact of typhoons on the regional air quality by integrating hazard and vulnerability factors. (a) Shows the PM10 concentration distribution, representing the primary hazard factor linked to typhoon-induced air pollution. (b) Highlights the distribution of vulnerable populations, such as densely populated areas or regions with higher proportions of sensitive groups, like the elderly and children, which increases the susceptibility to air quality degradation. (c) Combines these factors into the final AQI map, identifying areas at the highest risk of air quality impacts caused by typhoons. This visualization emphasizes the importance of addressing air pollution risks in disaster management frameworks, especially in industrial and metropolitan regions.
Table 1.
Table representing the domain configuration of the WRF model.
Table 1.
Table representing the domain configuration of the WRF model.
| | Domain 1 | Domain 2 | Domain 3 |
|---|
| Horizontal grid | 85 × 85 | 172 × 172 | 304 × 304 |
| Horizontal resolution | 27 km | 9 km | 3 km |
| Vertical layers | 27 |
![Atmosphere 16 00077 i001]() |
| Disclaimer/Publisher’s Note: The statements, opinions and data contained in all publications are solely those of the individual author(s) and contributor(s) and not of MDPI and/or the editor(s). MDPI and/or the editor(s) disclaim responsibility for any injury to people or property resulting from any ideas, methods, instructions or products referred to in the content. |
© 2025 by the authors. Licensee MDPI, Basel, Switzerland. This article is an open access article distributed under the terms and conditions of the Creative Commons Attribution (CC BY) license (https://creativecommons.org/licenses/by/4.0/).


