Article

A Dynamically Updated Dust Source Function for Dust Emission Scheme: Improving Dust Aerosol Simulation on an East Asian Dust Storm

1
State Key Laboratory of Advanced Environmental Technology, Guangzhou Institute of Geochemistry, Chinese Academy of Sciences, Guangzhou 510640, China
2
University of Chinese Academy of Sciences, Beijing 100049, China
3
CMA Earth System Modeling and Prediction Centre (CEMC), Beijing 100081, China
4
State Key Laboratory of Severe Weather, Chinese Academy of Meteorological Sciences, Beijing 100081, China
5
Jinan Meteorological Bureau, Jinan 250102, China
6
Tai’an Meteorological Bureau, Tai’an 271000, China
7
Key Laboratory for Aerosol-Cloud-Precipitation of China Meteorological Administration, Collaborative Innovation Center on Forecast and Evaluation of Meteorological Disasters, Nanjing University of Information Science and Technology, Nanjing 210044, China
*
Author to whom correspondence should be addressed.
Atmosphere 2025, 16(4), 357; https://doi.org/10.3390/atmos16040357
Submission received: 20 February 2025 / Revised: 15 March 2025 / Accepted: 20 March 2025 / Published: 21 March 2025

Abstract

:
Accurate identification of dust emission sources is crucial for simulating dust aerosols in atmospheric chemical models. Therefore, a dynamically updated dust source function (DSF) was developed within the dust emission scheme of the Weather Research and Forecasting model coupled with chemistry (WRF-Chem) to simulate an East Asian dust storm event from 13 to 16 March 2021. Utilizing satellite-derived input of vegetation cover, snow cover, soil texture, and land use, the DSF was updated to better identify dust source areas over bare soils and sparsely vegetated regions in western China and central-western Mongolia. With the updated DSF, simulated dust emissions increase significantly over western China and Mongolia. The dust aerosol simulations demonstrate substantial improvements in near-surface PM10 concentrations, a better agreement with remotely sensed dust aerosol optical depth (DOD), and a more accurate representation of the vertical distribution of dust extinction coefficients compared to observations. This study highlights the importance of integrating real-time data to accurately characterize dust emission sources, thereby improving atmospheric environment simulations.

1. Introduction

Mineral dust aerosol is one of the most abundant aerosols in the world, playing an essential role in both aerosol mass and aerosol optical depth (AOD) [1]. Dust particles directly alter the Earth’s radiation budget by scattering and absorbing solar radiation, while indirectly modifying cloud albedo, lifespan, and precipitation processes through their effects on cloud condensation nuclei and ice nuclei [2]. They also influence atmospheric chemistry processes by interacting with trace gases and other aerosols [3]. Dust transported over long distances serves as a vital source of mineral nutrients for oceans and land ecosystems [4]. Additionally, high concentrations of dust aerosols have detrimental impacts on human health, increasing the prevalence of respiratory diseases [5].
Arid and semi-arid regions are the primary sources of dust aerosols [6]. Areas characterized by dry soils, sparse vegetation, erodible sediments, and strong winds exhibit a high potential for dust emissions [7]. These regions are typically located in North Africa, East Asia, the Middle East, Central Asia, North America, South America, and Australia [8]. It is estimated that up to 5000 Tg of dust is emitted from the Earth’s surface into the atmosphere each year [9,10]. The East Asian region, with its vast deserts and expansive drylands, is particularly prone to frequent dust storms, contributing 12% of the Earth’s total dust emissions [11,12].
To understand the variation in dust aerosols, tools such as numerical modeling, remote sensing, and ground observations have been utilized to study Asian dust storm events [13,14,15]. Recognized as a key contributor to the energy balance and hydrological cycle, Asian dust plays a vital role in the global biogeochemical cycle by providing a potential source of iron to marine ecosystems in the North Pacific [16]. Numerical studies have shown that 20% of Asian dust is transported over regional scales and can be carried eastward by prevailing midlatitude westerlies, traveling across the Pacific Ocean to reach North America or beyond [17,18]. Severe dust storms originating from the Taklamakan and Gobi Deserts greatly degrade air quality in downstream regions and impact the climate across northern and eastern China [19]. Therefore, improving the accuracy of models in simulating the emission, transport, and deposition of dust particles during typical East Asian dust storm events is of great importance for advancing the understanding of dust dynamics and its impacts over the region.
To effectively model dust events, accurately representing the physical properties of the surface is essential for dust emission parameterization schemes [20,21]. Dust aerosols are primarily emitted through aeolian processes of saltation and aerodynamic entrainment, which can be parameterized in models with DSF to estimate dust emission fluxes [22]. In the dust emission scheme for dust aerosol modeling, the current DSF parameter is often a constant calculated based on elevation or geomorphology to indicate potential dust source regions [23,24]. However, this method fails to capture features such as small-scale sand dunes and potential sparsely vegetated regions, significantly limiting the model’s ability to effectively simulate sudden dust storm events. Previous studies have shown that an updated map of DSF can improve the precision of simulations in major desert regions such as the Middle East and South America [25,26]. The improved methods for the DSF lack comprehensive consideration of land use, soil texture, and snow cover changes in the dust emission process. Moreover, most have not yet achieved a dynamically applicable DSF for dust source regions in East Asia. To address these limitations, satellite data combined with ground observations have been employed in this study to develop a more refined representation of dust emissions.
From 13 to 16 March 2021, an unprecedented dust storm swept across Mongolia and China, leading to a sharp decline in air quality over northern and eastern China. Remote sensing and geochemical studies on this event show that the surface erodibility along the pathways of the synoptic system is a critical factor in determining the intensity of this dust storm [27]. Previous dust simulations using WRF-Chem indicate that the magnitude and spatial distribution of dust fluxes generated by all dust schemes are highly sensitive to the map of DSF [28]. Hence, the DSF needs to be dynamically updated for each event to reflect changing soil erodibility conditions. In this study, we generated a new dataset that integrates time-varied satellite-derived reflectance with the Normalized Difference Vegetation Index (NDVI), snow cover, soil texture, and land-use data, enabling dynamic adjustments to the intensity and spatial distribution of the DSF. The new DSF was then incorporated into the dust emission scheme in WRF-Chem, and a case study was conducted to evaluate the performance of the updated dataset. Given the deficiencies identified in previous studies, this study aims to develop a dynamically updated DSF specifically for East Asia. Through model validation, the DSF improves the accuracy of dust simulations, offering valuable insights for advancing dust aerosol modeling.

2. Methodology

2.1. Update of Dust Source Function

In this study, the Air Force Weather Agency (AFWA) dust emission scheme was applied to simulate a dust storm event. By simulating soil properties and meteorology, the intensity of the saltation flux for each particle size bin is calculated when the simulated friction velocity exceeds the corrected threshold friction velocity. Using Equation (1), the total streamwise horizontal saltation flux G can be obtained.
G = s , p H D s , p d S r e l D s , p ,
where H D s , p is the saltation flux, d S r e l D s , p is a relative weighting factors related to particle size bins.
When the roughness length exceeds 20 cm, the bulk emission flux induced by saltation (unit: µg·m⁻2·s⁻1) can then be determined using Equation (2).
F = G × β × S ,
Here, β is a correction factor with a mass sandblasting efficiency, and S is the DSF, a dimensionless parameter that represents soil erodibility in the WRF-Chem model. Finally, the simulated dust for five bins is emitted to the bottom level of the model and used for dispersion and deposition simulations.
Ginoux et al. [23] defined the DSF as the ratio of simulated dust emissions to those from a fully erodible surface. It is determined based on terrain variability within each grid cell. It is assumed that dust in bare soil is typically generated by alluvial processes and accumulates in low-lying terrain areas. The calculation of DSF is given by Equation (3).
S = z m a x z z m a x z m i n 5 ,
z represents the elevation of the grid point, while z m a x and z m i n correspond to the highest and lowest elevations, respectively, within a 10° grid range surrounding the point. For any grid points that are not classified as bare soil in the Advanced Very High Resolution Radiometer (AVHRR) data, the value of S is set to zero. It is evident that DSF is a fixed value solely based on terrain elevation, calculated internally by the model using an elevation dataset with a resolution of 0.25°. Therefore, small-scale sand dunes and the variability of sparsely vegetated land cover are not considered here. In the AFWA scheme, the magnitude of DSF alters the concentration of emitted dust. But the time-independent DSF with a coarse resolution does not accurately reflect the spatial patterns of updated dust sources. Therefore, generating a dynamically updated distribution of DSF is essential to minimize the errors in S.
Grini et al. [29] proposed that the DSF corresponds to land surface reflectance, which depends on land cover and land use. They hypothesized that a reflectance-based approach could effectively capture the erodibility of dunes and shifting sand. The desert surface identified with high reflectance values has the potential to generate dust emissions. For each grid, the value of DSF is calculated using Equation (4).
S = R R m a x 2 × 1 N D V I N D V I m i n N D V I m a x N D V I m i n × f t × f l ,
R represents the observed surface reflectance value of the grid, and R m a x represents the maximum surface reflectance of major global dust source regions under clear-sky conditions during the study period. Typically, R m a x is taken as the highest surface reflectance observed over the Sahara Desert, as it is the region with the highest dust emissions on Earth. To maintain consistency with the S calculated by elevation used for the dust scheme, the values of S at each grid point range from 0 to 1. Since higher vegetation cover reduces dust emission potential by stabilizing the soil and reducing wind erosion, areas with minimal vegetation cover and exposed bare soil are more prone to dust emissions. We use the NDVI to incorporate variations in vegetation cover and assign a weight factor that linearly ranges from 0 to 1. In Equation (4), NDVI is the averaged NDVI for the grid during the simulation period, while N D V I m i n and N D V I m a x denote the lowest and highest NDVI values over the simulation region, respectively.
Additionally, a minimum sand fraction is required for dust emissions. The factor ft accounts for the influence of soil texture on dust emissions and is positively correlated with the proportion of sand content. Based on the soil texture classification developed by the U.S. Department of Agriculture (USDA), soils with sand content greater than 45% are classified as sand-dominated types. When the sand proportion exceeds 45%, ft is set to 1, and it decreases linearly as the sand content decreases below this threshold. Finally, DSF should account for the interannual variations in land use. As pointed out by Shinoda et al. [30], temperate grasslands in East Asia can serve as dust sources and are highly sensitive to climate change. A land use correction is introduced to account for these changes. For grids classified as bare soil, fl is set to 0.6, and for grassland, it is set to 0.4. For other land use types, it is assumed that dust emissions are negligible, and the fl for these grids is set to 0. On the other hand, grids with snow and ice coverage showing high surface reflectance cannot be recognized as source regions. Hence, we mask out areas with such high reflectance. For grids with snow and ice cover detected by satellite, DSF is assigned as 0.
All data were interpolated to the model grid using the nearest-neighbor interpolation method before being integrated into the model. Based on this methodology, the DSF constructed in this study incorporates spatial and temporal variations in vegetation cover, soil texture, snow-ice coverage, and land cover, which is dynamically updated over time.

2.2. Model Configuration

This study used WRF-Chem to simulate the dust storm event from 11 to 16 March, with the first 48 h designated as spin-up time. To properly simulate the meteorology, the ERA-5 global reanalysis dataset provided by ECMWF, with a spatial resolution of 0.25° × 0.25°, was used as initial and boundary meteorological input for the WRF-Chem simulation. The chemical boundary conditions were set as default profiles in the model. The simulation adopted a single domain with a horizontal resolution of 15 km × 15 km, covering the major dust source regions in East Asia, including Mongolia and most parts of China, as well as downstream transport areas of dust. The vertical grid consisted of 28 layers, extending from the surface to 10 hPa. The parameterization schemes in the simulation were selected through pilot test runs, and a detailed list of settings can be found in Table 1. To improve the simulation of meteorological variables, 3D-nudging was also activated in the model. Since the study focuses solely on evaluating dust emissions, anthropogenic emissions were not included in any of the simulations. By default, the model uses the FAO-SMW soil dataset by Reynolds et al. [31]. In this study, we updated it to the Global Soil Dataset for Earth System Models (GSDE) [32] to have better soil representation.
There are three different dust emission schemes in WRF-Chem: the Georgia Tech/Goddard Global Ozone Chemistry Aerosol Radiation and Transport (GOCART) scheme, the AFWA scheme, and the University of Cologne (UoC) scheme. We conducted a series of pilot experiments using all three schemes before implementing the updated DSF. Based on comparisons with available observations, the AFWA scheme produced the most reliable dust simulation for this dust storm event. Therefore, we selected the sophisticated AFWA dust emission scheme to further discuss the improvement in dust emissions resulting from the updated DSF. The AFWA scheme was originally developed to augment dust emissions in atmospheric chemistry models such as WRF-Chem [33]. It is a modified version of the saltation-based dust emission scheme (MB95 scheme) proposed by Marticorena and Bergametti, which conceptualizes dust emission as a two-step process [34]. The saltation of coarse particles is initiated by wind shear, and subsequently, finer dust particles are emitted through saltation bombardment. Utilizing the default and updated DSF, this study conducted two sets of simulation experiments with WRF-Chem. The first simulation used the default DSF as the control experiment, while the second simulation applied the updated DSF as the sensitive experiment. We then evaluated the improvement in dust simulation performance achieved by the updated DSF and analyzed the dust sources and emissions during the severe dust storm event. To evaluate the accuracy of the dust simulation, we also compared the simulation results with available observations.

2.3. Data

To develop a dynamically updated DSF, this study utilized the Moderate Resolution Imaging Spectroradiometer (MODIS) satellite observations provided by NASA, including surface reflectance product (MOD09A1), MODIS NDVI product (MOD13A3), MODIS snow cover product (MOD10A2), MODIS land use product (MCD12C1), and the GSDE soil dataset [35,36,37,38]. The MODIS satellite data used in the model simulations primarily consisted of biweekly or monthly datasets aligned with the study period. The land-use data applied reflects conditions from the year 2021. All satellite data can be obtained via the NASA Data Pool (https://lpdaac.usgs.gov/tools/data-pool/, accessed on 15 February 2025).
To evaluate meteorological factors during the dust storm event, hourly meteorological observations from the China Meteorological Administration’s surface observation network were used. Hourly PM10 concentration data from China’s environmental monitoring network and AOD from the MODIS MCD19A2 product were employed to assess the accuracy of simulated dust aerosols. For comparing the vertical structure of aerosol extinction, the Cloud-Aerosol Lidar and Infrared Pathfinder Satellite Observations (CALIPSO) Lidar Level 2 Aerosol Profile, Version 4-21 data product was used when the satellite’s orbit passed over northern China. The hourly ground observation data covered the entire analysis period of the simulation.
In this study, on the dust storm event over northern China, AOD was assumed to be dominated by dust aerosols. However, the MODIS-observed total AOD includes extinction from submicron aerosols. As proposed in [39], to eliminate the contribution of non-dust submicron aerosols to total AOD, a function based on the MODIS Ångström exponent was employed to estimate their fraction. Subsequently, the DOD from satellite observations can be precalculated by subtracting the non-dust submicron AOD from the total AOD and then used for model evaluation [40].

3. Results and Discussion

3.1. Comparison of DSF

The comparison between the default and updated DSF (Figure 1) reveals significant changes in both the magnitude and spatial distribution of the source function. The default DSF shows a large range of variation, with a maximum value reaching 0.4. High DSF values are found in Xinjiang and Inner Mongolia regions, with a broad distribution in the Taklamakan Desert and the Gobi Desert along the China–Mongolia border, while most areas in other provinces display DSF values of 0. The resolution of the default DSF is relatively coarse. Compared with the default DSF, the updated version identifies more potential dust sources, with DSF values ranging from 0 to 0.24. Considering seasonal and annual changes in snow cover, land use, and vegetation cover, regions such as Qinghai, Gansu, Tibet, the western and central parts of Mongolia, in addition to Xinjiang and Inner Mongolia, can also become potential dust source areas.
A comparison of the two DSFs (Figure 1c) indicates that the updated DSF values are lower than those of the default in central and northern Xinjiang and western Inner Mongolia. However, in the northern part of Tibet, northwestern Qinghai, and the western and southern parts of Mongolia, the updated DSF values are higher than the default values. This difference suggests that the default DSF, generated by elevation, only considered the Taklamakan and Gobi Deserts in the simulation, which are the two main dust source areas in East Asia. It cannot capture small sand dunes and sparsely vegetated dust emission regions. In recent years, due to climate change and intensified human activities, the default DSF also fails to account for potential dust source areas arising from changes in grasslands and bare land areas in Qinghai, Tibet, and Mongolia. Additionally, it cannot dynamically update the values of DSF for specific cases, which can be addressed through satellite observations. It is observed that the updated DSF contains more scattered grids representing high DSF values, indicating that the new DSF, derived from higher-resolution satellite data, can identify additional small dust source areas.

3.2. Near-Surface Meteorology

In WRF-Chem, the emission and transport processes of dust are closely related to changes in meteorology. Therefore, it is necessary to evaluate the simulated meteorology. Table 2 presents the correlation coefficient (R), mean error (ME), and root mean square error (RMSE) of 2 m air temperature, relative humidity, and 10 m wind speed during the dust storm event. For air temperature, the simulated R value is relatively high, indicating that the variation in simulated temperature is consistent with observations. However, there is a warm bias across the simulated region, with an ME of 0.50 °C and an RMSE of 2.71 °C. The relative humidity also shows a high R value, reaching 0.86, with an ME of only 1.81, indicating a slight overestimation in the simulation of relative humidity. The R for the 10 m wind speed is 0.59, while both the ME and RMSE suggest an overestimation in the simulation of 10 m wind speed. The statistics demonstrate that the WRF-Chem model effectively simulated the meteorology for the dust storm case, and emissions of dust aerosols can be further evaluated.

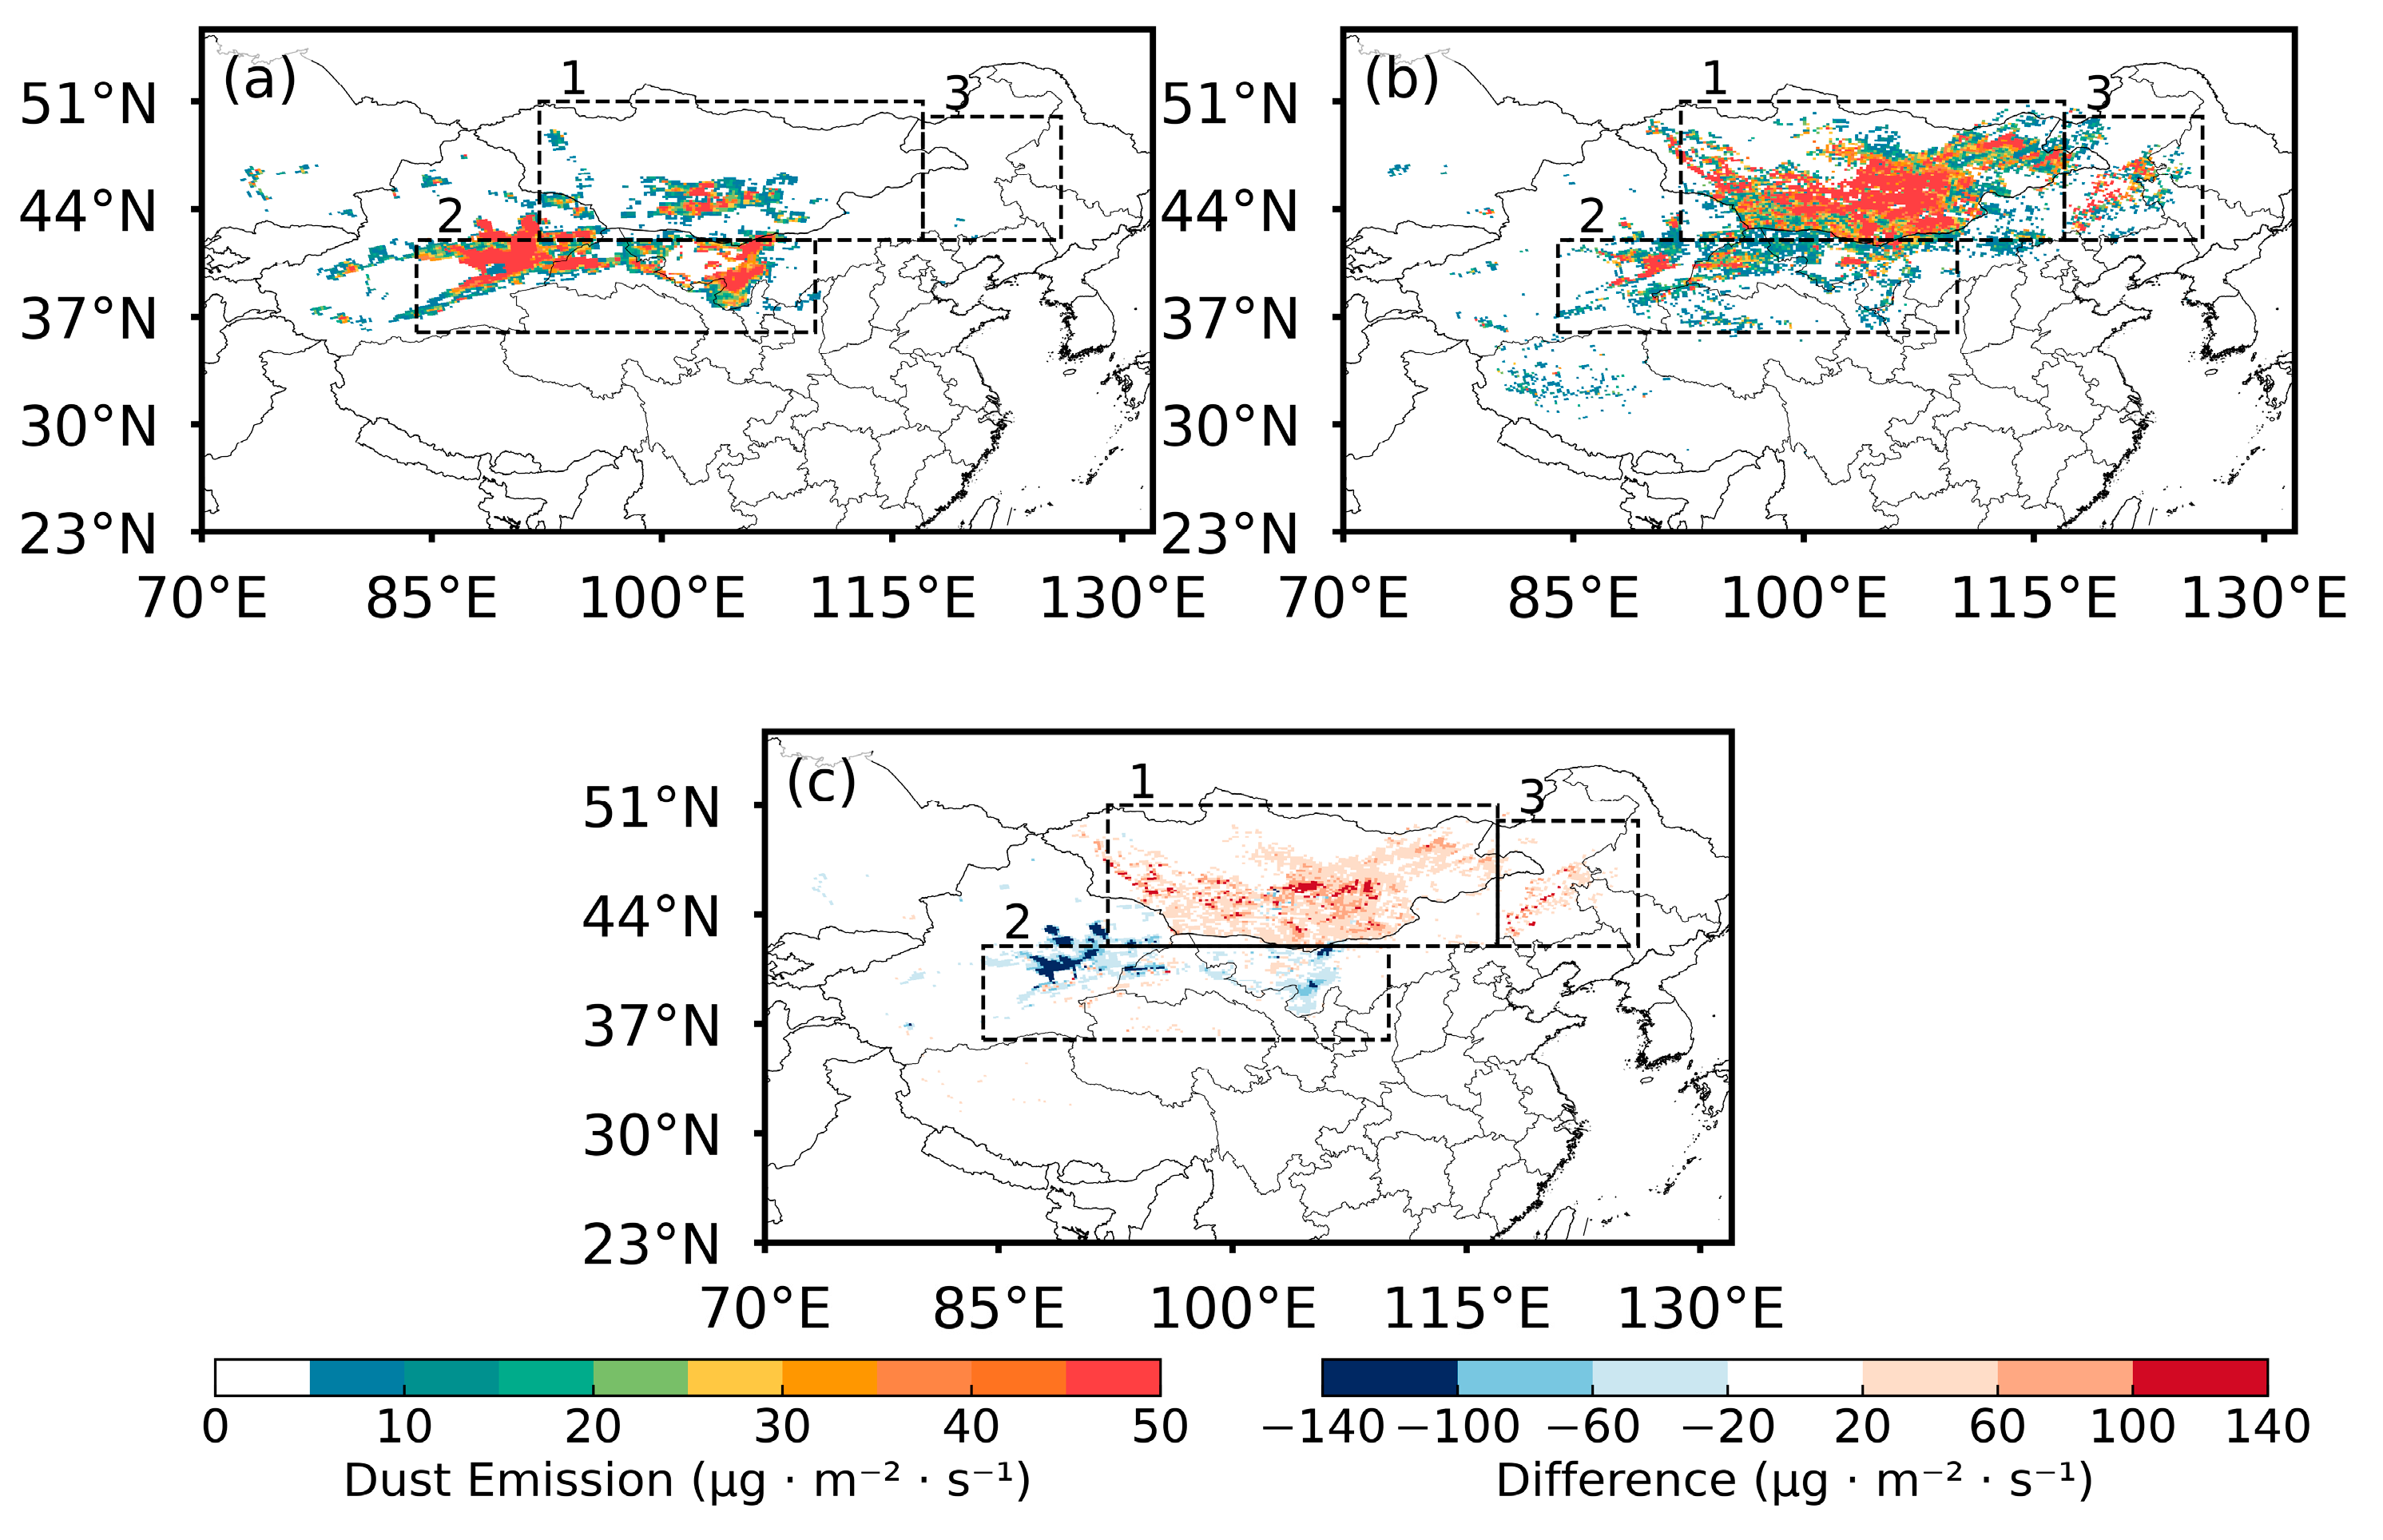
3.3. Changes in Dust Emissions

In the AFWA scheme, dust storm initiation is linearly related to the DSF. The two simulation experiments show that the DSF significantly alters dust emissions (Figure 2). In the default DSF simulation, dust emission fluxes exceeding 50 µg·m⁻2·s⁻1 are only observed in central Mongolia, the central and eastern parts of the Taklamakan Desert in Xinjiang, Gansu, and parts of Inner Mongolia. But in the simulation with the updated DSF, source regions of the dust storm exhibit a high-emission belt stretching from northwestern China to eastern Mongolia. Major sources of dust emissions include the Taklamakan Desert, the Qaidam Basin Desert, the Gobi Desert along the China–Mongolia border, and arid regions in northeastern China. The highest dust emission flux was simulated in the central and southern Gobi Desert in Mongolia, where it exceeded 50 µg·m⁻2·s⁻1. Meanwhile, dust source regions in northwestern and northeastern China showed grid emissions exceeding 30 µg·m⁻2·s⁻1. The differences in dust emissions between the two simulations indicate that the updated DSF enhances dust emissions over Mongolia and northeastern China, where small dunes and sparsely vegetated regions are predominant. These dust sources cannot be captured in the simulation using the default DSF.
Based on Figure 2, three high-emission regions have been categorized to calculate the total dust emissions over the simulation period. During the dust storm event, the highest total dust emissions in the simulation with the default DSF were located in northwestern China (8.53 Tg), followed by Mongolia (2.42 Tg), and only 0.02 Tg in northeastern China. In contrast, the updated DSF simulation showed Mongolia as the region with the highest total emissions, reaching 13.92 Tg, followed by northwestern China with 3.91 Tg and northeastern China with 1.35 Tg. The default DSF simulation underestimated dust emissions in Mongolia and overlooked emissions in northeastern China, while the updated DSF simulation showed reduced emissions in northwestern China compared to the default simulation. Overall, Mongolia accounted for 72.58% of the dust emissions from major dust source regions.
In order to evaluate the performance of dust emission simulations, available observations specific to dust aerosols, including PM10, DOD, and aerosol extinction coefficient, have been further used for comparison with model simulations.

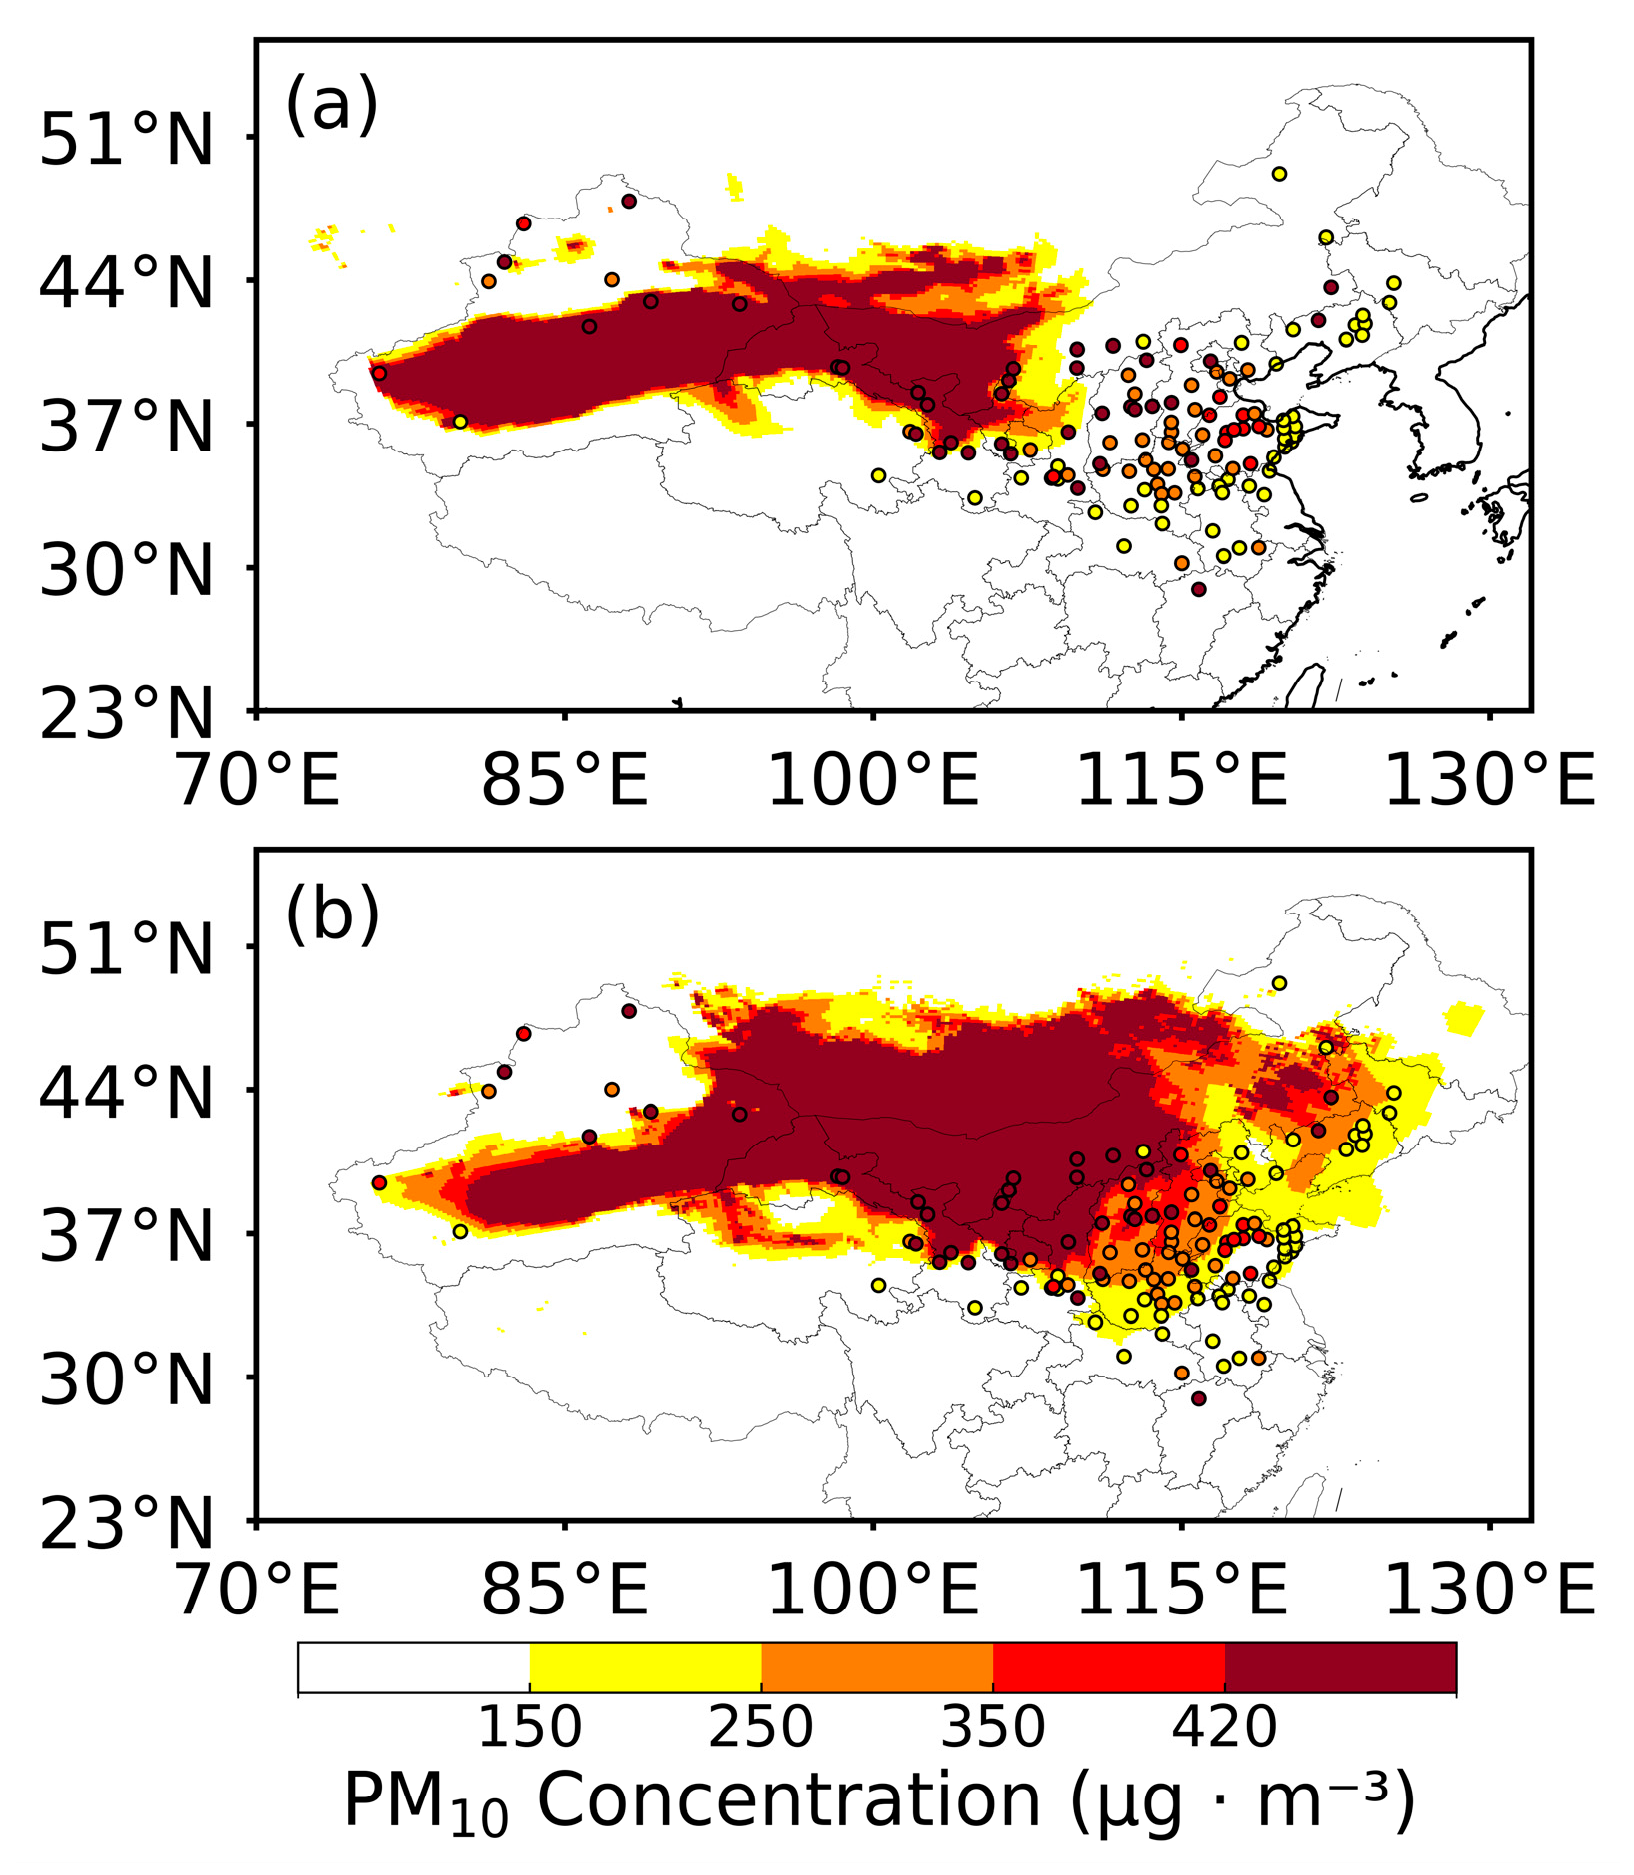
3.4. PM10 Concentrations

Since dust aerosols are dominated by coarse particles, PM10 can indirectly be used to evaluate the simulation performance of ground dust aerosols. The statistics of PM10 concentrations (Table 3) show that the simulation with the default DSF could not effectively simulate PM10 concentrations, with a correlation coefficient of only 0.32 compared to observations. The default simulation has an ME of −325.30, indicating that the original DSF severely underestimates the concentration of coarse particles during the dust storm. In contrast, the updated DSF shows an improvement in simulating coarse particles, with the correlation coefficient rising to 0.64 and the ME reduced to −109.30. Furthermore, the updated simulation results reduce the RMSE from 666.63 to 564.53, suggesting that the new DSF improves the simulation of PM10 concentrations. As discussed in Section 3.1 and Section 3.3, the default DSF covers a smaller area in northern China and Mongolia compared to the updated DSF, indicating fewer dust sources over these regions. Consequently, the default DSF results in lower dust emissions for this event, leading to the underestimation of simulated PM₁₀ concentrations than those obtained with the updated DSF. Additionally, since anthropogenic sources were not included in this study, there could be a systematic underestimation of aerosol concentrations.
Figure 3 displays the distribution of ground PM10 from observations and simulations, averaged over 13–16 March 2021. During the dust storm event, high PM10 concentrations were observed over the northwestern and northern parts of eastern China. At most monitoring sites in Inner Mongolia, Gansu, Ningxia, Shaanxi, and Hebei, mean PM10 concentrations exceeded 350 μg m⁻3, with some stations observing PM10 over 420 μg m⁻3. For the simulation with the default DSF, only a few sites in Xinjiang, Inner Mongolia, Gansu, and Ningxia displayed high PM10 concentrations (≥350 μg m⁻3). Most sites in northeastern and eastern China showed daily mean PM10 concentrations under 150 μg m⁻3. Compared with the observations, the simulation with the default DSF significantly underestimates PM10 concentrations during the dust storm event. But in the simulation with the updated DSF, high PM10 concentrations can be found over most sites in northwestern China, the North China Plain, and eastern China. Both the extent of high-value coverage and the magnitude of high concentrations correspond well with observations. Therefore, the PM10 simulation with the updated DSF is more reliable than that with the default DSF.

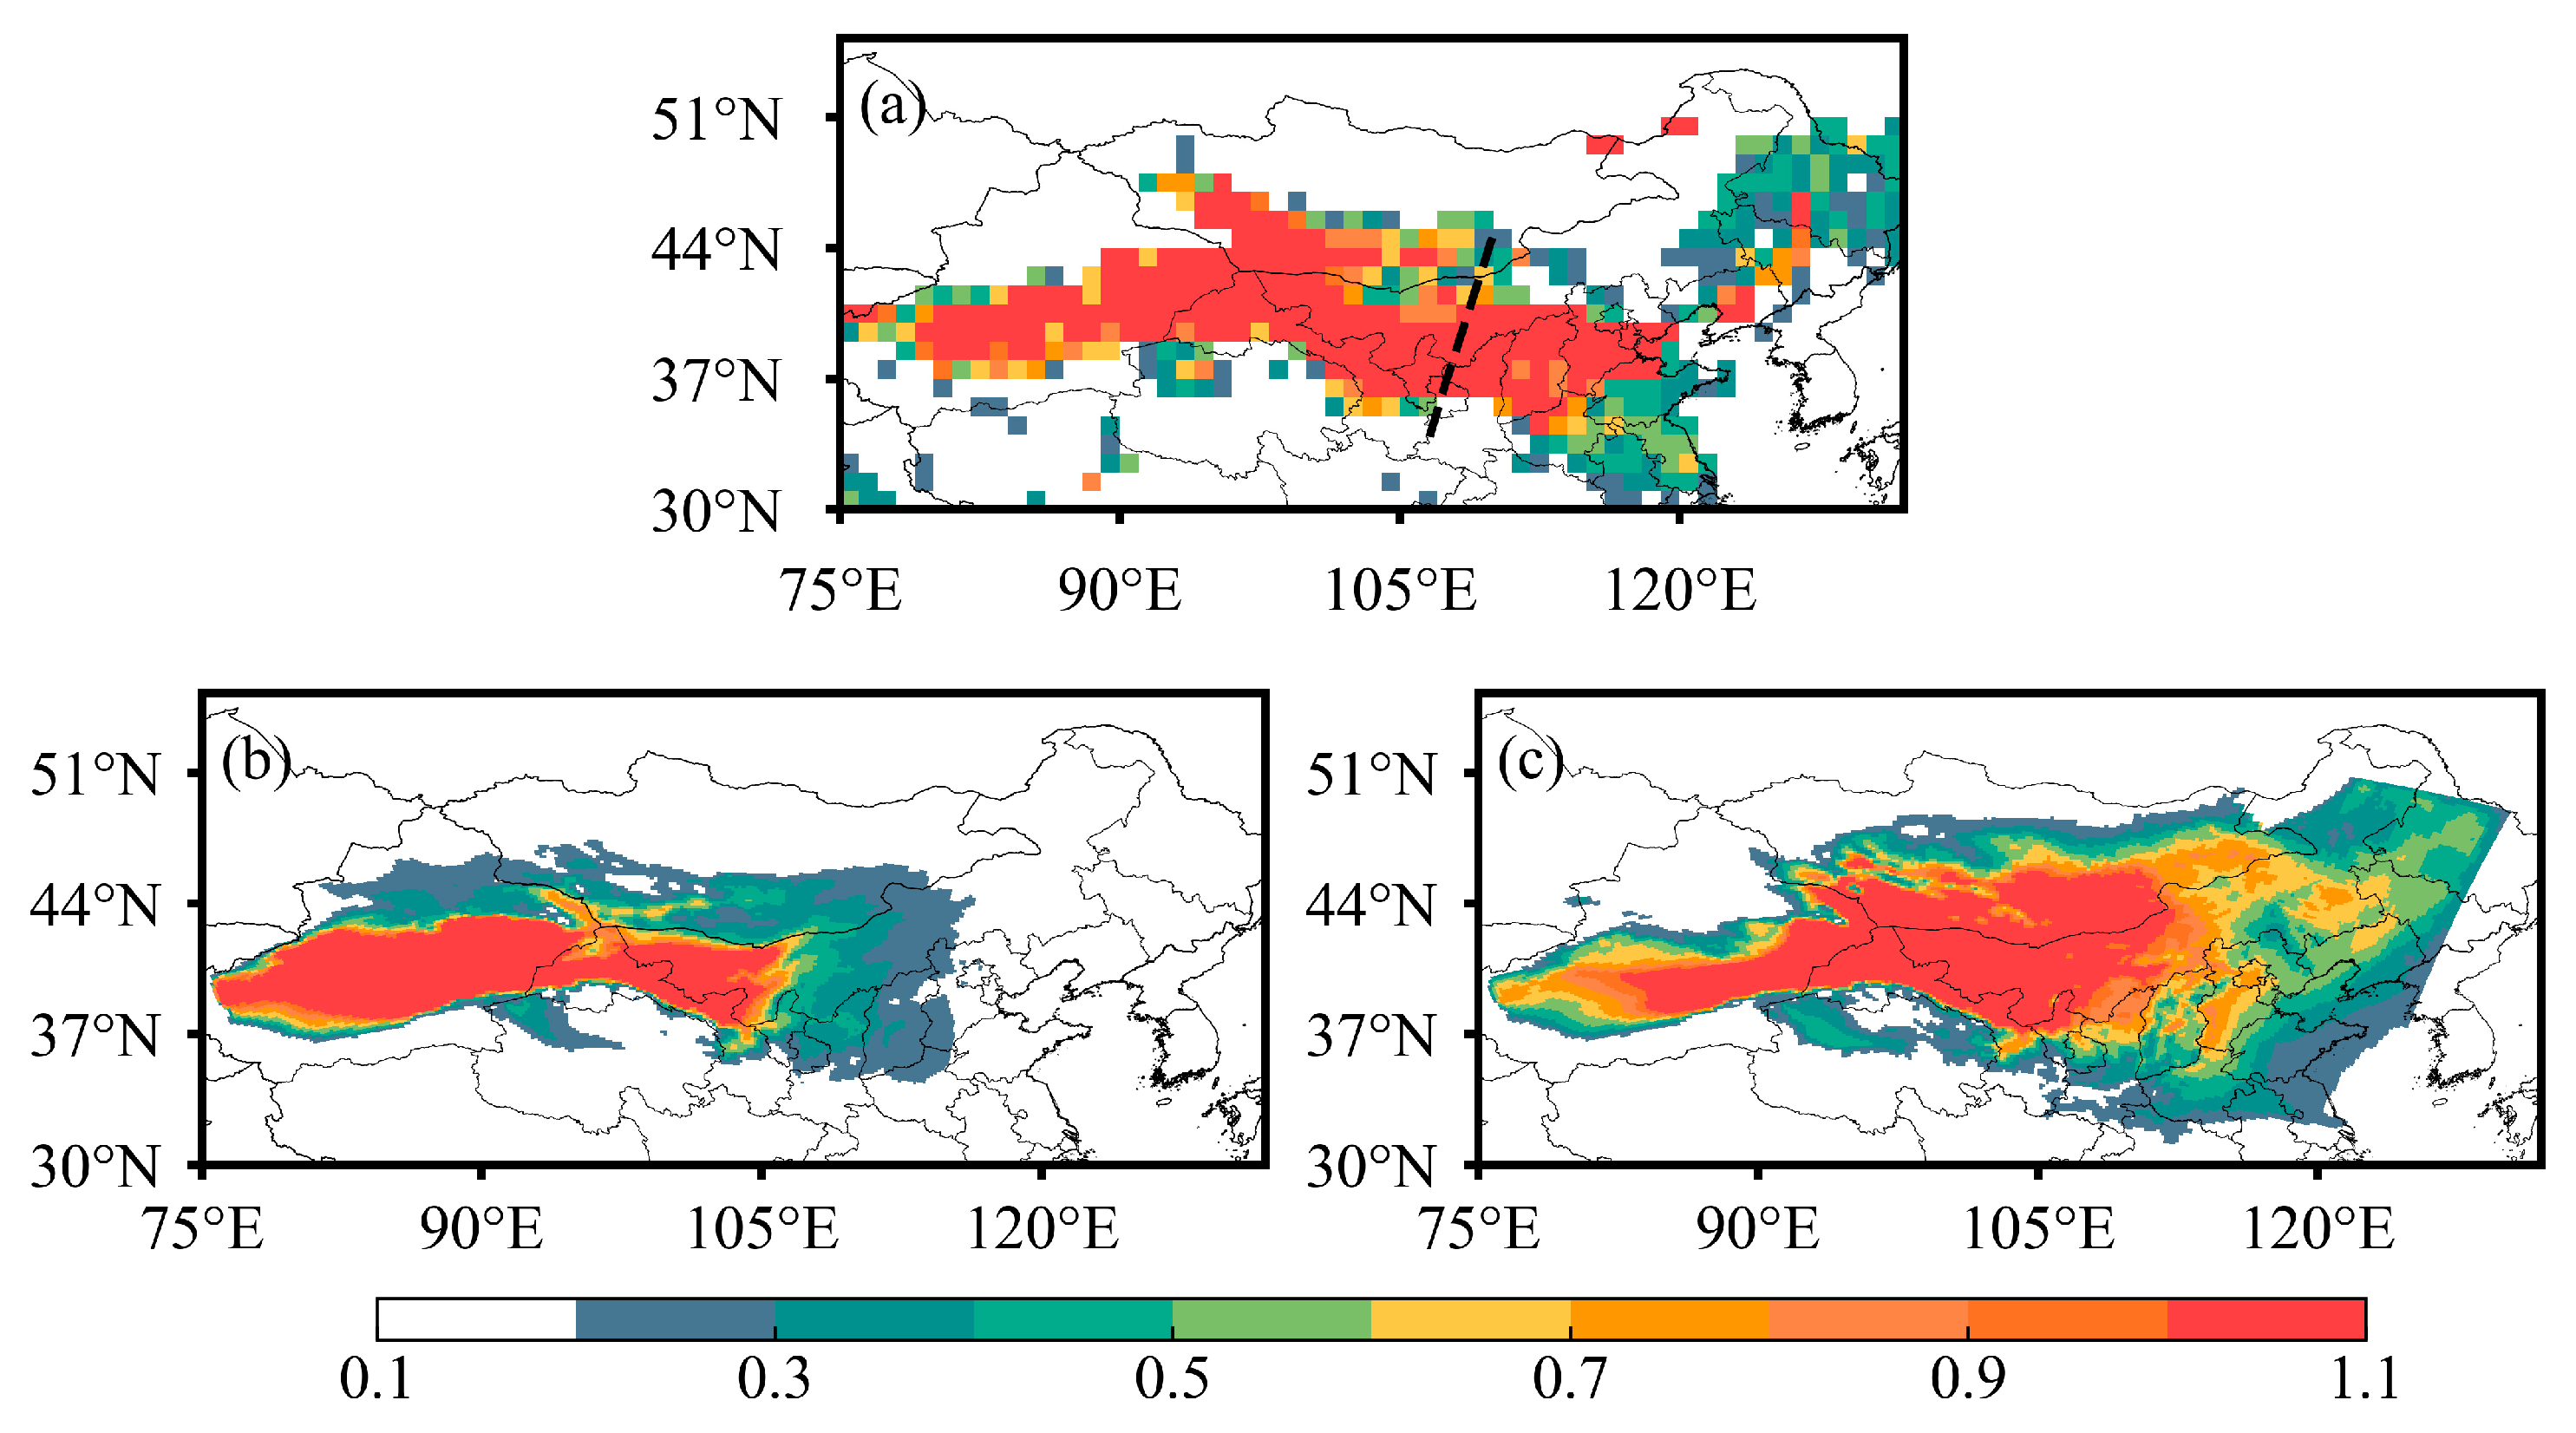
3.5. DOD Distribution

Due to the limited availability of particulate observations in the source region and surrounding areas during the dust storm, the MODIS satellite-derived DOD can be used to represent dust loadings. The satellite-observed DOD (Figure 4) shows that southern Mongolia and northern China, including most of Xinjiang, Gansu, Inner Mongolia, Ningxia, Shaanxi, Shanxi, and Hebei, experienced high DOD values (≥1.0). High concentrations of dust particles were transported from the source region in Mongolia to downstream areas, resulting in a significant increase in aerosol extinction from northwestern China to eastern China. However, the default DSF could only generate high DOD over the Taklamakan desert and its adjacent regions, while low DOD (<0.3) is found over most parts of northeastern and eastern China. In downstream regions of dust transport, the simulated DOD values are significantly lower than the observations. This indicates that the default DSF failed to capture key dust source areas during this dust storm event, resulting in the underestimation of dust emissions and inaccurate simulation of the dust event. In comparison, the simulation with the updated DSF shows high-DOD regions over dust source areas in Xinjiang, western Inner Mongolia, and southern Mongolia. In this simulation, eastern and northeastern China also experience DOD over 0.5. During the study period, satellite retrievals were unavailable for parts of eastern Mongolia and northeastern China, making comparisons between simulations and observations infeasible in these regions. Additionally, the transport of dust particles is influenced by meteorology. Inaccuracies in simulating meteorological variables such as wind speed can cause deviations in simulated dust particle concentrations in downstream areas, leading to uncertainties in DOD simulations. Furthermore, the exclusion of anthropogenic emissions contributes to a significant underestimation of AOD in densely populated regions, such as eastern China. Nevertheless, comparisons between observations and simulations indicates that the updated DSF improves the model’s ability to reproduce the spatial distribution of dust particles.

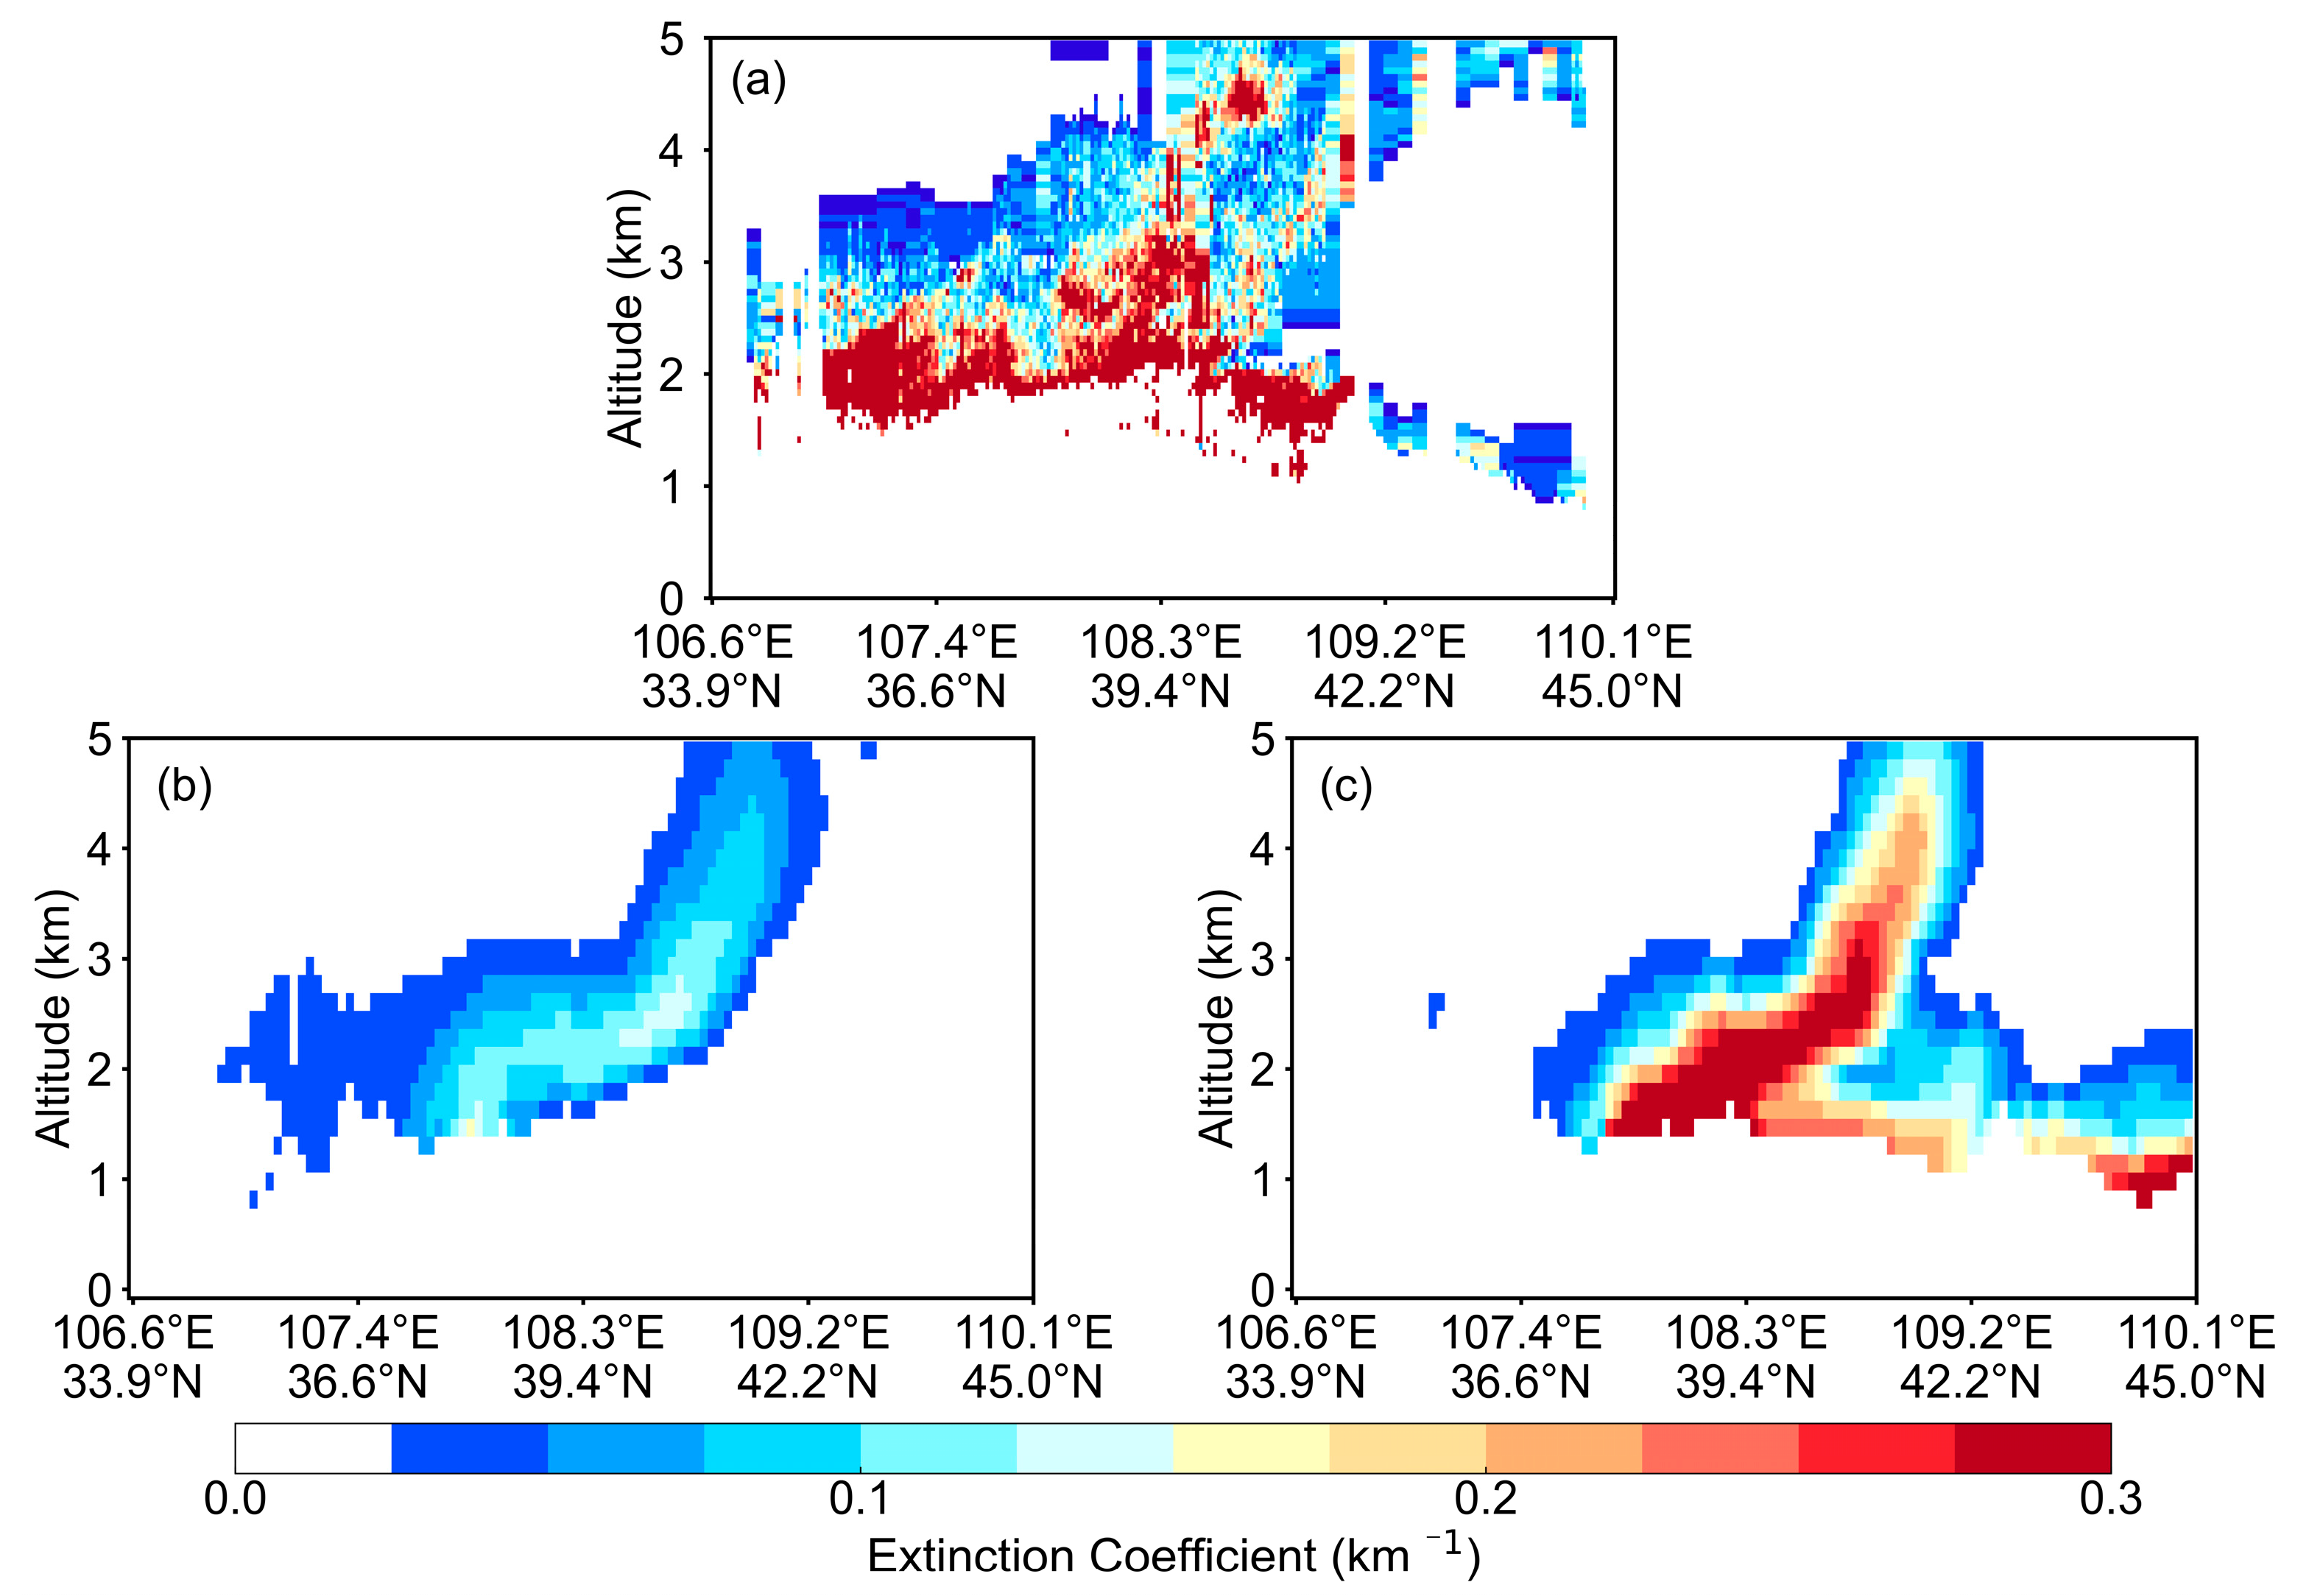
3.6. Aerosol Extinction Coefficient

The vertical profiles of aerosol extinction coefficients from CALIPSO are used to investigate the changes in dust aerosol extinction during the dust storm event. It is revealed that dust aerosols caused significantly high extinction over northern China and southern Mongolia on 15 March 2021 (Figure 5). The high extinction coefficient (≥0.3) is predominantly concentrated between 1 km and 3 km, with some portions extending below 2 km. Dust aerosols are capable of long-range vertical transport, reaching altitudes of up to 4 km in the atmosphere. Compared with the observations, the aerosol extinction coefficient in the simulation with the default DSF shows a significantly underestimated distribution. In this simulation, the maximum extinction does not exceed 0.2 in any grids across the cross-section, resulting in a less pronounced vertical structure of dust aerosol extinction. The observed high values near the surface between 108 °E and 109 °E are also absent. However, the extinction coefficient shows a significant increase in the simulation with the updated DSF, as high values (≥0.3) can be found over northwestern China. Multiple regions of elevated aerosol extinction are simulated both near the surface and at higher altitudes. But there are still differences between the simulated dust aerosol extinction using the updated DSF and CALIPSO in some non-source regions of northwestern China. These deviations may be attributed to uncertainties in simulated wind-driving dust aerosol transport from the emission sources, which could impact the distribution of dust aerosols. On the other hand, the lack of anthropogenic emissions in the model may result in an underestimation of simulated dust concentrations. Nevertheless, compared to observations, the vertical profiles of dust aerosol extinction simulated with the updated DSF show significant improvements over those obtained with the default DSF. The comparison between the two simulations demonstrates that the vertical distribution of dust storms could be better simulated as the updated DSF increased the emission of dust aerosols.

4. Conclusions and Discussion

Identifying dust source regions is essential for improving the performance of dust storm simulations. In dust emission schemes, DSF serves as a critical parameter in determining source regions and altering the emission fluxes of dust. Traditionally, DSF is calculated using terrain height differences and treated as a static dataset. This static DSF cannot capture sand dunes and sparsely vegetated areas, which are potential dust sources over East Asia. In this study, a new distribution of DSF has been developed for dust emission schemes to improve the simulation of dust aerosols during dust storm events. This dynamically updated DSF integrates satellite-derived reflectance data with NDVI, snow cover, soil texture, and land-use datasets. Compared to the default DSF, the newly developed DSF dynamically adjusts the grid intensity of erodibility based on satellite observations, characterizing more dust source regions, and reflecting changes caused by multiple factors. This refined dataset, along with the default DSF, was implemented in two sets of WRF-Chem experiments to simulate a major dust storm event that occurred from 13 to 16 March 2021. Comparisons between the simulations and observations were conducted to evaluate the improvements in dust aerosol simulations achieved by the new DSF.
By comprehensively considering multiple factors that influence the DSF, the updated version adjusts both the intensity and spatial distribution of dust sources. Unlike the default DSF, which primarily reflects major dust sources in the Taklamakan Desert and the Gobi Desert, the new DSF distribution identifies additional potential dust source regions, including bare soils and sparsely vegetated areas in Qinghai, Gansu, Tibet, and central and western Mongolia. Small-scale dust source regions can also be captured by the dynamically updated DSF, as it is generated from satellite observations with higher resolution. The updated DSF simulation reveals broader and more intense dust emissions, particularly over Mongolia, compared to the default DSF. Mongolia emerges as the most critical dust source region, contributing to over 70% of the total emissions from major dust source areas, with strong emissions from the southern Gobi Desert as well as central and western Mongolia.
To evaluate the simulation of this dust storm event, we compared the results with available ground and satellite observations. Statistical analysis shows that the simulated temperature, relative humidity, and wind speed correlate well with observations, indicating that the simulation of meteorology is reliable. To evaluate simulated dust emissions, which are primarily influenced by the DSF in the dust emission scheme, PM10, DOD, and aerosol extinction coefficient are used to indirectly validate changes in dust aerosols introduced by the updated DSF. The evaluation of ground PM10 shows that the simulation with the default DSF substantially underestimates the concentration of dust aerosols over northern China. However, the updated DSF improves the correlation between simulated and observed PM10. Both the ME and RMSE of PM10 simulations are reduced with the updated DSF, leading to higher accuracy in dust storm simulations. The comparison of simulated DOD with MODIS observations also reveals that the emission of dust better matches the observed spatial distribution of high DOD regions. Updating the DSF can further improve the vertical distribution of aerosol extinction coefficients, accurately reflecting the vertical transport of dust within the 1 to 3 km altitude range. We found that the updated simulations can better capture the vertical structure as dust diffuses from the surface to higher altitudes. Therefore, the dynamically updated DSF generated for the dust emission scheme can improve the performance of dust simulations.
This study contributes to a better understanding of the importance of dust emissions in the atmospheric environment. It highlights the potential of a dynamically updated DSF to advance dust modeling capabilities, providing a valuable tool for air quality research. This is particularly important for regions such as East Asia, where dust storms occur frequently. However, this study is based on a single dust storm event. Future research could focus on multiple dust storm cases under varying meteorological conditions to assess the robustness of the updated DSF. Additionally, higher-resolution datasets from satellite or ground-based observations could further refine the identification of dust source regions and improve the representation of small-scale dust emissions for better prediction of air quality changes.

Author Contributions

Conceptualization, C.T. and T.Z.; methodology, C.T. and C.L.; software, C.T. and T.L.; formal analysis, C.T.; writing—original draft preparation, C.T.; writing—review and editing, Z.L. and T.Z.; supervision, M.T. All authors have read and agreed to the published version of the manuscript.

Funding

This research was supported by National Natural Science Foundation of China (42277088), National Key Research and Development Program of China (2022YFC3701204), National Natural Science Foundation of China (42275196, 42105164), NSFC Young Scholars (42405171), and The Open Grants of the China Meteorological Administration Aerosol-Cloud and Precipitation Key Laboratory (KDW2413).

Institutional Review Board Statement

Not applicable.

Informed Consent Statement

Not applicable.

Data Availability Statement

Data are available from the corresponding author.

Conflicts of Interest

The authors declare no conflicts of interest.

References

  1. Shao, Y.; Wyrwoll, K.-H.; Chappell, A.; Huang, J.; Lin, Z.; McTainsh, G.H.; Mikami, M.; Tanaka, T.Y.; Wang, X.; Yoon, S. Dust cycle: An emerging core theme in Earth system science. Aeolian Res. 2011, 2, 181–204. [Google Scholar] [CrossRef]
  2. Kok, J.F.; Ward, D.S.; Mahowald, N.M.; Evan, A.T. Global and regional importance of the direct dust-climate feedback. Nat. Commun. 2018, 9, 241. [Google Scholar] [CrossRef] [PubMed]
  3. Cwiertny, D.M.; Young, M.A.; Grassian, V.H. Chemistry and photochemistry of mineral dust aerosol. Annu. Rev. Phys. Chem. 2008, 59, 27–51. [Google Scholar] [CrossRef] [PubMed]
  4. Mahowald, N.M.; Scanza, R.; Brahney, J.; Goodale, C.L.; Hess, P.G.; Moore, J.K.; Neff, J. Aerosol Deposition Impacts on Land and Ocean Carbon Cycles. Curr. Clim. Change Rep. 2017, 3, 16–31. [Google Scholar] [CrossRef]
  5. Fussell, J.C.; Kelly, F.J. Mechanisms underlying the health effects of desert sand dust. Environ. Int. 2021, 157, 106790. [Google Scholar] [CrossRef]
  6. Gherboudj, I.; Beegum, S.N.; Ghedira, H. Identifying natural dust source regions over the Middle-East and North-Africa: Estimation of dust emission potential. Earth-Sci. Rev. 2017, 165, 342–355. [Google Scholar]
  7. Ukhov, A.; Ahmadov, R.; Grell, G.; Stenchikov, G. Improving dust simulations in WRF-Chem v4.1.3 coupled with the GOCART aerosol module. Geosci. Model Dev. 2021, 14, 473–493. [Google Scholar]
  8. Kok, J.F.; Adebiyi, A.A.; Albani, S.; Balkanski, Y.; Checa-Garcia, R.; Chin, M.; Colarco, P.R.; Hamilton, D.S.; Huang, Y.; Ito, A.; et al. Contribution of the world’s main dust source regions to the global cycle of desert dust. Atmos. Chem. Phys. 2021, 21, 8169–8193. [Google Scholar]
  9. Zender, C.S.; Miller, R.; Tegen, I. Quantifying mineral dust mass budgets: Terminology, constraints, and current estimates. Eos Trans. Am. Geophys. Union 2004, 85, 509–512. [Google Scholar]
  10. Kok, J.F.; Adebiyi, A.A.; Albani, S.; Balkanski, Y.; Checa-Garcia, R.; Chin, M.; Colarco, P.R.; Hamilton, D.S.; Huang, Y.; Ito, A.; et al. Improved representation of the global dust cycle using observational constraints on dust properties and abundance. Atmos. Chem. Phys. 2021, 21, 8127–8167. [Google Scholar]
  11. Kok, J.F.; Storelvmo, T.; Karydis, V.A.; Adebiyi, A.A.; Mahowald, N.M.; Evan, A.T.; He, C.; Leung, D.M. Mineral dust aerosol impacts on global climate and climate change. Nat. Rev. Earth Environ. 2023, 4, 71–86. [Google Scholar] [CrossRef]
  12. Tanaka, T.Y.; Chiba, M. A numerical study of the contributions of dust source regions to the global dust budget. Glob. Planet. Change 2006, 52, 88–104. [Google Scholar] [CrossRef]
  13. Gavrouzou, M.; Hatzianastassiou, N.; Gkikas, A.; Korras-Carraca, M.-B.; Mihalopoulos, N. A Global Climatology of Dust Aerosols Based on Satellite Data: Spatial, Seasonal and Inter-Annual Patterns over the Period 2005–2019. Remote Sens. 2021, 13, 359. [Google Scholar] [CrossRef]
  14. Castellanos, P.; Colarco, P.; Espinosa, W.R.; Guzewich, S.D.; Levy, R.C.; Miller, R.L.; Chin, M.; Kahn, R.A.; Kemppinen, O.; Moosmüller, H.; et al. Mineral dust optical properties for remote sensing and global modeling: A review. Remote Sens. Environ. 2024, 303, 113982. [Google Scholar] [CrossRef]
  15. Kim, D.; Chin, M.; Schuster, G.; Yu, H.; Takemura, T.; Tuccella, P.; Ginoux, P.; Liu, X.; Shi, Y.; Matsui, H.; et al. Where Dust Comes From: Global Assessment of Dust Source Attributions With AeroCom Models. J. Geophys. Res. Atmos. 2024, 129, e2024JD041377. [Google Scholar] [CrossRef]
  16. Zhang, K.; Chai, F.; Zhang, R.; Xue, Z. Source, route and effect of Asian sand dust on environment and the oceans. Particuology 2010, 8, 319–324. [Google Scholar] [CrossRef]
  17. Huang, J.; Wang, T.; Wang, W.; Li, Z.; Yan, H. Climate effects of dust aerosols over East Asian arid and semiarid regions. J. Geophys. Res. Atmos. 2014, 119, 11398–11416. [Google Scholar] [CrossRef]
  18. Yu, Y.; Kalashnikova, O.V.; Garay, M.J.; Notaro, M. Climatology of Asian dust activation and transport potential based on MISR satellite observations and trajectory analysis. Atmos. Chem. Phys. 2019, 19, 363–378. [Google Scholar] [CrossRef]
  19. Tian, Y.; Wang, Z.; Pan, X.; Li, J.; Yang, T.; Wang, D.; Liu, X.; Liu, H.; Zhang, Y.; Lei, S.; et al. Influence of the morphological change in natural Asian dust during transport: A modeling study for a typical dust event over northern China. Sci. Total Environ. 2020, 739, 139791. [Google Scholar] [CrossRef]
  20. Shao, Y.; Ishizuka, M.; Mikami, M.; Leys, J.F. Parameterization of size-resolved dust emission and validation with measurements. J. Geophys. Res. 2011, 116, D08203. [Google Scholar] [CrossRef]
  21. Gong, S.L.; Zhang, X.Y.; Zhao, T.L.; McKendry, I.G.; Jaffe, D.A.; Lu, N.M. Characterization of soil dust aerosol in China and its transport and distribution during 2001 ACE-Asia: 2. Model simulation and validation. J. Geophys. Res. Atmos. 2003, 108, 4262. [Google Scholar]
  22. Kok, J.F.; Parteli, E.J.; Michaels, T.I.; Karam, D.B. The physics of wind-blown sand and dust. Rep. Prog. Phys. 2012, 75, 106901. [Google Scholar]
  23. Ginoux, P.; Chin, M.; Tegen, I.; Prospero, J.M.; Holben, B.; Dubovik, O.; Lin, S.J. Sources and distributions of dust aerosols simulated with the GOCART model. J. Geophys. Res. Atmos. 2001, 106, 20255–20273. [Google Scholar] [CrossRef]
  24. Koven, C.D.; Fung, I. Identifying global dust source areas using high-resolution land surface form. J. Geophys. Res. Atmos. 2008, 113, D22204. [Google Scholar]
  25. Cremades, P.G.; Fernández, R.P.; Allende, D.G.; Mulena, G.C.; Puliafito, S.E. High resolution satellite derived erodibility factors for WRF/Chem windblown dust simulations in Argentina. Atmósfera 2017, 30, 11–25. [Google Scholar]
  26. Nabavi, S.O.; Haimberger, L.; Samimi, C. Sensitivity of WRF-chem predictions to dust source function specification in West Asia. Aeolian Res. 2017, 24, 115–131. [Google Scholar]
  27. Liang, P.; Chen, B.; Yang, X.; Liu, Q.; Li, A.; Mackenzie, L.; Zhang, D. Revealing the dust transport processes of the 2021 mega dust storm event in northern China. Sci. Bull. 2022, 67, 21–24. [Google Scholar]
  28. Idrissa, N.F.; Zhao, C.; Zhiyuan, H.; Feng, J.; Du, Q. Long-range transport impact of a severe dust storm over the Yangtze River Basin region and its modeling sensitivity to dust emission scheme. Atmos. Res. 2024, 310, 107612. [Google Scholar]
  29. Grini, A.; Myhre, G.; Zender, C.S.; Isaksen, I.S.A. Model simulations of dust sources and transport in the global atmosphere: Effects of soil erodibility and wind speed variability. J. Geophys. Res. Atmos. 2005, 110, D02205. [Google Scholar]
  30. Shinoda, M.; Gillies, J.A.; Mikami, M.; Shao, Y. Temperate grasslands as a dust source: Knowledge, uncertainties, and challenges. Aeolian Res. 2011, 3, 271–293. [Google Scholar] [CrossRef]
  31. Reynolds, C.A.; Jackson, T.J.; Rawls, W.J. Estimating soil water-holding capacities by linking the Food and Agriculture Organization Soil map of the world with global pedon databases and continuous pedotransfer functions. Water Resour. Res. 2000, 36, 3653–3662. [Google Scholar] [CrossRef]
  32. Shangguan, W.; Dai, Y.; Duan, Q.; Liu, B.; Yuan, H. A global soil data set for earth system modeling. J. Adv. Model. Earth Syst. 2014, 6, 249–263. [Google Scholar] [CrossRef]
  33. LeGrand, S.L.; Polashenski, C.; Letcher, T.W.; Creighton, G.A.; Peckham, S.E.; Cetola, J.D. The AFWA dust emission scheme for the GOCART aerosol model in WRF-Chem v3.8.1. Geosci. Model Dev. 2019, 12, 131–166. [Google Scholar] [CrossRef]
  34. Marticorena, B.; Bergametti, G. Modeling the atmospheric dust cycle: 1. Design of a soil-derived dust emission scheme. J. Geophys. Res. Atmos. 1995, 100, 16415–16430. [Google Scholar] [CrossRef]
  35. Vermote, E.F.; Roger, J.C.; Ray, J.P. MODIS Surface Reflectance User’s Guide Collection 6; NASA EOSDIS Land Processes Distributed Active Archive Center: Sioux Falls, SD, USA, 2015. Available online: https://lpdaac.usgs.gov/documents/306/MOD09_User_Guide_V6.pdf (accessed on 15 February 2025).
  36. Solano, R.; Didan, K.; Jacobson, A.; Huete, A. MODIS Vegetation Index User’s Guide (MOD13 Series); University of Arizona, Vegetation Index and Phenology Lab: Tucson, AZ, USA, 2015; pp. 1–38. [Google Scholar]
  37. Hall, D.K.; Riggs, G.A. MODIS/Terra Snow Cover 8-Day L3 Global 500m SIN Grid, Version 61; NASA National Snow and Ice Data Center Distributed Active Archive Center: Boulder, CO, USA, 2021; Available online: https://doi.org/10.5067/MODIS/MOD10A2.061 (accessed on 15 February 2025).
  38. Sulla-Menashe, D.; Friedl, M.A. User Guide to Collection 6 MODIS Land Cover (MCD12Q1 and MCD12C1) Product; USGS: Reston, VA, USA, 2018. [Google Scholar]
  39. Anderson, T.L.; Wu, Y.; Chu, D.A.; Schmid, B.; Redemann, J.; Dubovik, O. Testing the modis satellite retrieval of aerosol fine-mode fraction. J. Geophys. Res. Atmos. 2005, 110, D18204. [Google Scholar] [CrossRef]
  40. Song, Q.; Zhang, Z.; Yu, H.; Ginoux, P.; Shen, J. Global dust optical depth climatology derived from CALIOP and MODIS aerosol retrievals on decadal timescales: Regional and interannual variability. Atmos. Chem. Phys. 2021, 21, 13369–13395. [Google Scholar] [CrossRef]
Figure 1. Spatial distribution of (a) the default DSF and (b) the dynamically updated DSF, respectively, used in the control and sensitive experiments for the dust storm event from 13 to 16 March 2021, and (c) the differences between the two simulations.
Atmosphere 16 00357 g001
Figure 2. Distribution of simulated dust emission fluxes from (a) the default, (b) the updated DSF, and (c) the difference between the two simulations, averaged for the dust storm from 13 to 16 March 2021. The rectangles indicate three major dust sources in Mongolia, northwestern China, and northeastern China.
Atmosphere 16 00357 g002
Figure 3. Distribution of PM10 concentrations averaged over 13–16 March 2021, from (a) the default and (b) the updated DSF simulation. Color-coded circles represent PM10 concentration observations from China’s environmental monitoring network.
Atmosphere 16 00357 g003
Figure 4. Distribution of DOD averaged from 13 to 16 March 2021, from (a) MODIS observations, (b) the default DSF simulation, and (c) the updated DSF simulation. The dashed line in (a) indicates the cross-section of the CALIPSO observation.
Atmosphere 16 00357 g004
Figure 5. Cross-sections of the aerosol extinction coefficient (550 nm) at 19:30 on 15 March 2021 from (a) CALIPSO, (b) the simulation with the default DSF, and (c) the simulation with the updated DSF.
Atmosphere 16 00357 g005
Table 1. Namelist options of parameterizations used in the WRF-Chem setup.
Option NameScheme
Boundary layerACM2
Land surfaceUnified Noah
Surface layerMM5 Monin-Obukhov
MicrophysicsMorrison-2
Long wave radiationRRTMG
Short wave radiationRRTMG
CumulusGrell-3
Dust emission schemeAFWA
Table 2. Statistics of simulated meteorology compared with observations.
FactorRMERMSE
2 m air temperature (T2) 0.880.502.71
relative humidity (RH)0.861.8112.2
10 m wind speed (W10)0.591.372.17
Table 3. Statistics of simulated PM10 compared with ground observations.
FactorRMERMSE
PM10 (with the default DSF)0.32−325.30666.63
PM10 (with the updated DSF)0.64−109.30564.53
Disclaimer/Publisher’s Note: The statements, opinions and data contained in all publications are solely those of the individual author(s) and contributor(s) and not of MDPI and/or the editor(s). MDPI and/or the editor(s) disclaim responsibility for any injury to people or property resulting from any ideas, methods, instructions or products referred to in the content.

