Article

Monthly Scale Validation of Climate Models’ Outputs Against Gridded Data over South Africa

1
Department of Meteorology, Institute of Geography and Earth Sciences, ELTE Eötvös Loránd University, Pázmány st. 1/a, H-1117 Budapest, Hungary
2
Institute of Natural Resources NPC, Pietermaritzburg 3200, South Africa
*
Author to whom correspondence should be addressed.
Atmosphere 2025, 16(10), 1200; https://doi.org/10.3390/atmos16101200
Submission received: 25 August 2025 / Revised: 11 October 2025 / Accepted: 13 October 2025 / Published: 17 October 2025
(This article belongs to the Section Climatology)

Abstract

The validation of climate models is important for ensuring accurate climate variability over a given region. This study evaluates the performance of multiple global climate model simulations from the Coupled Model Intercomparison Project Phases 5 and 6 and the downscaled regional climate model simulations from the Coordinated Regional Climate Downscaling Experiment against gridded observational data from the Climatic Research Unit gridded data during the historic period 1981–2000. Spatial analysis using monthly bias maps and statistical metrics (i.e., correlation coefficient, standard deviation, and centred root-mean-squared error) were employed to assess the model outputs’ ability to reproduce monthly temperature and precipitation patterns over South Africa. The results indicate an improvement in CMIP6 and CORDEX model simulation outputs compared to their CMIP5 predecessors, with reduced biases and enhanced correlation. The study underscores the importance of model selection for regional climate analysis and highlights a need for further model development to capture complex physical processes.

1. Introduction

The use of global climate models (GCMs) significantly contributes to the prediction of future climatic conditions [1], with many results focusing on regional analysis within the Coordinated Regional Climate Downscaling Experiment (CORDEX). However, the new CMIP6 results are a new addition to the Coupled Model Intercomparison Project Phase 5 (CMIP5), which served for driving inputs for the completed CORDEX simulations. Hence, it is of interest for climate change research, especially over the African domain, as it is considered one of the most vulnerable regions to global climate change. Therefore, it is important to ensure the validity of these models for accurate projections and adaptation plans [2].
Climate model validation has always been used to determine the ability of models to reproduce historic station or observational data sets [3]. This is important for ensuring that climate model projections are reliable for the use of regional climate studies. Studies across Africa have mostly focused on the validation of precipitation (e.g., [4,5,6]), as it is the most complex parameter, and the lack of station data has raised the question of whether or not climate models can represent the African domain. The global data sets of the Climatic Research Unit (CRU) offer reliable gridded data, which can be used for validation [7]. These studies concluded that climate models often struggle to represent the African regions, due to complex topographies and diverse climates. However, previous studies, e.g., [8], focused on a larger Southern African region and showed that the model ensembles of CORDEX, CMIP5 and CMIP6 considerably underestimated precipitation when validated against satellite and gauge data during the October to March seasons.
On the contrary, ref. [4] observed overestimation of precipitation over the western part of Southern Africa during December to March when using large ensemble means. Reference [9] highlighted the fact that model performance varies with region, and showed an overestimation of precipitation over Southern Africa. Other examples (i.e., from [10]) used observations and indicated that CMIP6 data had a better performance compared to the CMIP5 model simulations at reproducing precipitation over West Africa. However, ref. [11] noted variability in CMIP6 performance, with some exhibiting overestimations during dry seasons and underestimations during the wet season, over NorthAfrica, respectively. Whilst African studies indicate that regional climate models (RCMs) tend to perform better on a region-specific level, for example, ref. [12] indicated that the CORDEX-AFRICA model ensemble had high correlation with precipitation station data in Ethiopia.
This study evaluates models from CORDEX, CMIP5, and CMIP6 to reproduce monthly historical temperature and precipitation climatology over South Africa, facilitating model selection for projection studies. The main objective is to evaluate the model simulations by using gridded observational data sets from the CRU database. The results of this study will contribute to the scientific community by providing an analysis which explores the performance of the models on a regional country level. Overall, this study aims to determine (i) how the downscaling improves the GCM simulation results by the embedded RCM simulations; (ii) how the GCMs have improved from CMIP5 to CMIP6; and (iii) which of the simulations is the best performing in terms of precipitation and temperature reproduction among the GCM simulations and the GCM-driven RCM simulations, respectively.
For these purposes, the monthly precipitation and temperature data are validated against the gridded CRU data using correlation coefficients (r), standard deviation (SD) and centred root-mean-squared error (cRMSE). This study uses spatial validation, wherein grid-by-grid values from the climate model simulations are calculated against CRU data for the 20-year reference period between 1981 and 2000.

Study Area

The target area of this study is Domain 5 under the CORDEX program. More specifically, the validation focuses on South Africa (Figure 1), which lies at the southernmost part of the African continent. The interior of the country is a plateau surrounded by a 3408 m high boundary of the Great Escarpment. The South African climate is influenced by several factors such as oceanic influence, geographical location and distinct topographical features. Thus, the country has varied climatic conditions.
The country is predominantly classified as semi-arid, and receives an annual mean precipitation of 450 mm, experiencing wet summers and dry winters, with the exception of the Western Cape, which has a Mediterranean climate with an opposite annual course of precipitation. Though the country has faced adverse effects of climate change, it still heavily relies on the use of fossil fuels [13], which makes it even more vulnerable to the projected effects of climate change under a business-as-usual scenario.

2. Materials and Methods

2.1. Observational Data

The CRU high-resolution global data set developed by the University of East Anglia is used for this study. The data is freely available at https://crudata.uea.ac.uk/cru/data/hrg/ (9 April 2024). Both monthly precipitation and temperature are available from 1960 to 2010 at a high resolution of 0.5°. The data is a reliable gridded data set, as the university maintains credible data quality control, significantly contributing to filling the scientific gap where the lack of observational datasets has affected climate studies. CRU uses angular-distance weighting to interpolate averaged anomalies from monthly station data [7].

2.2. Simulation Data

This study uses monthly precipitation and temperature data derived from daily precipitation and temperature, respectively. The simulated data (Table 1) is freely available from the Earth System Grid Federation (ESGF) data nodes (https://esgf-metagrid.cloud.dkrz.de/search (15 March 2024)). CMIP5 experiments ensure that the GCMs’ capacity in representing the internal variability and external forcing are taken into account through the historical simulations, which are available from 1850. For this study, we use simulation data, which are available at a nominal resolution of 100 km. The latest addition of the CMIP strengthens the climate model data archives for the future climate, which is important for downscaling studies. It provides insight into changes in the response to climate change under Shared Social–Economic Pathways (SSPs), coupled with the available Representative Concentration Pathways (RCPs). However, for this validation study, we downloaded the available data from historical simulations with 1° resolution. The CORDEX data provides experimental simulations with parametrisations specifically developed to address the African domain, thus providing an added value for regional-scale climatic information. We use 3 RCMs with a resolution of 0.22°; each has been driven by the three different GCMs selected from the CMIP5.

3. Methodology

The most common validation method includes the ensemble mean method, where the mean of two or more climate model simulations is calculated and validated against an observational data set. This method is reported to improve the climate representation of a region (e.g., [23]). In this study, we validate each climate model simulation’s output against the CRU data without an ensemble mean, to determine the performance of individual model simulations. For this purpose, statistical and spatial validation methods are used.

3.1. Spatial Validation Using the Monthly Mean Bias Maps

The multi-year monthly means were calculated for both temperature and precipitation for the reference period 1981–2000. This period was selected in accordance with the IPCC reports, which uses 20 years, as it is long enough for precipitation statistical analysis. To create a uniform grid, we selected the gridded CRU observational data set as our base resolution, since it serves as the reference, and the climate models from the CMIP and CORDEX simulations used different spatial resolutions. Therefore, the CRU grid was extracted to remap the CORDEX, CMIP5 and CMIP6 datasets using bilinear interpolation via the CDO (Climate Data Operator, https://code.mpimet.mpg.de/projects/cdo (4 April 2024)) script. A topography mask was then applied to the simulated data to ensure that data over the ocean was omitted. The monthly mean bias between each climate model simulation against CRU and against each other was calculated for all 12 months via a CDO script. Then, these bias fields (i.e., maps) were produced with R-codes [24].

3.2. Statistical Validation of Monthly Mean Fields

The average spatial fields for both temperature and precipitation were calculated with R-codes, where the monthly average for each grid cell was used to calculate the different statistical measures, namely, cRMSE, r and SD. The comparison of the spatial structure of simulated data to CRU is visualised in Taylor diagrams [25], which were produced using the Plotrix package in R. The analysis of the spatial comparison of monthly mean fields serves as the main tool to select the best performing model simulations per month among all three simulations sets (i.e., CMIP6, CMIP5, and CORDEX).

4. Results and Discussion

Most studies conducted in Africa used the validation of a large climate model ensemble against gridded data GCPP over the African region. However, there are not many studies that specifically focus on providing a broad overview in South Africa, even though there are existing studies focusing on the Southern African region. This study focuses specifically on South Africa, the country. This study will therefore improve and update previous validation results on temperature and precipitation in South Africa and compare the recent modelling results from different models, such as the high-resolution data versus coarser resolutions. The study focused on validating monthly temperature and precipitation simulated by the selected GCMs (from CMIP5 and CMIP6) and RCMs (from CORDEX) against CRU gridded data, during the reference period from 1981 to 2000.
The results demonstrate wide variations between the data sets. However, it was observed that the CORDEX and CMIP6 models used in this study had improvements on the CMIP5.

4.1. Mean Temperature Bias Patterns and Model Output Patterns

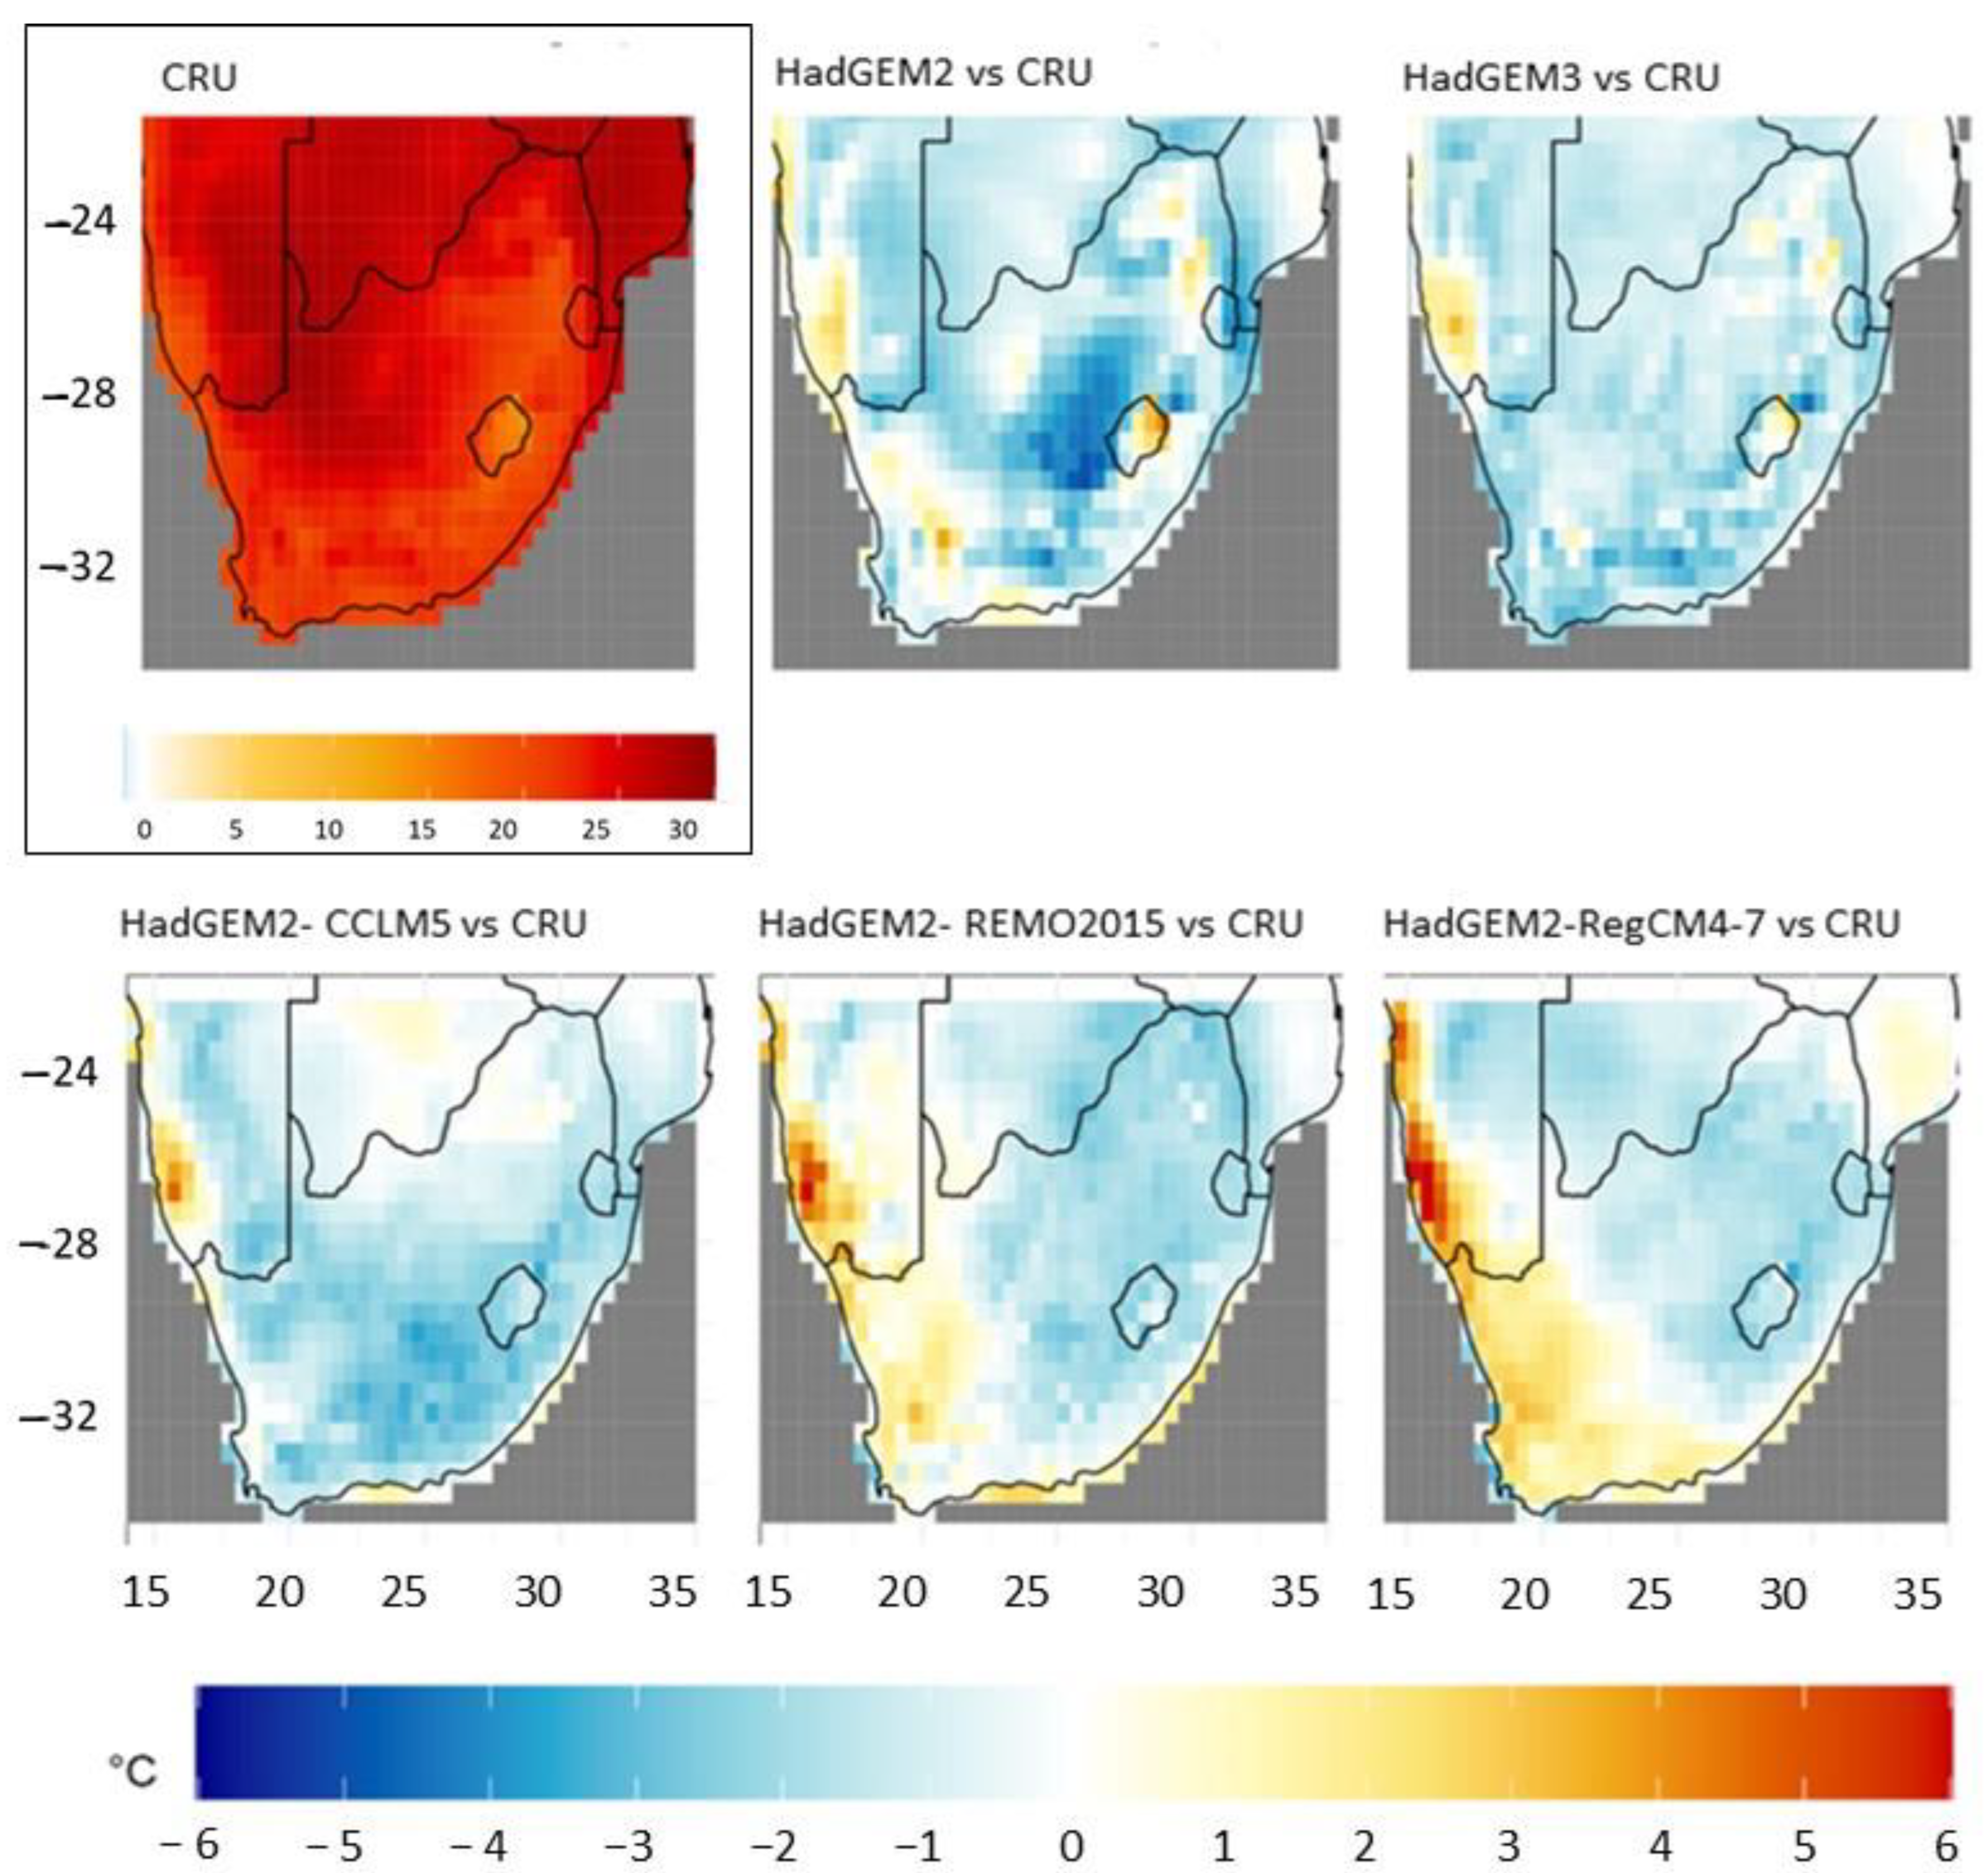
CMIP5 HadGEM2 generally underestimates temperature across the interior regions throughout the year, with largest negative biases in summer, DJF (3–5 °C) (Figure 2), and moderate biases in winter (JJA) (Figures S1–S10). This is consistent with patterns observed over Africa; for example, ref. [26] reported that CMIP5 models underestimate the Indian Ocean Equatorial Undercurrent (EUC) (thus explaining the observed underestimations, as South Africa’s climate is greatly influenced by the Indian ocean [27]). And their spatial distribution of these biases indicates that the topography influenced the accuracy of models, especially over areas of higher elevation, such as the plateau.
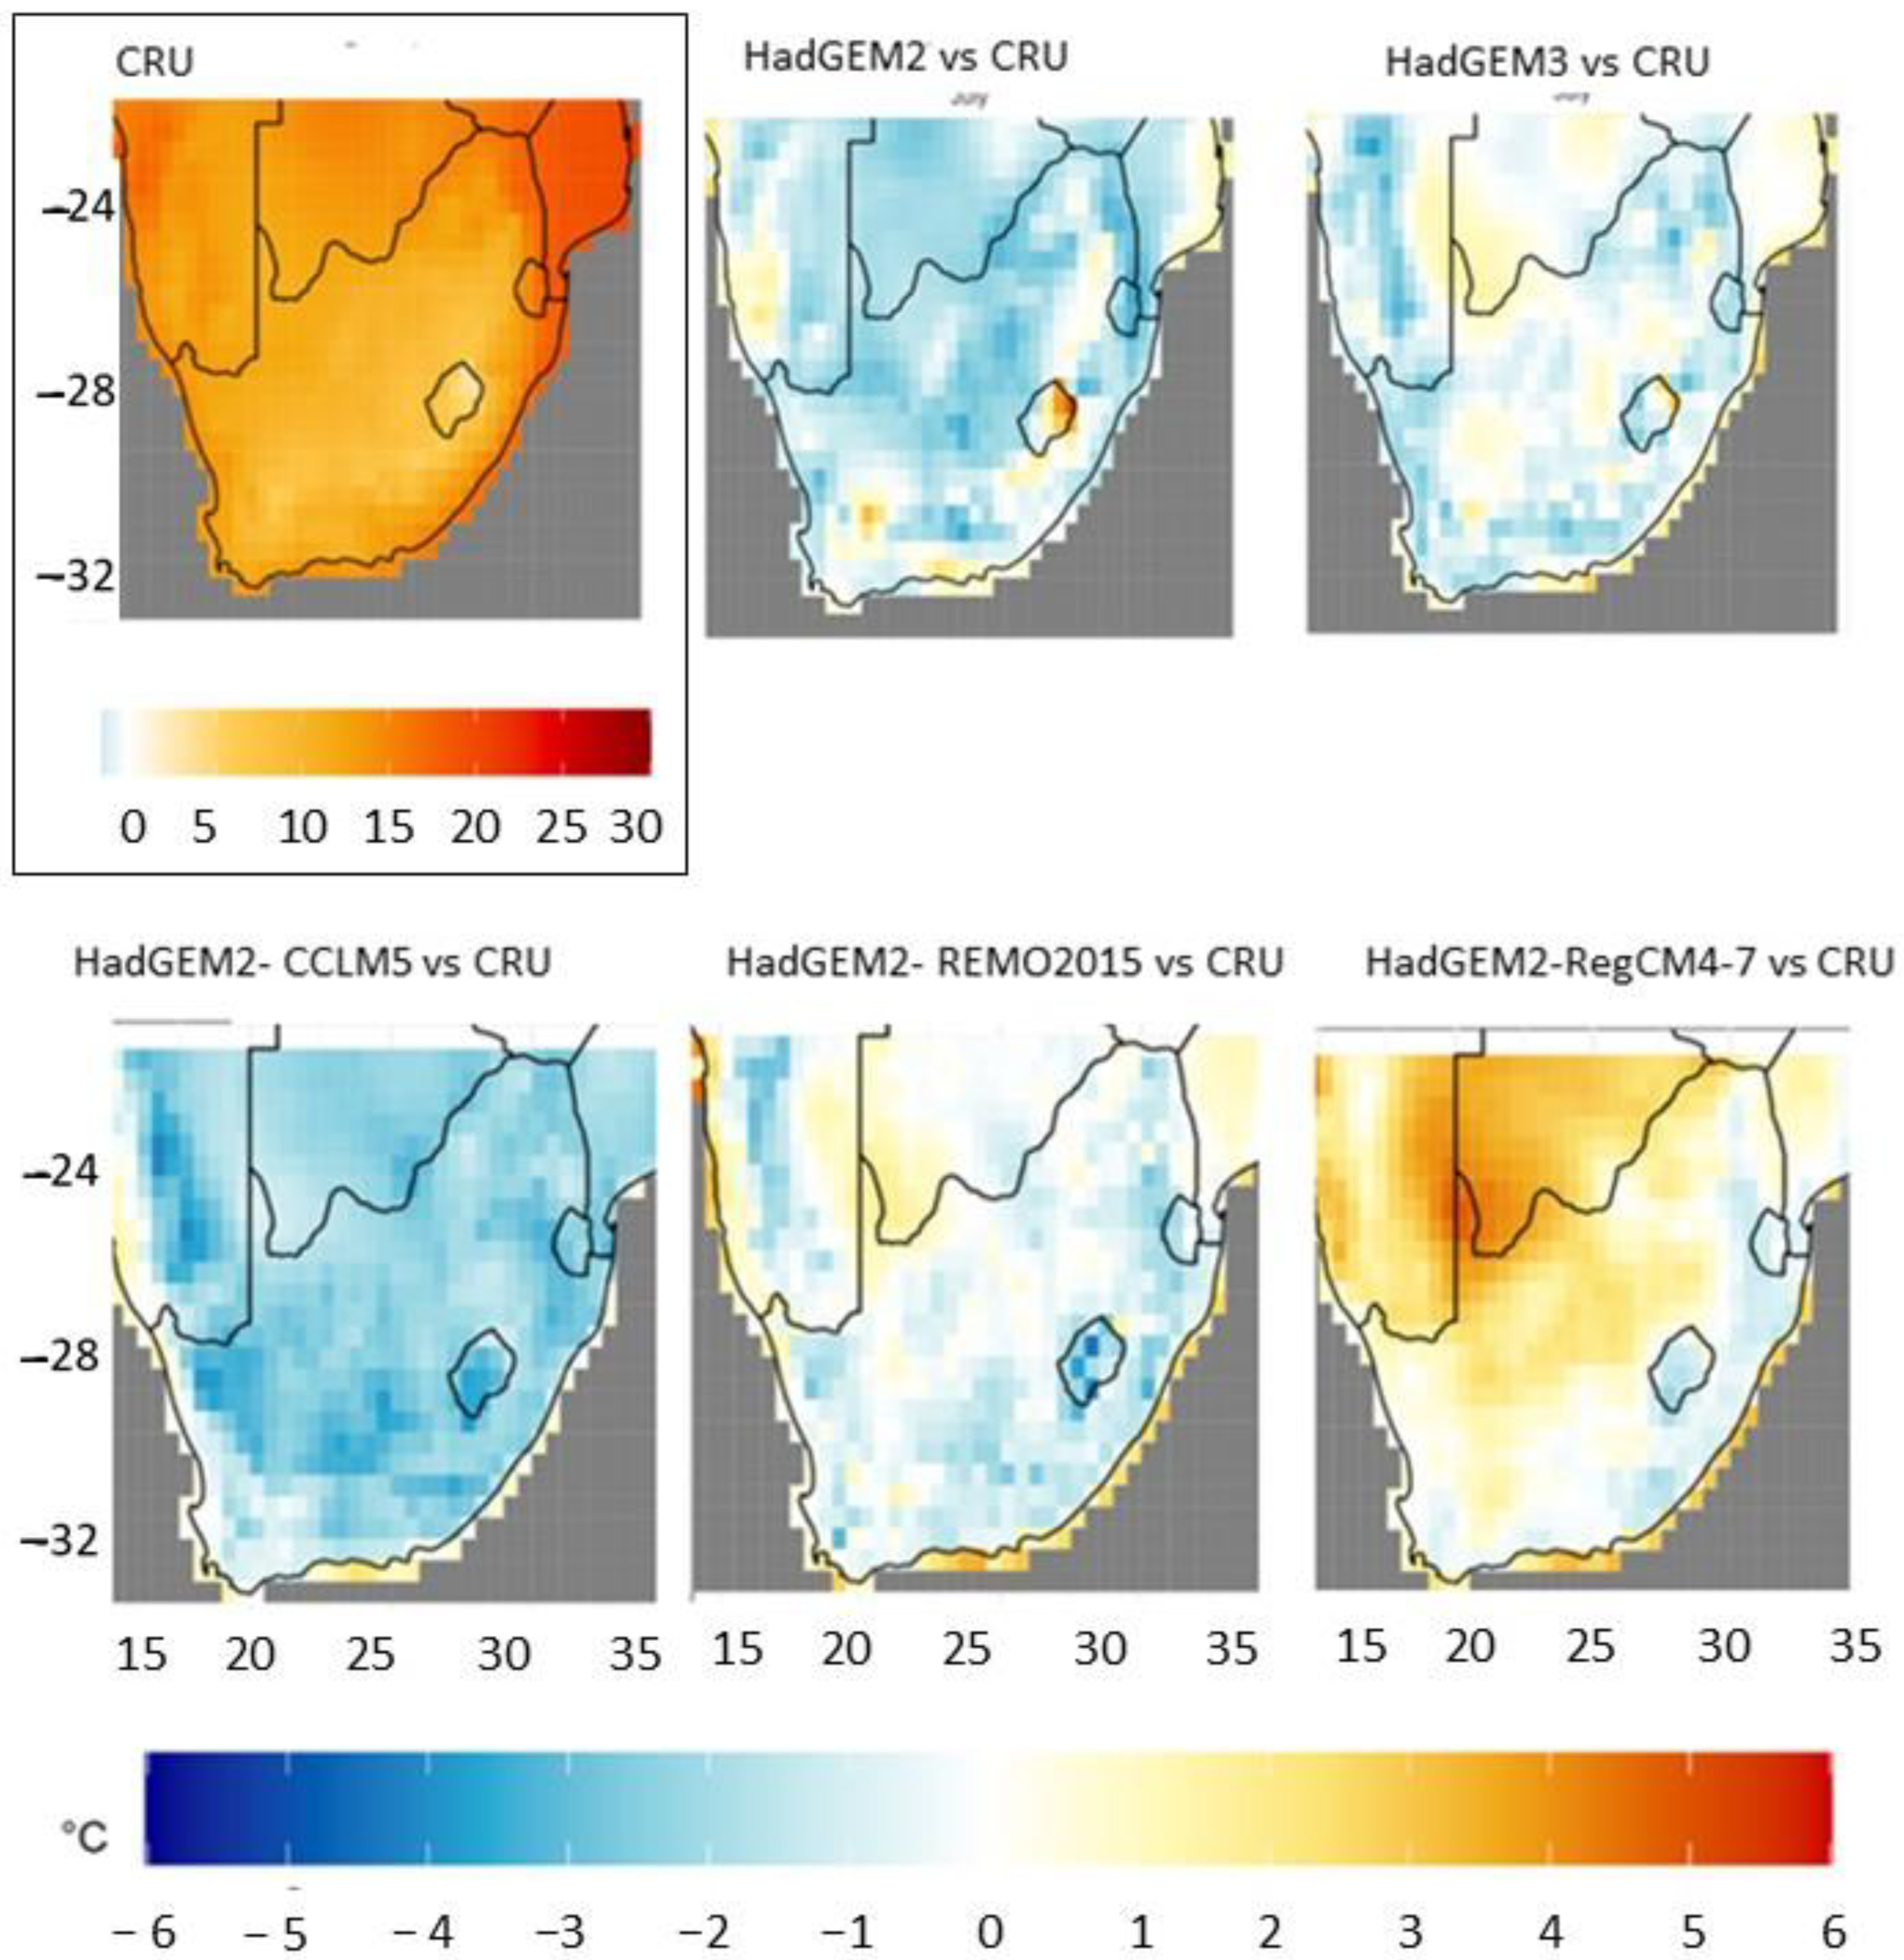
The CORDEX models can capture the overall temperature of the country; however, the models exhibit seasonal variability, wherein differences between the CORDEX and the CRU datasets observed in this study highlight the importance of model selection for seasonal analysis due to variable performance, especially over complex topographic regions (Figure 3). For instance, HadGEM2-CCLM5 accurately reproduces the observed temperatures across the Western Cape during the winter half of the year (March to August), while the other parts of the country are moderately underestimated (1–2 °C). The largest underestimations occur in SON, by 3–5 °C. The HadGEM2-REMO2015 exhibits an overestimation (1–3 °C) over Limpopo, Gauteng, Mpumalanga, North West and parts of KwaZulu-Natal (KZN), but underestimates temperature by 2–3 °C over the southern provinces in November. HadGEM2-RegCM4-7 generally overestimates temperature (3–4 °C) from May to October over the western parts of Northern Cape and Western Cape, Free State and major parts of North West, with decreasing biases (2–3 °C) during colder months in Western Cape and Eastern Cape. The model exhibits better performance in Free State and North West during the summer months, but tends to overestimate the northern parts of the country, indicating a variable performance in CORDEX models, depending on their GCM-RCM pairs.
Our results indicate that MPI-ESM-driven CORDEX models overestimate temperature by 2–3 °C over Limpopo, North West and Free State during warm months of October, November and December. Parts of the Western Cape are overestimated (2–4 °C) from January to April (Figure S5). The MPI-ESM-CCLM5 and MPI-ESM-driven RegCM4-7 accurately reproduces temperature over the Western Cape, with underestimations observed during hot months (November to February). However, the MPI-ESM REMO2015 model exhibits a good performance during the winter, with slight overestimation of 1–2 °C over some parts of the interior in June and July. The NorESM1 models exhibit the highest biases, underestimating temperature in JJA and SON months at different magnitudes. However, an overestimation of the western coast by 1–3 °C is observed from November to October.
On the contrary, overestimations of 5–6 °C occur over the western Free State and eastern Northern Cape, while the Northern Limpopo and the North West exhibit a substantial temperature underestimation (4–5 °C) during December. However, the intensity of the underestimation decreases from May to November by 2–4 °C. This is a systematic error observed in the models, as CORDEX models tend to overestimate the coastline. Other African studies have reported that the CMIP5 has a better ability to reproduce temperature than precipitation [28].
CMIP6 HadGEM3 generally exhibits a good ability to reproduce temperature, with improved correlations, with high accuracy in the interior from February to June, with high accuracy over the Northern Cape, Free State, North West, Gauteng, Limpopo and Mpumalanga in February to June. The models had accurate distribution and exhibited fewer errors. However, regional biases persist in some models; for example, the MPI-ESM1 and NorESM2 tend to overestimate temperature over the interior, indicating that different models’ accuracy may be influenced by variable topography. The modification of the CMIP6 includes an increase in the model’s forcing [29], which may result in CMIP6 having higher projected temperature values. Therefore, the results must be analysed with caution for impact studies
The CMIP6 MPI-ESM1 tend to underestimate temperature by 1–2 °C along the escarpment by 1–2 °C, but accurately capture the interior during cooler months (May to August) (Figure S5). This marks an improvement on the CMIP5, which generally underestimates the interior by 1–4 °C but accurately captures the climatology of the escarpment.
However, the NorESM2 model simulation in CMIP6 tends to overestimate temperature in parts of the Northern Cape and Western Cape by 1–2 °C in MAM. The greatest overestimations are observed in October, over different parts of the interior, wherein NorESM2 simulation within CMIP6 also exhibits temperature overestimation (2–4 °C) over Free State, Gauteng and northern Limpopo, from November to March.

4.2. Statistical Analysis of the Metrics for the Monthly Mean Temperature Fields

Statistical analysis indicates that the CORDEX and CMIP6 models show substantial improvements in reproducing temperature over South Africa compared to the CMIP5, exhibiting lower cRMSEs and stronger correlations with CRU observational data.
A comparison of CORDEX and CMIP5 indicates that CCLM5 models exhibit a generally lower temperature (4–6 °C) over the coastal provinces, with no substantial difference in performance over the Free State, Gauteng and Limpopo in JJA. The RCMs result in an overestimation (1–2 °C) of CMIP5 in January–May. Meanwhile, the REMO2015 model pairs exhibit variable overestimation (1–2 °C) over Free State, North West, Gauteng and Limpopo. The RegCM4-7 pairs exhibit great overestimation (3–4 °C) of the CMIP5, especially over Free State and Northern Cape, with some agreements over the Free State and the northwest in MAM. Meanwhile, the REMO2015 model pairs exhibit higher variability, with overestimation of CMIP6 over the Western Cape and Northern Cape. The RegCM4-7 pairs strongly overestimate CMIP6 by 4–5 °C over the Western Cape from December to September, and overestimate temperature over the eastern part of the interior from May to September.
The evaluation of the results showed that the CORDEX and CMIP6 datasets have substantially improved on the performance of their predecessor, CMIP5. It is observed that the CMIP6 has better spatial representation of temperature trends compared to the CMIP5, Iidicating that biases have been corrected in the recent temperature simulation. However, it should be noted that we have observed different spatial distributions in the case of CMIP6, resulting in variations in model performances, highlighting the fact that CMIP5 still outperforms CMIP6 in terms of SD. However, the CMIP6 exhibit lower cRMSE and correlation.
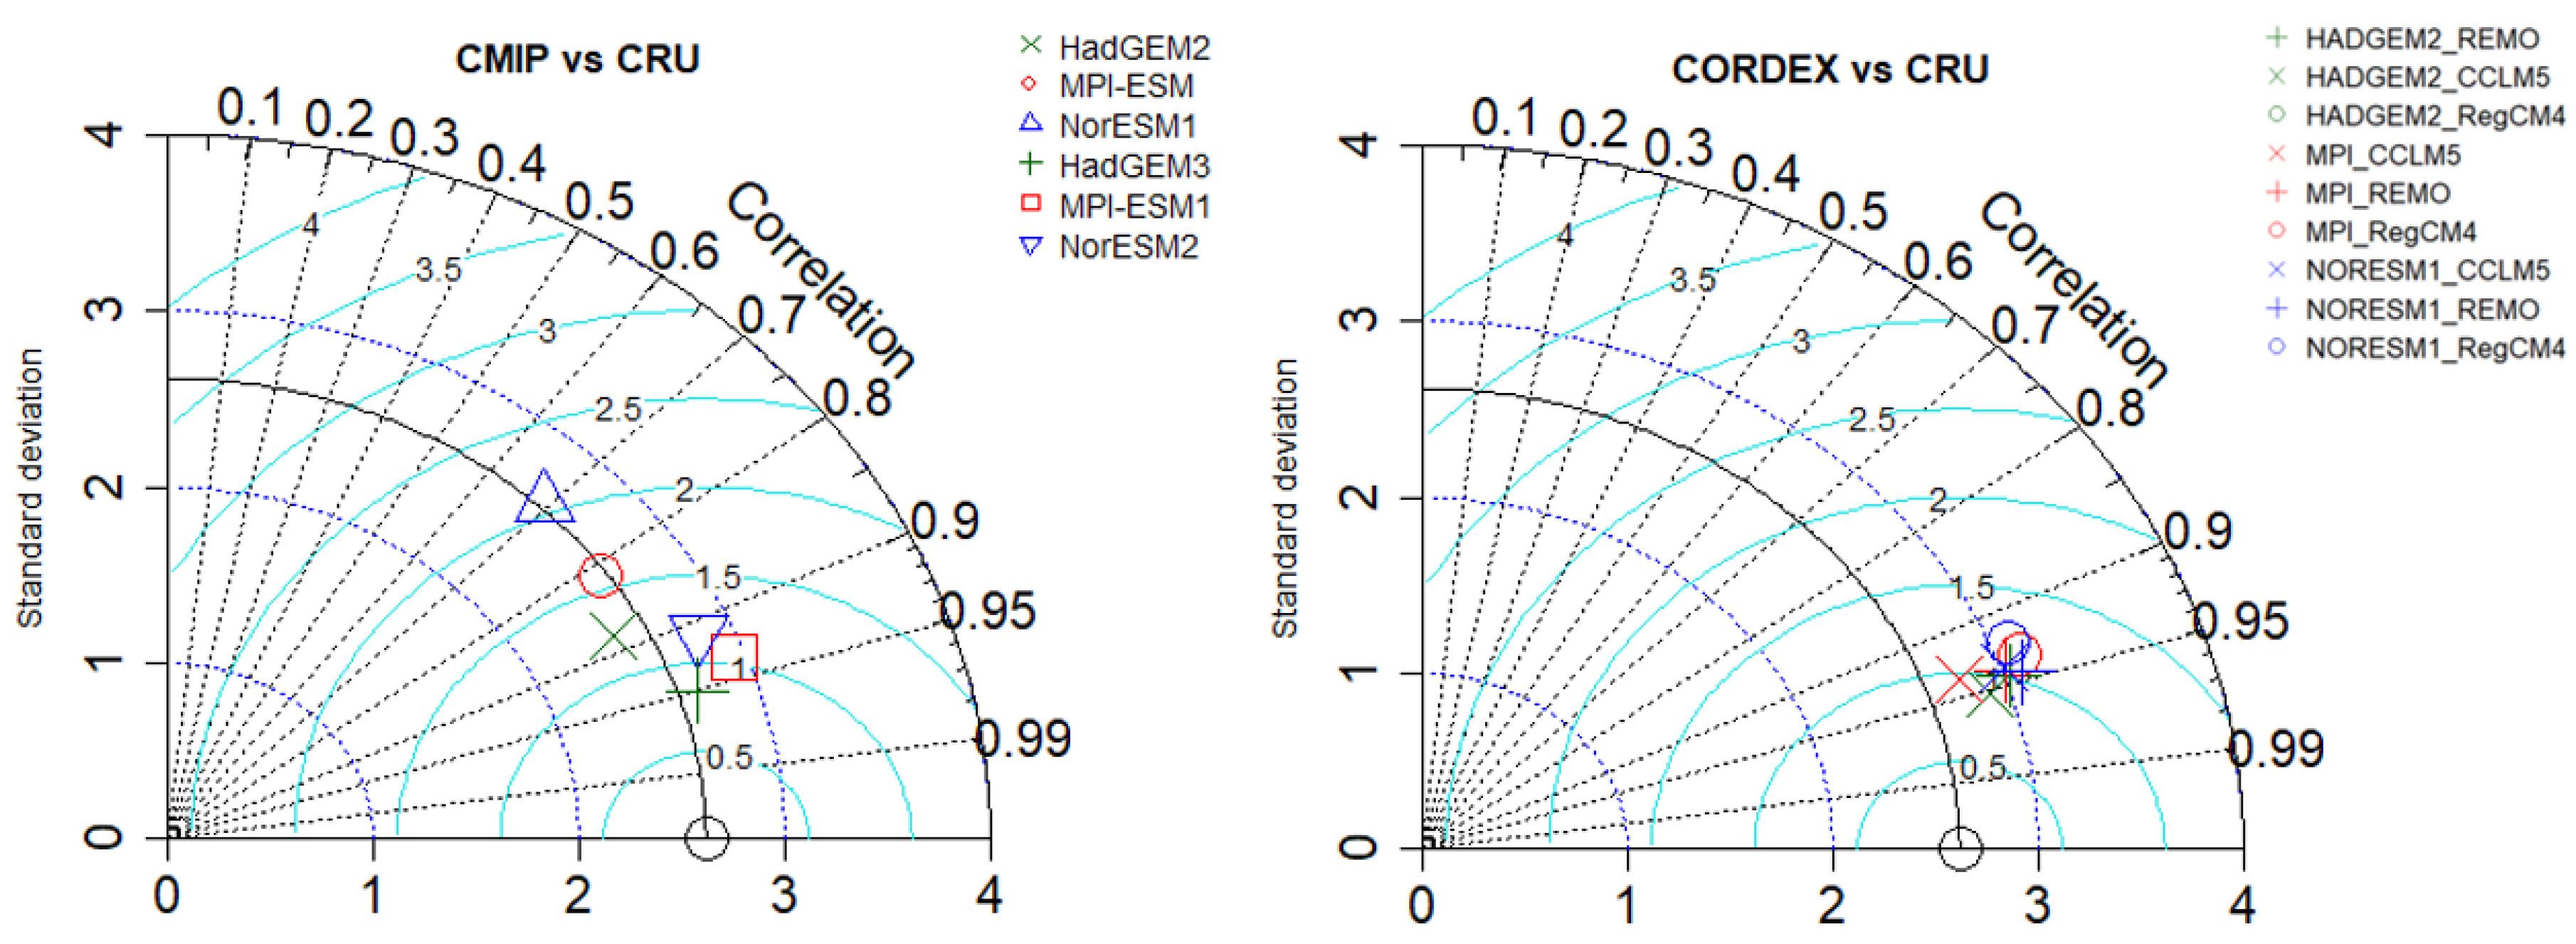
The average historic temperature statistics, cRMSE, r and SD across the models, indicate substantial improvement in the CMIP6’s ability to reproduce overall temperature climatology over South Africa, with the models exhibiting lower cRMSEs and high correlation with the CRU data. Figure 4 illustrates a statistical summary of model performance against CRU data through Taylor diagrams, which depict the models’ ability to better capture temperature variability over the country. CORDEX models exhibit a good ability to reproduce overall temperature over the country, but the models show higher SD compared to CMIP6, indicating persistent biases from CMIP5.
Model simulations from CORDEX-Africa generally exhibit a decrease in cRMSE compared to the driving CMIP5 global simulations (Table 2). More specifically, the HadGEM2-CCLM5 outperforms the CMIP5 HadGEM2 simulations; this is supported by lower cRMSE throughout the year (12 months) and higher correlation with CRU data in CORDEX models compared to CMIP5. However, the HadGEM2-CCLM5 within CORDEX tends to exhibit higher correlation. Meanwhile, HadGEM2-RegCM4-7 exhibits a decrease in cRMSE in 9 of 12 months compared to the driving global model, and only slight changes from February to November. This model pair also resulted in an increase in correlation and SD in all the months, compared to the driving global model. Similarly, NorESM1 and MPI-ESM global models show smaller cRMSE throughout the year, coupled with higher values of linear correlation coefficients and SD.
The evaluation of the results showed that the CORDEX and CMIP6 datasets have substantially improved on the performance of their predecessor, CMIP5. It is observed that the CMIP6 has better spatial representation of temperature trends compared to the CMIP5, indicating that biases have been corrected in the recent temperature simulation. However, it should be noted that we have observed different spatial distributions in the case of CMIP6, resulting in variations in model performances, highlighting the fact that CMIP5 still outperforms CMIP6 in terms of SD. However, the CMIP6 exhibits lower cRMSE and correlation.
CORDEX models generally exhibit higher cRMSE with substantial differences during summer months (DJF) compared to CMIP6 models, with NorESM1-RegCM4 exhibiting the highest cRMSEs during the summer months. Higher SD is observed throughout the year in all models paired with RegCM4 CORDEX simulations, coupled with a lower correlation compared to CMIP6, except for the CCLM5 and REMO2015 model pairs outperforming the CMIP6 in terms of linear correlation in May, June and July. CMIP6 models exhibit variable cRMSE, with insubstantially different correlation compared to the CORDEX models observed (Table 2).
The NorESM1-CCLM5 exhibits lower cRMSE compared to NorESM1-RegCM4-7 and NorESM1-REMO2015, with higher correlation and SDs, whereas in the Northern Cape, NorESM1-RegCM4-7 and NorESM1-REMO2015 perform poorly in terms of cRMSE, correlation and SD, with the RegCM4-7 exhibiting a lower correlation between October and March, June and July, while the REMO2015 has higher correlations than CMIP6 in 10 of 12 months (excluding January and February). The CMIP6 has greatly improved on the CMIP5, exhibiting lower cRMSE and higher correlation. However, CMIP5 still outperforms CMIP6 in terms of SD in all GCMS, with HadGEM3 within CMIP6 indicating lower SD in February as a result of a possible underestimation. The MPI-ESM1 and NorESM2 models exhibit improvements during the summer months. NorESM2 exhibits lower errors.
The models also exhibit a good ability to capture North West in January and February and capture Limpopo, Gauteng, North West and Free State in March and April. HadGEM2 REMO2015 exhibits better performance, indicating model improvement on CMIP5. However, underestimations are exhibited in the eastern parts of the country from November to May. The magnitude of underestimation decreases during cooler/colder months, thus performing better in cooler months over Limpopo, Gauteng, Mpumalanga, North West and parts of KZN. Meanwhile, the RegCM4-7 does not improve the model performance. The downscaling has reduced the intensity/magnitude of underestimation in NorESM1 models. However, it increased the spatial variability/distribution of underestimation in the country, wherein the entire country is underestimated by NorESM1-REMO2015 and MPI-ESM-REMO2015. The NorESM1-RegCM4-7 can better reproduce CRU data during cooler months. The overall mean and variability of CORDEX simulations show more accuracy compared to the CMIP5; this is consistent with previous studies, which have highlighted the improvement of CORDEX models [30]. These results indicate that model performance can vary within a region [12]; therefore, it is important to select the best-performing model in a specific region [31] for climate studies directed toward stakeholders and adaptation strategies.
The results highlight the effect of downscaling, exhibiting improvements in temperature, and therefore indicating substantial progress in model representation of climatology over the African domain. The statistical improvements highlight an enhanced presentation of the regional climatology, including a better ability of the models to capture complex topography and land-surface processes, thus providing accurate data for application in agriculture and water management.
The persistent biases inherent in the CMIP5 over complex topographies highlight a need for continuous model development and downscaling, especially for the African region, to ensure high-resolution models [32]. Indicated orographic effects, especially over the Drakensberg, demonstrate influences on regional climate simulation.

4.3. Analysis of the Monthly Mean Precipitation Bias Maps

Climate models exhibit differences in simulating precipitation across South Africa. With a general increase in precipitation gradient from west to east, CMIP5 models generally overestimate precipitation, with an observed, underestimation over some regions, particularly the southwestern parts of the county (Figures S13–S15). Our results are consistent with other studies that have highlighted that MPI-ESM models overestimate precipitation during the rainy season, the October to November months, in East Africa, highlighting Reference [33]. Meanwhile, some parts of southern Africa show an underestimation of precipitation patterns. This study mainly focuses on the performance of individual models, instead of the seasonal performance of the ensemble mean.
The performance of CMIP5, CORDEX and CMIP6 models varies by season and month. CORDEX simulations can best capture precipitation patterns over the central and eastern parts of the country during summer months, with DJF exhibiting an enhanced ability to capture regional variability and higher resolutions [34]. However, some models show overestimations during the wet season (Figures S1–S15). This aligns with previous studies that highlighted a regional wet bias in CORDEX models over the Southern African region [35]. Other studies have reported that the CCLM5 RCMs tend to underestimate the precipitation [36] over East Africa. The differences in the performance of the CORDEX models data sets mainly stem from the GCMs, highlighting systematic differences and parameterisations [35].
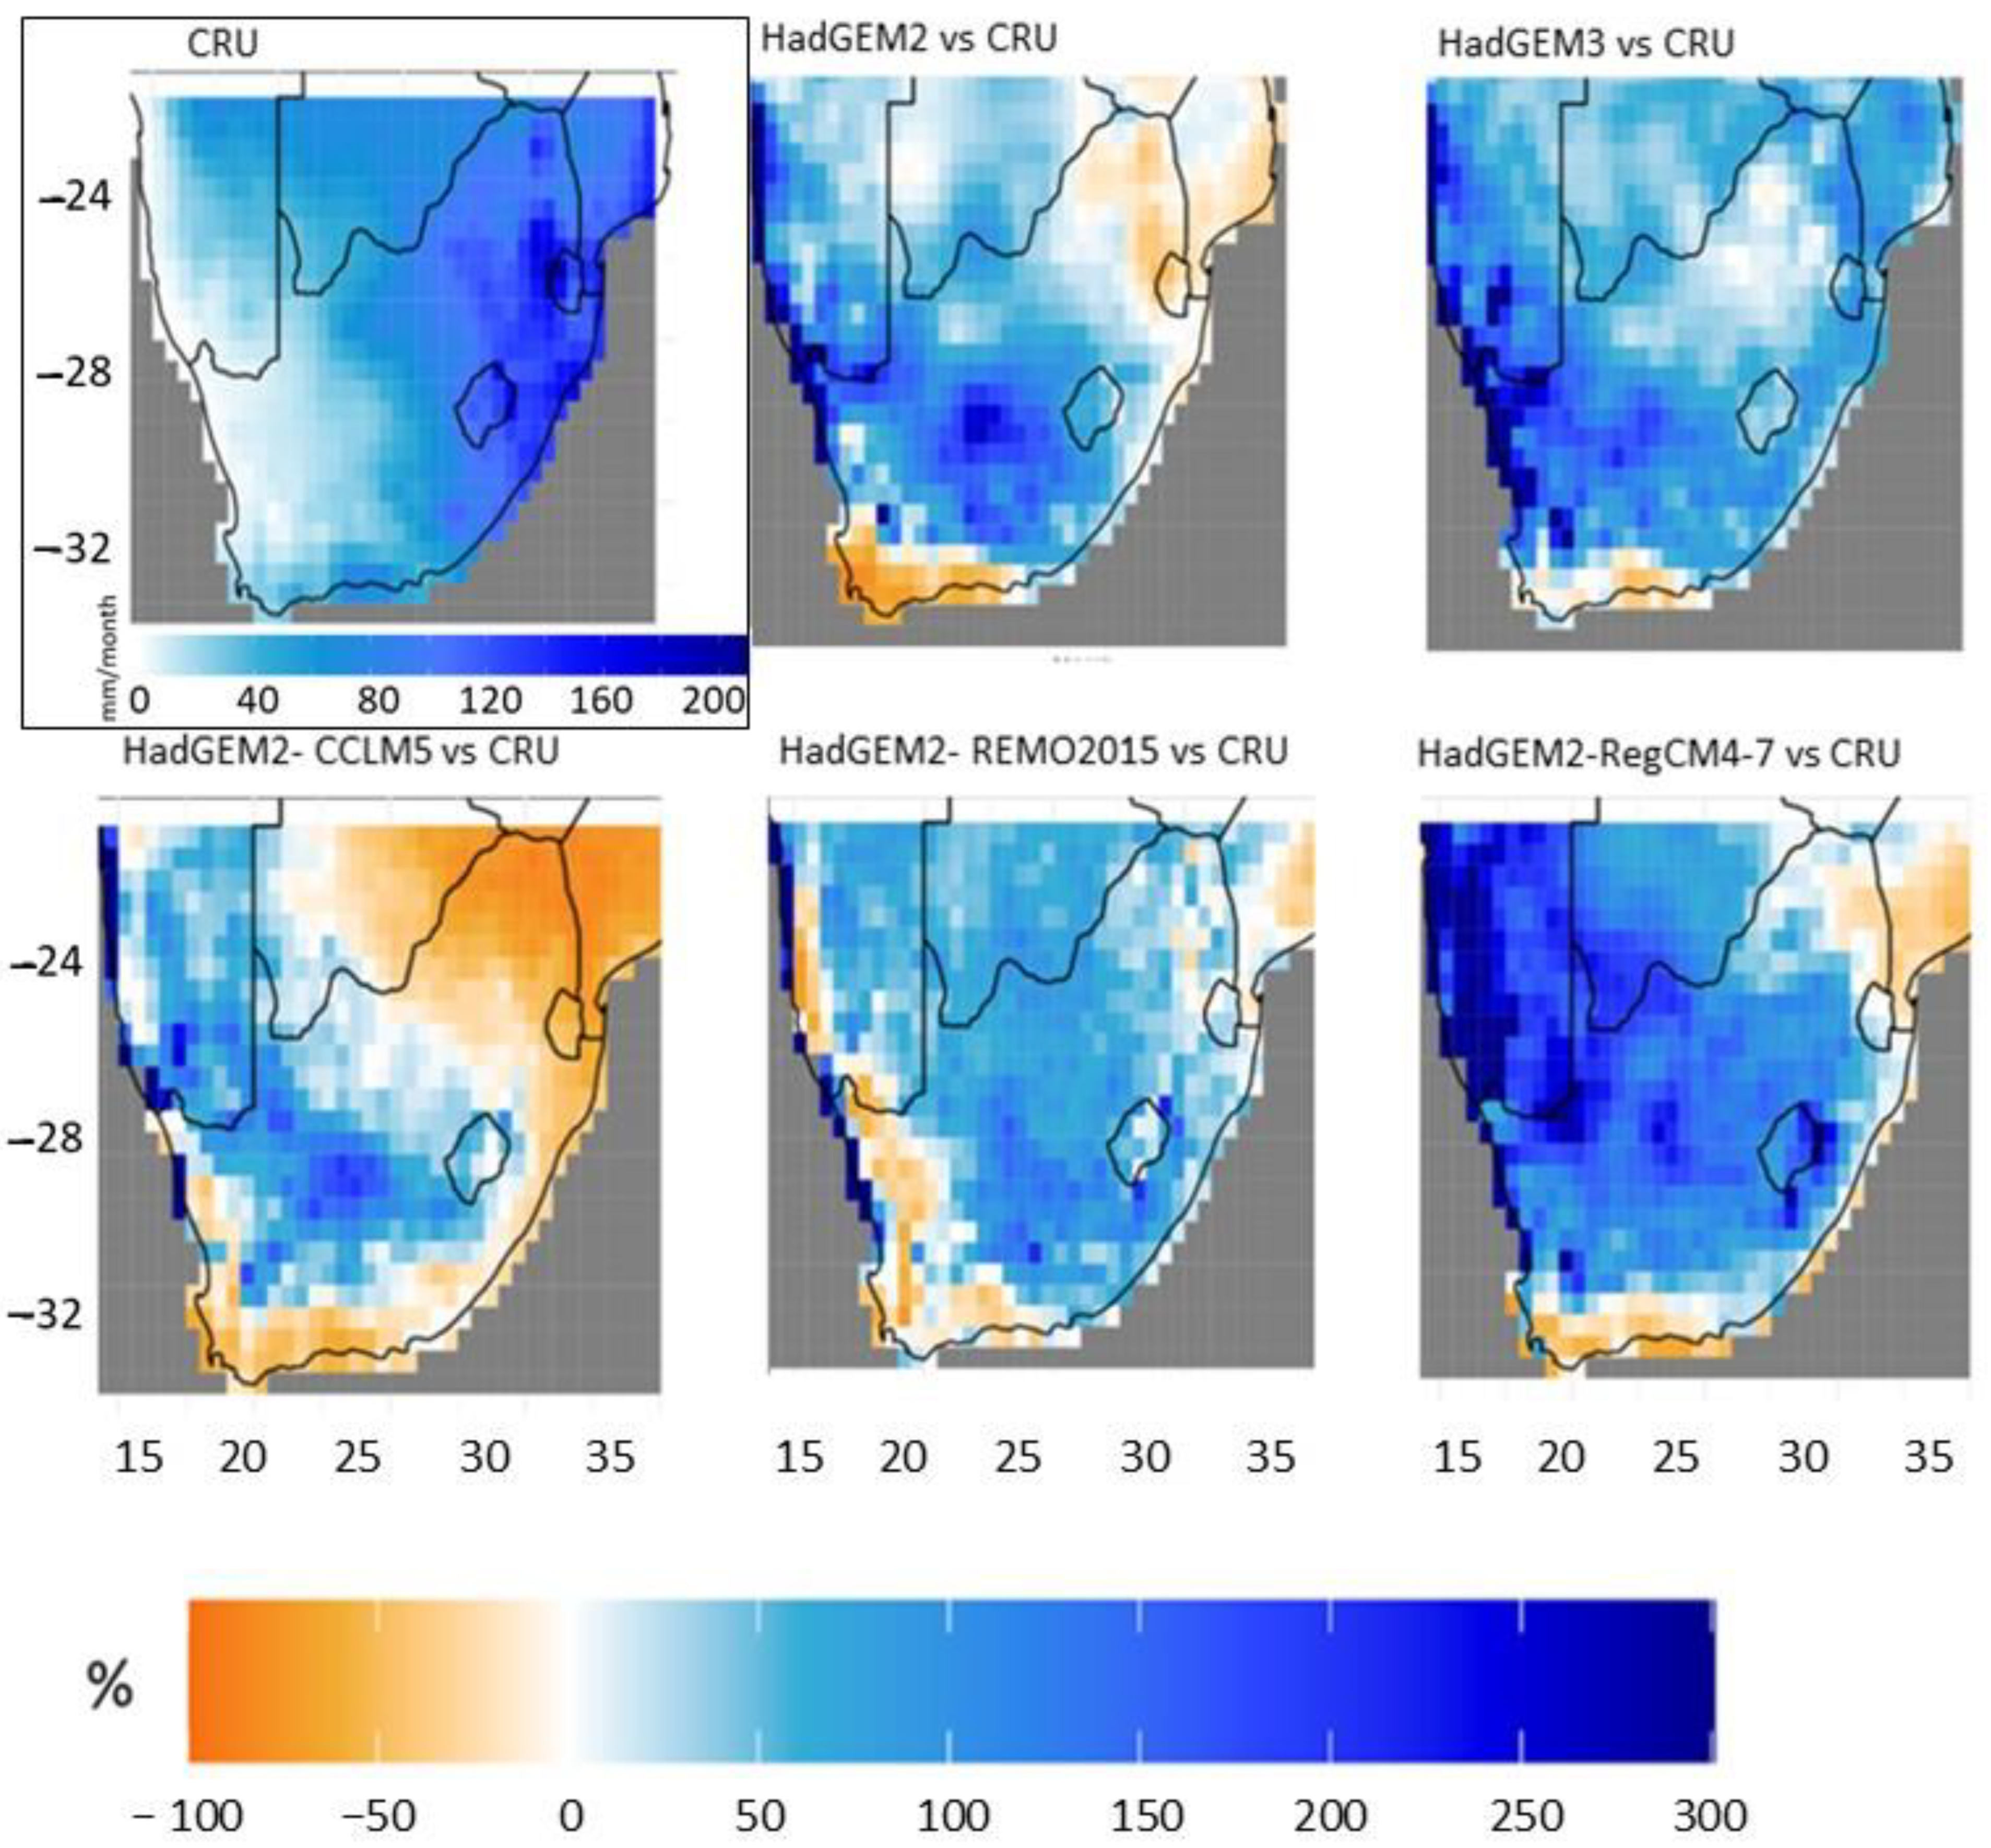
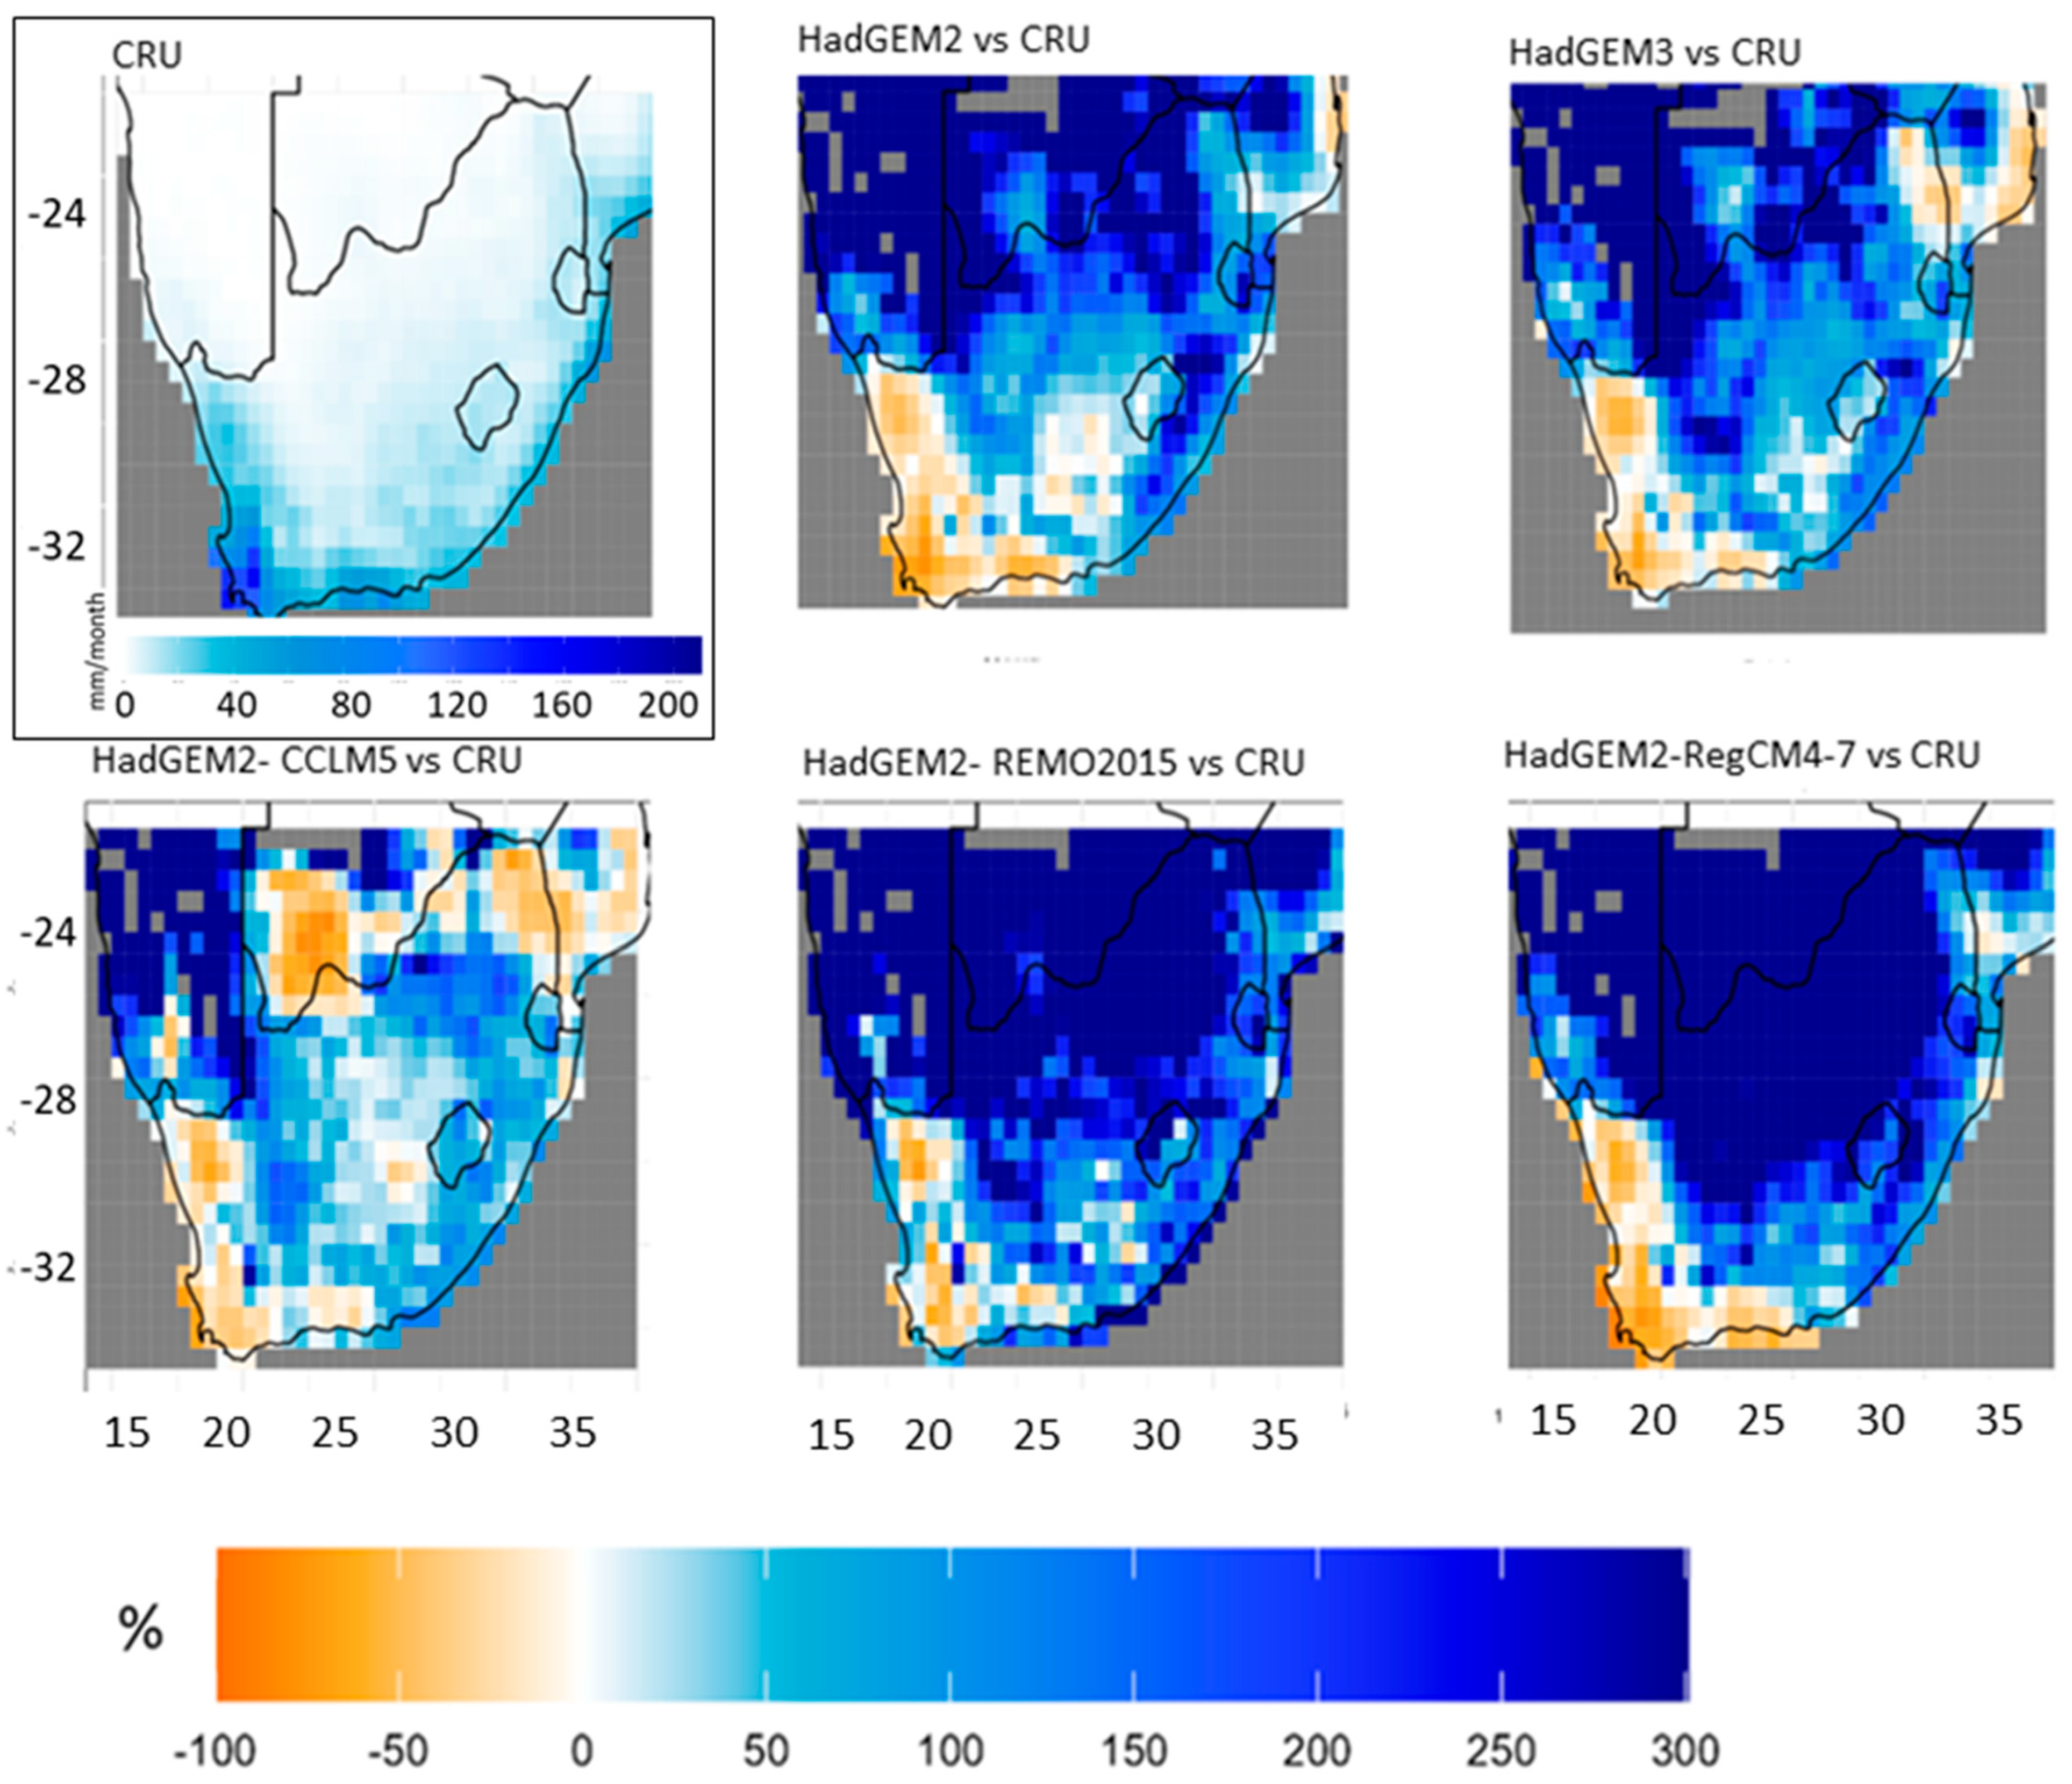
The HadGEM2-REMO2015 from CORDEX-Africa can reproduce the precipitation in JJA better than the other models, while HadGEM2-CCLM5 substantially underestimates precipitation over Limpopo, Mpumalanga and Gauteng, by −50% to −100% in January (Figure 5), February, and March. In contrast, the CMIP models substantially overestimate (200–300%) the western parts of the country, whereas substantial overestimation of precipitation is noted over the interior in Limpopo, Gauteng and Mpumalanga.
HadGEM2-CCLM5 generally outperforms CMIP6 HadGEM3, with agreement noted over the central plateau in April, where precipitation biases are similar. An overestimation of precipitation (by 80–100%) is noted over the southern part of the country. Similar monthly biases are observed in the case of HadGEM2-REMO2015 and CMIP6 HadGEM3 from November to February; however, variability in model performance is observed, with overestimation in the winter half of the year, and an underestimation over the western parts of the country, i.e., the Western Cape, Northern Cape, and parts of the Free State, during the summer half year. The HadGEM2-REMO2015 and HadGEM2-RegCM4-7 exhibit general overestimation (by 50–100%) of precipitation over the southern parts of the Western Cape from October to December. However, the HadGEM2-RegCM4-7 follows a similar series of patterns as the HadGEM3 within the CMIP6 during October to February, exhibiting overestimations in the winter half of the year (as shown for July in Figure 6), whereas the other months can be found in the Supplementary documents (Figures S1–S15).
Both the MPI-ESM from CMIP5 and MPI-ESM1 from CMIP6 underestimate (80–100%) the southwestern coastline in October and November. The CMIP global model simulations generally underestimate precipitation during the winter half of the year (March to August), exhibiting a large overestimation over the interior of the country.
MPI-ESM-driven CCLM5 simulations generally exhibit lower biases than the corresponding global models, both within CMIP5 and CMIP6, with overestimations observed over the Northern Cape, Western Cape, Free State and North West in November and December. However, MPI-ESM-REMO2015 also exhibits an overestimation over the stretch of the western coast and Western Cape compared to the MPI-ESM simulation within CMIP5. MPI-ESM-RegCM4-7 agrees with MPI-ESM of CMIP5 over the interior during November–August; however, the model pair tends to overestimate precipitation patterns in September and October.
The NorESM2 shows a great improvement, with better capacity to reproduce distribution; however, traces of the dry biases observed in CMIP5 over the Western Cape are still observed in all months. For example, the NorESM1-driven RCM simulations within CORDEX-Africa tend to underestimate CRU data; the models exhibit overestimations during the dry season in Limpopo, Gauteng, Mpumalanga and North West, with the NorESM1-REMO2015 showing lower biases over the Northern Cape. However, the model simulations overestimate precipitation over the Western Cape in all months.
In contrast, the NorESM2 (Figure S10) exhibits an underestimation over areas that were previously overestimated by the NorESM1 (Figure S13), indicating a substantial improvement in CMIP6 models (NorESM2) in terms of correcting the overestimation. This GCM is not able to accurately capture the precipitation climatology over southern Africa. A shift from overestimation to underestimation may result in new regional biases, which require careful evaluation of model output. CMIP6 models are valuable in precipitation analysis, due to better accuracy in capturing the annual cycle compared to CMIP5; they can be used for extreme-precipitation event projection [37].

4.4. Statistical Analysis of the Metrics for the Monthly Mean Precipitation Fields

Statistical metrics indicate that the downscaling resulted in a substantial model improvement in model performance, resulting in lower errors. The model performance of CORDEX simulations varies, depending on the RCM and GCM pairs, with the CCLM5 showing higher correlation indication, with approximately 66% overall improvement across all models, indicating improvements in the SD, wherein less variation is observed compared to CMIP5, especially in December to February and September to November. For example, HadGEM2-CCLM5 exhibit higher correlation and a substantial reduction in cRMSE, with the differences ranging from −6.2 to −6.9 in summer, and reduced variability (SD) in most months. Similarly, the MPI-ESM-CCLM5 exhibits a substantial increase in correlation in 9 of 12 months, coupled with a decrease in standard deviation, also noted. The model exhibits a good ability to reproduce historical precipitation patterns, particularly at the peak of the wet season (July), with a low cRMSE of 8.5. Meanwhile, NorESM1-CCLM5 also shows improvements on NorESM1, with a reduced cRMSE in 11 of 12 months and a decrease in standard deviation from August to March. Even with the improved performance in reproducing precipitation, the CCLM5 does exhibit biases in winter (JJA), overestimating SD in model pairs such as MPI-ESM-CCLM5 and NorESM1-CCLM5. The results show that the RCM has the strongest agreement with observational data, with a correlation ranging from 0.5 to 0.8.
On the other hand, REMO2015 models exhibit variable results among model pairs. HadGEM2-REMO2015 shows an increase in correlation during December to March and August, September, and November, suggesting improvements in reproducing deputation events; however, the model exhibits higher cRMSE and SD compared to CMIP5, with overestimations in December and January. Similarly, MPI-ESM-REMO2015 exhibit increases in cRMSE, especially in December, January and April; these are predominantly in the wet season; over the majority of South Africa, despite high variability, the REMO2015 consistently exhibit higher correlations relative to the driving GCM. This indicates that the RCM can capture precipitation patterns more linearly, despite inherent biases from the GCMs [38]. The NorESM1-REMO2015 follows the same trend; however, it exhibits higher cRMSE and SD, compared to the other model pairs.
On the contrary, the RegCM4-7 RCMs exhibit lower performance compared to the other CORDEX model pairs and the driving CMIP5 model, with notable disagreement between the models, where a decrease in correlation is observed, accompanied by increases in cRMSE and SD (Figure 7). A general model disagreement and precipitation biases across different months indicate that that the model pair is not able to accurately capture precipitation patterns over a complex domain. For example, MPI-ESM-RegCM4-7 exhibits a higher cRMSE and a general decrease in correlation in 8 of 12 months, underestimating SD during colder months (May to August), while the NorESM-RegCM4 exhibits the lowest ability to reproduce precipitation, with high cRMSE, especially in December (93.2), coupled with high SD, highlighting the fact that downscaling could not improve the representation of South African precipitation climatology in this model pair.
CMIP6 simulations exhibit statistical improvements on the CMIP5, with substantial reductions in cRMSEs and increased correlations across most months, thus exhibiting reduced overestimation biases. This aligns with other studies, e.g., [39], who have reported that the CMIP6 models had a better ability to reproduce precipitation climatology. However, the models still exhibit some inherent seasonal biases. For example, HadGEM3 exhibited larger errors and low correlation in March and December, respectively. However, the model exhibited a notable decrease in cRMSE and an increase in correlation in 8 of 12 months (e.g., a reduced cRMSE from 29.6 to 25 in December) and overestimations of SD in January to April and June.
The MPI-ESM1 and NorESM2 models exhibit improvements during the summer months, with MPI-ESM1 exhibiting a better ability to reproduce the rainy seasons, exhibitingthe least change in DJF, showing improvement in the case of correlation and cRMSE (e.g., 12.5 in July). The model overestimates precipitation in February and October, while March and November are underestimated. The most notable improvements are observed in NorESM2. The model exhibits lower errors and positive correlation, especially during the summer half of the year; for instance, a significant (48%) reduction, from 65 in CMIP5 to 34 in CMIP6, is observed (Table 3) in December. Despite these improvements, the model persistently shows interannual variability over South Africa. The results indicate that HadGEM is consistently the best-performing model in both model runs. However, some models tend to underestimate precipitation patterns during summer months, while substantial overestimations are noted in different models, between December and August. This is consistent with [40], who reported that CMIP6 models can reproduce the general precipitation climatology over West Africa; however, underestimations were observed during the rainy season. The CMIP6 shows substantial improvement in HadGEM3’s ability to reproduce precipitation climatology in the Western Cape, compared to CMIP5. For example, it was noted that HadGEM3 outperforms HadGEM2 in September, December, January, May, and July, in terms of cRMSE and correlation.
A comparison between CORDEX and CMIP6 indicates that the models have substantially improved from CMIP6. The CMI P6 model exhibits the lowest overall cRMSE and higher correlation with CRU data, especially in summer months. But the CORDEX model passes, especially the CCL M5 RCM pass, often outperforms CMI P6 every month; for example, HadGEM2 CCLM5 has lower cRMSE and SD than CMIP6 in August to December and March. However, this is coupled with a lower correlation, indicating that CMIP6 has a better linear relationship with CRU data. The MPI-CCLM5 outperforms CMIP6 MPI-ESM1, with lower cRMSE and SD in 9 of 12 months, exhibiting higher errors in winter (JJA). The model also has a higher correlation in 11 of 12 months. However, the model exhibits a great underestimation of the SD data in September to November and April. This highlights an improvement in the ability of the CMIP GCMS to reproduce precipitation over South Africa, especially during the JJA (rainy season) in the Western Cape, which can capture the Mediterranean climate. Although the CMIP6 model has advanced physical processes which contribute to its improved performance [41], their ability to reproduce precipitation climatology is still hindered by some parameterizations. Therefore, they may not be perfect [9] for some regional studies, as they tend to underperform against CORDEX models during the wet season, highlighting their importance in regional precipitation analysis. Therefore, CORDEX models are recommended for studies over complex topographic regions, as they may provide accurate insights into local climate adaptation and mitigation studies.

4.5. Limitations

This study had limitations that should be considered when interpreting the results; the model evaluation employed one observational dataset (CRU), which may result in uncertainties, especially over the regions without sufficient station data. Additionally, the study evaluated the individual models against statistical matrices, excluding more advanced methodologies such as trend analysis, extreme indices and ensemble means. Future studies should address these limitations through the use of multiple observational data sets and the evaluation of more climate model ensembles.

5. Conclusions

This study evaluated the performance of CMIP5, CMIP6 and CORDEX model outputs in reproducing temperature and precipitation climatology over South Africa during the historic period 1981–2000, using gridded observational data from CRU. Our findings indicate that CORDEX and CMIP6 model outputs indicate substantial improvements on their predecessors, with CMIP6 model outputs outperforming CMIP5. The models exhibited lower cRMSE, higher correlation and less bias in both temperature and precipitation. Despite observed improvements, the models showed biases in precipitation climatology. The results show that CORDEX model outputs exhibit better ability in capturing regional climate variability, especially over the complex topographies of South Africa. This is attributed to their finer resolution and model setup. Therefore, CORDEX model simulations are more preferable for regional studies, due to their ability to capture local climate. This study highlights the importance of model selection and the use of multiple model outputs in climate projection studies. Future studies should focus on the understanding of the underlying mechanisms that cause persistent biases, especially over complex topographies, and further employ multi-model ensemble approaches and bias correction for more robust results that will inform decision-making.

Supplementary Materials

The following supporting information can be downloaded at: https://www.mdpi.com/article/10.3390/atmos16101200/s1, Figure S1: Monthly mean bias maps (expressed as %) in January for the simulations from NorESM1-REMO2015 compared to CRU data during 1981–2000; Figure S2: Monthly mean bias maps (expressed as %) in January for the simulations from NorESM1-RegCM4-7 compared to CRU data during 1981–2000; Figure S3: Monthly mean bias maps (expressed as %) in January for the simulations from NorESM1-CCLM5 compared to CRU data during 1981–2000; Figure S4: Monthly mean bias maps (expressed as %) in January for the simulations from MPI-ESM-REMO2015 compared to CRU data during 1981–2000; Figure S5: Monthly mean bias maps (expressed as %) in January for the simulations from MPI-ESM1-RegCM4-7 compared to CRU data during 1981–2000; Figure S6: Monthly mean bias maps (expressed as %) in January for the simulations from MPI-ESM1-CCLM5 compared to CRU data during 1981–2000; Figure S7: Monthly mean bias maps (expressed as %) in January for the simulations from HadGEM2-REMO2015 compared to CRU data during 1981–2000; Figure S8: Monthly mean bias maps (expressed as %) in January for the simulations from HadGEM2-RegCM4-7 compared to CRU data during 1981–2000; Figure S9: Monthly mean bias maps (expressed as %) in January for the simulations from HadGEM2-CCLM5 compared to CRU data during 1981–2000; Figure S10: Monthly mean bias maps (expressed as %) in January for the simulations from NorESM2 compared to CRU data during 1981–2000; Figure S11: Monthly mean bias maps (expressed as %) in January for the simulations from MPI-ESM1 compared to CRU data during 1981–2000; Figure S12: Monthly mean bias maps (expressed as %) in January for the simulations from HadGEM3 compared to CRU data during 1981–2000; Figure S13: Monthly mean bias maps (expressed as %) in January for the simulations from NorESM1 compared to CRU data during 1981–2000.

Author Contributions

All authors contributed to the manuscript. Specific contributor roles: conceptualisation, R.P.; methodology, H.C. and R.P.; software, H.C. and R.P.; formal analysis, H.C.; investigation, H.C. and R.P.; resources, R.P.; data curation, H.C. and R.P.; writing—original draft preparation, H.C.; writing—review and editing, H.C. and R.P.; visualisation, H.C. and R.P.; supervision, R.P.; funding acquisition, H.C. and R.P. All authors have read and agreed to the published version of the manuscript.

Funding

Research leading to this study has been supported by the Hungarian National Research, Development and Innovation Fund (under grant K-129162). This work has been implemented by the National Multidisciplinary Laboratory for Climate Change (RRF-2.3.1-21-2022-00014) project within the framework of Hungary’s National Recovery and Resilience Plan supported by the Recovery and Resilience Facility of the European Union. Ph.D. studies of Helga Chauke are supported by the Stidendium Hungaricum.

Institutional Review Board Statement

Not applicable.

Informed Consent Statement

Not applicable.

Data Availability Statement

The datasets analysed during the current study are available from the CORDEX-Africa simulations database.

Conflicts of Interest

The authors declare no conflicts of interest.

References

  1. Voldoire, A. Climate models. Comptes Rendus Mec. 2022, 350, 219–232. [Google Scholar] [CrossRef]
  2. Tapiador, F.J. Validation of Climate Models. In Satellite Precipitation Measurement; Levizzani, V., Kidd, C., Kirschbaum, D., Kummerow, C., Nakamura, K., Turk, F., Eds.; Springer: Cham, Switzerland, 2020; Volume 69. [Google Scholar] [CrossRef]
  3. Hewer, M.J.; Beech, N.; Gough, W.A. Development and validation of the Climate Model Confidence Index (CMCI): Measuring ability to reproduce historical climate conditions. Theor. Appl. Clim. 2021, 144, 1059–1075. [Google Scholar] [CrossRef]
  4. Dosio, A.; Jury, M.W.; Almazroui, M.; Ashfaq, M.; Diallo, I.; Engelbrecht, F.A.; Klutse, N.A.B.; Lennard, C.; Pinto, I.; Sylla, M.B.; et al. Projected future daily characteristics of African precipitation based on global (CMIP5, CMIP6) and regional (CORDEX, CORDEX-CORE) climate models. Clim. Dyn. 2021, 57, 3135–3158. [Google Scholar] [CrossRef]
  5. Gyamfi, C.; Tindan, J.Z.-O.; Kifanyi, G.E. Evaluation of CORDEX Africa multi-model precipitation simulations over the Pra River Basin, Ghana. J. Hydrol. Reg. Stud. 2021, 35, 100815. [Google Scholar] [CrossRef]
  6. Omay, P.O.; Muthama, N.J.; Oludhe, C.; Kinama, J.M.; Artan, G.; Atheru, Z. Evaluation of CMIP6 historical simulations over IGAD region of Eastern Africa. Discov. Environ. 2023, 1, 11. [Google Scholar] [CrossRef]
  7. Harris, I.; Osborn, T.J.; Jones, P.; Lister, D. Version 4 of the CRU TS monthly high-resolution gridded multivariate climate dataset. Sci. Data 2020, 7, 109. [Google Scholar] [CrossRef] [PubMed]
  8. Karypidou, M.C.; Katragkou, E.; Sobolowski, S.P. Precipitation over southern Africa: Is there consensus among global climate models (GCMs), regional climate models (RCMs) and observational data? Geosci. Model Dev. 2022, 15, 3387–3404. [Google Scholar] [CrossRef]
  9. Li, Z.; Liu, T.; Huang, Y.; Peng, J.; Ling, Y. Evaluation of the CMIP6 precipitation simulations over global land. Earth’s Futur. 2022, 10, e2021EF002500. [Google Scholar] [CrossRef]
  10. Doumbia, B.; Adefisan, E.; Omotosho, J.; Thies, B. Evaluation of CMIP5 and CMIP6 performance in simulating West African precipitation. In Digital Technologies and Applications, Proceedings of the International Conference on Digital Technologies and Applications, ICDTA 2023, Fez, Morocco, 27–28 January 2023; Motahhir, S., Bossoufi, B., Eds.; Springer: Cham, Switzerland, 2023; Volume 668. [Google Scholar] [CrossRef]
  11. Babaousmail, H.; Hou, R.; Ayugi, B.; Ojara, M.; Ngoma, H.; Karim, R.; Rajasekar, A.; Ongoma, V. Evaluation of the performance of CMIP6 models in reproducing rainfall patterns over North Africa. Atmosphere 2021, 12, 475. [Google Scholar] [CrossRef]
  12. Gebrehiwot, G.H.; Bekitie, K.T.; Abiko, F.; Seifu, W.; Gebremichael, H.B. Evaluation of CORDEX-Africa model data reliability and bias correction for climate change impact assessment: Upper Tekeze River Basin, Tigray (Ethiopia). Green Low-Carbon Econ. 2024, 1–12. [Google Scholar] [CrossRef]
  13. Ignatov, A. South Africaʼs Just Energy Transition: Issues and Prospects. Int. Organ. Res. J. 2023, 18, 124–146. [Google Scholar] [CrossRef]
  14. Williams, K.D.; Copsey, D.; Blockley, E.W.; Bodas-Salcedo, A.; Calvert, D.; Comer, R.; Davis, P.; Graham, T.; Hewitt, H.T.; Hill, R.; et al. The Met Office Global Coupled Model 3.0 and 3.1 (GC3.0 and GC3.1) configurations. J. Adv. Model. Earth Syst. 2017, 10, 357–380. [Google Scholar] [CrossRef]
  15. Collins, W.J.; Bellouin, N.; Doutriaux-Boucher, M.; Gedney, N.; Halloran, P.; Hinton, T.; Hughes, J.; Jones, C.D.; Joshi, M.; Liddicoat, S.; et al. Development and evaluation of an Earth-System model—HadGEM2. Geosci. Model Dev. 2011, 4, 1051–1075. [Google Scholar] [CrossRef]
  16. Müller, W.A.; Jungclaus, J.H.; Mauritsen, T.; Baehr, J.; Bittner, M.; Budich, R.; Bunzel, F.; Esch, M.; Ghosh, R.; Haak, H.; et al. A higher-resolution version of the Max Planck Institute Earth System Model (MPI-ESM1.2-HR). J. Adv. Model. Earth Syst. 2018, 10, 1383–1413. [Google Scholar] [CrossRef]
  17. Giorgetta, M.A.; Jungclaus, J.; Reick, C.H.; Legutke, S.; Bader, J.; Böttinger, M.; Brovkin, V.; Crueger, T.; Esch, M.; Fieg, K.; et al. Climate and carbon cycle changes from 1850 to 2100 in MPI-ESM simulations for the Coupled Model Intercomparison Project phase 5. J. Adv. Model. Earth Syst. 2013, 5, 572–597. [Google Scholar] [CrossRef]
  18. Seland, Ø.; Bentsen, M.; Olivié, D.; Toniazzo, T.; Gjermundsen, A.; Graff, L.S.; Debernard, J.B.; Gupta, A.K.; He, Y.-C.; Kirkevåg, A.; et al. Overview of the Norwegian Earth System Model (NorESM2) and key climate response of CMIP6 DECK, historical, and scenario simulations. Geosci. Model Dev. 2020, 13, 6165–6200. [Google Scholar] [CrossRef]
  19. Bentsen, M.; Bethke, I.; Debernard, J.B.; Iversen, T.; Kirkevåg, A.; Seland, Ø.; Drange, H.; Roelandt, C.; Seierstad, I.A.; Hoose, C.; et al. The Norwegian Earth System Model, NorESM1-M—Part 1: Description and basic evaluation of the physical climate. Geosci. Model Dev. 2013, 6, 687–720. [Google Scholar] [CrossRef]
  20. Rockel, B.; Will, A.; Hense, A. The regional climate model COSMO-CLM (CCLM). Meteorol. Z. 2008, 17, 347–348. [Google Scholar] [CrossRef]
  21. Jacob, D.; Petersen, J.; Eggert, B.; Alias, A.; Christensen, O.B.; Bouwer, L.M.; Braun, A.; Colette, A.; Déqué, M.; Georgievski, G.; et al. EURO-CORDEX: New high-resolution climate change projections for European impact research. Reg. Environ. Change 2014, 14, 563–578. [Google Scholar] [CrossRef]
  22. Giorgi, F.; Coppola, E.; Solmon, F.; Mariotti, L.; Sylla, M.B.; Bi, X.; Elguindi, N.; Diro, G.T.; Nair, V.; Giuliani, G.; et al. RegCM4: Model description and preliminary tests over multiple CORDEX domains. Clim. Res. 2012, 52, 7–29. [Google Scholar] [CrossRef]
  23. Adelodun, B.; Ahmad, M.J.; Odey, G.; Adeyi, Q.; Choi, K.S. Performance-based evaluation of cmip5 and cmip6 global climate models and their multi-model ensembles to simulate and project seasonal and annual climate variables in the Chungcheong Region of South Korea. Atmosphere 2023, 14, 1569. [Google Scholar] [CrossRef]
  24. R Core Team. R: A Language and Environment for Statistical Computing; R Foundation for Statistical Computing: Vienna, Austria, 2021; Available online: https://www.R-project.org/ (accessed on 9 June 2024).
  25. Taylor, K.E. Summarizing multiple aspects of model performance in a single diagram. J. Geophys. Res. Atmos. 2001, 106, 7183–7192. [Google Scholar] [CrossRef]
  26. Li, J.; Xu, K.; Wang, W.; He, Z.; Huang, K. Biases and improvements of the boreal winter–spring equatorial undercurrent in the Indian Ocean in the CMIP5 and CMIP6 models. Front. Mar. Sci. 2023, 10, 1168385. [Google Scholar] [CrossRef]
  27. Maccali, J.; Meckler, A.N.; Lauritzen, S.-E.; Brekken, T.; Rokkan, H.A.; Fernandez, A.; Krüger, Y.; Adigun, J.; Affolter, S.; Leuenberger, M. Multi-proxy speleothem-based reconstruction of mid-MIS 3 climate in South Africa. Clim. Past 2023, 19, 1847–1862. [Google Scholar] [CrossRef]
  28. Aloysius, N.R.; Sheffield, J.; Saiers, J.E.; Li, H.; Wood, E.F. Evaluation of historical and future simulations of precipitation and temperature in central Africa from CMIP5 climate models. J. Geophys. Res. Atmos. 2015, 121, 130–152. [Google Scholar] [CrossRef]
  29. Fredriksen, B.; Smith, C.J.; Modak, A.; Rugenstein, M. 21st Century scenario forcing increases more for CMIP6 than CMIP5 models. Geophys. Res. Lett. 2023, 50, e2023GL102916. [Google Scholar] [CrossRef]
  30. Nikiema, P.M.; Sylla, M.B.; Ogunjobi, K.; Kebe, I.; Gibba, P.; Giorgi, F. Multi-model CMIP5 and CORDEX simulations of historical summer temperature and precipitation variabilities over West Africa. Int. J. Clim. 2016, 37, 2438–2450. [Google Scholar] [CrossRef]
  31. Farah, K.H.; Sime, C.H.; Hassen, A.M.; Muhumed, U.M. Assessment of RCA4, CORDEX Africa domains RCMs performance in simulating rainfall and temperature: A case of Gilgal Gibe watershed, Ethiopia. EarthArXiv 2024. [Google Scholar] [CrossRef]
  32. Koseki, S.; Demissie, T. Does the Drakensberg dehydrate southwestern Africa? J. Arid. Environ. 2018, 158, 35–42. [Google Scholar] [CrossRef]
  33. Ongoma, V.; Chen, H.; Gao, C. Evaluation of CMIP5 twentieth century rainfall simulation over the equatorial East Africa. Theor. Appl. Clim. 2019, 135, 893–910. [Google Scholar] [CrossRef]
  34. Samuel, S.; Dosio, A.; Mphale, K.; Faka, D.N.; Wiston, M. Comparison of multimodel ensembles of global and regional climate models projections for extreme precipitation over four major river basins in southern Africa—Assessment of the historical simulations. Clim. Change 2023, 176, 57. [Google Scholar] [CrossRef]
  35. Kalognomou, E.; Lennard, C.; Shongwe, M.; Pinto, I.; Favre, A.; Kent, M.; Hewitson, B.; Dosio, A.; Nikulin, G.; Panitz, H.-J.; et al. A diagnostic evaluation of precipitation in CORDEX models over Southern Africa. J. Clim. 2013, 26, 9477–9506. [Google Scholar] [CrossRef]
  36. Mathewos, Y.; Abate, Y.; Dadi, M. Characterization of the skill of the CORDEX-Africa regional climate models to simulate regional climate setting in the East African Transboundary Omo Gibe River Basin, Ethiopia. Heliyon 2023, 9, e20379. [Google Scholar] [CrossRef]
  37. Kamruzzaman, M.; Wahid, S.; Mainuddin, M.; Chiew, F.; Islam, A.R.M.T.; Hamed, M.M.; Shahid, S. Extreme precipitation projections in South Asia: A step-up from CMIP5 to CMIP6. SSRN 2024. [Google Scholar] [CrossRef]
  38. Bárdossy, A.; Pegram, G. Multiscale spatial recorrelation of RCM precipitation to produce unbiased climate change scenarios over large areas and small. Water Resour. Res. 2012, 48, W09502. [Google Scholar] [CrossRef]
  39. Tao, C.; Xie, S.; Tang, S.; Lee, J.; Ma, H.-Y.; Zhang, C.; Lin, W. Diurnal cycle of precipitation over global monsoon systems in CMIP6 simulations. Clim. Dyn. 2023, 60, 3947–3968. [Google Scholar] [CrossRef]
  40. Ajibola, F.O.; Zhou, B.; Gnitou, G.T.; Onyejuruwa, A. Evaluation of the Performance of CMIP6 HighResMIP on West African Precipitation. Atmosphere 2020, 11, 1053. [Google Scholar] [CrossRef]
  41. John, A.; Douville, H.; Ribes, A.; Yiou, P. Quantifying CMIP6 model uncertainties in extreme precipitation projections. Weather Clim. Extrem. 2022, 36, 100435. [Google Scholar] [CrossRef]
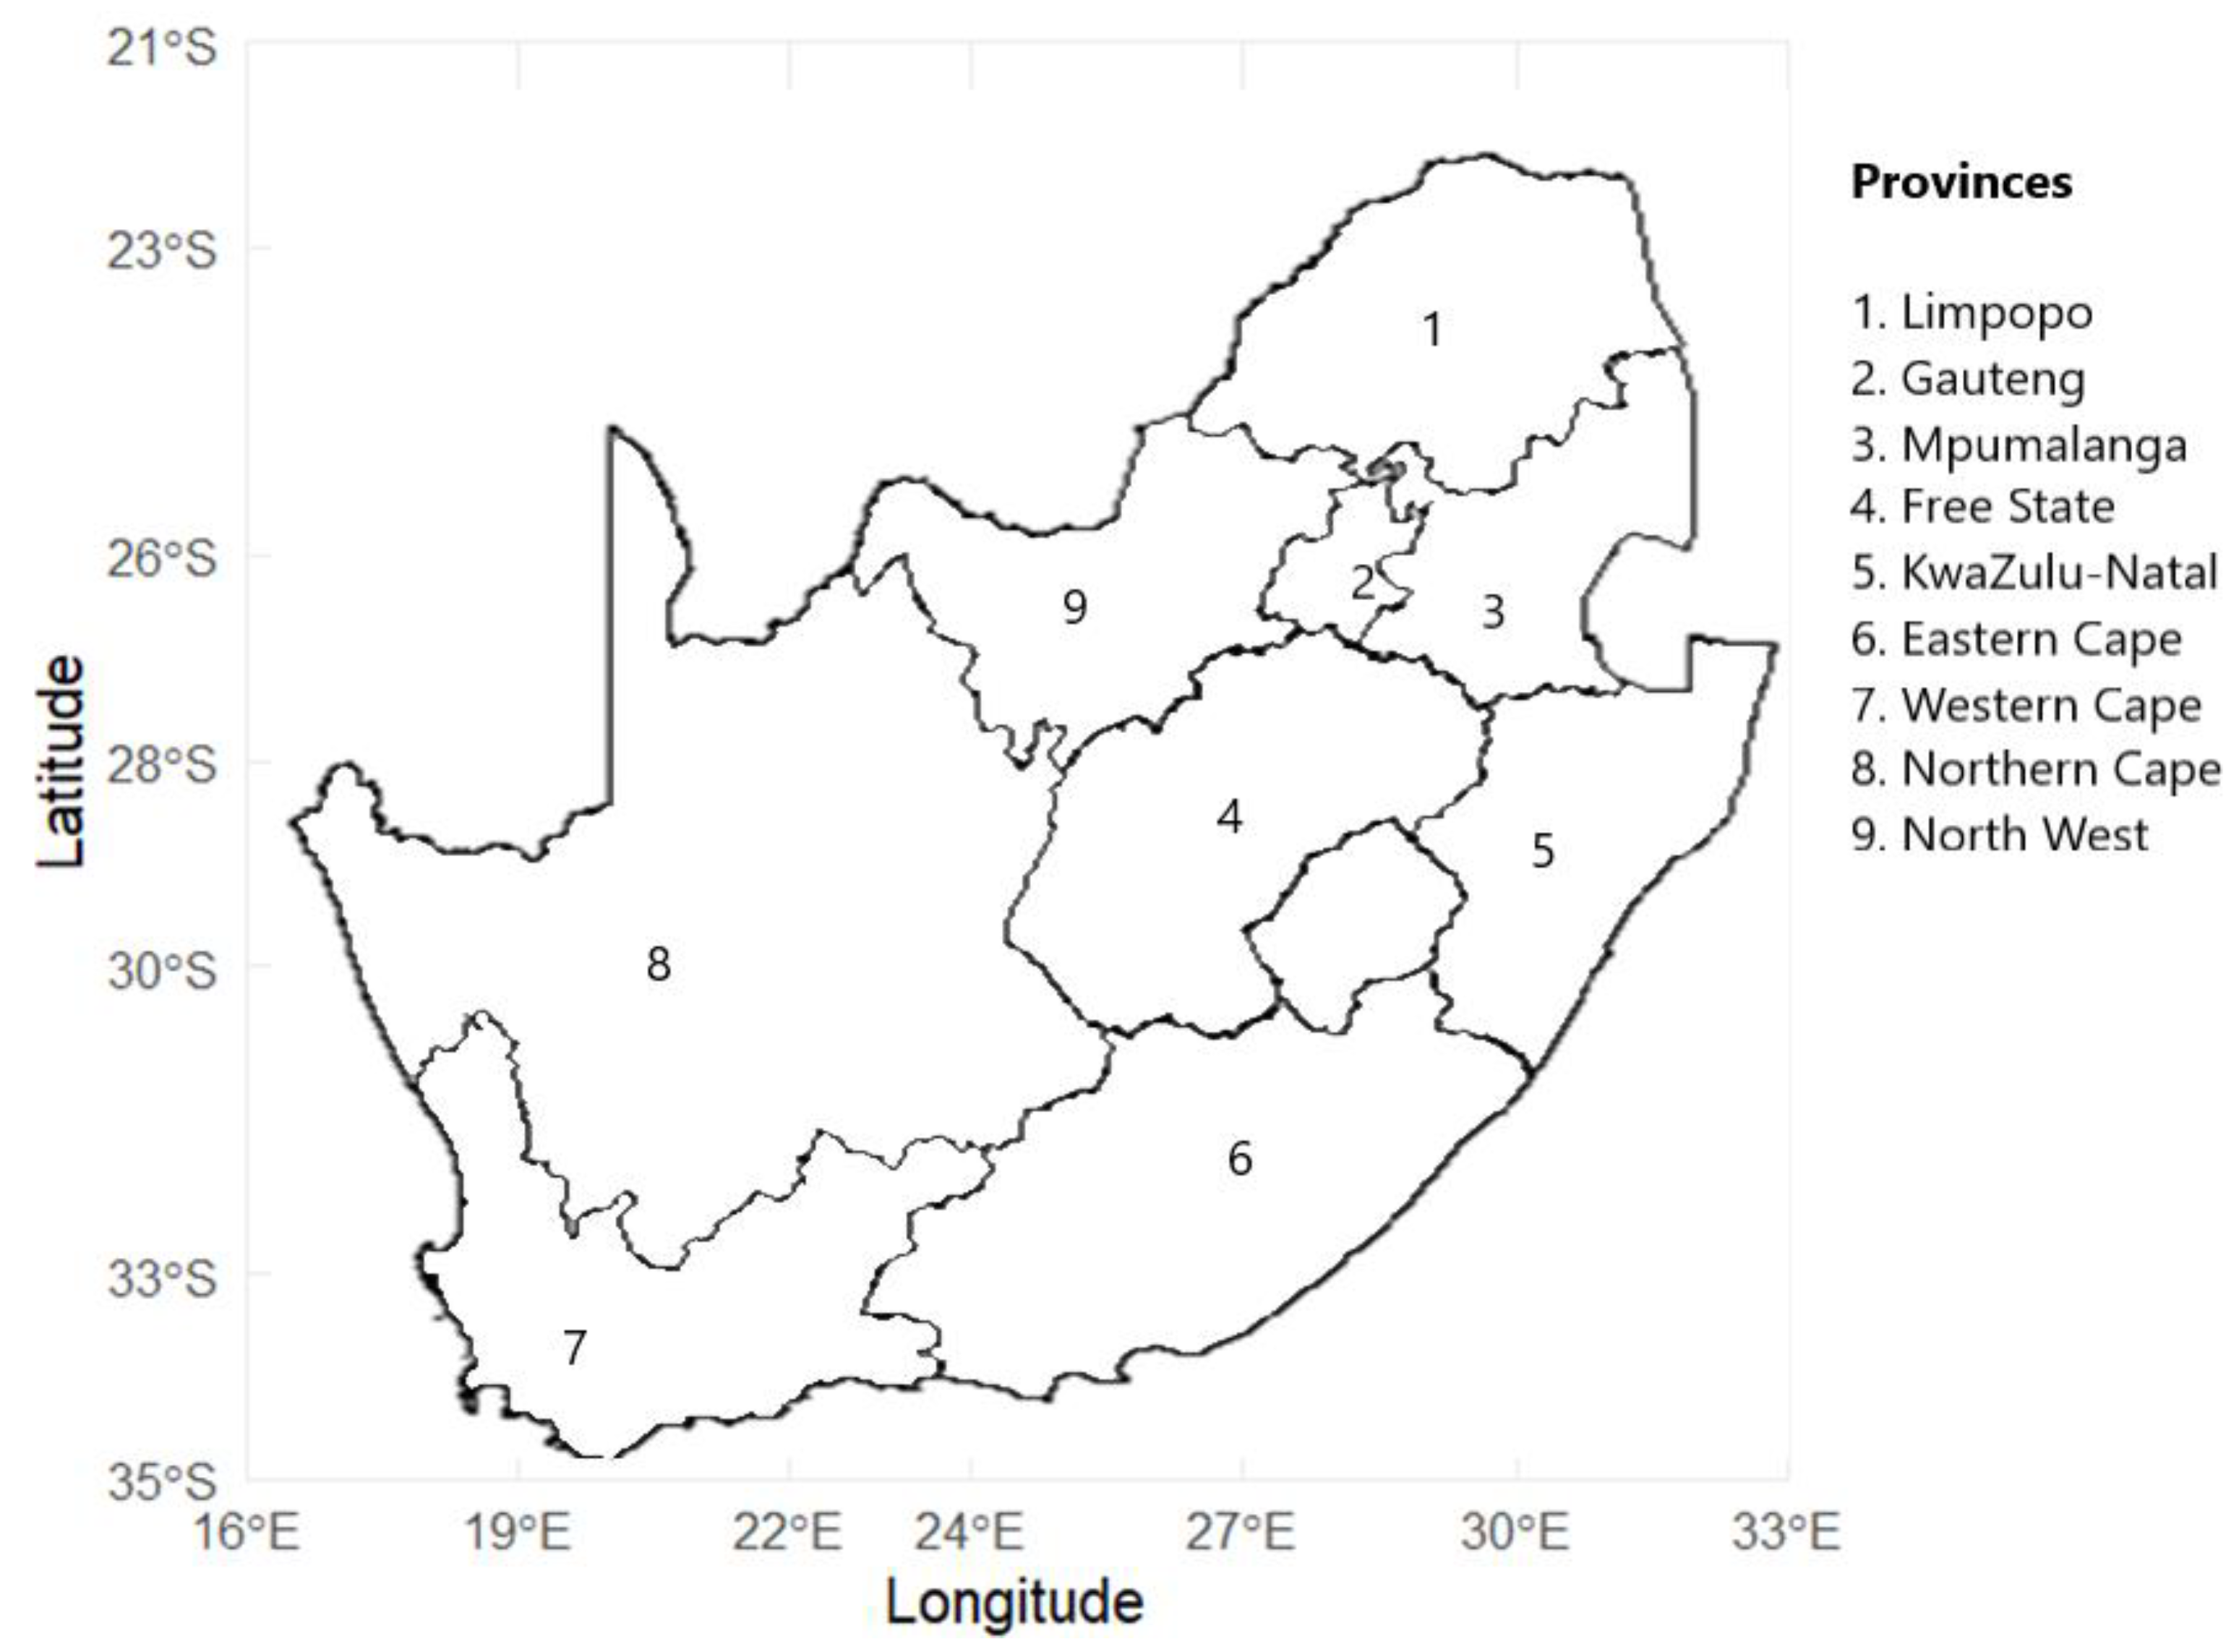
Figure 1. Map of the study area, i.e., South Africa.
Atmosphere 16 01200 g001
Figure 2. Historic temperature (°C) climatology captured by CMIP5 (HadGEM2), CMIP6 (HadGEM3) and CORDEX (the three lower maps) model simulations in comparison to CRU observational data in January (upper left map), over South Africa. Validation maps indicate mean bias values for January, 1981–2000.
Atmosphere 16 01200 g002
Figure 3. Historic temperature (°C) climatology captured by CMIP5 (HadGEM2), CMIP6 (HadGEM3) and CORDEX (the three lower maps) model simulations in comparison to CRU observational data (upper left map) in July, over South Africa. Validation maps indicate mean bias values for July, 1981–2000.
Atmosphere 16 01200 g003
Figure 4. Taylor diagram comparing CMIP (left) and CORDEX (right) model simulations against CRU observational temperature data for 1981–2000.
Atmosphere 16 01200 g004
Figure 5. Historic spatial distribution of precipitation amount (mm/month) during the driest month (January) according to the CRU data (the upper left map), and the monthly mean bias maps (expressed as %) in January, for the simulations from CMIP5 (HadGEM2), CMIP6 (HadGEM3) and HadGEM2-driven RCMs from CORDEX-Africa (in the lower maps), compared to CRU data, 1981–2000.
Atmosphere 16 01200 g005
Figure 6. Historic spatial distribution of precipitation amount (mm/month) during the wettest month (July), according to the CRU data (the upper left map), and the monthly mean bias maps (expressed as %) in July, for the simulations from CMIP5 (HadGEM2), CMIP6 (HadGEM3) and HadGEM2-driven RCMs from CORDEX-Africa (in the lower maps), compared to CRU data, 1981–2000. Although July represents the wettest month in the Western Cape, most models tend to underestimate precipitation across this region.
Atmosphere 16 01200 g006
Figure 7. Taylor diagram comparing CMIP (left) and CORDEX (right) model simulations against CRU observational precipitation data during 1981–2000.
Atmosphere 16 01200 g007
Table 1. Summary of CMIP5 and CMIP6 GCMs and the CORDEX RCMs driven by CMIP5 GCMS.
ModelInstitutionAtmospheric ModelOcean ModelLand-Surface ModelCarbon CycleReference
CMIP6:

HadGEM3-GC31-MM
Met Office Hadley Centre (MOHC)Global Coupled Model 3 (GC3)Nucleus for European Modelling of the Ocean (NEMO)Joint UK Land Environment Simulator (JULES)advanced carbon cycle and biogeochemical processes[14]
CMIP5:

HadGEM2-ES
Hadley Centre Global Environment Model 2HadGEM2-OceanMet Office Surface Exchange Scheme2 (MOSES2)carbon and chemistry[15]
CMIP6:

MPI-ESM1-2-HR
Max Planck Institute for Meteorology (MPI-M)ECHAM6.3MPIOMJSBACH3.2interactive carbon cycle[16]
CMIP5:

MPI-ESM-LR
ECHAM6JSBACH[17]
CMIP6:

NorESM2-MM
Norwegian Climate Centre (NCC)Community Atmosphere Model version 6 (CAM6)Bergen Layered Ocean Model (BLOM)CLM5 (Community Land Model version 5)isopycnic coordinate Hamburg Ocean Carbon Cycle (iHAMOCC)[18]
CMIP5:

NorESM1-M
Community Atmosphere Model version 4 (CAM4)Miami Isopycnic Coordinate Ocean Model (MICOM)CLM4 (Community Land Model version 4)interactive carbon cycle[19]
CORDEX:

CCLM5-0-15

Driven by all three 3 CMIP5 model outputs
Climate Limited-area Modelling Community (CLM-Community)COSMO-CLMN/ATERRA-MLN/A[20]
CORDEX:

REMO201
5
Driven by all three 3 CMIP5 model outputs
Max Planck Institute for Meteorology (MPI-M)REMOBasic surface module (HydroPy)[21]
CORDEX:

RegCM4-7

Driven by all three 3 CMIP5 model outputs
International Centre for Theoretical Physics (ICTP)RegCM4BATS or CLM[22]
Table 2. Summary monthly statistics (cRMSE, r and SD difference) of CMIP5 (left) and CMIP6 (right) model performance against CRU observational data for temperature during 1981–2000. The yellow background highlights the best-performing model simulation, and the green background highlights the second-best-performing model.
CMIP5 CMIP6
Month Model cRMSE Correlation Std_Dev Difference RMSE Correlation Obs_Std_Dev Difference
DecemberHadGEM31.400.87−0.210.970.940.09
DecemberMPI_ESM11.720.810.201.310.930.54
DecemberNorESM22.400.640.021.530.880.41
JanuaryHadGEM31.410.86−0.240.920.940.05
JanuaryMPI_ESM11.960.720.231.210.910.22
JanuaryNorESM22.500.560.131.530.860.22
FebruaryHadGEM31.490.830.000.960.930.02
FebruaryMPI_ESM12.030.680.111.420.850.03
FebruaryNorESM22.350.55−0.181.400.870.26
MarchHadGEM31.390.850.120.950.930.02
MarchMPI_ESM11.980.700.181.430.860.16
MarchNorESM22.270.60−0.191.370.880.28
AprilHadGEM31.390.86−0.150.920.940.03
AprilMPI_ESM11.740.790.131.310.900.24
AprilNorESM22.210.660.101.280.900.24
MayHadGEM31.310.890.060.950.950.09
MayMPI_ESM11.580.860.301.160.950.60
MayNorESM21.890.780.041.320.900.16
JuneHadGEM31.220.920.111.010.950.05
JuneMPI_ESM11.460.890.201.040.960.41
JuneNorESM21.690.850.050.980.950.13
JulyHadGEM31.180.920.071.010.940.00
JulyMPI_ESM11.470.890.171.110.950.45
JulyNorESM22.000.780.031.150.930.08
AugustHadGEM31.270.900.150.950.950.20
AugustMPI_ESM11.470.880.191.090.950.49
AugustNorESM21.940.770.021.110.930.12
SeptemberHadGEM31.180.91−0.140.940.950.17
SeptemberMPI_ESM11.560.860.071.150.950.54
SeptemberNorESM22.130.730.041.110.940.28
OctoberHadGEM31.300.910.030.980.950.22
OctoberMPI_ESM11.550.880.201.270.950.71
OctoberNorESM22.070.770.021.100.940.19
NovemberHadGEM31.380.890.131.030.950.22
NovemberMPI_ESM11.600.85−0.161.200.940.48
NovemberNorESM22.190.740.021.430.910.34
Table 3. Summary monthly statistics (cRMSE, r and SD difference) of CMIP5 (left) and CMIP6 (right) model performance against CRU observational data for precipitation during 1981–2000. Yellow highlighting indicates the best-performing model simulation, and green highlighting indicates the second-best-performing model simulation.
CMIP5 CMIP6
Month Model cRMSE Correlation Std_Dev Difference RMSE Correlation Obs_Std_Dev Difference
DecemberHadGEM329.60.921.525.00.911.5
DecemberMPI_ESM126.40.914.721.30.98.8
DecemberNorESM265.00.955.334.10.928.4
JanuaryHadGEM330.80.87.728.90.921.5
JanuaryMPI_ESM132.40.812.329.30.89.6
JanuaryNorESM263.00.851.132.20.922.1
FebruaryHadGEM323.20.8−1.424.20.81.9
FebruaryMPI_ESM133.40.72.939.10.66.5
FebruaryNorESM242.30.717.527.20.87.9
MarchHadGEM315.80.8−0.320.30.86.6
MarchMPI_ESM127.30.814.825.70.710.9
MarchNorESM241.10.727.721.80.914.5
AprilHadGEM315.60.79.016.20.810.2
AprilMPI_ESM126.70.516.520.10.713.7
AprilNorESM225.20.515.221.80.715.9
MayHadGEM314.10.65.611.80.73.5
MayMPI_ESM117.90.58.413.00.75.9
MayNorESM220.20.36.713.00.62.4
JuneHadGEM312.00.6−1.812.40.71.3
JuneMPI_ESM114.30.50.810.70.81.5
JuneNorESM213.30.6−0.410.30.7-3.9
JulyHadGEM311.40.7−2.99.20.8-2.5
JulyMPI_ESM113.90.5−2.412.50.72.2
JulyNorESM214.50.5−1.910.40.7-5.4
AugustHadGEM312.30.73.712.40.85.6
AugustMPI_ESM118.40.69.213.20.75.9
AugustNorESM219.30.59.18.10.8-2.0
SeptemberHadGEM316.70.810.914.50.910.2
SeptemberMPI_ESM113.20.87.016.40.912.1
SeptemberNorESM224.50.716.911.60.85.2
OctoberHadGEM318.10.910.618.30.913.0
OctoberMPI_ESM113.20.93.518.00.96.4
OctoberNorESM233.10.926.615.60.94.2
NovemberHadGEM327.50.920.028.80.923.1
NovemberMPI_ESM120.90.915.521.40.99.5
NovemberNorESM248.60.942.926.90.920.5
Disclaimer/Publisher’s Note: The statements, opinions and data contained in all publications are solely those of the individual author(s) and contributor(s) and not of MDPI and/or the editor(s). MDPI and/or the editor(s) disclaim responsibility for any injury to people or property resulting from any ideas, methods, instructions or products referred to in the content.