Article

Analysis of Forest Fire Emissions and Meteorological Impacts in Southwestern China Based on Multi-Source Satellite Observations

School of Environmental Science and Engineering, Southwest Jiaotong University, Chengdu 611756, China
*
Author to whom correspondence should be addressed.
Atmosphere 2025, 16(10), 1187; https://doi.org/10.3390/atmos16101187
Submission received: 28 August 2025 / Revised: 8 October 2025 / Accepted: 10 October 2025 / Published: 15 October 2025
(This article belongs to the Topic Atmospheric Chemistry, Aging, and Dynamics)

Abstract

Amid the growing frequency of forest fires in southwestern China, this study aims to quantify pollutant emissions and identify key meteorological drivers using multi-source satellite data. Active fire data from Himawari-8/9, MODIS, and VIIRS were integrated to construct a top-down emission inventory for 2016–2023, while the Geodetector method was applied to evaluate meteorological influences. Results indicate mean annual emissions (×103 t·a−1) of 5623.58 (±1554.33) for CO2, 356.84 (±98.63) for CO, and substantial amounts of particulate and gaseous pollutants. Spatially, Yunnan and Sichuan were the dominant emitters; temporally, emissions peaked in January–April and November–December, with daytime levels surpassing nighttime levels. Relative humidity was identified as the dominant meteorological driver (Q = 0.1223), while the interaction between temperature and relative humidity (Q = 0.1486) further enhanced explanatory power. These findings improve the precision of emission inventories and provide essential support for regional fire management and air quality modeling in complex environments.

1. Introduction

Against the backdrop of global climate change, extreme weather events have become increasingly frequent, leading to a steady rise in both the frequency and intensity of forest fires. These fires have emerged as one of the major environmental issues worldwide [1]. As a highly destructive natural disaster, forest fires not only destroy large areas of forest vegetation but also disrupt ecosystem structure and function, cause habitat loss, and seriously threaten biodiversity [2]. Large quantities of smoke and particulate matter released during fire events are rich in black carbon (BC) and organic carbon (OC), making forest fires an important contributor to greenhouse gas and aerosol emissions. These emissions can further degrade air quality and pose substantial risks to human health [3,4,5].
Southwestern China, home to the nation’s second-largest expanse of natural forests, possesses abundant forest resources but is highly susceptible to wildfires. Its dense vegetation, complex topography, and variable climate contribute to a persistently high fire incidence [6,7]. In recent years, the atmospheric effects of forest fires in this region have become increasingly evident, with CO2 emissions accounting for approximately 59.23% of the total carbon released from biomass burning and exhibiting a distinct seasonal pattern [8]. This seasonal clustering is closely linked to regional climatic conditions, as meteorological factors strongly influence fire ignition and propagation. High temperatures, low relative humidity, and moderate wind speeds are widely recognized as dominant drivers of wildfire occurrence [9]. Elevated temperature increases fuel flammability and accelerates moisture loss, while lower humidity reduces resistance to desiccation, and limited precipitation exacerbates dryness, collectively raising ignition probability. Meanwhile, moderate winds not only enhance oxygen supply but also accelerate flame spread and expand the affected area [10]. Therefore, understanding the emission characteristics of forest fires in southwestern China and their relationship with meteorological factors is of great scientific and practical significance. Such analyses provide a foundation for improved monitoring, early warning, and management of high-risk areas and for protecting regional air quality and ecological security.
Satellite remote sensing has increasingly replaced traditional ground-based approaches as a core tool for forest fire monitoring, owing to its wide spatial coverage, high temporal resolution, and rapid response capabilities [11]. Among these instruments, the Moderate Resolution Imaging Spectroradiometer (MODIS) is one of the earliest and most widely used systems for active fire detection. Mounted on the Terra (1999) and Aqua (2002) satellites, MODIS provides 36 spectral bands ranging from visible to thermal infrared, enabling up to four global observations per day. Since 2000, it has generated consistent global fire products at 1 km resolution, creating a valuable long-term record. However, its performance can be limited by cloud cover, smoke, and infrequent overpasses, and it is less effective for detecting small or topographically complex fires. Despite these limitations, MODIS has played a fundamental role in global forest fire monitoring [12,13]. The Visible Infrared Imaging Radiometer Suite (VIIRS), carried on Suomi NPP (2011), NOAA-20 (2017), and NOAA-21 (2022), provides higher spatial resolution (375 m) and improved sensitivity to small-scale and nighttime fires. Although VIIRS offers better spatial precision than MODIS, it remains limited by similar temporal constraints [14]. The Himawari-8/9 geostationary satellites, launched by the Japan Meteorological Agency in 2014 and 2016, are equipped with the Advanced Himawari Imager (AHI). Since 2015, they have provided 10 min interval fire data covering East Asia and the western Pacific, offering unique advantages for capturing rapidly evolving fire events, though their 2 km spatial resolution is relatively coarse. Previous studies have confirmed their accuracy and wide coverage in fire monitoring across Southeast Asia and Australia [15,16,17,18].
While polar-orbiting satellites such as MODIS and VIIRS offer high spatial resolution, their limited overpass frequency restricts the detection of diurnal variations and short-lived fires. In contrast, geostationary satellites like Himawari-8/9 provide continuous high-frequency observations that effectively capture fire dynamics but lack fine spatial detail. Integrating both observation types allows the combination of complementary strengths—high spatial accuracy from polar-orbiting sensors and high temporal resolution from geostationary ones. Building on this rationale, the present study focuses on southwestern China by fusing fire hotspot data from Himawari-8/9, MODIS, and VIIRS to construct a high-resolution spatiotemporal fire dataset. Forest hotspots were filtered using land-use information, and Fire Radiative Power (FRP) was integrated to estimate Fire Radiative Energy (FRE). Using the emission factor method, we quantified emissions of ten pollutants (including CO2, CO, PM2.5, VOCs, and NOX), thereby developing a top-down, multi-pollutant emission inventory for regional forest fires. The Geodetector model was then applied to quantitatively evaluate the explanatory power of meteorological variables and their interactions on spatial emission patterns. Together, these analyses enhance the accuracy of fire monitoring and emission estimation in regions with complex terrain, providing a solid scientific basis for wildfire early warning, carbon management, and air quality protection in southwestern China.

2. Materials and Methods

This study targeted southwestern China (Sichuan, Yunnan, Guizhou, and Chongqing) during the period 2016–2023 (Figure 1). Fire hotspot data were obtained from the NASA Earthdata system for MODIS and VIIRS (https://urs.earthdata.nasa.gov/, accessed on 24 June 2025) and from the Japan Meteorological Agency’s P-Tree platform for Himawari-8/9 (https://www.eorc.jaxa.jp/ptree/, accessed on 24 June 2025). The fire products derived from these satellites include geographic coordinates, observation time, fire area, and FRP (MW). FRP, defined as the rate of radiative energy released during combustion, is a key physical parameter for estimating fire emissions from remote sensing. Temporal integration of FRP yields FRE (MJ), which represents the total energy released during the entire burning process. FRE is widely recognized as a robust indicator of fire intensity. Previous research has shown a strong linear relationship between FRE and emissions of multiple atmospheric pollutants, confirming its suitability as a proxy for estimating fire emissions [19,20].
Although polar-orbiting satellites such as MODIS and VIIRS provide relatively high spatial resolutions (1 km and 375 m, respectively), their limited daily overpasses hinder continuous monitoring of fire activity and the capture of full diurnal fire cycles. To minimize temporal sampling bias, the diurnal variation in FRP was reconstructed using a Gaussian parameterization proposed by Vermote et al. (2009) [21], which has been widely applied in global fire emission studies to represent sub-daily FRP evolution from MODIS and VIIRS data. The specific formulations used in this study are provided in Equations (1)–(5):
FRE = FRP = 0 24 FRP peak ( b + e ( t - h ) 2 2 δ 2 ) dt
FRP peak = FRP Aqura   day [ b + e ( 13.5   h ) 2 2 δ 2 ]
b = 0.86 x 2 0.52 x + 0.08
δ = 3.89 x + 1.03
h = 1.23 x + 14.57 + ε
In these equations, FRPpeak represents the peak fire radiative power of the diurnal cycle; b denotes the background value of radiative energy; σ is the standard deviation of the Gaussian curve; t represents time; and h corresponds to the time of peak FRP. FRPAqura day refers to the mean daytime FRP observed by the Aqua satellite, while x is the ratio of Terra to Aqua monthly mean FRP (T/A). Different vegetation types exhibit distinct T/A values, reflecting their combustion characteristics. For China, this correction factor was set to 4 to adjust the FRP peak time, and the VIIRS diurnal cycle was derived by referencing that of MODIS.
In contrast, the Himawari-8/9 geostationary satellite provides observations every 10 min, offering superior temporal resolution. For this dataset, cumulative FRE was calculated by assuming a uniform FRP distribution between consecutive time steps, as shown in Equation (6):
FRE = FRP = 0 24 F R P dt
Given the high temporal frequency of Himawari-8/9, this approach effectively captures short-term fire fluctuations and eliminates the need to reconstruct a diurnal cycle, as required for polar-orbiting sensors.
For hotspot allocation at a 10 min resolution, a grid-based fusion approach was applied. Following the relative spatial resolutions of the satellite products, a practical priority principle of “VIIRS FRE > MODIS FRE > Himawari-8/9 FRE” was adopted for fire energy fusion at the 10 min grid level [22,23]. This approach reflects the complementary strengths of different sensors: VIIRS provides high spatial resolution, MODIS offers moderate resolution with frequent overpasses, and Himawari-8/9 provides high-temporal-resolution observations. The hotspot with the highest spatial resolution within each grid was selected as the fused hotspot, and the fused FRE for each grid cell was calculated using Equation (7):
F R E f u s e d = w 1 × F R E H + w 2 × F R E M + w 3 × F R E V
In this equation, FREfused denotes the fused fire radiative energy on a grid basis, while FREH, FREM, and FREv represent the FRE values calculated from Himawari-8/9, MODIS, and VIIRS FRP data, respectively. The weights w1, w2,and w3 were assigned as follows: when Himawari-8/9 FRE > 0 but MODIS and VIIRS FRE = 0, then w1 = 1, w2 = 0, w3 = 0. when MODIS FRE > 0 and VIIRS FRE = 0, then w1 = 0, w2 = 1, w3 = 0; and when VIIRS FRE > 0,then w1 = 0, w2 = 0, w3 = 1. This weighting strategy is consistent with the sensor fusion logic used in previous multi-satellite emission studies [24], which emphasize exploiting the complementary characteristics of polar-orbiting and geostationary sensors while prioritizing spatial resolution in the fused product.
This fusion strategy prioritizes spatial resolution to ensure higher positional accuracy of detected hotspots, while recognizing that temporal discrepancies among sensors (e.g., between Himawari-8/9’s 10 min scans and the less frequent MODIS/VIIRS observations) may influence the representation of short-lived fires. Total pollutant emissions from forest fires, denoted as EI (t), were calculated as follows [25]:
E I i ,   j = FRE i ,   j × EF i ,   j / 10 6
where EI represents the emissions of pollutant i in region j (unit: t), EF is the emission factor (unit: g/MJ), and i refers to pollutant types, including CO2, CO, VOCs, NH3, SO2, NOx, PM2.5, PM10, OC, and BC.
To filter hotspots, land-use data for southwestern China were obtained from the Resource and Environmental Science Data Center of the Chinese Academy of Sciences (https://www.resdc.cn/, accessed on 27 June 2025). Each hotspot was assigned a land-use category, and only those within forested areas were retained as valid forest fire detections. To ensure temporal consistency, a “nearest-year matching” approach was applied: 2016 was matched with 2015 data, 2017–2018 with 2018 data, 2019–2021 with 2020 data, and 2022–2023 with 2023 data. Distinguishing between flaming and smoldering combustion phases is not feasible with current satellite observations; therefore, unified (composite) emission factors were used to represent overall fire emissions. Current satellite fire products primarily detect thermal anomalies through brightness temperature or FRP, which reflect fire intensity rather than combustion phase [26,27,28]. Moreover, most forest fires involve canopy and surface fuels that burn with high oxygen availability, making flaming combustion the dominant mode, while smoldering typically occurs only in localized environments such as peat or duff layers [29,30,31].
Due to the limited availability of emission factor data for forest fires in southwestern China, representative values were derived through a literature synthesis following established biomass-burning inventories [32,33,34,35]. Preference was given to studies with vegetation types and combustion conditions similar to those in the study region. Emission factors from multiple sources were averaged to obtain regionally representative values for major fire pollutants (Table 1). This literature-based approach is consistent with global inventories such as GFED and FINN, where FRE is used to estimate total biomass consumption through empirically calibrated coefficients [27,36]. Compared with statistical inventories based solely on burned area, the FRP–FRE approach provides improved temporal resolution and compatibility across multiple sensors, making it suitable for long-term regional emission estimation [28,37].
Meteorological data used in this study were obtained from the ERA5-Land monthly reanalysis dataset published by the European Centre for Medium-Range Weather Forecasts (ECMWF). The data have a spatial resolution of 0.1° × 0.1°and include monthly variables such as 2 m air temperature, total precipitation, dew point temperature, and soil moisture. Relative humidity was derived from ERA5 air temperature and dew point data. To ensure spatiotemporal consistency between meteorological and fire hotspot datasets, ERA5 data from the same month and year as fire observations were extracted for each hotspot. Each hotspot’s geographic coordinates were mapped to the corresponding ERA5 grid cell to extract the associated meteorological variables. These data were used both for visualization of fire–climate relationships and as input variables for the Geodetector model.
The Geodetector method was employed to quantitatively assess the relationship between forest fire FRE and key meteorological variables, including 2 m air temperature, relative humidity, precipitation, and soil moisture. Geodetector is a statistical tool designed to detect and quantify spatial heterogeneity and its underlying drivers. It evaluates the explanatory power of an independent variable (x) on a dependent variable (y) by comparing the similarity of their spatial distributions. Unlike conventional multivariate methods, Geodetector does not assume linearity or normality, is robust against multicollinearity, and can explicitly capture nonlinear effects and interaction mechanisms. Given the pronounced spatial heterogeneity and complex coupling between fire emissions and meteorological conditions in this study, the Geodetector framework is particularly suitable for accurately identifying and quantifying the explanatory power of both individual and interacting factors. The method has been widely applied and validated in environmental science, geography, and climate research [38,39]. Using Geodetector, we systematically assessed the influence of meteorological factors on the spatiotemporal variability of forest fires in southwestern China.
The analysis was conducted in R (version 4.5.0) using the GD package (version 10.6), applying three supervised discretization methods: equal interval, natural breaks, and quantile. The model automatically selected the optimal stratification scheme within a range of 3–9 classes to maximize the Q-statistic. The model quantifies the explanatory power of meteorological factors on forest fire activity through the Q-statistic, which ranges from 0 to 1 (Equation (9)), with higher values indicating stronger explanatory power. The Q-statistic can be applied to stratification across space, time, or attributes, enabling effective identification of driving factors at different scales [38].
Q = 1 h = 1 L N h σ h 2 N σ 2
In the equation, h = 1…L denotes the stratification of the dependent variable (e.g., fire radiative energy, FRE, and the number of fire hotspots) or the independent variable (e.g., meteorological factors). Nh and N represent the sample size in stratum h and the total sample size in the entire study area (or fire-affected area), respectively. σh2 and σ2 denote the variance of the dependent variable within stratum h and across the entire region, respectively.

3. Results

3.1. Comparison Analysis

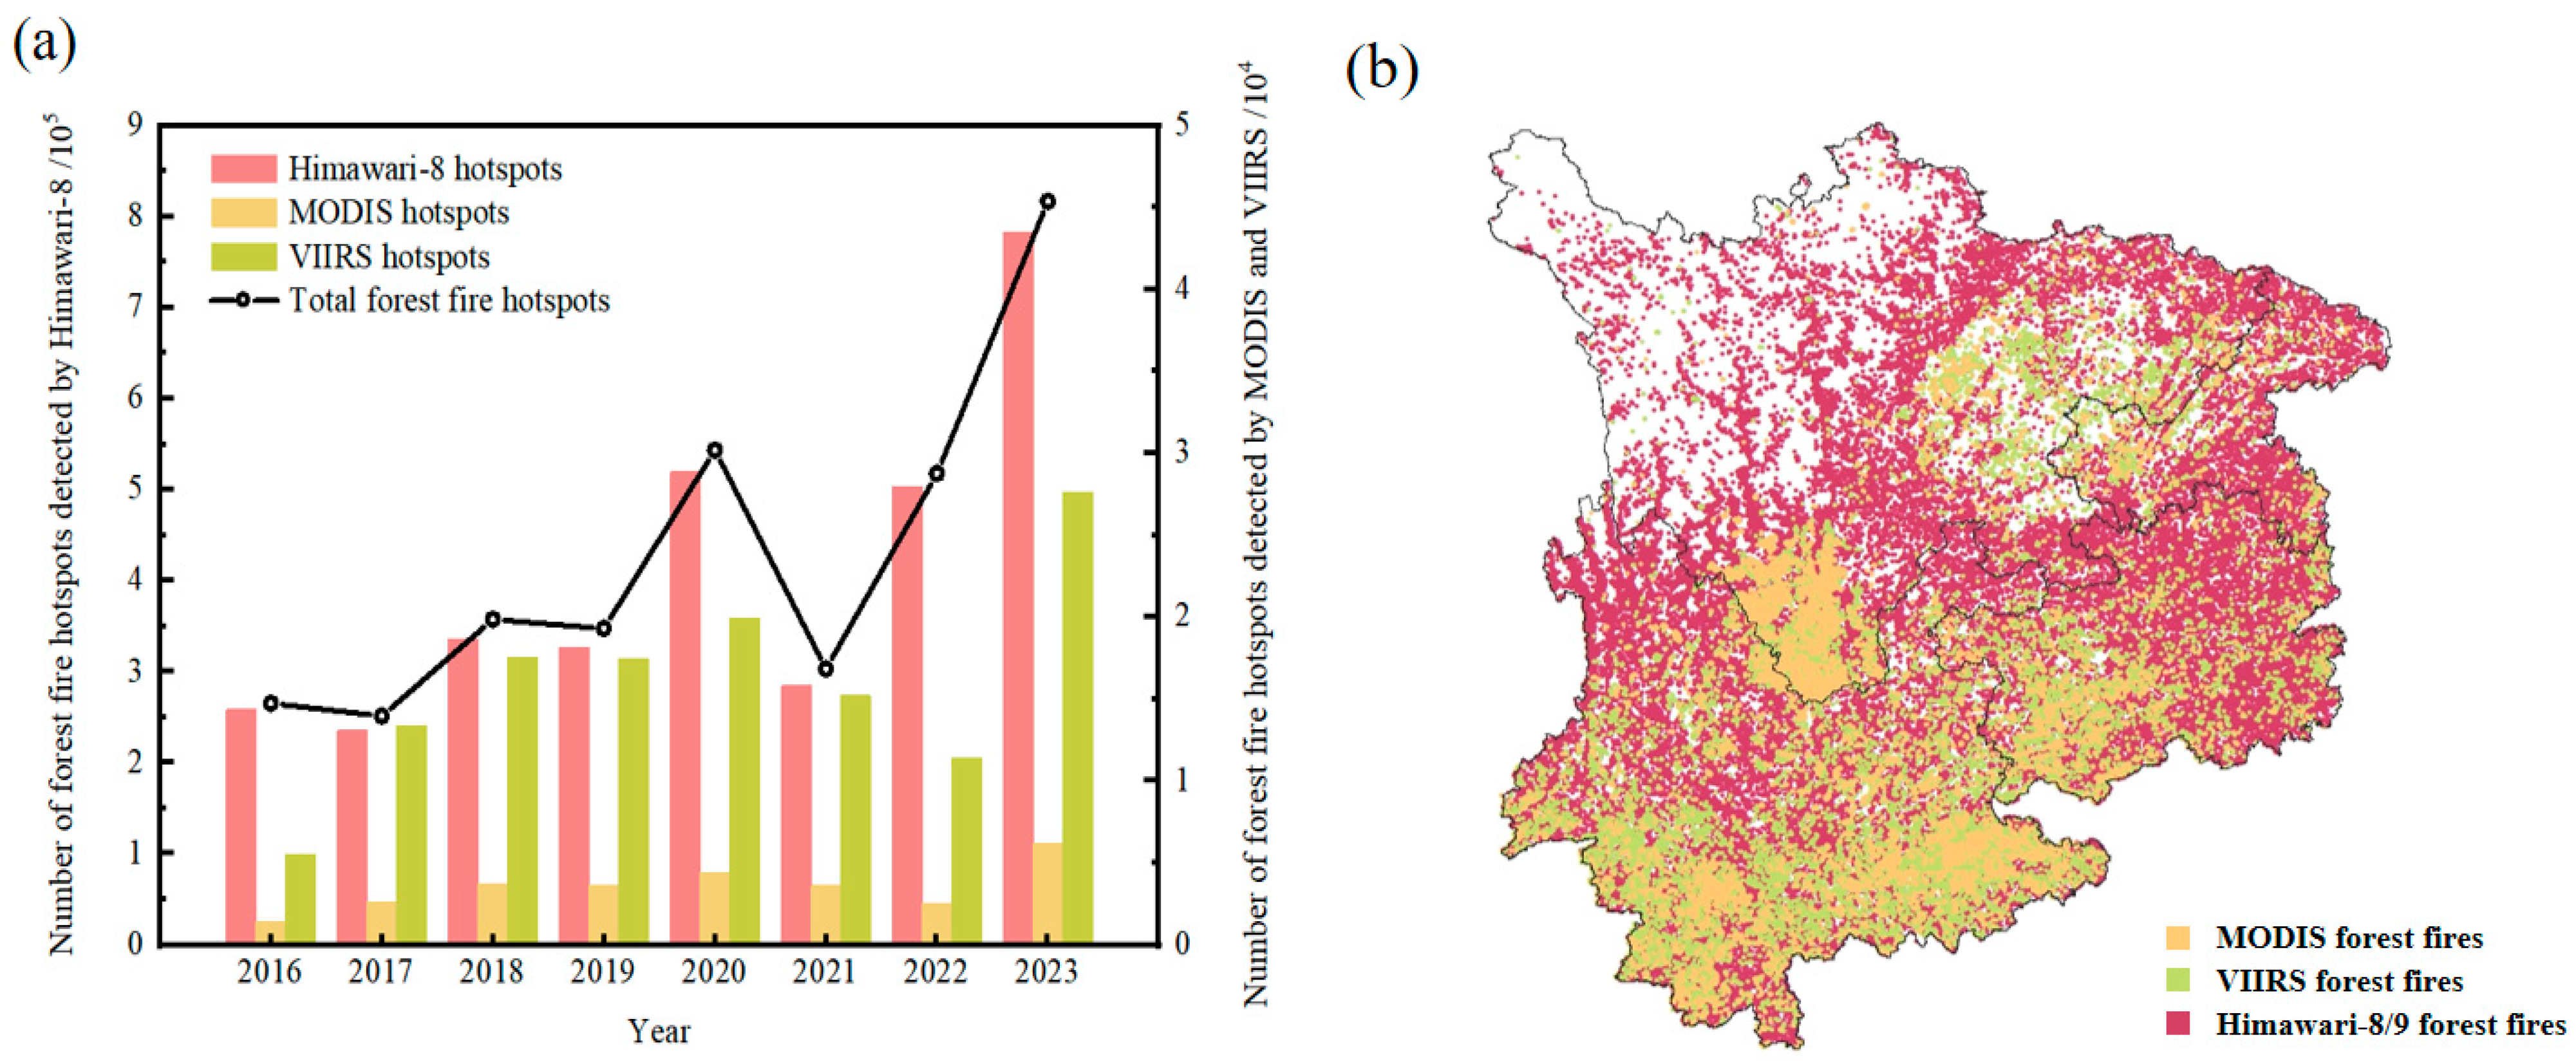
To evaluate the performance and complementarity of multi-satellite collaborative monitoring, this study conducted a comprehensive comparative analysis of the performance of Himawari-8/9, MODIS, and VIIRS in detecting forest fire hotspots across southwestern China, focusing on both interannual dynamics and spatial patterns (Figure 2). In terms of interannual variability, Himawari-8/9, with its 10 min observation frequency, detected an average of 405,800 hotspots annually from 2016 to 2023, comprising 95.41% of the total. Its high temporal resolution made it particularly effective during high-risk fire years such as 2022, when it substantially outperformed VIIRS (16,000 hotspots annually, 3.76%) and MODIS (3500 hotspots annually, 0.83%). Leveraging its 375 m spatial resolution, VIIRS excelled at identifying small and scattered surface fires in mountainous terrain, while MODIS utilized its multispectral information to effectively distinguish combustion phases and surface temperatures. Although the three sensors exhibited consistent interannual variation trends, differences in spatial resolution, detection thresholds, and sensitivity led to a complementary monitoring framework, wherein each sensor provided unique advantages despite quantitative discrepancies.
Regarding spatial performance, despite its coarse 2 km spatial resolution, Himawari 8/9’s high-frequency imaging ensured continuous coverage over complex terrain and improved detection of both persistent and short-lived intense fires. This temporal advantage reduced omission errors and enhanced emission estimation accuracy by capturing short-duration events that might otherwise be missed. Compared to VIIRS (with a 12 h revisit time) and MODIS (with four daily overpasses), Himawari-8 significantly increased hotspot detection in cloud-prone mountainous areas, thus mitigating the underestimation of total emissions common in single-satellite approaches. While VIIRS and MODIS improved local detection accuracy and resilience to cloud shadow interference, their limited temporal resolution restricted their ability to capture complete fire dynamics. Overall, Himawari-8/9’s high-frequency observations greatly expanded the spatiotemporal coverage of fire hotspot detection, providing critical support for the construction of continuous and comprehensive fire emission inventories. This finding underscores the importance of multi-satellite synergy in wildfire monitoring and carbon emission estimation in topographically complex regions.

3.2. Emission Inventory of Air Pollutants

The emission inventory developed through multi-source satellite hotspot fusion (Table 2) reveals that forest fires in southwestern China emitted ten major pollutants from 2016 to 2023: CO2, CO, PM2.5, PM10, VOCs, NOx, SO2, NH3, BC, and OC. Their average annual emissions and associated standard deviations (×103 t·a−1) were 5623.58 ± 1554.33, 356.84 ± 98.63, 41.39 ± 11.44, 44.46 ± 12.29, 63.36 ± 17.51, 9.45 ± 2.61, 2.98 ± 0.82, 4.86 ± 1.34, 2.04 ± 0.56, and 29.21 ± 8.08, respectively. Among these, CO2 and CO dominated total gaseous emissions, whereas particulate matter (PM2.5, PM10) and carbonaceous components (BC, OC), though smaller in quantity, exerted disproportionately large impacts on visibility, human health, and radiative forcing. Reactive gases such as NOx, SO2, NH3, and VOCs also played crucial roles as precursors of ozone and secondary aerosols.
The interannual emissions of pollutants exhibited a generally fluctuating upward trend, with 2020 and 2023 identified as years of intense fire activity when most pollutants peaked. For example, CO emissions in Sichuan Province rose markedly from 55.83 × 10³ t in 2019 to 118.61 × 10³ t in 2020, an increase of 62.78 × 10³ t (approximately 112%). As a result, the total regional CO emissions rose from 344.20 × 10³ t in 2019 to 415.86 × 10³ t in 2020, an increase of 71.66 × 10³ t. The provincial shares of CO emissions that year were: Yunnan 52.7%, Sichuan 28.5%, Guizhou 18.3%, and Chongqing 0.5%. In Sichuan, multiple pollutants (including PM2.5, PM10, and CO2) increased concurrently, consistent with the occurrence of extreme fire events. A representative case was the “3·30” Xichang wildfire in Liangshan Prefecture, which burned over 1000 ha and caused 19 fatalities.
In 2023, regional CO emissions rose sharply again, rising from 293.95 × 10³ t in 2022 to 572.88 × 10³ t, an increase of 278.93 × 10³ t. Yunnan Province contributed most to this surge, with its CO emissions surging from 152.61 × 10³ t to 383.00 × 10³ t (an increase of 230.39 × 10³ t), accounting for 66.9% of the regional total in 2023. This escalation coincided with several large-scale wildfires in Yunnan that year, such as the “4·11” fire in Jiangchuan, Yuxi (mobilizing 3000–4000 personnel for firefighting, with open flames extinguished between April 15–16), and the April 13 Anning wildfire.
A provincial comparison revealed that pollutant emissions from forest fires in southwestern China followed the pattern “Yunnan > Sichuan > Guizhou > Chongqing.” Yunnan accounted for more than half of the total annual emissions due to its dense forests, rugged terrain, and pronounced dry season. Sichuan exhibited a “low-frequency but high-intensity” pattern, with elevated emissions during extreme events. Guizhou displayed moderate levels, and Chongqing consistently recorded the lowest emissions, reflecting its limited forest coverage and urbanized landscape.

3.3. Comparison of Hotspot Numbers and Emission Characteristics

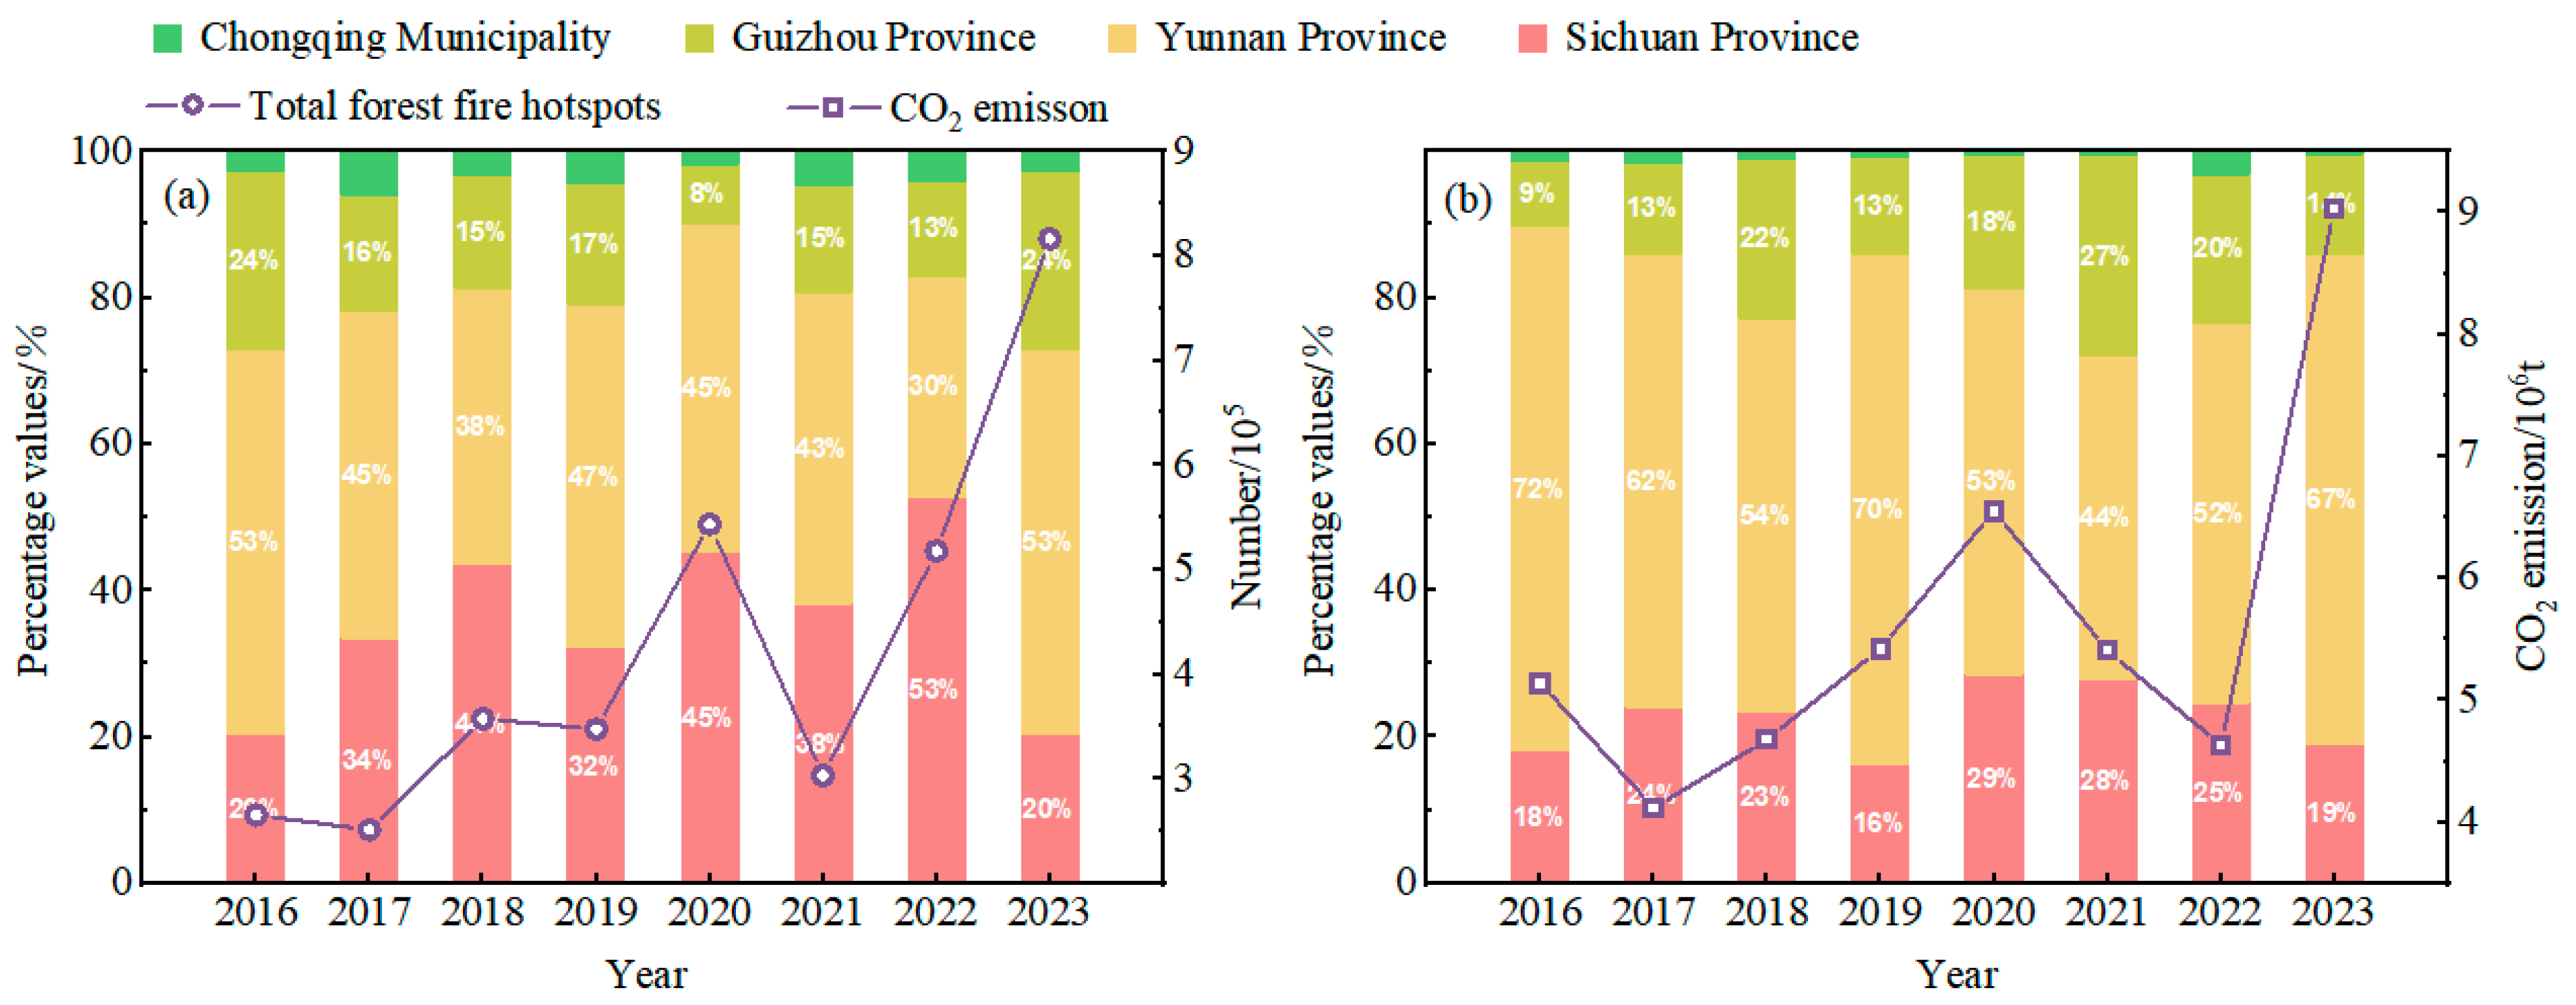
As a typical emission from forest fires, CO2 has a strong cumulative effect in the atmosphere and serves as an important indicator for evaluating the environmental impacts of fires. To further characterize the emission patterns and regional differences in forest fires in southwestern China, we analyzed the spatial distribution of fire hotspots and total CO2 emissions, as well as their proportions in Yunnan, Sichuan, Guizhou, and Chongqing from 2016 to 2023 (Figure 3). Results indicated that, during the study period, the annual average number of forest fire hotspots in the region was 4.25 × 10⁵, while the annual average CO2 emissions amounted to 5.62 × 10¹² g (approximately 5.62 × 10⁶ t), showing an overall upward but fluctuating trend.
In terms of provincial distribution, the proportions of fire hotspots were 47.8% in Yunnan, 30.4% in Sichuan, 17.6% in Guizhou, and 4.2% in Chongqing. Corresponding proportions of CO2 emissions were 59.6%, 22.5%, 16.8%, and 1.0%, respectively. Yunnan consistently ranked first in both hotspot count and emissions across most years, confirming its role as the dominant contributor to regional carbon output. This dominance is closely associated with its dense forest coverage, complex topography, and seasonally dry climate.
Sichuan Province exhibited pronounced interannual variation in fire emissions. In 2020, influenced by the catastrophic “3·30” Xichang wildfire, its CO2 share rose sharply to 28.5%, far exceeding normal levels and underscoring the significant role of extreme fire events in driving regional carbon emissions. In contrast, Guizhou maintained relatively stable proportions of hotspots and emissions, averaging 17.6% and 13.5%, respectively, indicating a moderate contribution to overall emissions. Chongqing, constrained by limited forest resources and extensive urbanization, consistently recorded the lowest values in both indicators, reflecting its minor impact on regional wildfire emissions.
Further comparison revealed that Yunnan’s share of CO2 emissions exceeded its hotspot proportion by approximately 11.4 percentage points, implying higher per-hotspot carbon intensity and stronger combustion efficiency. In contrast, Guizhou and Chongqing exhibited lower CO2 emission shares relative to hotspot proportions, suggesting smaller fire scales and weaker combustion strength. In 2023, the number of forest fire hotspots in the region increased from 517,773 in 2022 to 816,585, a rise of 57.71%. During the same period, CO2 emissions almost doubled, increasing from 4.63 × 10¹² g to 9.03 × 10¹² g, an increase of 95.0%. The emission growth far outpaced the increase in hotspot numbers, suggesting that not only did fire frequency rise, but combustion intensity and FRP also increased substantially, leading to higher per-hotspot carbon emissions. These findings highlight that satellite-based evaluations of forest fire emissions should incorporate multiple parameters—such as FRP, fire duration, and burned area—rather than relying solely on hotspot counts to capture true environmental impacts.

3.4. Characteristics Spatiotemporal Characteristics of Carbon Emissions

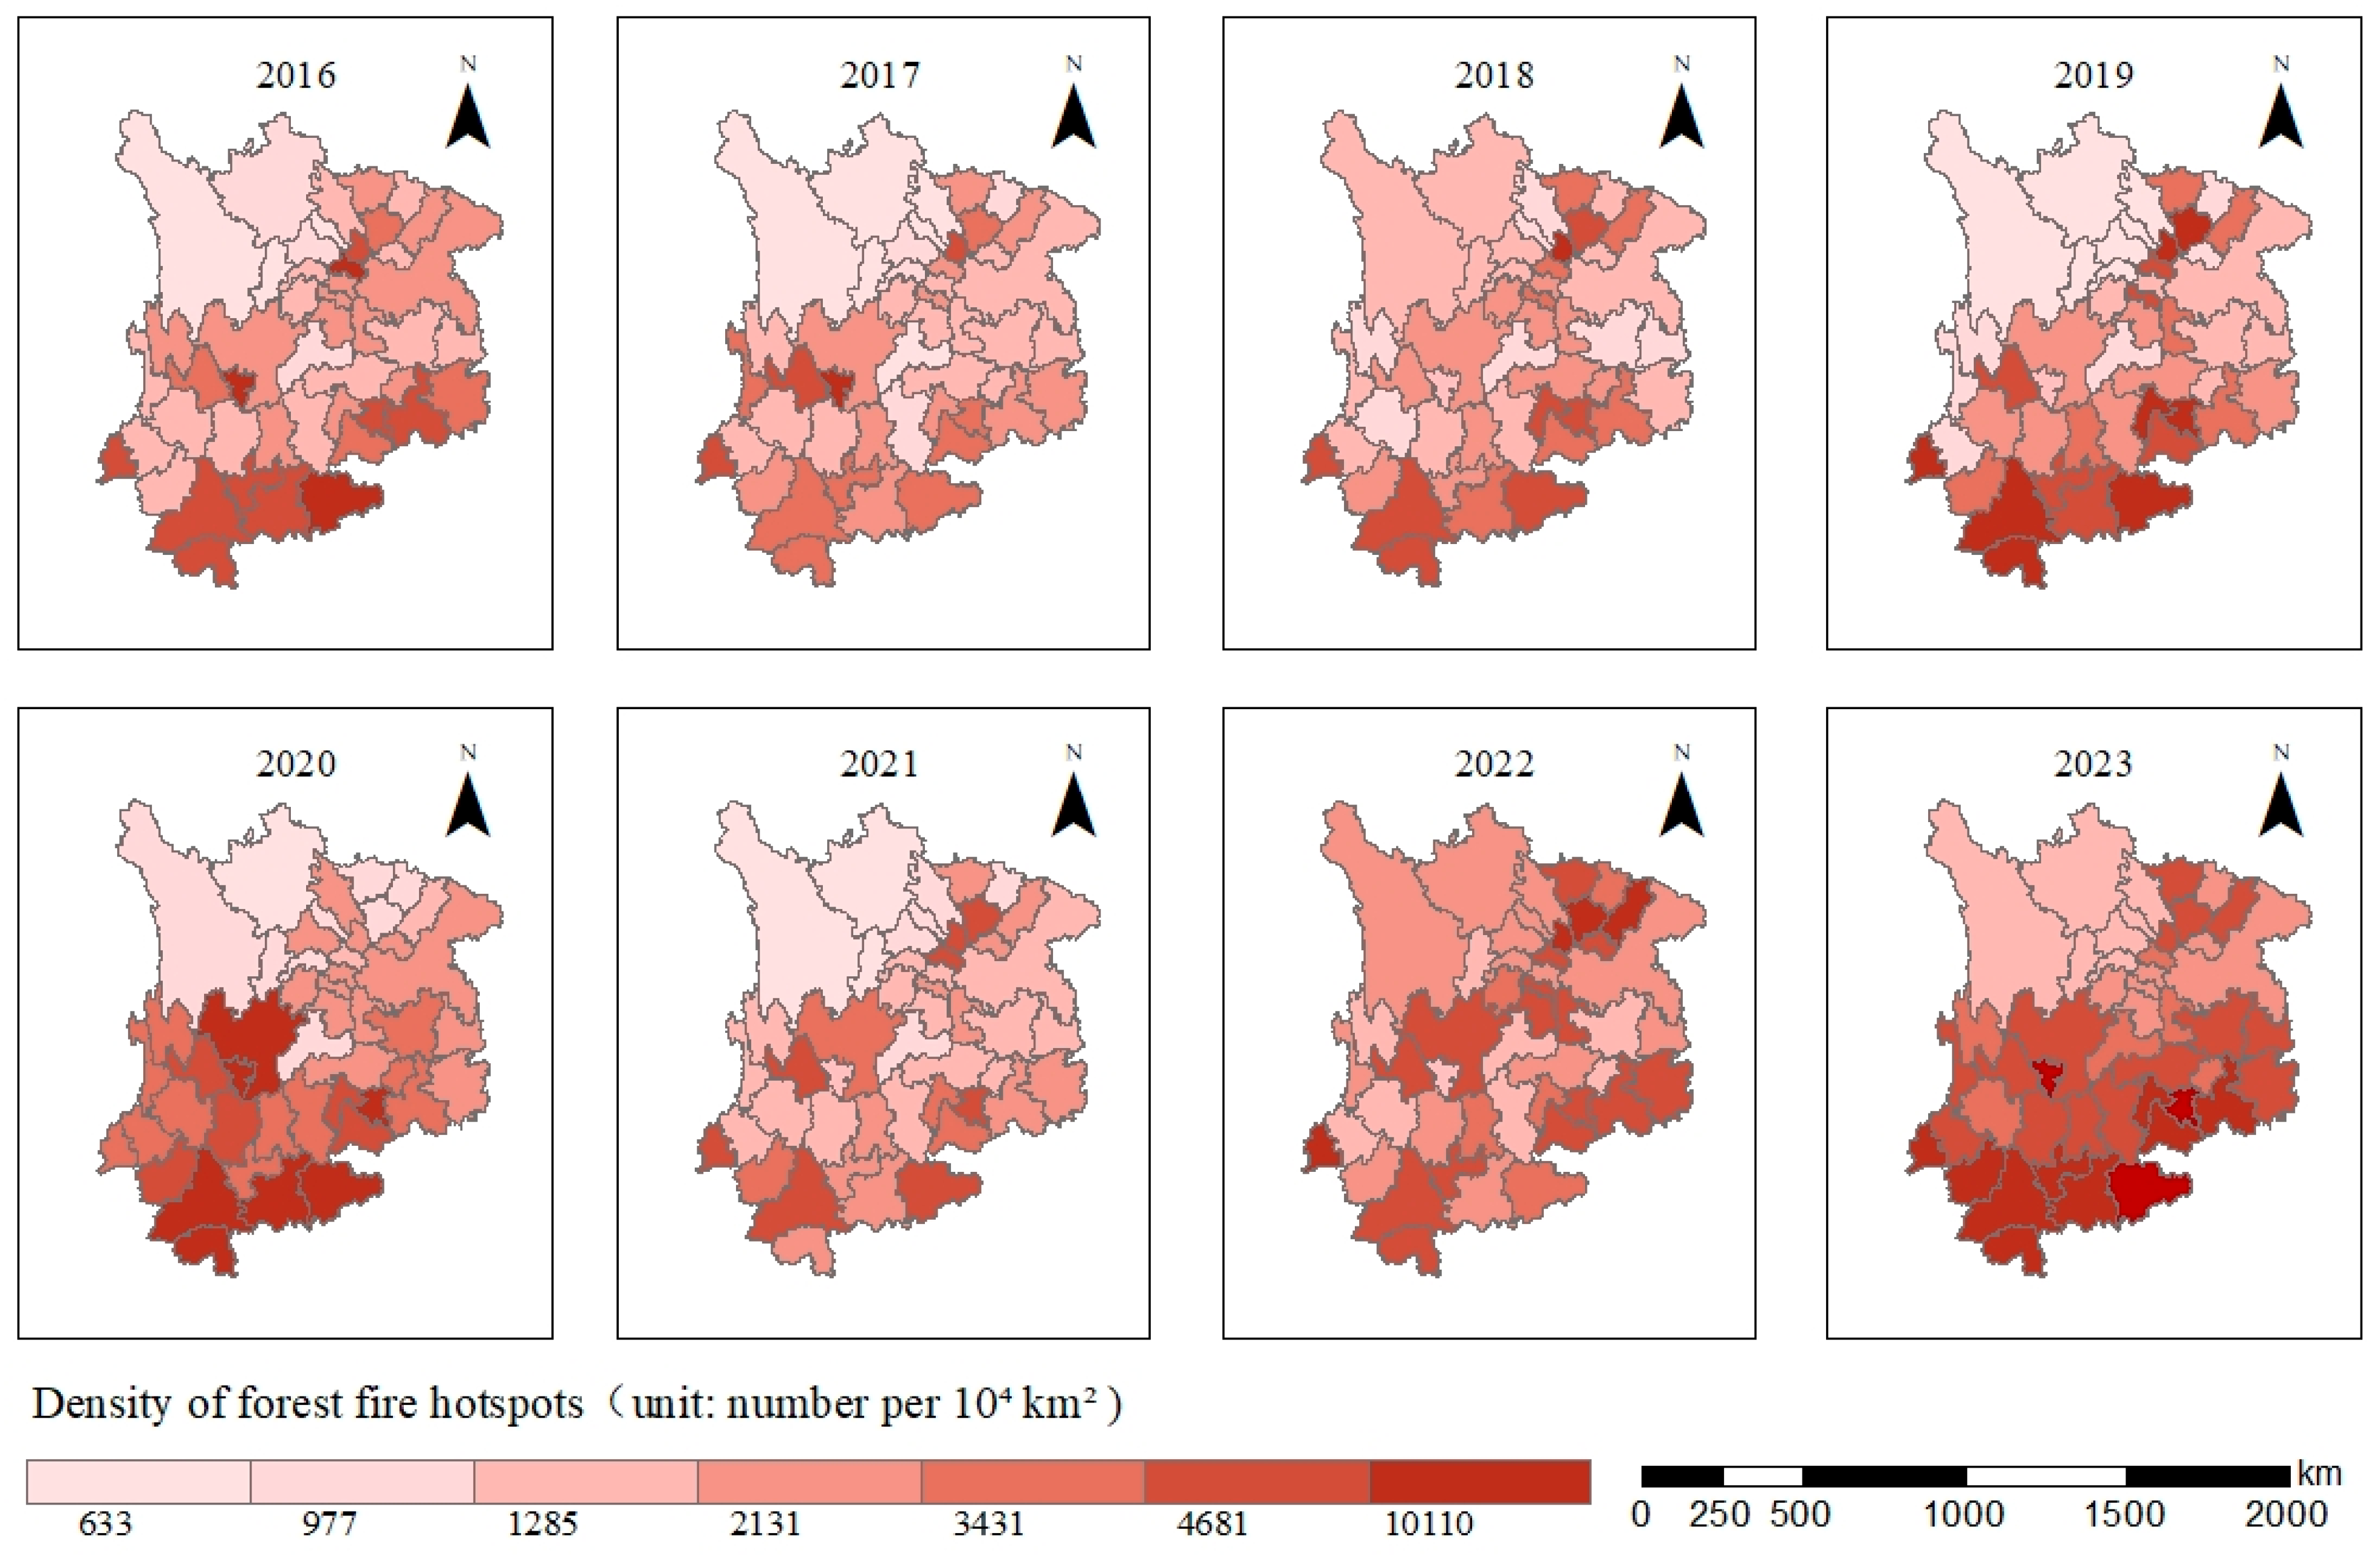
At the prefecture-level scale (Figure 4), forest fires in Sichuan Province were mainly concentrated in Panzhihua and Liangshan Prefecture; in Yunnan Province, high-frequency fire areas included Lijiang, Xishuangbanna, Pu’er, Wenshan, and Dehong; in Guizhou Province, fires frequently occurred in Qianxinan, Qiannan, Qiandongnan Prefectures, and Anshun City; while Chongqing Municipality generally exhibited relatively low fire frequencies.
From a geographical perspective, the Sichuan Basin, characterized by flat terrain and extensive croplands, recorded relatively few fire hotspots. In contrast, fire activity was concentrated around the basin’s periphery, the Yunnan–Guizhou Plateau, southern Guizhou, and the Hengduan Mountains. These areas, featuring high forest coverage, rugged terrain, and complex climatic conditions, provided favorable conditions for frequent fire occurrence. Overall, the spatial distribution of hotspots followed the pattern of “more in the south than in the north, and more in mountainous areas than in plains.” Mountainous regions exhibited greater sensitivity to fire occurrence, identifying them as priority zones for regional fire prevention and control.
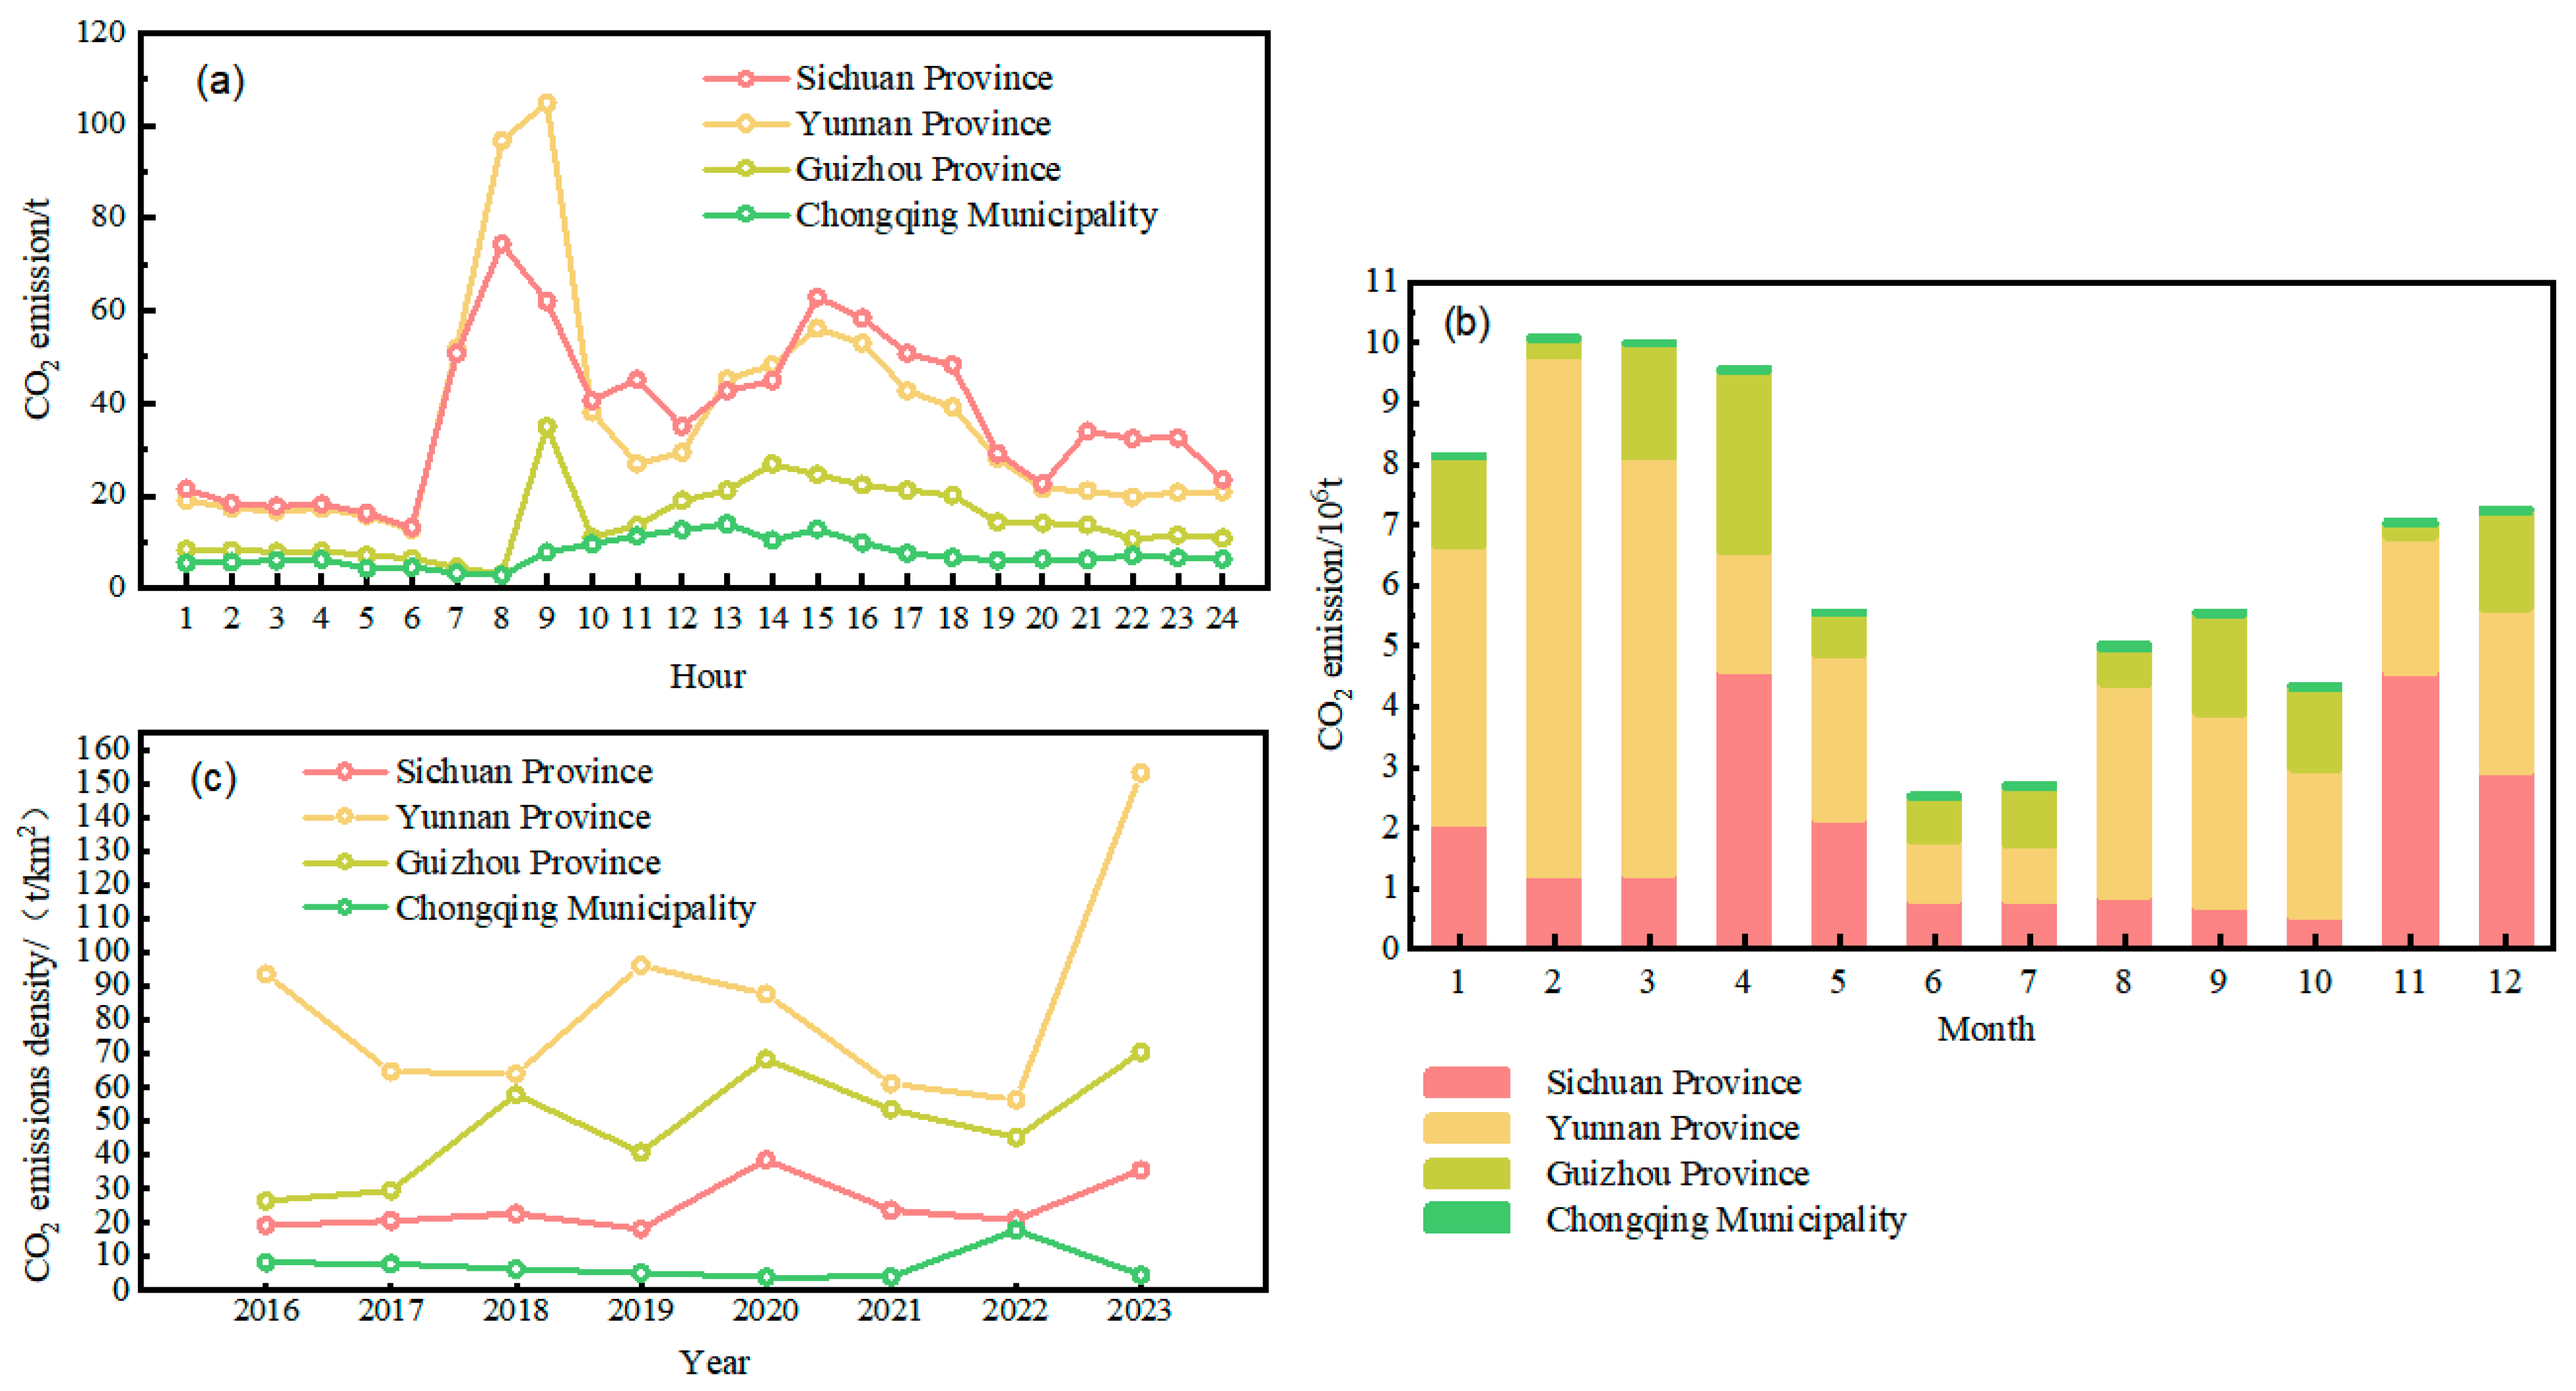
Figure 5 illustrates the multi-scale variations in CO2 emissions from forest fires in southwestern China between 2016 and 2023. At the interannual scale, Yunnan Province peaked in 2023, with emissions significantly exceeding previous years, likely linked to exceptional drought and heat conditions. Sichuan Province experienced a sharp increase in 2020, primarily due to the “3·30” Xichang wildfire, underscoring the substantial effect of extreme events on annual carbon fluxes. In contrast, Guizhou and Chongqing maintained low emission levels with relatively stable year-to-year changes.
At the intra-annual scale, CO2 emissions exhibited marked seasonal concentration. Emissions were mainly concentrated in January–April and November–December, but the peak months differed by province—February in Yunnan, April in Sichuan, and March in Guizhou—reflecting the strong influence of spring drought conditions on fire activity. During summer (June–September), enhanced precipitation and humidity suppressed emissions, narrowing regional differences.
At the diurnal scale, CO2 emissions followed a distinct pattern of “low at night, high during the day, and decreasing in the evening.” Between 0:00 and 6:00, emissions remained generally low, with most provinces reaching their minimum around 6:00. From 08:00 onward, emissions increased rapidly as the temperature rose and the humidity decreased, peaking at around 09:00 in Yunnan and Guizhou and around 15:00 in Sichuan. The high-emission phase generally persisted until 19:00, after which emissions gradually decreased with cooling temperatures.
Overall, the results demonstrate that forest fire emissions in southwestern China exhibited pronounced interannual fluctuations, seasonal concentration, and diurnal variability, driven jointly by climatic conditions and human activities. Provincial differences were evident: Yunnan peaked mainly in February, Sichuan in April, and Guizhou in March. At the diurnal scale, Yunnan and Guizhou peaked near 09:00, while Sichuan peaked later at 15:00. It is therefore recommended that high-emission provinces such as Yunnan and Sichuan establish province-specific, season-specific, and time-targeted monitoring and prevention systems tailored to their emission characteristics.

3.5. Meteorological Drivers and Their Impacts on Carbon Emissions

Temperature and precipitation were selected as key meteorological variables to analyze their relationships with forest fire CO2 emissions at both interannual and intra-annual (monthly) scales. February is the peak fire season in southwestern China. Figure 6a illustrates the interannual variations in temperature, precipitation, and CO2 emissions during February from 2016 to 2023. At the interannual scale, CO2 emissions generally followed the pattern of “higher temperatures resulting in higher emissions, whereas increased precipitation corresponded to lower emissions,” confirming the enhancing role of hot and dry conditions on fire intensity and carbon emissions. However, this relationship was nonlinear. For instance, during 2019–2020, despite rising temperatures, abundant precipitation corresponded to relatively low CO2 emissions, implying that complex nonlinear and interactive effects among meteorological variables jointly influenced fire development and emission strength. At the intra-annual (monthly) scale (Figure 6b), from January to March, low precipitation and dry atmospheric conditions led to a sharp increase in CO2 emissions with rising temperatures, reflecting the intensified combustion driven by hot dry conditions. From April to July, although temperatures continued to climb, enhanced rainfall suppressed emissions, indicating that moist conditions could partially offset the fire-promoting influence of heat. From August to December, as temperatures declined and precipitation decreased again, CO2 emissions rebounded, showing that dryness re-emerged as the dominant driver.
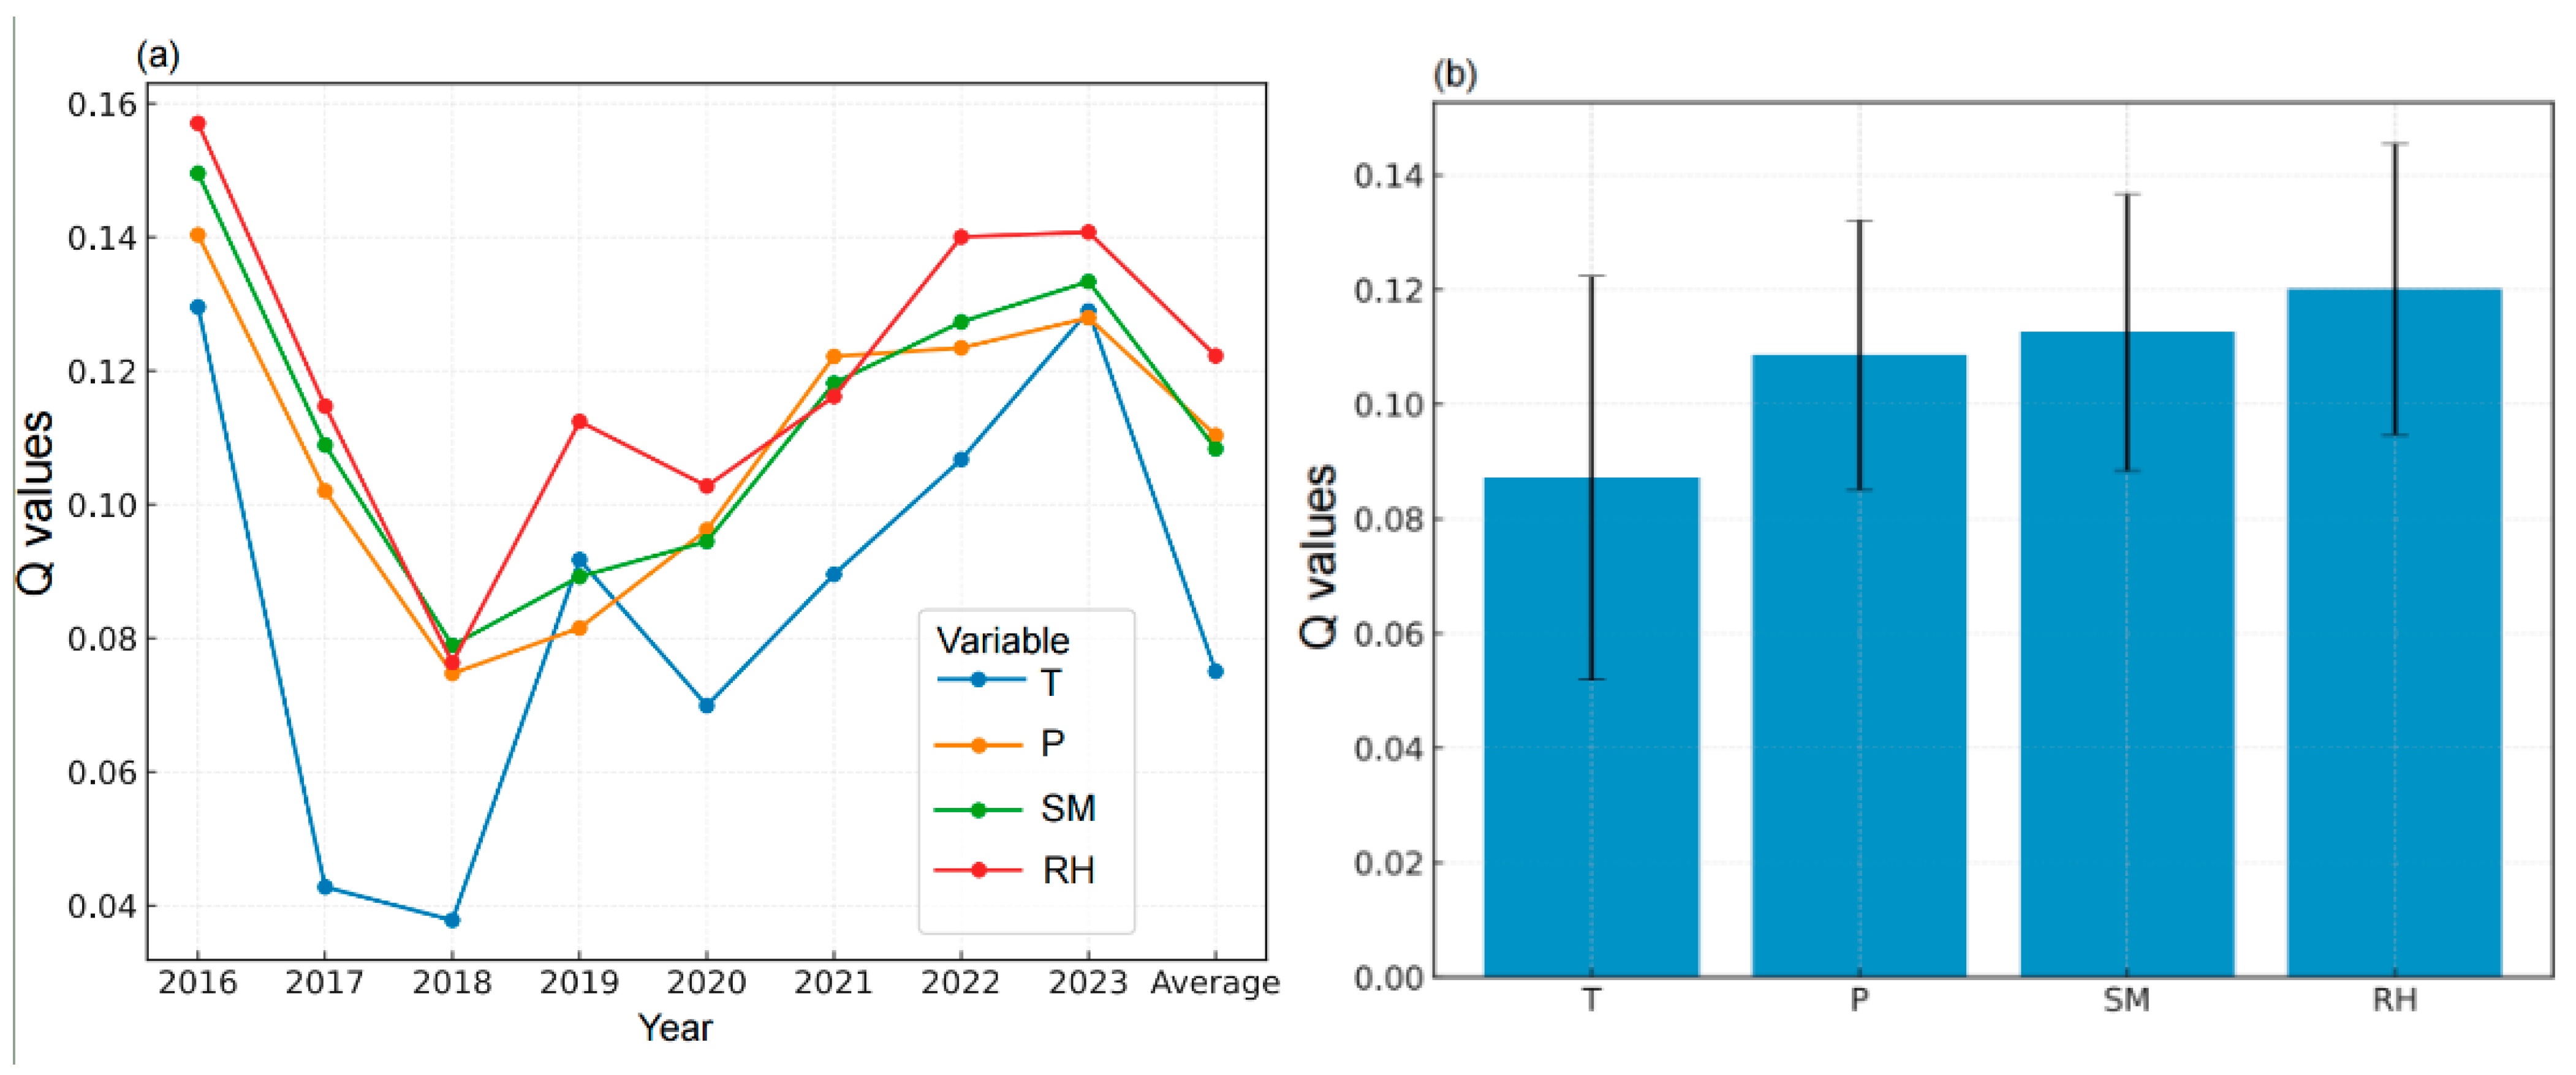
FRP, representing the instantaneous rate of energy release from combustion, correlates strongly with fire intensity and biomass consumption rate. Compared with estimates based solely on burned area or emission inventories, satellite-derived FRP provides real-time data with high spatial and temporal resolution and clear physical comparability, offering a more objective measure of fire strength and spatial variability. Accordingly, this study employed temperature (T), precipitation (P), relative humidity (RH), and soil moisture (SM) as independent variables and applied the Geodetector model to assess their explanatory power on the spatial distribution of FRP (Figure 7). In the Geodetector framework, Q (0–1) represents the proportion of FRP variance explained by a single factor or by a factor pair, with interpretation based on statistical significance and relative magnitude rather than fixed thresholds [40]. The overall ranking indicated a dominance of moisture-related factors, with mean contributions during 2016–2023 of RH (0.1223) > P (0.1103) ≈ SM (0.1083) > T (0.0750). This result suggests that indicators describing the atmospheric and fuel moisture state (RH, SM) were stronger determinants of fire intensity, while temperature alone exerted a comparatively weaker influence. All variables passed the significance test (p < 0.05).
At the interannual scale, a fluctuating pattern of “high in 2016—low in 2018—rebound in 2023” was observed. The mean Q value of the four factors peaked at 0.144 in 2016, declined to 0.067 in 2018, remained low during 2019–2020, and then gradually increased to 0.133 in 2023. For individual factors, all four exhibited troughs in 2018 (T = 0.038, P = 0.074, SM = 0.079, RH = 0.076), while 2016 showed widespread peaks (T = 0.130, P = 0.140, SM = 0.150, RH = 0.157), indicating that hydrothermal conditions that year exerted the strongest differentiation effect on the spatial heterogeneity of FRP. Among the factors, temperature (T) showed the largest interannual fluctuation (σ = 0.035), significantly higher than precipitation (P, 0.023), soil moisture (SM, 0.024), and relative humidity (RH, 0.025). In terms of linear trends, the Q values of all four factors increased slowly, suggesting that after the 2018 low point, their explanatory power gradually recovered and strengthened. Overall, moisture-related factors (RH, SM, and P) provided stable contributions, whereas temperature was more sensitive to extreme years, amplifying or weakening its explanatory power for FRP spatial distribution.
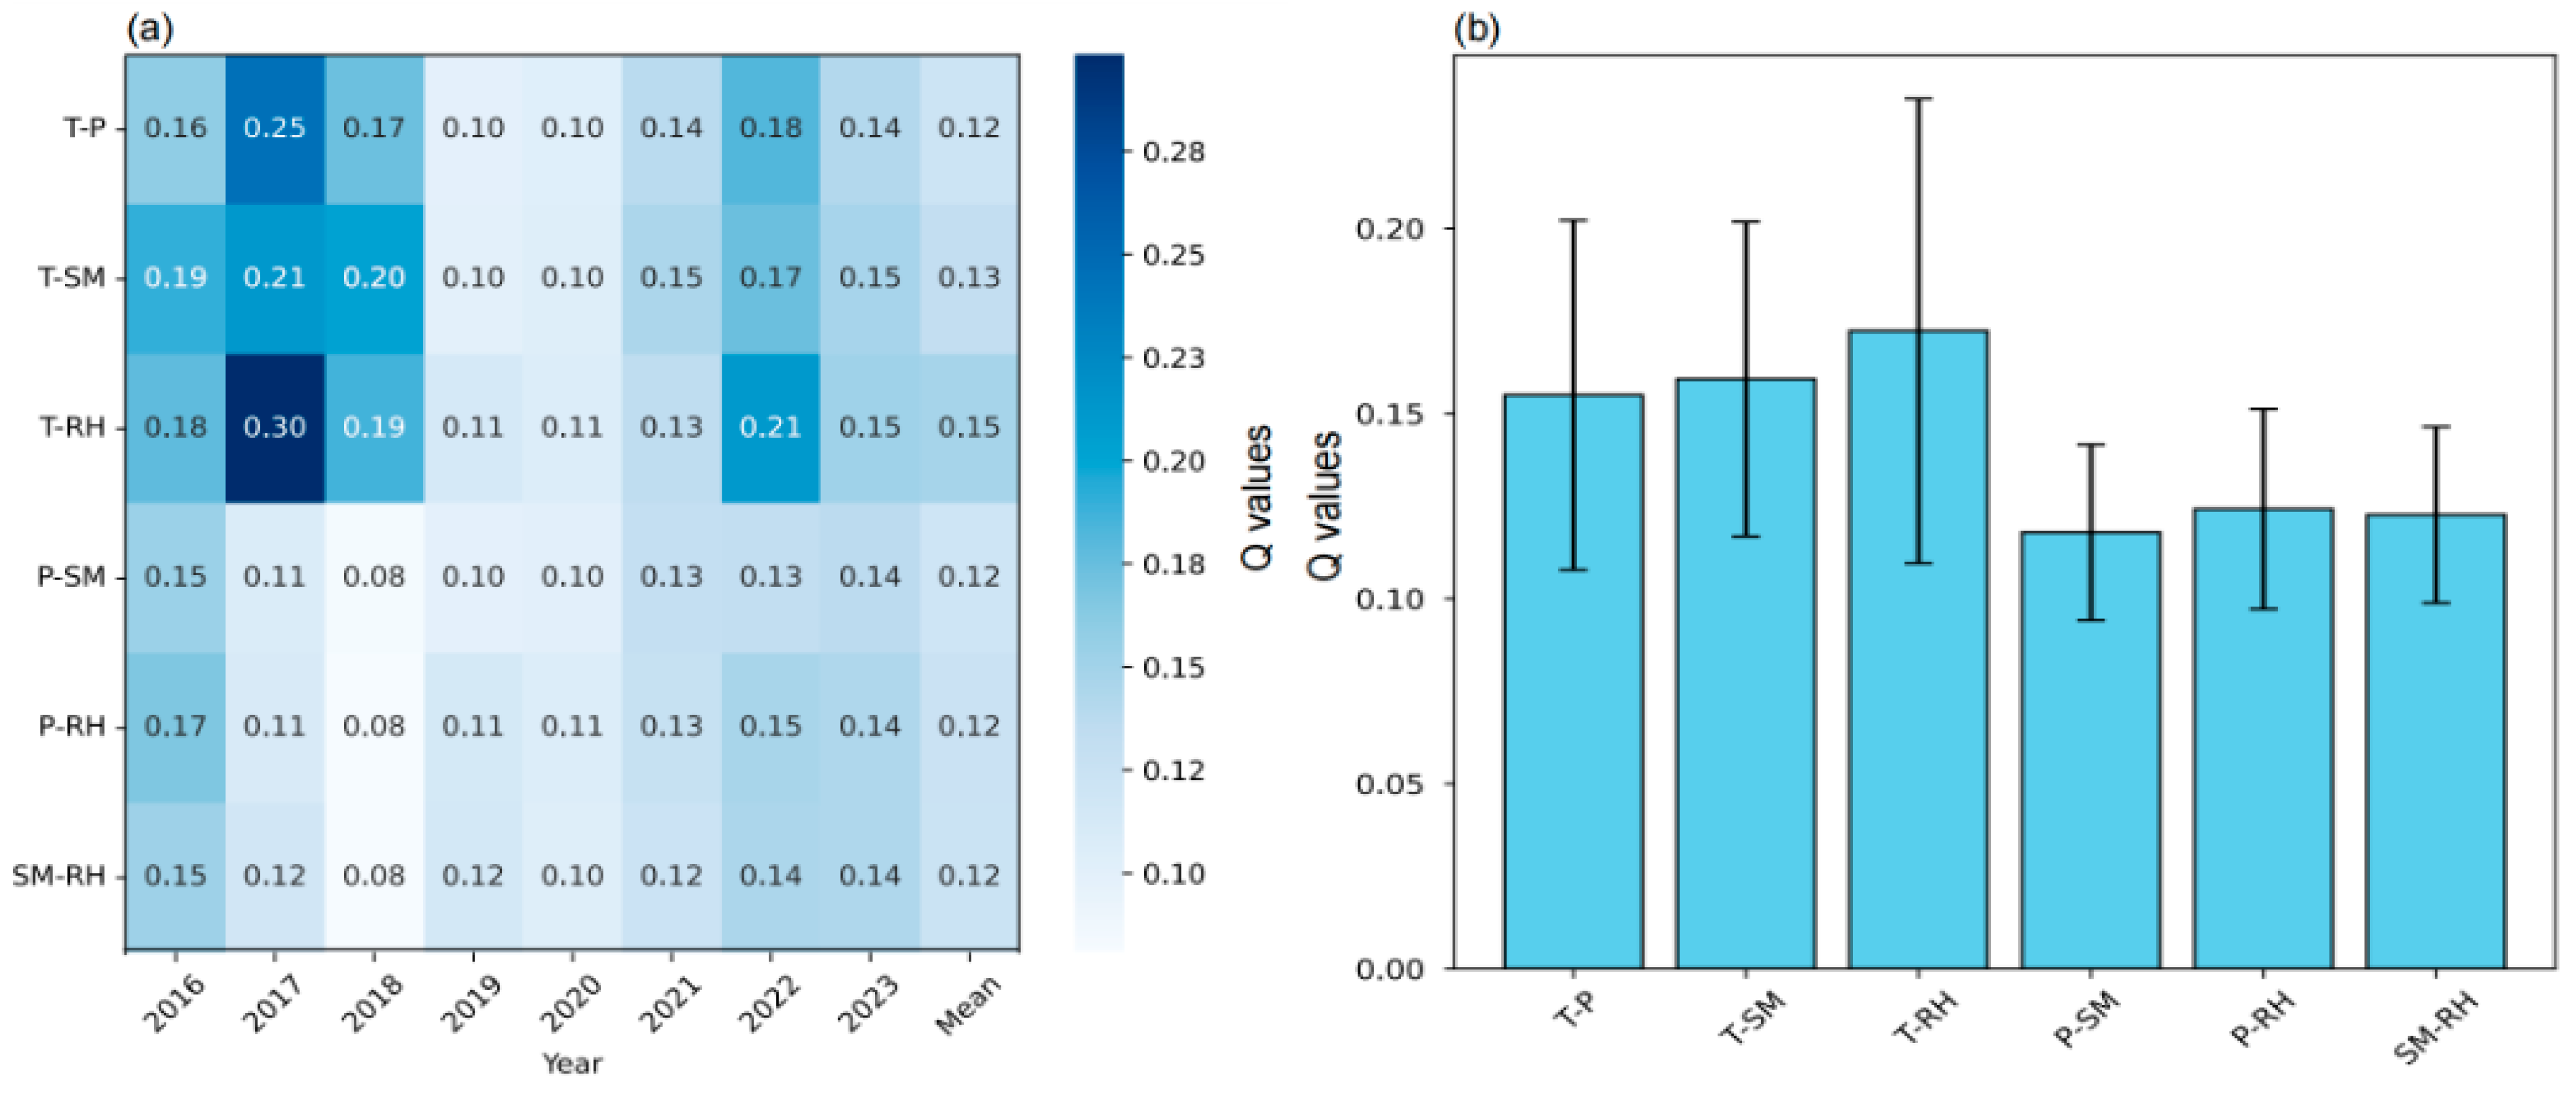
Interaction detection results revealed widespread significant bi-factor enhancement effects among the four meteorological variables, all of which elevated the explanatory power (Q values) for FRP spatial distribution in southwestern China beyond single-factor levels (Figure 8). Among the meteorological interactions, T∩RH was the most prominent, with a multi-year average Q = 0.1486 (σ = 0.0604), exceeding both RH (0.1223, σ = 0.022) and T (0.0750, σ = 0.028), and exhibiting the greatest interannual variability. This indicates that the synergistic amplification effect of “high temperature–low humidity” varied substantially across years. For instance, in 2017, T∩RH reached 0.2983, about 2.6 times higher than the 2019 low of 0.1128, demonstrating its dominant role in shaping FRP spatial heterogeneity under anomalously hot dry conditions. By contrast, in 2019, overall climatic forcing was weak, and interaction effects were generally low.
In the Geodetector framework, the relationship between Q(T∩RH) and the individual factors (Q(T), Q(RH)) reveals the interaction type. When Q(T∩RH) > max[Q(T), Q(RH)], it represents a bi-factor enhancement, meaning the two variables jointly increase explanatory power beyond their independent effects. When Q(T∩RH) > Q(T) + Q(RH), it reflects a non-linear enhancement, where the combined influence exceeds additive effects, indicating strong coupling and feedback. In this study, T∩RH = 0.1486 exceeded both T (0.0750) and RH (0.1223) and passed the significance test (p < 0.05), showing a clear bi-factor enhancement between temperature and humidity. In 2017, Q(T∩RH) even surpassed Q(T) + Q(RH), indicating non-linear enhancement under extreme hot dry conditions.
Physically, high temperature enhances evapotranspiration and heating, while low humidity directly reduces fuel moisture content; their coupling forms a hydrothermal synergy that intensifies fuel desiccation and FRP variability. This mechanism aligns with established findings that hot and dry conditions (high vapor pressure deficit, VPD) jointly lower live fuel moisture and promote extreme fire behavior [41,42,43].
Beyond T∩RH, both T∩SM (mean 0.1310, σ = 0.037) and T∩P (0.1218, σ = 0.047) also showed enhancement effects with pronounced fluctuations: higher in 2017 and 2022 (e.g., 2022 values of T∩RH = 0.2115, T∩SM = 0.1742, P∩RH = 0.1466), but lower during 2018–2019 (e.g., only T∩P was relatively high in 2018 at 0.1726, while other combinations declined; in 2019, T∩P = 0.0994, T∩SM = 0.1002). By comparison, P∩RH (0.1246, σ = 0.027) and SM∩RH (0.1233, σ = 0.027) were more stable and moderately enhanced, reflecting a background modulation role.
Overall, T∩RH emerged as the dominant interaction (highest mean and largest variability), while T∩SM and T∩P served as secondary but sensitive factors, with their explanatory power significantly enhanced under low water availability or anomalous years (e.g., 2017, 2022). In contrast, P∩RH and SM∩RH remained relatively stable. Mechanistically, RH, SM, and P directly reflect the wet–dry status of fuels and environment, determining fuel moisture content and combustibility. Temperature indirectly reduces fuel moisture by intensifying evapotranspiration and heating, making its influence more dependent on coupling with moisture conditions, consistent with the strong effect of T∩RH. From a management and early warning perspective, fire risk assessment and energy monitoring should avoid reliance on single factors, and instead adopt modeling frameworks that capture interactions and interannual non-stationarity. This provides a quantitative basis for fire risk management and intensity regulation under coupled hydrothermal conditions in southwestern China.
Looking ahead, climate projections indicate that warming and aridification will further heighten forest-fire risks in southwestern China. Model simulations suggest that rising temperatures and decreasing humidity will extend both the duration and intensity of high-fire-danger periods. Fan et al. [44] showed that escalating hot dry extremes amplify compound fire-weather risk globally. At the national scale, Shao et al. [45] predicted significantly higher fire occurrence probabilities across China under future climate scenarios, with temperature and precipitation identified as strong climatic controls.
These projections reinforce our findings that temperature and relative humidity are the key meteorological controls, and their coupling (hot dry synergy) exerts the strongest enhancement on fire radiative power. The expected intensification of compound heat–drought events will likely increase both fire frequency and CO2 emission magnitude, posing greater challenges for regional greenhouse gas mitigation and China’s carbon-peaking goals.

4. Discussion

4.1. Comparison with Database-Based Emission Results

The Global Fire Emissions Database, version 5 (GFED5), jointly developed by several international research institutions, is a global fire emission inventory constructed using a “bottom-up” approach. It employs MODIS burned area as the core input, corrected with higher-resolution data from Sentinel-2 and Landsat, and integrates vegetation cover, fuel load, combustion completeness, and emission factors to estimate fire emissions. GFED5 provides global emission data at 0.25° and monthly resolution, covering a wide range of gases and aerosol components, and serves as a key dataset for climate change studies, carbon cycle assessments, and atmospheric chemistry modeling [39]. For comparison, emission estimates corresponding to boreal and temperate forest categories in GFED5 were selected and clipped using the geographical extent of southwestern China to extract regional forest fire emissions.
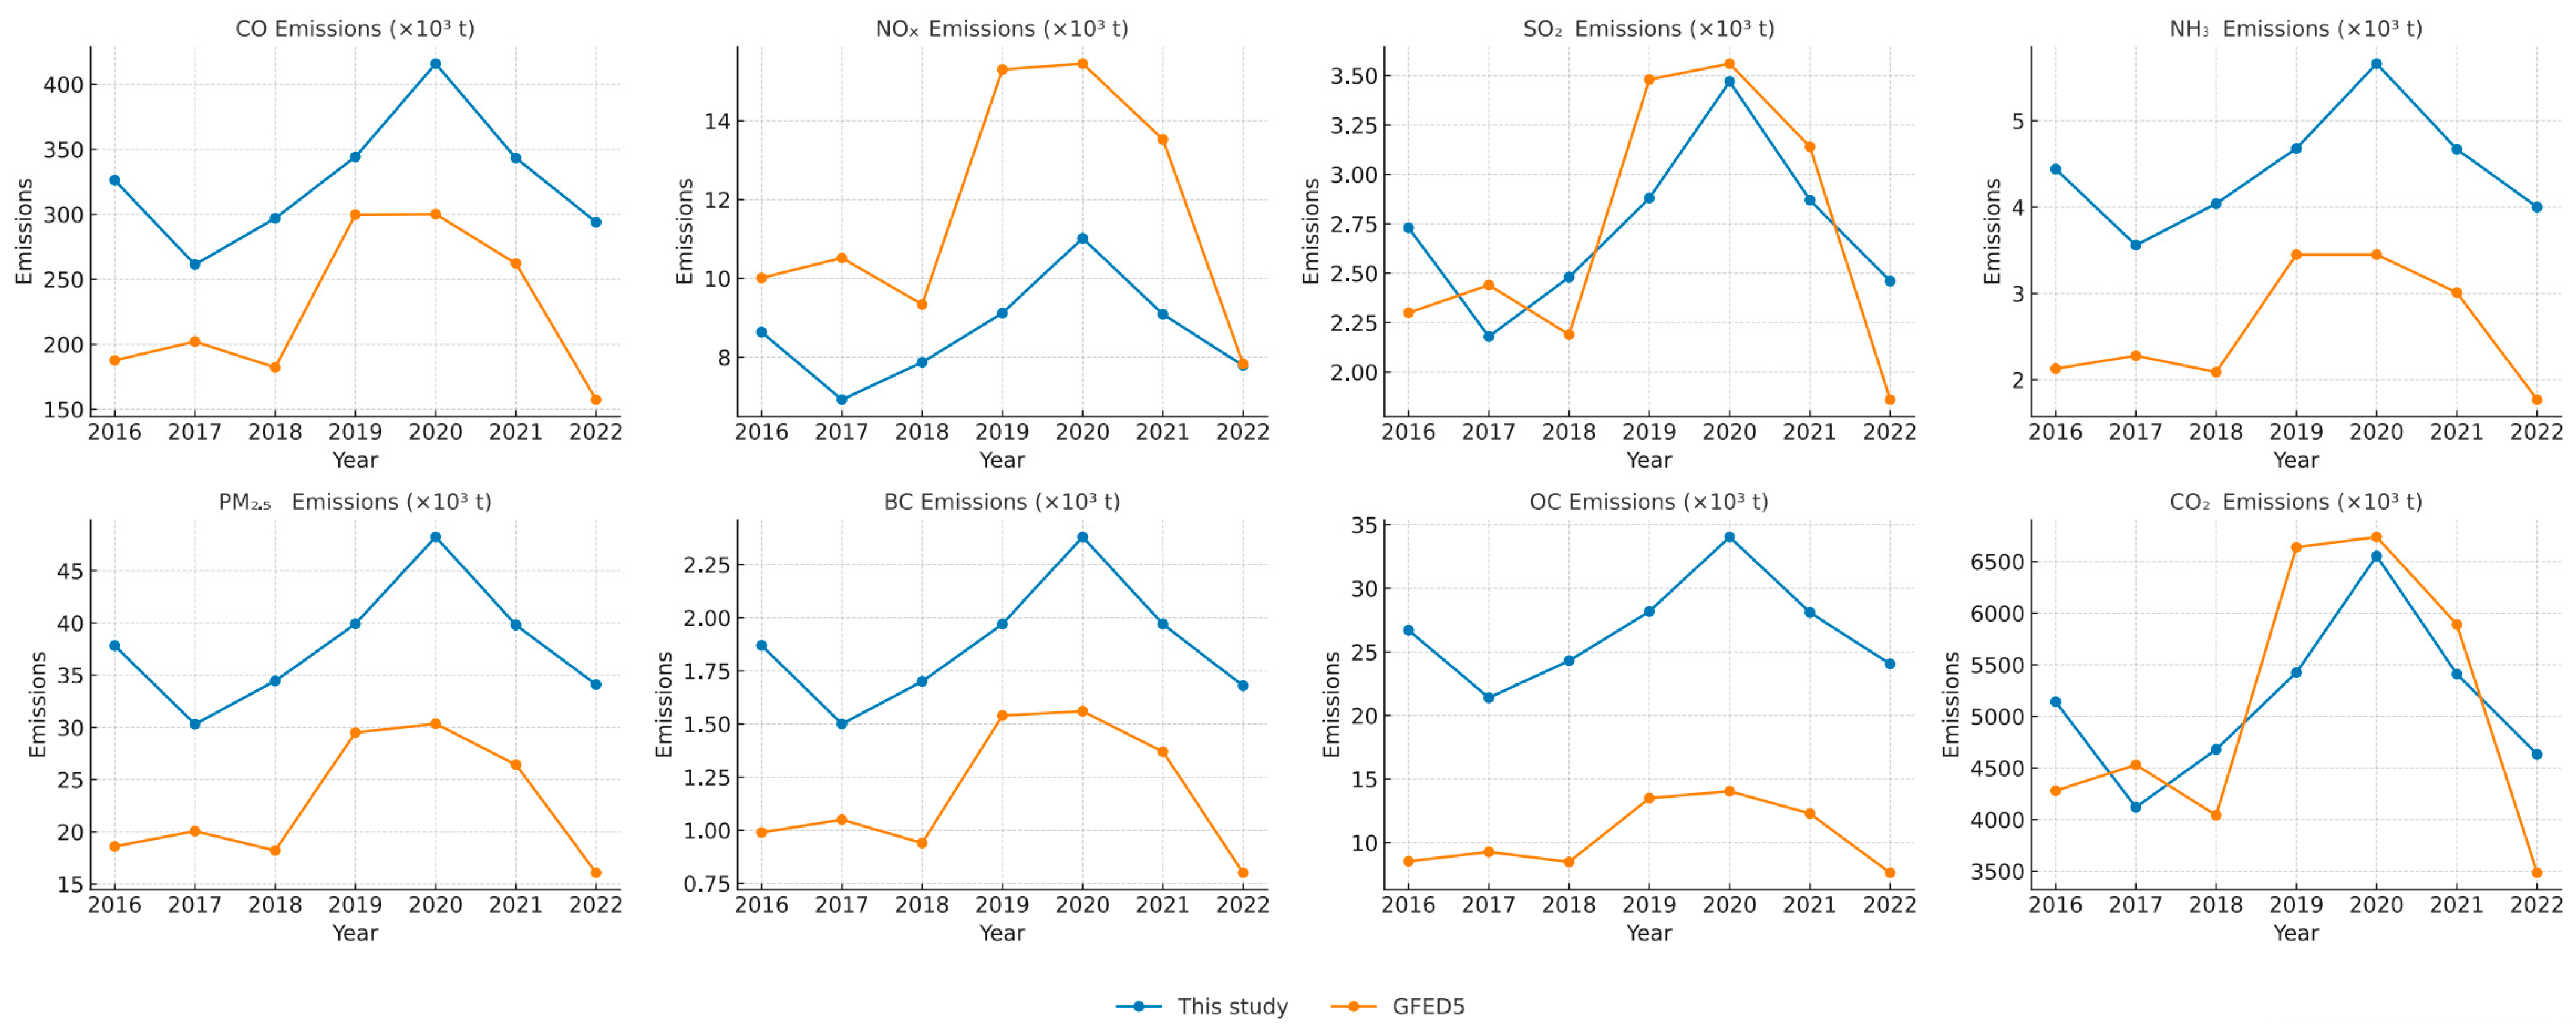
The comparison of forest fire emissions in southwestern China during 2016–2022 (Figure 9) shows that, although both this study and GFED5 capture broadly consistent interannual variations, noticeable discrepancies remain in emission magnitudes. For example, in 2017, this study reported substantially higher estimates of CO, NH3, PM2.5, BC, and OC than GFED5, marking a departure from the general consistency observed across years. Overall, our estimates of CO, NH3, PM2.5, BC, and OC exceeded those of GFED5, whereas GFED5 generally yielded higher values of NOx and CO2, with only minor differences for SO2. These divergences mainly arise from the choice of emission factors and satellite observation strategies. In this study, region-specific emission factors were employed to reflect combustion conditions in southwestern China; for instance, the CO factor (102.2 g/kg) and OC factor (8.37 g/kg) were higher than the global averages used in GFED5 (90.5 g/kg and 7.155 g/kg, respectively), better capturing incomplete combustion characteristics and thereby elevating CO, OC, and PM2.5 estimates [46]. Furthermore, the integration of Himawari-8/9, MODIS, and VIIRS data enables improved detection of small-scale and short-duration fires, enhancing the representation of low-temperature combustion products such as NH3 and OC. This multi-satellite fusion approach offers a more complete characterization of regional fire activity, particularly in the complex terrain of southwestern China.
By contrast, GFED5’s higher estimates of NOx and CO2 likely result from its globally uniform emission factors and stronger capability to capture high-intensity crown fires, under the assumption of more complete combustion. This assumption may lead to overestimation of CO2 emissions in open valleys or during dry years. For instance, the NOx emission factor used in GFED5 is based on global averages and does not sufficiently account for the mixed combustion characteristics typical of southwestern China, leading to potential overestimation of NOx emissions under high-temperature, complete combustion conditions. Overall, GFED5 emphasizes global consistency and model universality, while this study focuses more on regional adaptability, observational completeness, and improved small-scale fire detection. These differences underscore the value of our inventory for regional applications and highlight considerations for integrating region-specific emission factors and higher-resolution input data into global models.
Direct validation with ground or airborne measurements remains limited due to scarce field data in southwestern China. To provide a relative evaluation, our estimates were compared with GFED5, showing consistent temporal trends but differing emission magnitudes due to varying satellite inputs and emission factors.
Preliminary tests with hourly meteorological data revealed that short-term fluctuations introduced substantial noise and reduced model stability. Therefore, monthly ERA5-Land data were adopted, balancing computational feasibility and the ability to capture dominant climatic controls on fire activity. While this temporal resolution may smooth short-lived extremes such as heatwaves or wind bursts, it remains suitable for regional and long-term analyses. Future work should incorporate higher-temporal-resolution meteorological datasets and multi-source observations to improve cross-validation and reduce uncertainties in emission estimation.

4.2. Uncertainty Analysis

This study estimated forest fire pollutant emissions in southwestern China based on multi-source satellite observations from Himawari-8/9, MODIS, and VIIRS. Although synergistic observations enhanced the spatiotemporal coverage of fire detection, heterogeneity among datasets and model assumptions introduced substantial uncertainties. The three satellites differ markedly in observation frequency and spatial resolution. The adopted priority rule (“VIIRS > MODIS > Himawari”) ensures higher spatial precision while filling temporal gaps using Himawari-8/9’s high-frequency observations. However, this approach may still bias the representation of short-lived fires. Specifically, when only Himawari-8/9 detects transient or subpixel fires that are undetected by MODIS or VIIRS, their radiative energy and burned area may be underestimated due to the coarser spatial resolution of Himawari-8/9. Conversely, finer-resolution detections from MODIS/VIIRS may lead to slight FRE overestimation if temporal alignment with Himawari-8/9 is imperfect. Such temporal–spatial mismatches have been reported to cause FRE biases in regions with frequent small-scale fires [14,24]. In addition, cloud cover and topographic shadow effects influence each sensor differently, further amplifying spatial heterogeneity and omission or commission errors in fire detection.
The emission factors used in this study were primarily derived from literature and regional characteristics, but no differentiation was made among fire types detected by different satellites. For example, VIIRS frequently captures small-scale surface fires at 375 m resolution, which may have lower carbon emission efficiency than large-scale crown fires observed by Himawari-8/9. A uniform set of emission factors cannot fully capture these differences, resulting in biases between estimated emissions and actual combustion intensity. In addition, discrepancies in FRP retrieval algorithms among the satellites may introduce systematic biases for the same fire pixels, affecting the consistency of FRE calculations. Recent studies have further demonstrated that uncertainties in biomass burning emissions can arise from variations in fire detection products, combustion phases, and fuel conditions. Hua et al. [47] highlighted that estimates of CO and OC emissions differ markedly among inventories due to inconsistencies in fuel loading and burning conditions. Minsavage-Davis and Davies [48] showed that the accuracy of fire behavior models depends strongly on fuel characteristics and fire spread dynamics, implying that combustion efficiency may vary substantially across vegetation types. Similarly, Zheng et al. [49] found that seasonal shifts from flaming- to smoldering-dominated burning alter the temporal profiles of CO emissions, suggesting that fixed emission factors may not adequately represent such dynamic fire behavior.
In FRE computation, the Himawari-8/9 data were processed under the assumption of a uniform distribution of FRP between consecutive observations, while MODIS and VIIRS data employed Gaussian-based diurnal cycle parameterizations. These simplifications may not fully capture rapid fluctuations in FRP or short-lived fire events, potentially leading to uncertainties in cumulative FRE. For example, transient peaks in combustion intensity within the 10 min Himawari-8/9 sampling interval are approximated as linear changes, while the coarse revisit frequency of MODIS and VIIRS may smooth or miss sub-hourly fire peaks. Nevertheless, Gaussian diurnal reconstruction has been widely applied in global fire emission inventories to compensate for the sparse temporal coverage of polar-orbiting satellites, while linear interpolation between high-frequency geostationary observations remains a common approach for continuous energy estimation. Intercomparisons between polar-orbiting and geostationary satellites have demonstrated that these parameterizations yield consistent FRE estimates despite differences in temporal resolution [50,51,52]. Therefore, while we acknowledge that such assumptions may smooth short-term fire dynamics, they follow established and widely accepted practices. Future work will integrate higher-temporal-resolution datasets to better represent transient fire behavior and improve FRE accuracy.

5. Conclusions

(a)
From 2016 to 2023, the annual average emissions of ten major pollutants from forest fires in southwestern China were CO2 (5623.58 ± 1554.33), CO (356.84 ± 98.63), PM2.5 (41.39 ± 11.44), PM10 (44.46 ± 12.29), VOCs (63.36 ± 17.51), NOx (9.45 ± 2.61), SO2 (2.98 ± 0.82), NH3 (4.86 ± 1.34), BC (2.04 ± 0.56), and OC (29.21 ± 8.08) (units: ×103 t·a−1). Among these, CO2 and CO were the dominant pollutants.
(b)
Spatially, Yunnan Province and Sichuan Province were the core contributors to CO2 emissions. Strengthening monitoring, early warning, and emission control in these two provinces is critical for maintaining regional carbon balance and improving air quality. Temporally, CO2 emissions were higher during daytime than at night and were concentrated between January–April and December.
(c)
CO2 emissions increased with rising temperature and decreased with precipitation, exhibiting the overall pattern of “high temperature promotes emissions, while humidity suppresses fires.” The emissions demonstrated nonlinear and interactive relationships with meteorological factors, with the strongest interaction between temperature and relative humidity in winter. Under cold-dry conditions, elevated temperatures combined with low humidity were more likely to trigger fires and amplify carbon emissions.

Author Contributions

L.F.: Methodology, validation, writing original draft preparation. Y.H.: software, investigation. J.L.: Formal analysis, data gathering, review, and editing. W.G.: Conceptualization, supervision, validation, review, and editing. All authors have read and agreed to the published version of the manuscript.

Funding

This research was supported by “the Fundamental Research Funds for the Central Universities” [No. 2682024CX102].

Institutional Review Board Statement

Not applicable.

Informed Consent Statement

Not applicable.

Data Availability Statement

Data is contained within the article.

Conflicts of Interest

The authors declare no conflicts of interest.

Abbreviations

The following abbreviations are used in this manuscript:
AHIAdvanced Himawari Imager
BCBlack Carbon
CO2Carbon Dioxide
ECMWFEuropean Centre for Medium-Range Weather Forecasts
ERA5-LandECMWF Re-Analysis 5-Land
FRPFire Radiative Power
FREFire Radiative Energy
GFED5Global Fire Emissions Database version 5
MODISModerate Resolution Imaging Spectroradiometer
NH3Ammonia
NOXNitrogen Oxides (NO + NO2)
OCOrganic Carbon
PM2.5Fine Particulate Matter (aerodynamic diameter ≤ 2.5 μm)
PM10Inhalable Particulate Matter (aerodynamic diameter ≤ 10 μm)
RHRelative Humidity
SO2Sulfur Dioxide
VOCsVolatile Organic Compounds
VIIRSVisible Infrared Imaging Radiometer Suite

References

  1. IPCC. Climate Change 2021: The Physical Science Basis. In Contribution of Working Group I to the Sixth Assessment Report of the Intergovernmental Panel on Climate Change; Cambridge University Press: Cambridge, UK, 2021. [Google Scholar]
  2. Pimm, S.L.; Raven, P. Extinction by numbers. Nature 2000, 403, 843–845. [Google Scholar] [CrossRef]
  3. Garcia-Hurtado, E.; Pey, J.; Borrás, E.; Sánchez, P.; Vera, T.; Carratalá, A.; Alastuey, A.; Querol, X.; Vallejo, V.R. Atmospheric PM and volatile organic compounds released from Mediterranean shrubland wildfires. Atmos. Environ. 2014, 89, 303–311. [Google Scholar] [CrossRef]
  4. Guo, Y.X.; Wei, M.; Tian, M.Y.; Sun, X.Y.; Zheng, W.X.; Ma, Y.F.; Guo, F.T. Characteristics of smoke and particulate matter released by combustion of eight main tree species in Yunnan Province. Res. Environ. Sci. 2021, 34, 2295–2305. [Google Scholar]
  5. Park, C.Y.; Takahashi, K.; Fujimori, S.; Jansakoo, T.; Burton, C.; Huang, H.; Kou-Giesbrecht, S.; Reyer, C.P.O.; Mengel, M.; Burke, E.; et al. Attributing human mortality from fire PM2.5 to climate change. Nat. Clim. Change 2024, 14, 1193–1200. [Google Scholar] [CrossRef]
  6. Wang, M.; Jiang, C.; Sun, O.J. Spatially differentiated changes in regional climate and underlying drivers in southwestern China. J. For. Res. 2022, 33, 755–765. [Google Scholar] [CrossRef]
  7. Tian, X.R.; Zhao, F.J.; Shu, L.F.; Wang, M.Y. Hotspots from satellite monitoring and forest fire weather index analysis for Southwest China. For. Res. 2010, 23, 523–529. [Google Scholar]
  8. Ning, X.C.; Li, J.W.; Zhuang, P.K.; Lai, S.F.; Zheng, X.G. Wildfire combustion emission inventory in Southwest China (2001–2020) based on MODIS fire radiative energy data. Atmos. Pollut. Res. 2024, 15, 102279. [Google Scholar] [CrossRef]
  9. He, J.; Zhang, Y. Analysis of the impacts of meteorological factors on forest fire danger in the conterminous United States. J. Geophys. Res. Atmos. 2021, 126, e2021JD035376. [Google Scholar] [CrossRef]
  10. Lund, M.T.; Nordling, K.; Gjelsvik, A.B.; Samset, B.H. The influence of variability on fire weather conditions in high latitude regions under present and future global warming. Environ. Res. Commun. 2023, 5, 065016. [Google Scholar] [CrossRef]
  11. Feng, Y.; Lei, C.F.; Pan, Y.; Zhang, C.J. Forest fire monitoring based on satellite remote sensing technology. Geomat. Technol. Equip. 2022, 24, 15–19. [Google Scholar]
  12. Justice, C.O.; Vermote, E.; Townshend, J.R.G.; Defries, R.; Roy, D.P.; Hall, D.K. The Moderate Resolution Imaging Spectroradiometer (MODIS): Land remote sensing for global change research. IEEE Trans. Geosci. Remote Sens. 1998, 36, 1228–1249. [Google Scholar] [CrossRef]
  13. Giglio, L.; Descloitres, J.; Justice, C.O.; Kaufman, Y.J. An enhanced contextual fire detection algorithm for MODIS. Remote Sens. Environ. 2003, 87, 273–282. [Google Scholar] [CrossRef]
  14. Schroeder, W.; Oliva, P.; Giglio, L.; Csiszar, I.A. The new VIIRS 375 m active fire detection data product: Algorithm description and initial assessment. Remote Sens. Environ. 2014, 143, 85–96. [Google Scholar] [CrossRef]
  15. Chen, J.; Lv, Q.; Wu, S.; Zeng, Y.; Li, M.; Chen, Z.; Zhou, E.; Zheng, W.; Liu, C.; Chen, X.; et al. An adapted hourly Himawari-8 fire product for China: Principle, methodology and verification. Earth Syst. Sci. Data 2023, 15, 1911–1931. [Google Scholar] [CrossRef]
  16. Lu, X.M.; Zhang, X.Y.; Li, F.J.; Cochrane, M.A. Improved estimation of fire particulate emissions using a combination of VIIRS and AHI data for Indonesia during 2015–2020. Remote Sens. Environ. 2022, 281, 113238. [Google Scholar] [CrossRef]
  17. Zheng, Y.M.; Liu, J.; Jian, H.D.; Fan, X.T.; Yan, F.L. Fire diurnal cycle derived from a combination of the Himawari-8 and VIIRS satellites to improve fire emission assessments in Southeast Australia. Remote Sens. 2021, 13, 2852. [Google Scholar] [CrossRef]
  18. Wickramasinghe, C.H.; Wallace, L.; Reinke, K.; Jones, S. Intercomparison of Himawari-8 AHI-FSA with MODIS and VIIRS active fire products. Int. J. Digit. Earth 2020, 13, 457–473. [Google Scholar] [CrossRef]
  19. Wooster, M.J.; Roberts, G.; Perry, G.L.W.; Kaufman, Y.J. Retrieval of biomass combustion rates and totals from fire radiative power observations: FRP derivation and calibration relationships between biomass consumption and fire radiative energy release. J. Geophys. Res. Atmos. 2005, 110, D24311. [Google Scholar] [CrossRef]
  20. Liu, M.X.; Song, Y.; Yao, H.; Kang, Y.N.; Li, M.M.; Huang, X.; Hu, M. Estimating emissions from agricultural fires in the North China Plain based on MODIS fire radiative power. Atmos. Environ. 2015, 112, 326–334. [Google Scholar] [CrossRef]
  21. Vermote, E.; Ellicott, E.; Dubovik, O.; Lapyonok, T.; Chin, M.; Giglio, L.; Roberts, G.J. An approach to estimate global biomass burning emissions of organic and black carbon from MODIS fire radiative power. J. Geophys. Res. Atmos. 2009, 114, D18205. [Google Scholar] [CrossRef]
  22. Xu, Y.Q.; Huang, Z.J.; Ou, J.M.; Jia, G.L.; Wu, L.L.; Liu, H.L.; Lu, M.H.; Fan, M.; Wei, J.; Chen, L.F.; et al. Near-real-time estimation of hourly open biomass burning emissions in China using multiple satellite retrievals. Sci. Total Environ. 2022, 817, 152777. [Google Scholar] [CrossRef]
  23. Li, R.; Liu, J.X.; Zhang, M.D.; Huang, C.W.; Zhao, S.H.; Zhang, M.G.; Cheng, L.F. Development and analysis of a forest fire emission inventory in China considering daily variation patterns. Environ. Pollut. 2025, 382, 126720. [Google Scholar] [CrossRef] [PubMed]
  24. Kang, Y.; Im, J. Mitigating underestimation of fire emissions from the Advanced Himawari Imager: A machine learning and multi-satellite ensemble approach. Int. J. Appl. Earth Obs. Geoinf. 2024, 128, 103784. [Google Scholar] [CrossRef]
  25. Xu, Y.Q. Study on the Evolution Characteristics and Dynamic Representation of Open Biomass Burning Emissions in China. Ph.D. Thesis, South China University of Technology, Guangzhou, China, 2020. [Google Scholar]
  26. Anderson, L.D.; Dix, B.; Schnell, J.; Yokelson, R.; Veefkind, J.P.; Ahmadov, R.; de Gouw, J. Analyzing the impact of evolving combustion conditions on the composition of wildfire emissions using satellite data. Geophys. Res. Lett. 2023, 50, e2023GL105811. [Google Scholar] [CrossRef]
  27. Roy, D.P.; Boschetti, L.; Smith, A.M.S. Satellite remote sensing of fires. In Fire Phenomena and the Earth System; Wiley: Hoboken, NJ, USA, 2013; Chapter 5. [Google Scholar] [CrossRef]
  28. Santoso, M.A. Review of the transition from smouldering to flaming combustion in wildfires. Front. Mech. Eng. 2019, 5, 49. [Google Scholar] [CrossRef]
  29. Garg, P.; Wang, S.; Oakes, J.M.; Bellini, C.; Gollner, M.J. Variations in gaseous and particulate emissions from flaming and smouldering combustion of Douglas fir and lodgepole pine under different fuel moisture conditions. Combust. Flame 2024, 263, 113386. [Google Scholar] [CrossRef]
  30. Keeley, J.E. Fire intensity, fire severity and burn severity: A brief review and suggested usage. Int. J. Wildland Fire 2009, 18, 116–126. [Google Scholar] [CrossRef]
  31. Fernandes, P.M.; Botelho, H.S. A review of prescribed burning effectiveness in fire hazard reduction. Int. J. Wildland Fire 2003, 12, 117–128. [Google Scholar] [CrossRef]
  32. Andreae, M.O. Emission of trace gases and aerosols from biomass burning—An updated assessment. Atmos. Chem. Phys. 2019, 19, 8523–8546. [Google Scholar] [CrossRef]
  33. Streets, D.G.; Bond, T.C.; Carmichael, G.R.; Fernandes, S.D.; Fu, Q.; He, D.; Klimont, Z.; Nelson, S.M.; Tsai, N.Y.; Wang, M.Q.; et al. An inventory of gaseous and primary aerosol emissions in Asia in the year 2000. J. Geophys. Res. Atmos. 2003, 108, D21. [Google Scholar] [CrossRef]
  34. Andreae, M.O.; Merlet, P. Emission of trace gases and aerosols from biomass burning. Glob. Biogeochem. Cycles 2001, 15, 955–966. [Google Scholar] [CrossRef]
  35. Wu, J.; Kong, S.F.; Wu, F.Q.; Cheng, Y.; Zheng, S.R.; Yan, Q.; Zheng, H.; Yang, G.W.; Zheng, M.M.; Liu, D.T.; et al. Estimating the open biomass burning emissions in central and eastern China from 2003 to 2015. Atmos. Chem. Phys. 2018, 18, 11623–11646. [Google Scholar] [CrossRef]
  36. Freeborn, P.H.; Wooster, M.J.; Hao, W.M.; Ryan, C.A.; Nordgren, B.L.; Baker, S.P.; Ichoku, C. Relationships between energy release, fuel mass loss, and trace gas and aerosol emissions during laboratory biomass fires. J. Geophys. Res. Atmos. 2008, 113, D01301. [Google Scholar] [CrossRef]
  37. Song, Y.; Liu, B.; Miao, W.J.; Chang, D.; Zhang, Y.H. Spatiotemporal variation in nonagricultural open fire emissions in China from 2000 to 2007. Glob. Biogeochem. Cycles 2009, 23, GB2008. [Google Scholar] [CrossRef]
  38. Fan, H.; Yang, X.; Zhao, C.; Yang, Y.K.; Shen, Z.Y. Spatiotemporal variation characteristics of global fires and their emissions. Atmos. Chem. Phys. 2023, 23, 7781–7798. [Google Scholar] [CrossRef]
  39. Chen, Y.; Hall, J.; van Wees, D.; Andela, N.; Hantson, S.; Giglio, L.; van der Werf, G.R.; Morton, D.C.; Randerson, J.T. Multi-decadal trends and variability in burned area from the fifth version of the Global Fire Emissions Database (GFED5). Earth Syst. Sci. Data 2023, 15, 5227–5259. [Google Scholar] [CrossRef]
  40. Wang, J.F.; Xu, C.D. Geodetector: Principle and prospective. Acta Geogr. Sin. 2017, 72, 116–134. [Google Scholar] [CrossRef]
  41. Abatzoglou, J.T.; Williams, A.P. Impact of anthropogenic climate change on wildfire across western US forests. Proc. Natl. Acad. Sci. USA 2016, 113, 11770–11775. [Google Scholar] [CrossRef]
  42. Pimont, F.; Ruffault, J.; Martin-StPaul, N.K.; Dupuy, J.-L. Why is the effect of live fuel moisture content on fire rate of spread underestimated in field experiments in shrublands? Int. J. Wildland Fire 2019, 28, 127–137. [Google Scholar] [CrossRef]
  43. Ma, W.; Zhai, L.; Pivovaroff, A.; Shuman, J.; Buotte, P.; Ding, J.; Christoffersen, B.; Knox, R.; Moritz, M.; Fisher, R.A.; et al. Assessing climate change impacts on live fuel moisture and wildfire risk using a hydrodynamic vegetation model. Biogeosci. Discuss. 2021, 18, 4005–4020. [Google Scholar] [CrossRef]
  44. Fan, X.W.; Miao, C.Y.; Zscheischler, J.; Slater, L.; Wu, Y.; Chai, Y.; Aghakouchak, A. Escalating Hot-Dry Extremes Amplify Compound Fire Weather Risk. Earth’s Future 2023, 11, e2023EF003976. [Google Scholar] [CrossRef]
  45. Shao, Y.K.; Fan, G.P.; Feng, Z.K.; Sun, L.H.; Yang, X.H.; Ma, T.T.; Li, X.S.; Fu, H.N.; Wang, A.A. Prediction of Forest Fire Occurrence in China under Climate Change Scenarios. J. For. Res. 2023, 34, 1217–1228. [Google Scholar] [CrossRef]
  46. Van der Werf, G.R.; Randerson, J.T.; Giglio, L.; Van Leeuwen, T.T.; Chen, Y.; Rogers, B.M.; Mu, M.; Van Marle, M.J.E.; Morton, D.C.; Collatz, G.J.; et al. Global fire emissions estimates during 1997–2016. Earth Syst. Sci. Data 2017, 9, 697–720. [Google Scholar] [CrossRef]
  47. Hua, W.X.; Lou, S.J.; Huang, X.; Xue, L.; Ding, K.; Wang, Z.; Ding, A.J. Diagnosing uncertainties in global biomass burning emission inventories and their impact on modeled air pollutants. Atmos. Chem. Phys. 2024, 24, 6787–6807. [Google Scholar] [CrossRef]
  48. Minsavage-Davis, C.D.; Davies, G.M. Evaluating the Performance of Fire Rate of Spread Models in Northern-European Calluna vulgaris Heathlands. Fire 2022, 5, 46. [Google Scholar] [CrossRef]
  49. Zheng, B.; Chevallier, F.; Yin, Y.; Wang, Y.L. On the role of the flaming-to-smoldering transition in the seasonal cycle of African fire emissions. Geophys. Res. Lett. 2018, 45, 6633–6641. [Google Scholar] [CrossRef]
  50. Kaiser, J.W.; Heil, A.; Andreae, M.O.; Benedetti, A.; Chubarova, N.; Jones, L.; Morcrette, J.-J.; Razinger, M.; Schultz, M.G.; Suttie, M.; et al. Biomass burning emissions estimated with a global fire assimilation system based on observed fire radiative power. Biogeosciences 2012, 9, 527–554. [Google Scholar] [CrossRef]
  51. Andela, N.; Morton, D.C.; Giglio, L.; Chen, Y.; Van der Werf, G.R.; Kasibhatla, P.S.; DeFries, R.S.; Collatz, G.J.; Hantson, S.; Kloster, S.; et al. A human-driven decline in global burned area. Science 2017, 356, 1356–1362. [Google Scholar] [CrossRef]
  52. Roberts, G.; Wooster, M.J.; Lagoudakis, E. Annual and diurnal African biomass burning temporal dynamics. Biogeosciences 2009, 6, 849–866. [Google Scholar] [CrossRef]
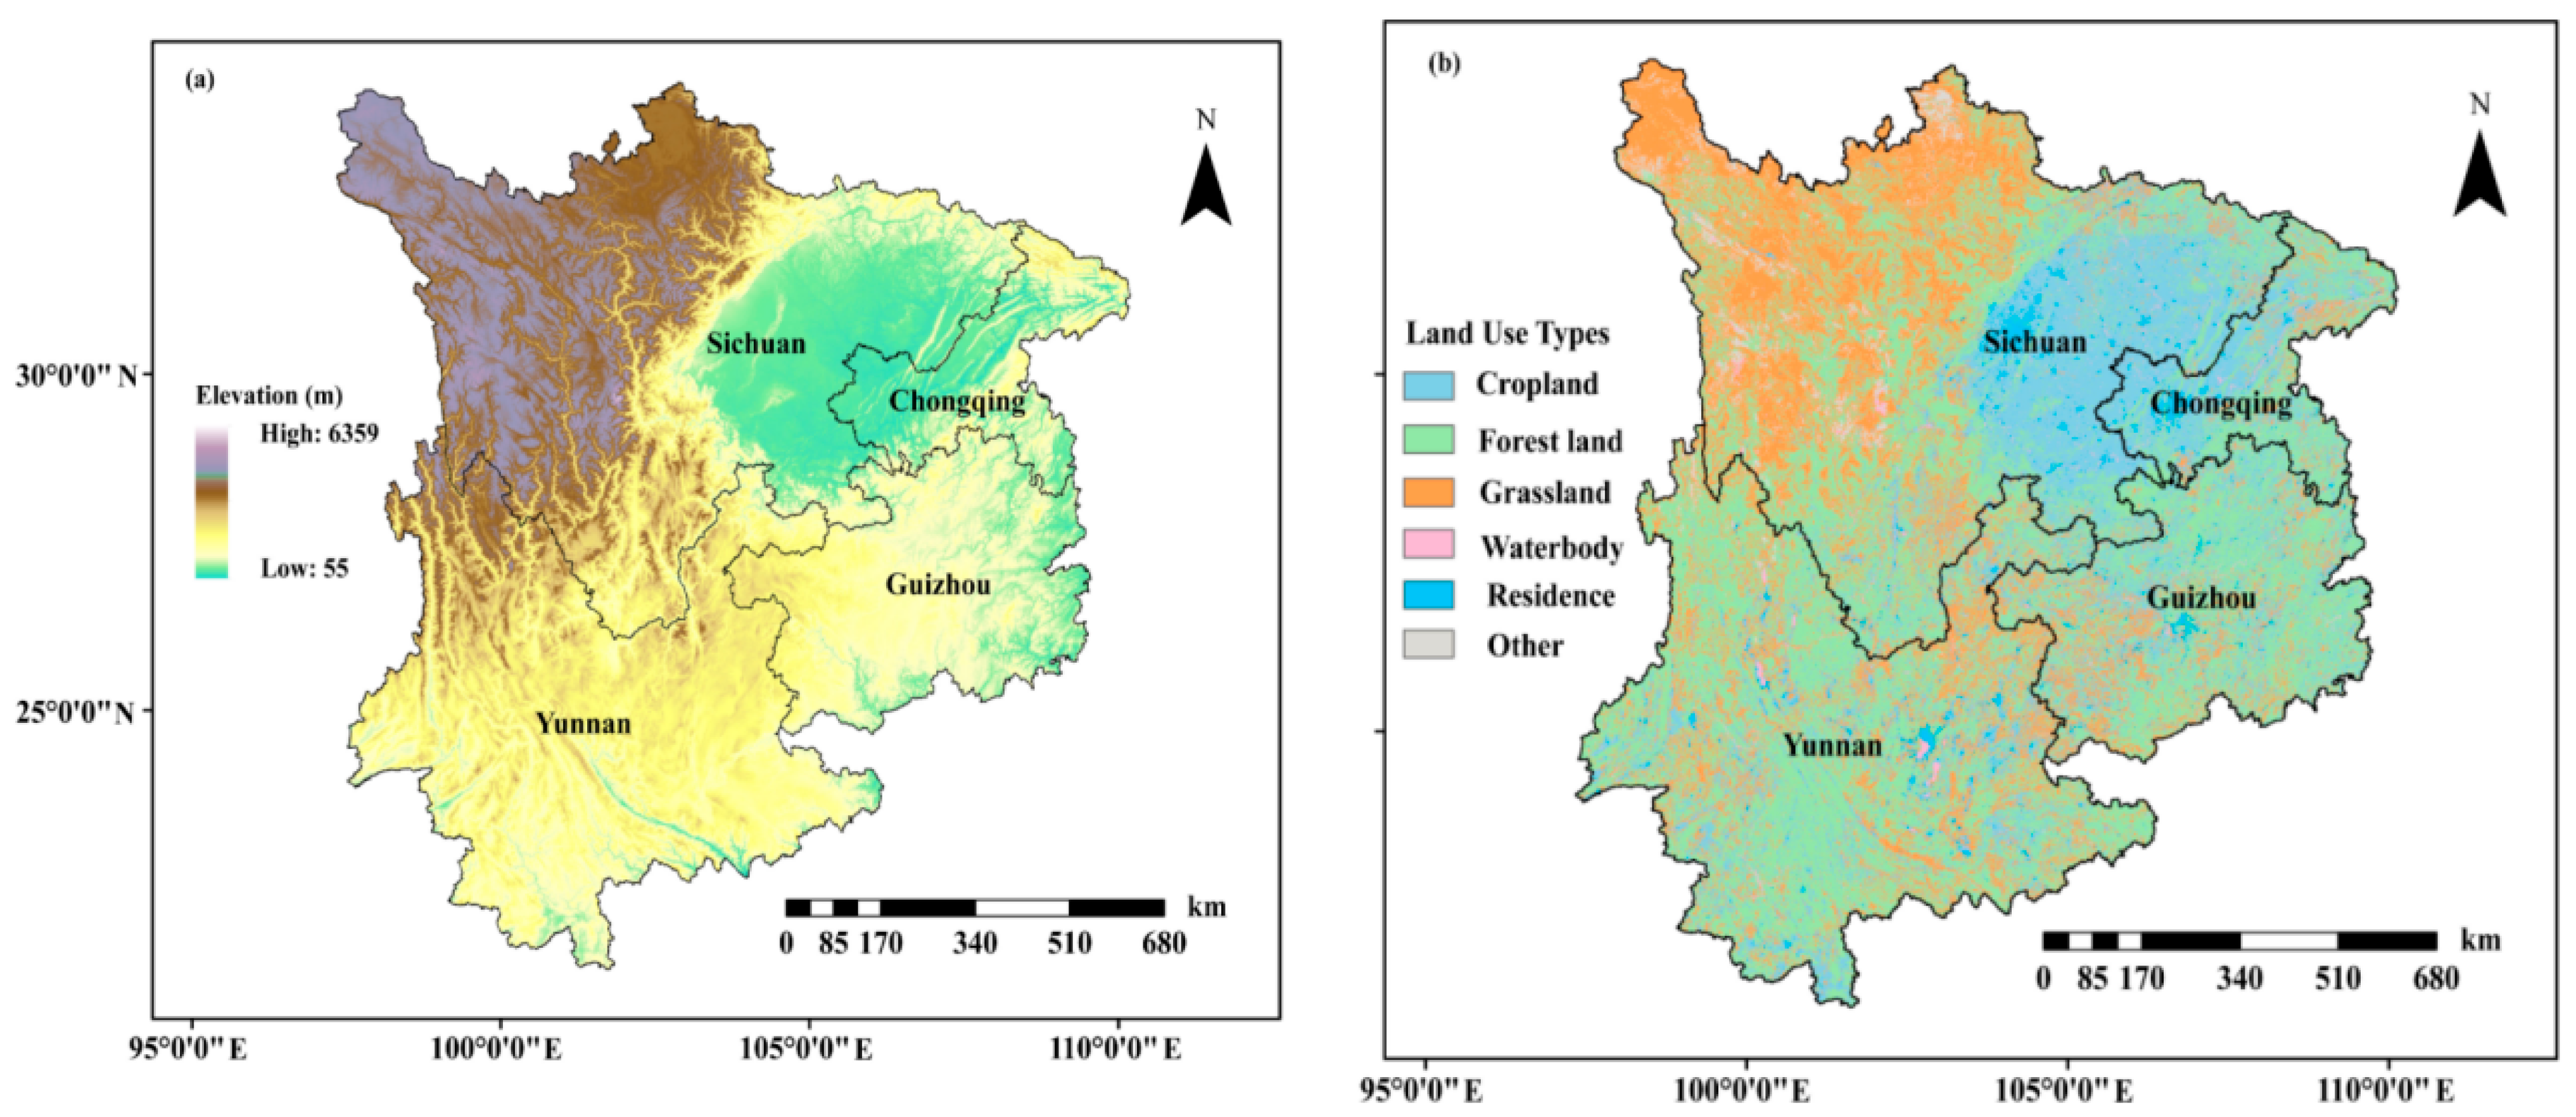
Figure 1. (a) Elevation distribution across the four provinces of southwestern China; (b) land use type distribution across the four provinces of southwestern China.
Atmosphere 16 01187 g001
Figure 2. Interannual variation in forest fire hotspots (a) and spatial distribution of forest fire hotspots (b) monitored by Himawari-8/9, MODIS, and VIIRS in southwestern China during 2016–2023.
Atmosphere 16 01187 g002
Figure 3. Proportion and total amounts of forest fire hotspots (a) and proportion and total amounts of CO2 emissions (b) in southwestern China from 2016 to 2023.
Atmosphere 16 01187 g003
Figure 4. Distribution of forest fire hotspot density across prefecture-level cities in southwestern China from 2016 to 2023.
Atmosphere 16 01187 g004
Figure 5. Diurnal (a), monthly (b), and annual (c) variations in CO2 emissions from forest fires in southwest China during 2016–2023.
Atmosphere 16 01187 g005
Figure 6. Interannual (a) and monthly (b) variations in CO2 emissions from forest fires in southwestern China, in relation to temperature and precipitation.
Atmosphere 16 01187 g006
Figure 7. Yearly and average factor detector Q values (a) and mean ± SD of factor detector Q values (b) of meteorological factors (2016–2023).
Atmosphere 16 01187 g007
Figure 8. Yearly and average interaction detector Q values (a) and mean ± SD of interaction detector Q values (b) of meteorological factor pairs (2016–2023).
Atmosphere 16 01187 g008
Figure 9. Comparison of pollutant emissions from forest fires in southwest China with GFED5.
Atmosphere 16 01187 g009
Table 1. Emission factor of air pollutants from forest fire combustion (g/MJ).
CO2COPM2.5SO2NOXOCVOCSNH3PM10BCReference
664.2042.64/0.291.234.475.490.40nan0.23[32]
643.2943.87nan0.411.233.7511.390.57nan0.23[33]
643.2943.875.330.411.232.518.930.575.130.23[34]
698.3535.104.810.231.162.854.160.435.310.32Average [37]
652.4544.014.430.410.683.587.240.89nan0.19Average [35]
660.3241.904.860.351.113.437.440.575.220.24Overall Average
In this study, following references [27,28,36], the conversion coefficient between biomass and energy was adopted as 0.41 kg/MJ.
Table 2. Pollutant emissions from forest fires in southwestern China during 2016–2023 (×103 t).
Year CONOxSO2NH3VOCsPM2.5PM10BCOCCO2
2016Guizhou29.290.780.240.405.203.403.650.172.40461.59
Sichuan59.011.560.490.8010.486.847.350.344.83929.96
Yunnan233.706.191.953.1841.5027.1129.111.3419.133682.98
Chongqing4.250.110.040.060.750.490.530.020.3566.98
Total326.258.642.734.4457.9337.8440.641.8726.715141.51
2017Guizhou32.690.870.270.445.803.794.070.192.68515.18
Sichuan63.031.670.530.8611.197.317.850.365.16993.32
Yunnan161.584.281.352.2028.6918.7420.130.9313.232546.41
Chongqing4.050.110.030.060.720.470.500.020.3363.83
Total261.356.922.183.5646.4130.3132.561.5021.394118.73
2018Guizhou64.561.710.540.8811.467.498.040.375.281017.43
Sichuan69.521.840.580.9512.348.068.660.405.691095.60
Yunnan159.694.231.332.1728.3618.5219.890.9113.072516.62
Chongqing3.210.090.030.040.570.370.400.020.2650.59
Total296.987.872.484.0452.7334.4537.001.7024.314680.23
2019Guizhou45.441.200.380.628.075.275.660.263.72716.11
Sichuan55.831.480.470.769.916.486.960.324.57879.85
Yunnan240.316.372.013.2742.6727.8729.941.3819.673787.15
Chongqing2.620.070.020.040.470.300.330.020.2141.29
Total344.209.122.884.6861.1239.9242.881.9728.185424.39
2020Guizhou76.252.020.641.0413.548.849.500.446.241201.66
Sichuan118.613.140.991.6121.0613.7614.780.689.711869.15
Yunnan219.035.801.832.9838.8925.4127.291.2517.933451.80
Chongqing1.970.050.020.030.350.230.250.010.1631.05
Total415.8611.023.475.6673.8448.2451.812.3834.046553.65
2021Guizhou93.832.490.781.2816.6610.8811.690.547.681478.71
Sichuan95.842.540.801.3017.0211.1211.940.557.851510.38
Yunnan151.554.011.272.0626.9117.5818.880.8712.412388.34
Chongqing2.030.050.020.030.360.240.250.010.1731.99
Total343.259.092.874.6760.9539.8142.761.9728.105409.42
2022Guizhou59.601.580.500.8110.586.917.430.344.88939.26
Sichuan72.471.920.610.9912.878.419.030.425.931142.09
Yunnan152.614.041.272.0827.1017.7019.010.8712.492405.05
Chongqing9.270.250.080.131.651.081.150.050.76146.09
Total293.957.792.464.0052.2034.1036.621.6824.064632.48
2023Guizhou78.612.080.661.0713.969.129.790.456.441238.85
Sichuan108.942.890.911.4819.3412.6413.570.628.921716.83
Yunnan383.0010.153.205.2168.0144.4247.722.1931.356035.86
Chongqing2.330.060.020.030.410.270.290.010.1936.72
Total572.8815.184.797.79101.7266.4571.373.2846.909028.26
Disclaimer/Publisher’s Note: The statements, opinions and data contained in all publications are solely those of the individual author(s) and contributor(s) and not of MDPI and/or the editor(s). MDPI and/or the editor(s) disclaim responsibility for any injury to people or property resulting from any ideas, methods, instructions or products referred to in the content.