Article

Study on the Interaction Effect of Negative Air Ions and Nitrogen Oxide Concentrations in Urban Forest Ecosystems Driven by Meteorological Factors

1
Institute of Forestry and Pomology, Beijing Academy of Agriculture and Forestry Sciences, Beijing 100093, China
2
Beijing Yanshan Forest Ecosystem Observation and Research Station, National Forestry and Grassland Administration, Beijing 100093, China
3
College of Forestry, Shenyang Agricultural University, Shenyang 110866, China
4
College of Forestry, Hebei Agricultural University, Baoding 071000, China
*
Authors to whom correspondence should be addressed.
Atmosphere 2025, 16(10), 1186; https://doi.org/10.3390/atmos16101186
Submission received: 5 August 2025 / Revised: 23 September 2025 / Accepted: 25 September 2025 / Published: 15 October 2025
(This article belongs to the Section Air Quality)

Abstract

The correlation between negative air ions (NAI) and nitrogen oxides (NOx) exhibits significant seasonal characteristics and is non-static. Previous studies have shown that NAI concentration is highly sensitive to meteorological factors, while NOx concentration is also affected by meteorological factors, resulting in potential differences in their correlation under different meteorological conditions. To deepen the understanding of this relationship, this study explored the impact of different meteorological factors on the correlation between NAI and NOx. The main conclusions are as follows: (1) The interaction between NAI and NOx in urban forests is regulated by meteorological factors; the higher the temperature, humidity, and solar radiation, the larger the correlation coefficient, and the stronger the negative correlation between the two; (2) Under synergistic meteorological conditions, NAI concentration is high and NOx concentration is moderate, which is suitable for outdoor activities: Condition 1 is temperature > 20 °C, humidity 30–60%, air pressure > 940 kPa, solar radiation 30–60 W·m−2, wind speed < 1 m·s−1; Condition 2 is temperature > 20 °C, humidity > 60%, air pressure > 940 kPa, solar radiation > 60 W·m−2, wind speed < 1 m·s−1 (based on NAI and NOx concentration data and health standards: NAI ≥ 1000 cm−3 is beneficial to health, and NOx ≤ 80 μg/m3 meets WHO limits); (3) Temperature, humidity, and air pressure have regulatory effects on the relationship between NAI and NOx, among which air pressure exerts positive regulation, while temperature and humidity exert negative regulation.

1. Introduction

With rapid urbanization; air pollution—particularly elevated nitrogen oxide (NOx) concentrations—poses significant threats to public health and ecosystems. Urban forests, as critical ecological infrastructure, improve local air quality through negative air ion (NAI) release and pollutant regulation. However, the spatiotemporal distribution and interaction of NAI and NOx are complexly influenced by meteorological factors (e.g., temperature, humidity, wind speed, precipitation), and systematic research on how these factors modulate their relationship remains limited
The dynamic variation characteristics of NAI and NOx have been discussed in some studies, but the interaction mechanism between them under different meteorological conditions is not deeply analyzed. In urban forest ecosystems, the spatiotemporal variations in NAI concentration (NAIC) and NOx are jointly regulated by meteorological factors (temperature, relative humidity, wind speed, solar radiation, precipitation) and local climate, showing complex interactive responses: The concentration of NAI is high in summer and fluctuates greatly in winter and spring, while the concentration of NOx is high in winter and low in summer, with opposite annual variation trends [1,2,3,4]. For NAI, correlations with temperature vary negative: [5,6,7], while humidity generally correlates positively, and solar radiation and wind speed also play significant roles [8,9]. NOx concentration is strongly influenced by meteorological factors: higher temperatures and wind speed promote NOx diffusion [10,11], solar radiation accelerates photochemical transformation [12], and precipitation enhances wet deposition [13]. Notably, meteorological conditions not only independently affect NAI and NOx dynamics but also modulate their interaction by altering atmospheric stability, photochemical processes, and pollutant diffusion. For example, high-temperature and high-humidity environments may control NOx accumulation while promoting NAI generation, whereas strong winds may reduce NOx but weaken local NAI aggregation [14,15].
This study conducted statistical analysis of long-term monitoring data from forested areas in four cities, revealing the impact of meteorological factors on the dynamic relationship between NAI and NOx. Its scientific significance lies in: filling the research gap in “the synergistic regulation mechanism of meteorological factors on NAI-NOx interactions” and clarifying key drivers of their correlation under different meteorological conditions; The innovation lies in the first application of cluster analysis to categorize meteorological factor interaction effects and quantify the moderating roles of temperature, humidity, and air pressure. The findings provide scientific support for urban ecological planning (e.g., green space optimization) and air pollution control (e.g., precise NOx management).

2. Research Methods

2.1. Overview of Urban Forest Ecological Environment Monitoring Station

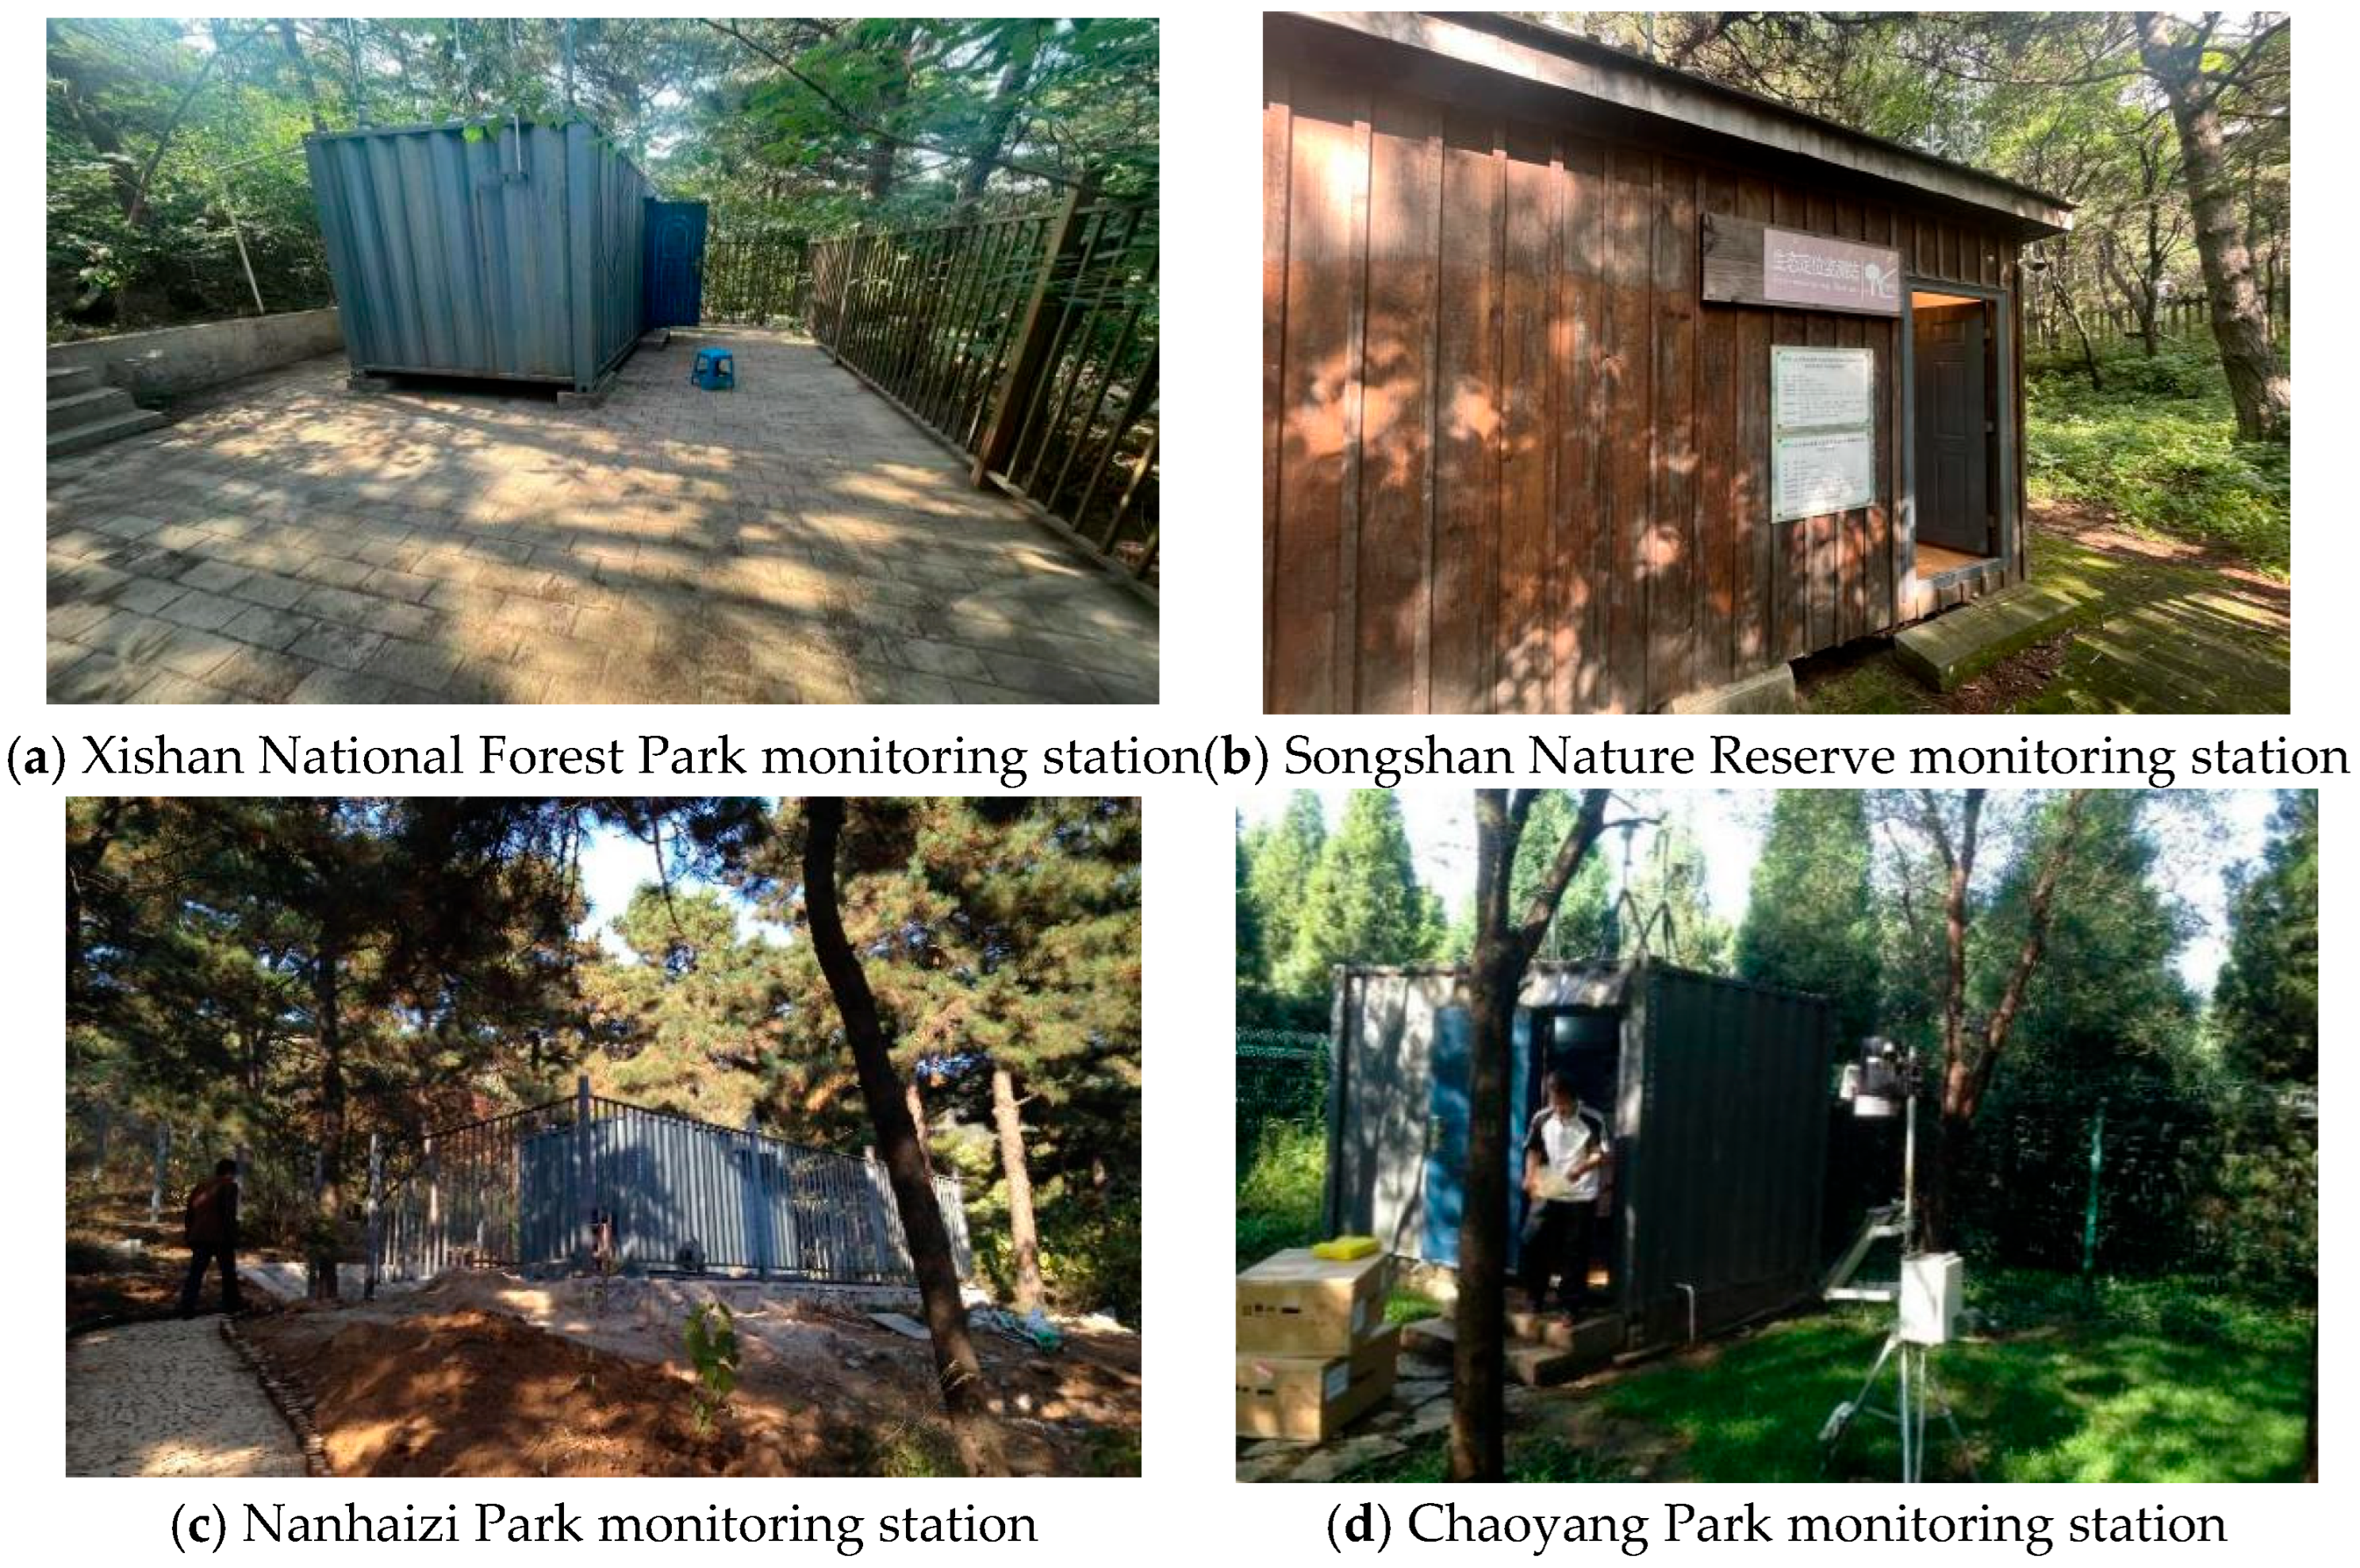
Four typical urban forest parks in Beijing were selected to represent pollution gradients based on their distance from the city center: Suburban Shallow Mountain Forest Area: Xishan National Forest Park (116.19° E, 39.97° N) Distant Suburban Mountain Forest Area: Songshan National Nature Reserve (115.82° E, 40.50° N) Suburban Wetland Forest Area: Nanhaizi Park (116.47° E, 39.77° N)Central Urban Area: Chaoyang Park (116.45° E, 39.92° N) These sites reflect spatial heterogeneity in Beijing’s urban forest ecosystems, with representative vegetation and habitats (Figure 1 and Figure 2).

2.2. Data Acquisition

NAI: Monitored by HQWAS-200PRO (Beijing Yunchuangtian Environmental Protection Technology Service Co., Ltd., Beijing, China; detection range: 0–5.0 × 106 cm−3, error ≤ 5%).
NOx: Measured by Thermo Fisher Scientific (Waltham, MA, USA) chemiluminescence analyzer (range: 0–20 ppm, detection limit: 0.05 ppb).
Meteorological factors: Temperature (Ta), relative humidity (RH), air pressure (AP), solar radiation (SR), wind speed (Vw) and precipitation (P) are all monitored continuously at hourly level. The sampling time is 2023 whole year to ensure that the data covers different meteorological conditions in four seasons.

2.3. Data Processing

Data cleaning was performed using Excel 2007 (eliminating outliers and filling missing values with inear interpolation for cases with <5% missing data). Pearson correlation analysis (significance level p < 0.05) and moderated effect testing (using stratified regression) were conducted in SPSS 27.0. Data visualization was created using Origin 2024, including scatter plots and line graphs.

3. Results and Analysis

3.1. Characteristics of Meteorological Factors

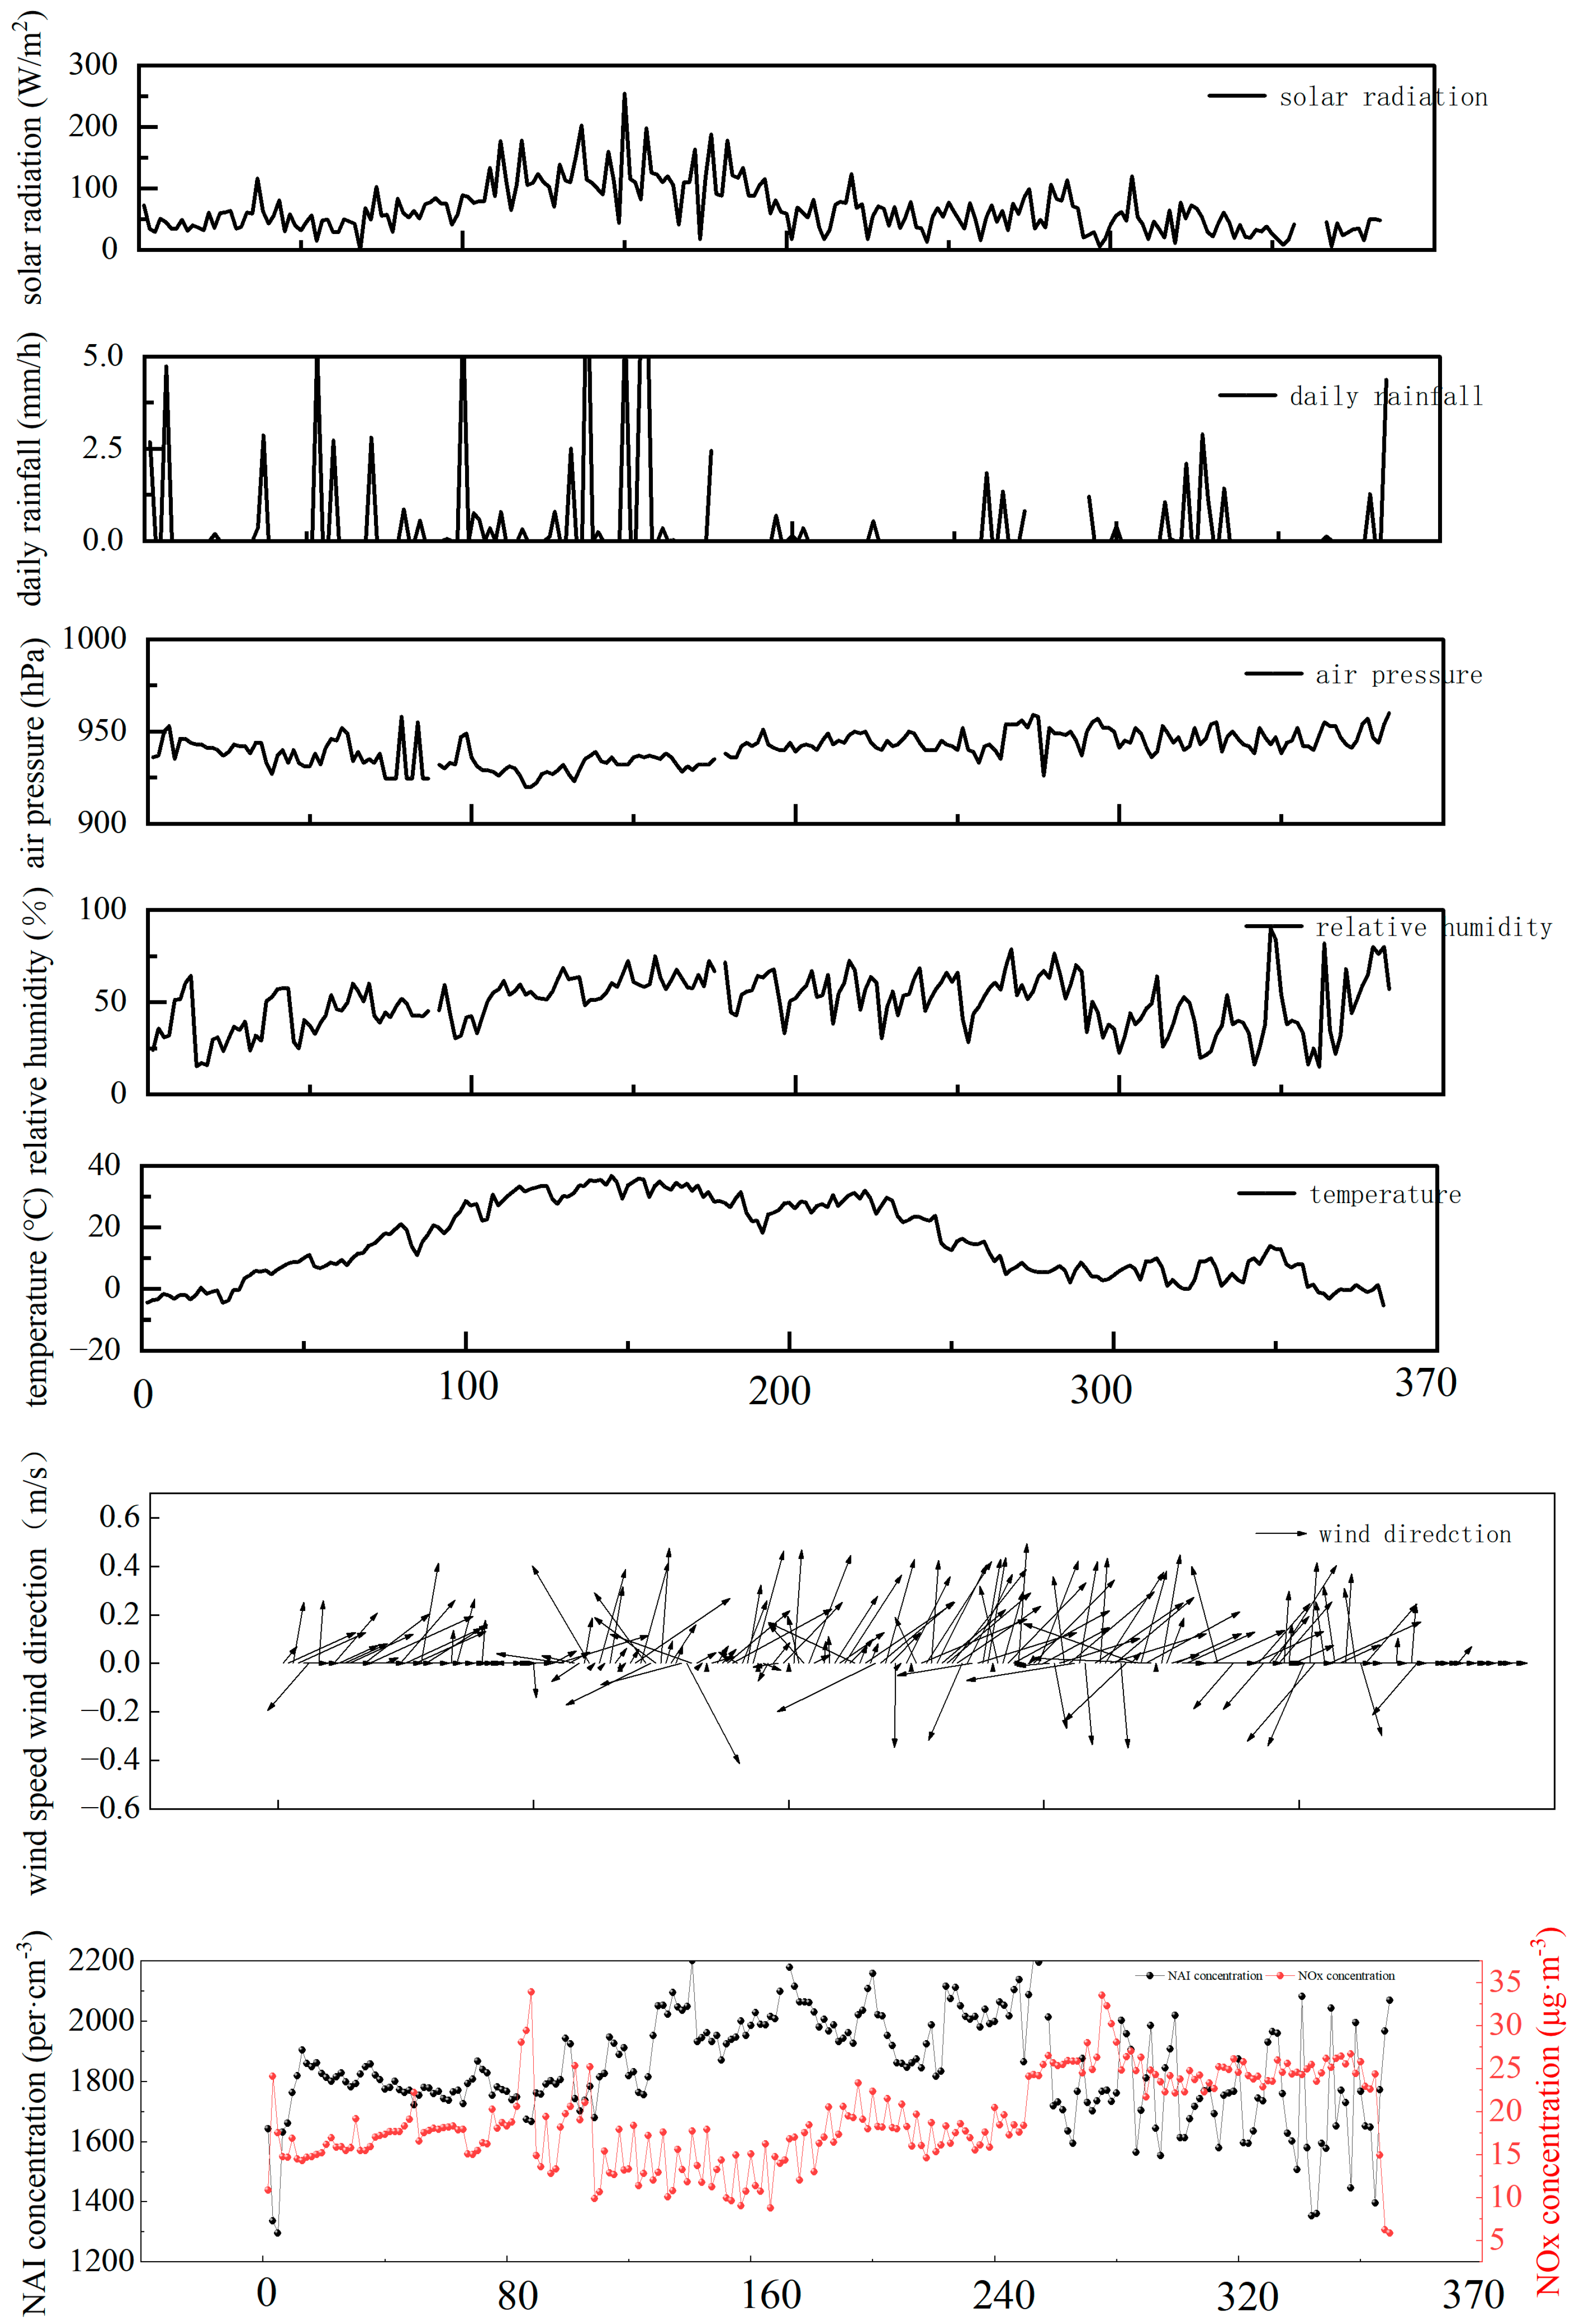
As shown in Figure 3, solar radiation (SR) and precipitation (P) exhibit similar annual trends, both peaking during summer. Atmospheric pressure (AP) shows relatively stable fluctuations between 900 and 1000 kPa, with winter values higher than summer. Air relative humidity (RH) remains steady in summer and autumn but fluctuates dramatically in spring and winter. Temperature (Ta) follows a “single-peak curve” pattern, peaking in summer, mirroring the variation in NAI concentration. In Beijing’s urban forest areas, prevailing winds are predominantly northeast and northwest throughout the year, with wind speeds (Vw) typically ranging from 0 to 10 m·s−1. NAI concentration peaks in summer, stabilizes in spring, and shows significant fluctuations between autumn and winter. NOx concentrations reach their lowest in summer, remain similar in spring and autumn, and peak in winter.
In conclusion, the seasonal variation characteristics of meteorological factors (SR, P, AP, RH, Ta and Vw) in Beijing’s urban forest areas are significant. The interannual variation trend of NAI and NOx concentration is opposite to each other, which may be affected by meteorological conditions and pollutant diffusion capacity together.

3.2. Correlation Between Atmospheric Negative Ions and Nitrogen Oxides Under Different Meteorological Conditions

In Various Intervals Table 1 presents the correlation analysis between NAI (Negative Atmospheric Ion) and NOx (Nitrogen Oxides) under meteorological factors across different intervals. The results show that the r-intercept coefficient increases with rising temperature. At temperatures between 0 and 20 °C, a significant negative correlation is observed (r = −0.212, p = 0.022). When temperatures exceed 20 °C, the r-intercept correlation becomes highly significant (r = −0.284, p = 0.004). Similar to temperature trends, humidity levels also influence r-intercept coefficients: at 30–60% humidity, a highly significant negative correlation is evident (r = −0.254, p = 0.002), while above 60%, the correlation remains significant (r = −0.30, p = 0.021). Pressure only shows a highly significant negative correlation at values above 940 kPa (r = −0.267, p = 0.003). No clear correlation was found between r-intercept and rainfall amounts. Notably, r-intercept coefficients increase with enhanced solar radiation: at 30–60 W·m−2, a significant negative correlation emerges (r = −0.216, p = 0.02); when exceeding 60 W·m−2, the correlation becomes highly significant (r = −0.382, p = 0.001). Additionally, r-intercept correlations are highly significant at wind speeds below 1 m·s−1 (r = −0.365, p = 0.001). The variation in temperature, humidity and solar radiation will affect the correlation between NAI and NOx. The greater the temperature, humidity and solar radiation, the larger the r coefficient, and the stronger the correlation between them, followed by air pressure and wind speed.
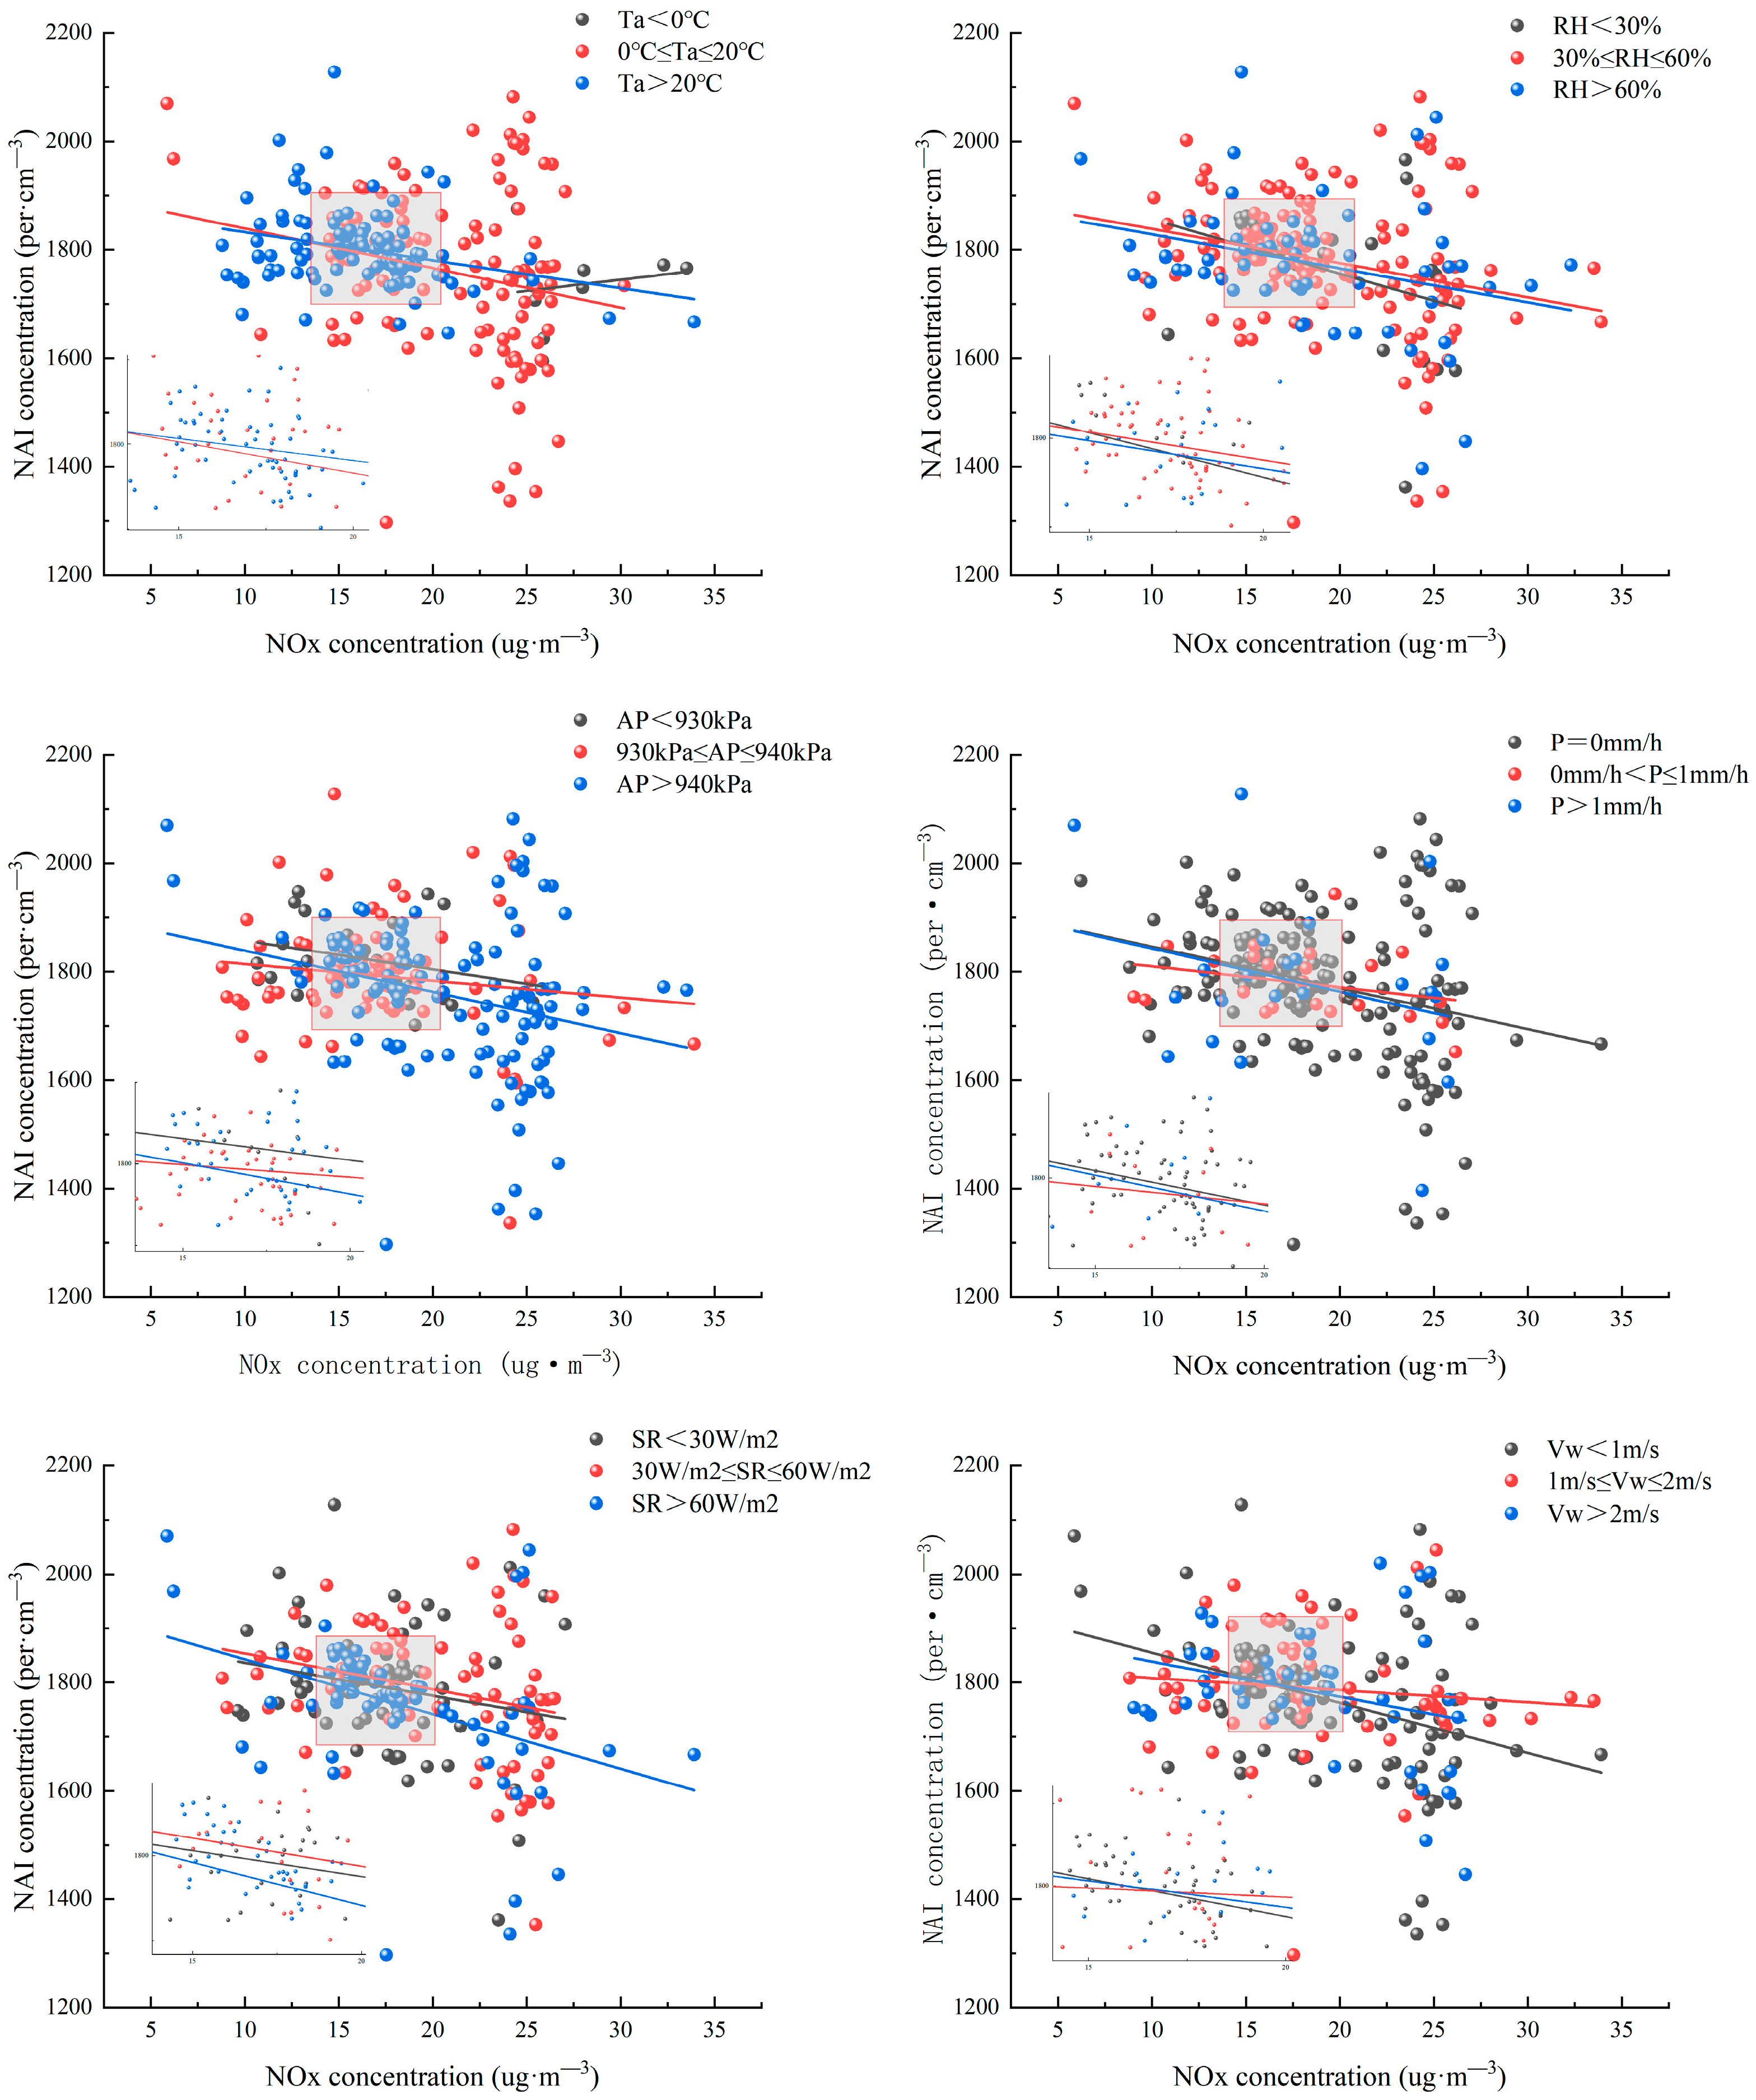
To better investigate the interaction effects between concentration levels of major meteorological factors, Figure 4 presents scatter plots illustrating their correlations under different meteorological factor classifications. The slope reaches its maximum at temperatures between 0–20 °C, indicating that NAI shows highest sensitivity to NOx response, with the fitting equation y = 1912.20 − 7.30x. When temperatures exceed 20 °C, the equation shifts to y = 1844.25 − 5.17x. For humidity above 60%, the equation becomes y = 1890.93 − 6.26x. Between 30−60% humidity, the slope peaks at y = 1844.25 − 5.17x, demonstrating heightened sensitivity to NOx. Atmospheric pressure above 940 kPa corresponds to equation y = 1915.36 − 7.62x. Solar radiation between 30 and 60 W/m2 yields equation y = 1919.88 − 6.61x, while exceeding 60 W/m2 results in the most sensitive response through equation y = 1943.60 − 10.09x. Wind speed below 1 m/s is associated with equation y = 1947.16 − 9.23x.
In conclusion, when the temperature is 0–20 °C, the humidity is 30–60%, the solar radiation is greater than 60 W·m−2 and the wind speed is less than 1 m·s−1, NAI is most sensitive to the change in NOx.

3.3. Correlation Analysis Between Air Negative Ions and Nitrogen Oxides in Hierarchical Coordinated Control of Meteorological Factors

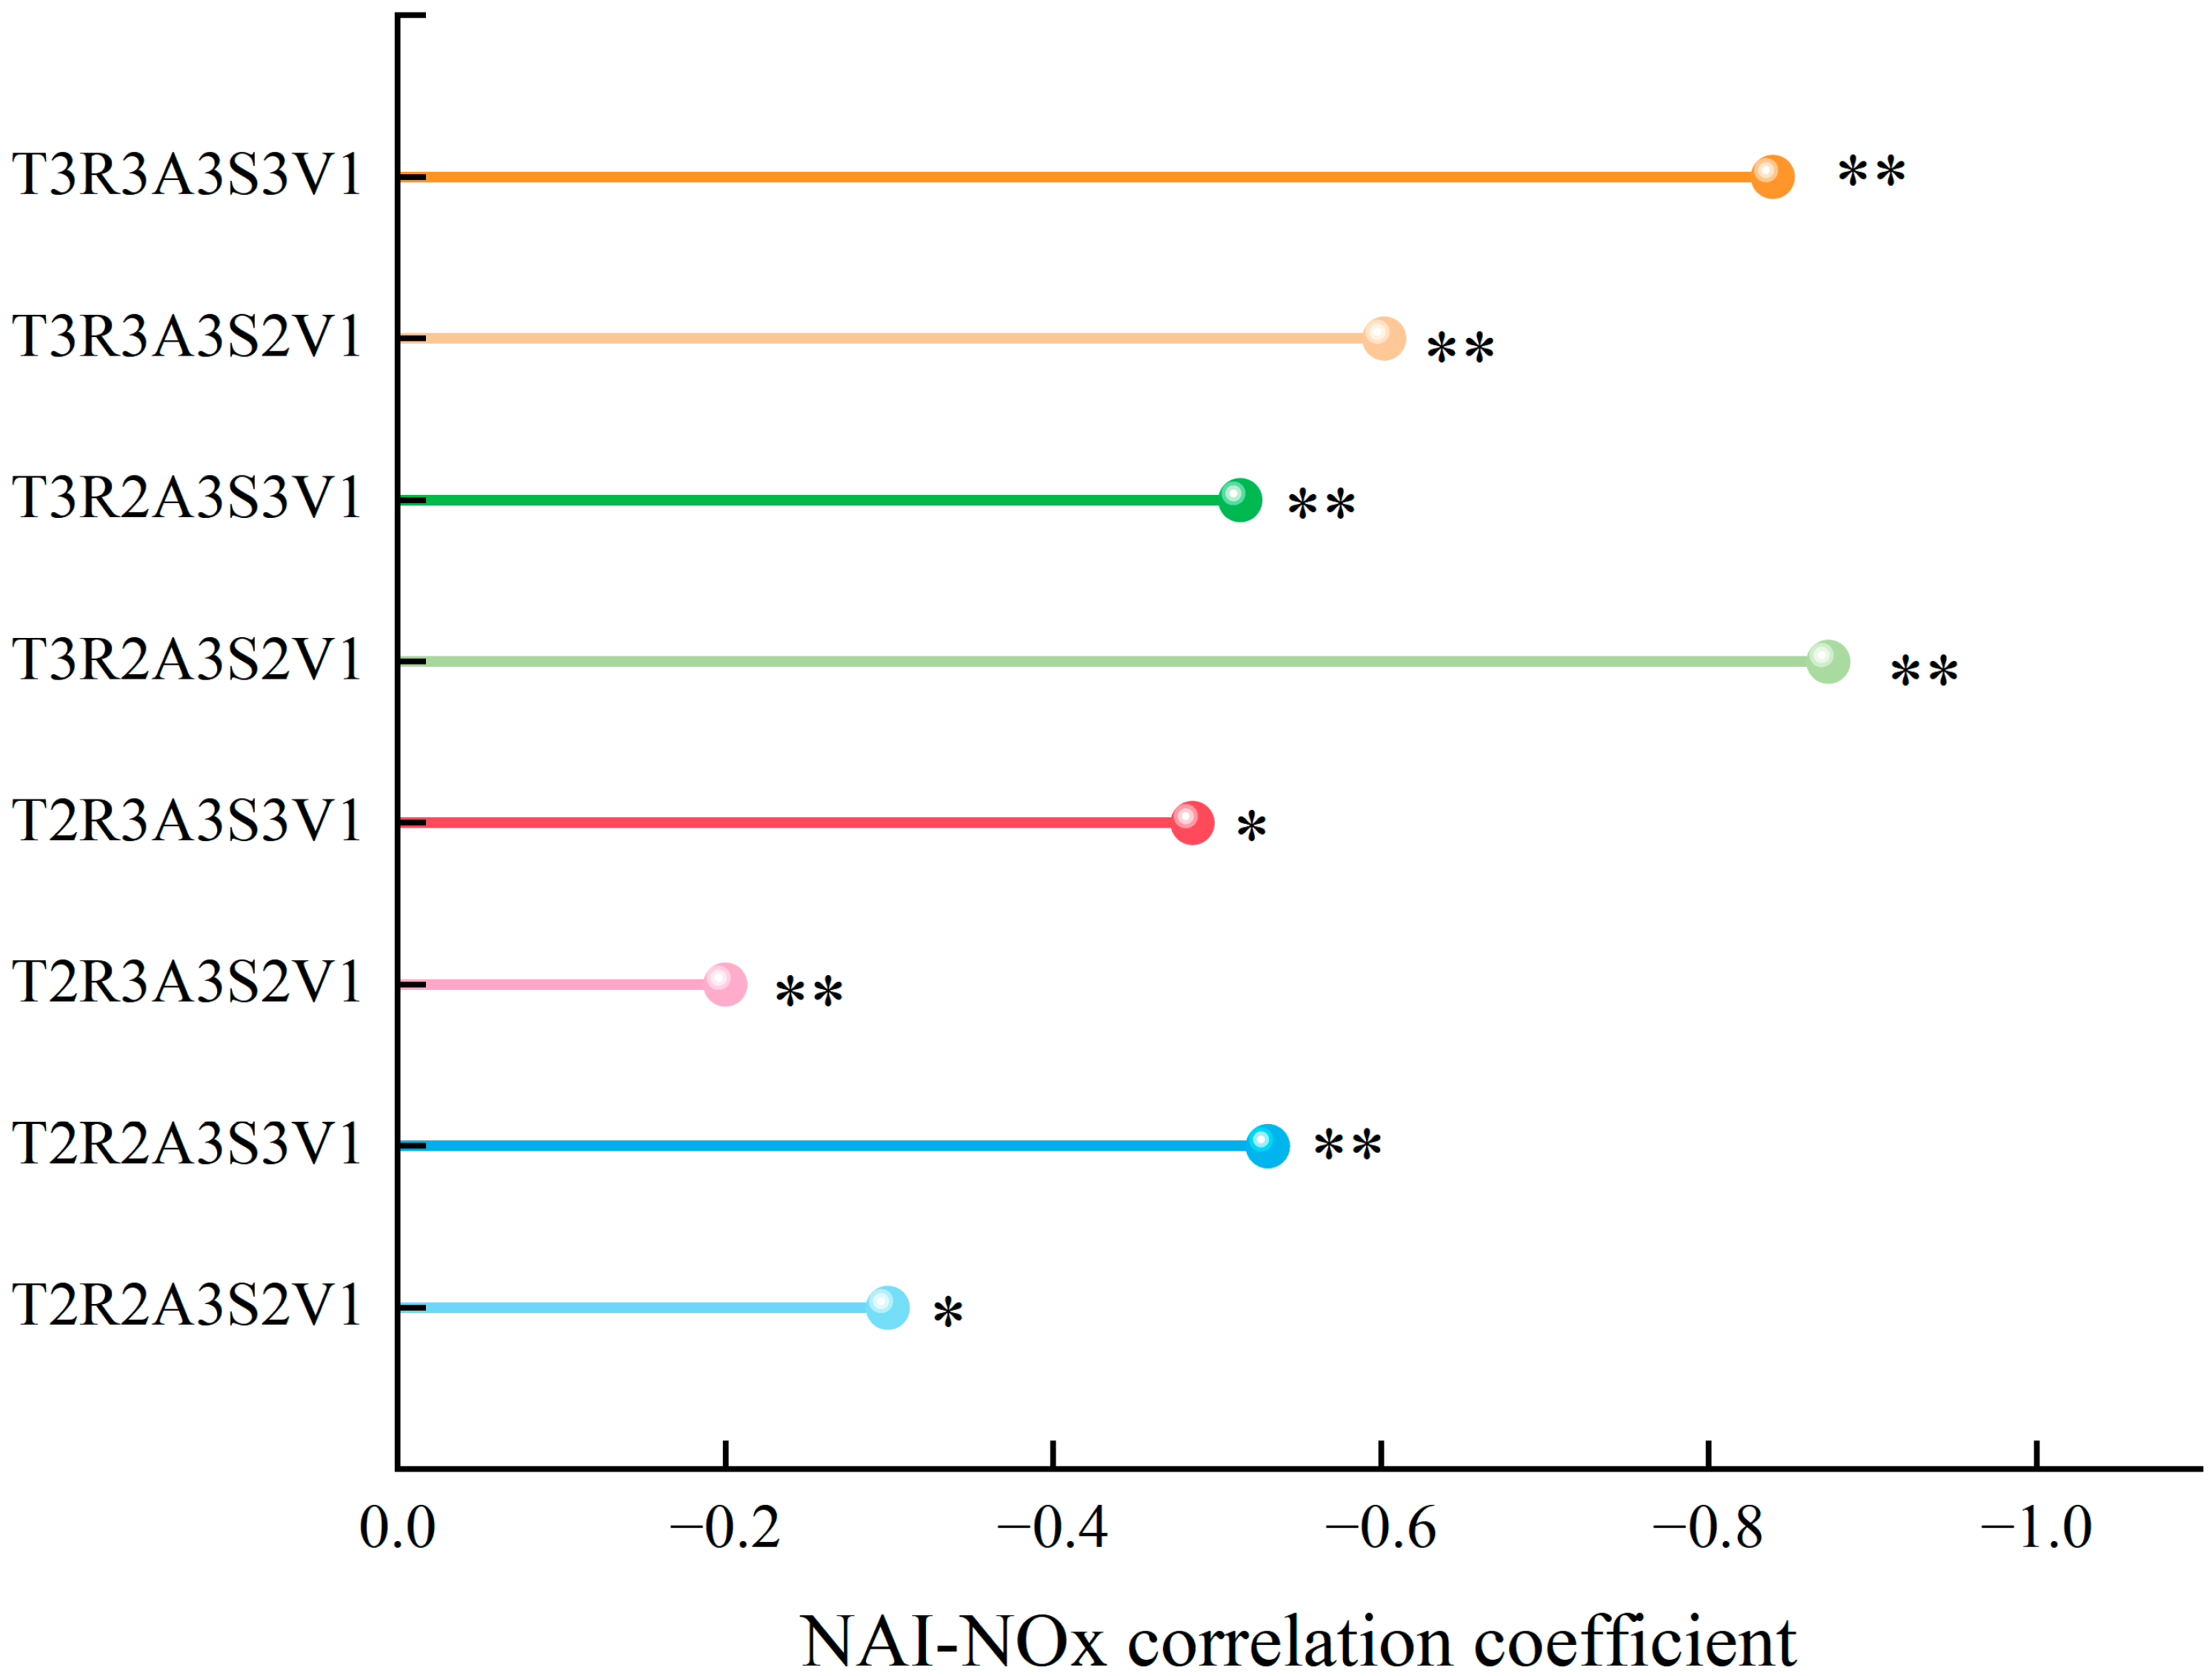
As shown in Table 1, under environmental conditions of T2 (Ta 0–20 °C), T3 (Ta > 20 °C), R2 (RH 30–60%), R3 (RH > 60%), A3 (AP > 940 kPa), S2 (SR 30–60 W·m−2), S3 (SR > 60 W·m−2), and V1 (Vw < 1 m·s−1), the negative correlation between NAI and NOx was statistically significant. Therefore, we systematically analyzed the eight hierarchical meteorological factors to identify the most strongly negatively correlated combinations. Figure 5 demonstrates that the environmental combination of T3R3A3S3V1 (Ta > 20 °C, RH 30–60%, AP > 940 kPa, SR 30–60 W·m−2, Vw < 1 m·s−1) exhibited the strongest correlation with NOx (r = −0.873, p < 0.01). The subsequent combinations ranked from strongest to weakest were: T3R3A3S3V1 (r = −0.839, p < 0.01), T3R3A3S2V1 (r = −0.602, p < 0.01), T2R2A3S3V1 (r = −0.531, p < 0.01), T3R2A3S3V1 (r = −0.514, p < 0.05), T2R3A3S3V1 (r = −0.485, p < 0.05), T2R2A3S2V1 (r = −0.299, p < 0.05), and T2R3A3S2V1 (r = −0.873, p < 0.01).
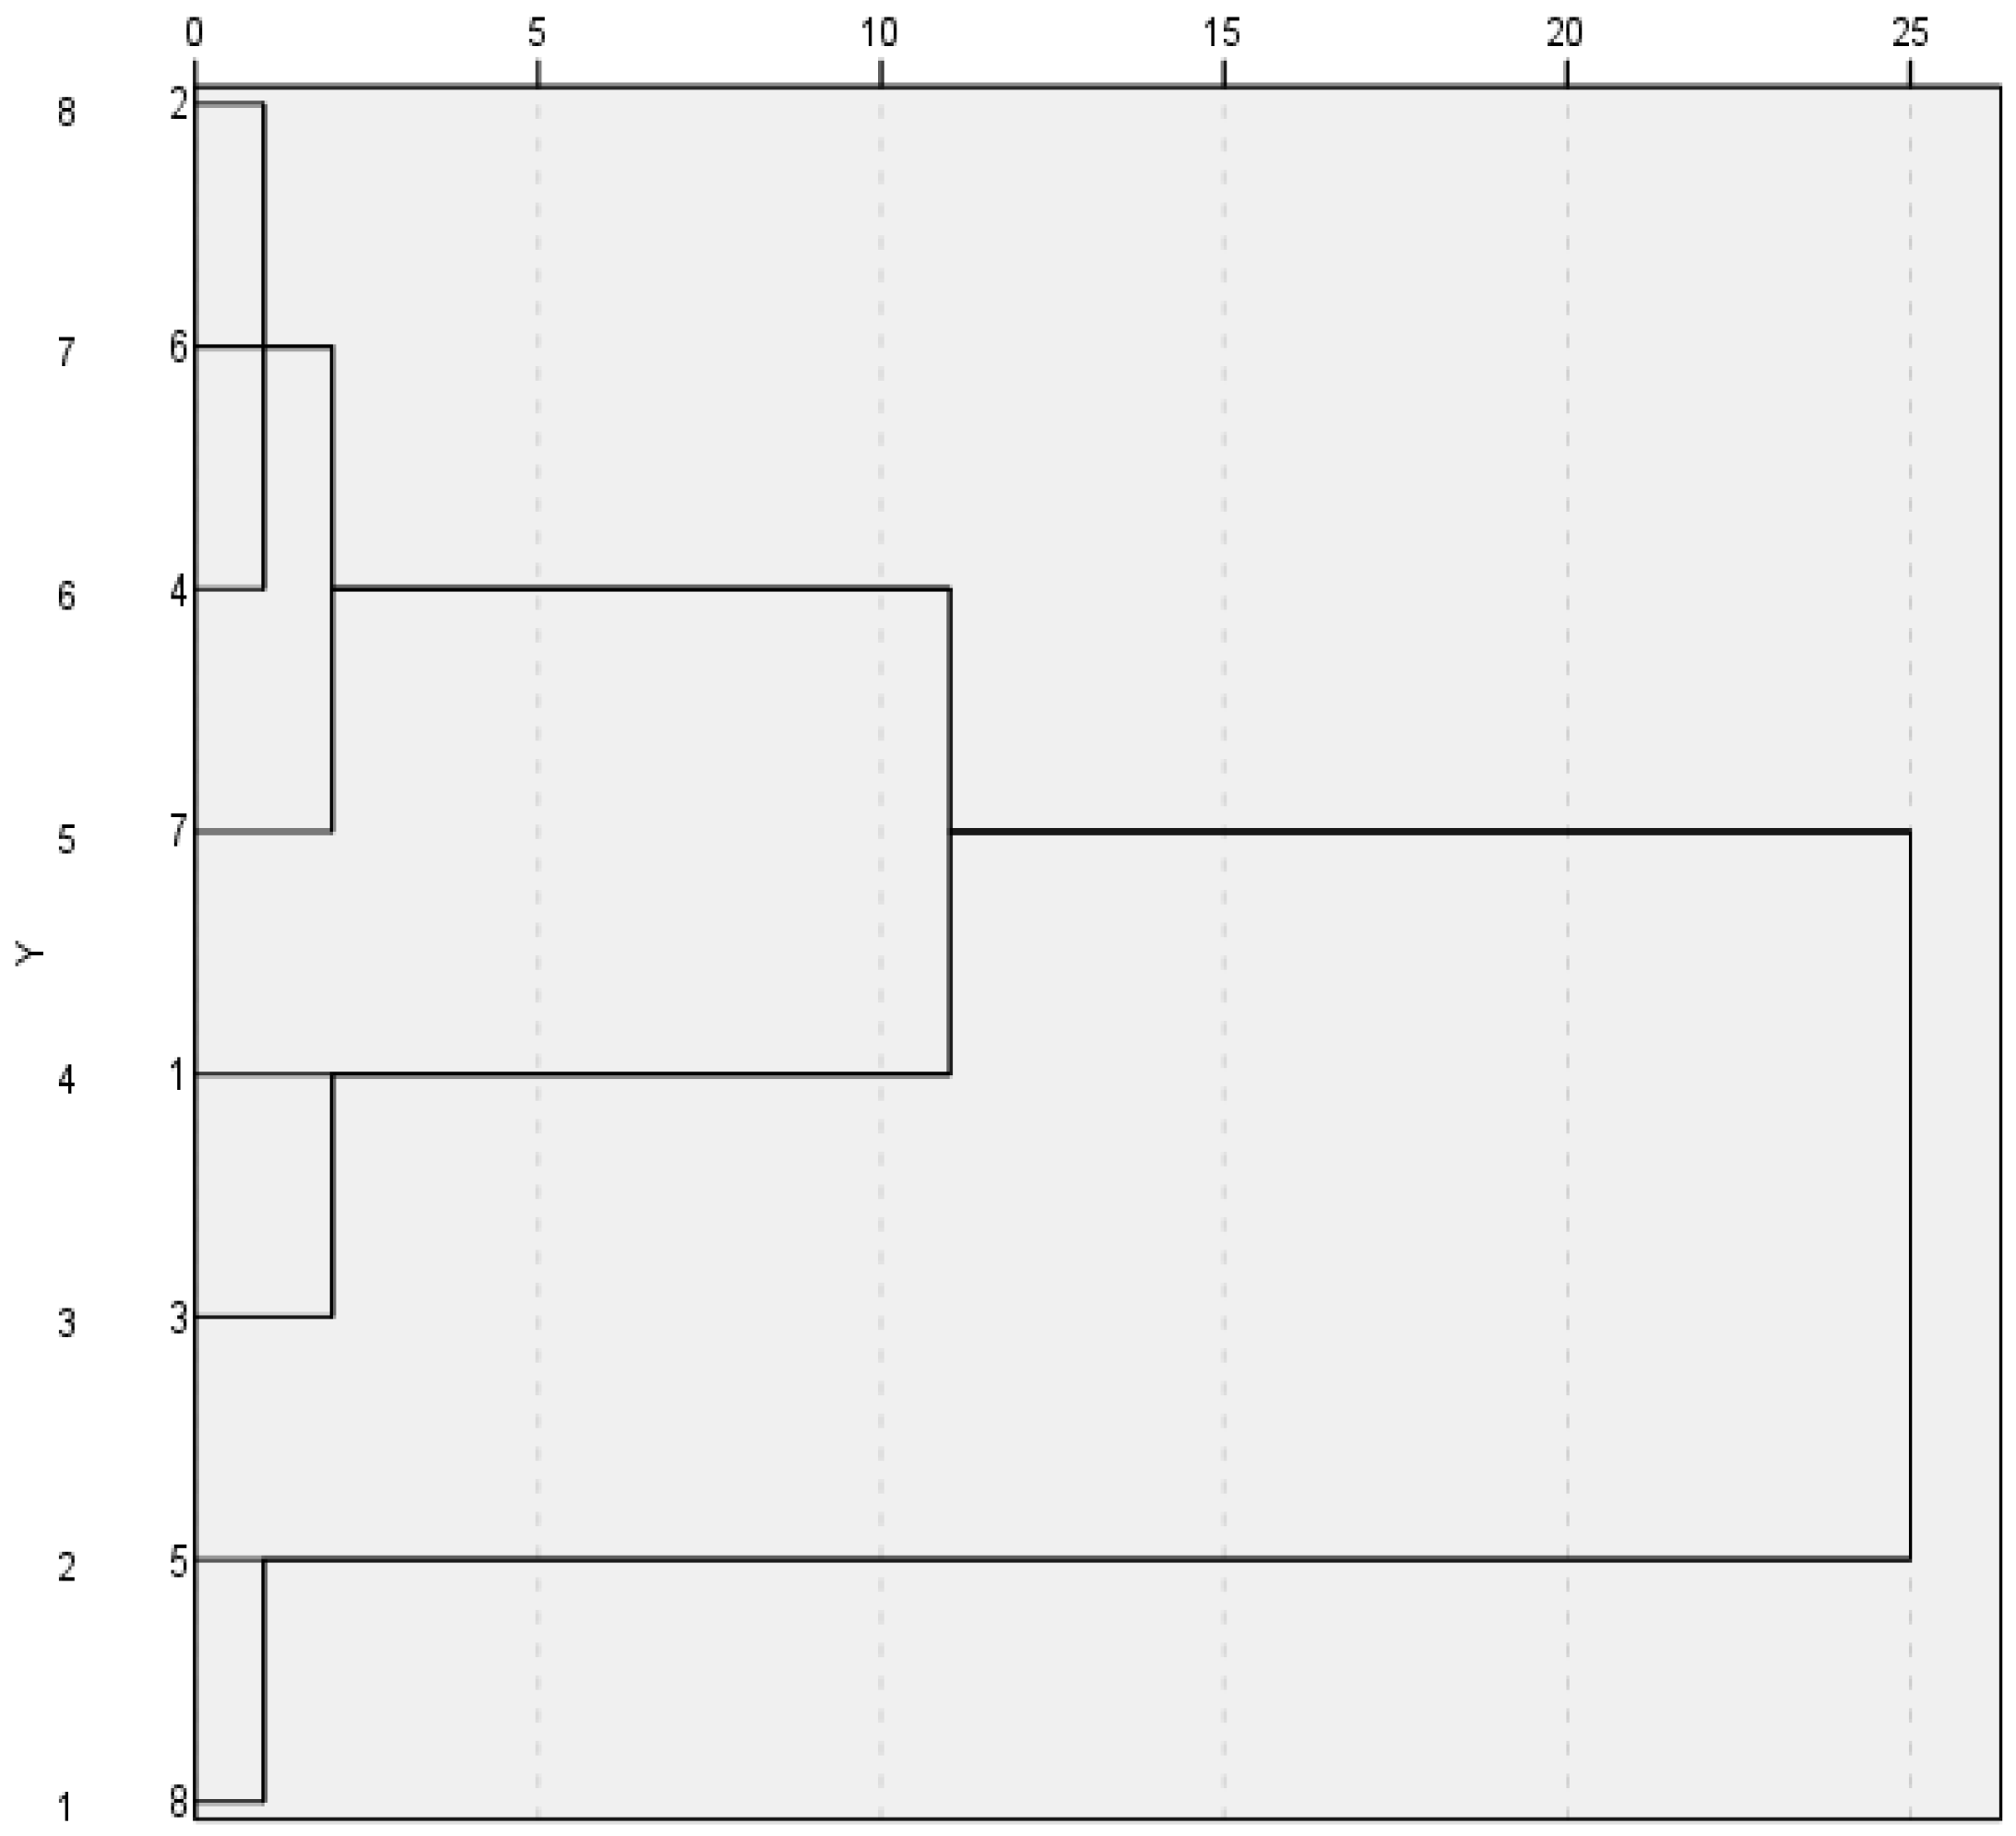
Through SPSS’s one-way ANOVA analysis of the synergistic regulation effects between NAI and NOx under eight meteorological factors, we found significant differences in r Interaction across different combinations (p < 0.05). Consequently, we employed mean linkage (group-to-group) pedigree standardization distance clustering (Note: A method of systematrical classification that determines cluster levels by calculating average Euclidean distances between groups, using standardized distance thresholds to categorize interaction effects into four categories: extremely strong, strong, weak, and extremely weak) to classify their interactive effects (Figure 6).
Use the average linkage (group) pedigree
Rescaled distance clustering combinations
As shown in Table 2, the combined meteorological factors T3R2A3S2V1 and T3R3A3S3V1 exhibit a strong interaction effect on NAI and NOx concentrations. This indicates that although these factors collectively elevate NAI levels, high NOx concentrations (mean ≥ 90 μg/m3, significantly exceeding WHO’s 24-h average permissible concentration of 80 μg/m3) inhibit NAI formation through complex atmospheric chemical processes. Consequently, outdoor activities under these conditions are not recommended.
Under meteorological factor combinations with strong interaction effects (T3R2A3S3V1, T3R3A3S2V1), the average NAI concentration ranges from 1800 to 2000 cm3 meeting standard that “NAI ≥ 1000 cm−3 is beneficial for health” while NOx concentrations average 50–70 μg/m3 (lower than the 24-h average limit of 80 μg/m3 for NOx specified in the Ambient Air Quality Standards [15]. These conditions make outdoor activities particularly suitable.
Under the combination of meteorological factors with weak or very weak interaction effect (T2R2A3S3V1, T2R3A3S3V1, T2R2A3S2V1, T2R3A3S2V1), the mean concentration of NAI was less than 800 cm3 and the mean concentration of NOx was less than 40 μg/m3. Although NOx did not exceed the standard, the low concentration of NAI could not play a health benefit, so it was not suitable for outdoor activities.
Based on the aforementioned conclusions, it is recommended to release the “NAI-NOx Joint Index” and outdoor activity recommendations through urban air quality forecasting platforms (e.g., Beijing Municipal Ecology and Environment Bureau’s official website). When NOx levels exceed safety thresholds, sensitive populations should be advised to reduce outdoor activities. When the NO2 concentration exceeds the safety threshold (e.g., surpassing the 24-h average limit of 80 μg/m3 stipulated by the Chinese Ambient Air Quality Standards (GB 3095-2012), it is advisable to recommend that sensitive populations reduce outdoor activities.

3.4. The Moderating Effect of Main Meteorological Factors on the Relationship Between Air Negative Ions and Nitrogen Oxides

The moderating effect refers to a variable’s ability to alter the strength or direction of the relationship between an independent variable and dependent variable. While previous analyses have focused on correlation analysis that only quantifies the degree of association, it remains unclear whether meteorological factors exert moderating effects on the relationship between NAI and NOx. This section therefore conducts a moderated effect analysis of meteorological factors M and NAI/NOx, revealing that temperature, humidity, and air pressure significantly moderate the relationship between NAI and NOx.
Table 3 presents three progressive models for moderating effects: the basic model (Model 1) contains only the independent variable NOx; the extended model (Model 2) introduces air pressure as a moderating variable; and the full model (Model 3) further incorporates an interaction term between NOx and air pressure. Analysis of Model 1 reveals that, controlling for other variables, NOx exhibits a significant negative predictive effect on NAI (t = −8.46, p < 0.001). The study employs interaction testing to examine moderating effects, with the interaction term between NOx and air pressure showing statistical significance (t = −2.53, p = 0.02), indicating that air pressure significantly moderates the relationship between NOx and NAI, meaning the impact of NOx on NAI varies markedly under different air pressure conditions. As shown in Figure 7, the slope of the linear relationship is steeper at lower air pressure levels compared to higher levels, demonstrating that air pressure positively moderates the relationship between NAI and NOx.
As shown in Table 4, the interaction term between NOx and air temperature demonstrates statistical significance (t = 3.06, p = 0.01). This indicates that when NOx affects NAI, the moderating variable (air temperature) exhibits significant differences in its impact magnitude across different temperature levels. Figure 8 reveals that the slope of the linear relationship is higher at lower temperatures than at higher temperatures and air pressure levels, demonstrating that temperature exerts a negative moderating effect on the relationship between NAI and NOx.
As shown in Table 5, the interaction term between NOx and air humidity demonstrates statistical significance (t = 2.04, p = 0.05). This indicates that when NOx affects NAI, the moderating variable (air humidity) exhibits significant differences in its impact magnitude across different levels. Figure 9 reveals that the slope of the linear relationship is higher at lower humidity levels compared to higher humidity levels, demonstrating that humidity exerts a negative moderating effect on the relationship between NAI and NOx.

4. Discussion

4.1. Impact of Temperature on the Correlation Between NAI and NOx

This study found that when temperature exceeds 20 °C, the concentrations of NAI and NOx show a significant negative correlation, and temperature has a regulatory effect on their relationship. This observed negative correlation can be attributed to photochemical reactions. During these reactions, NO2 photolyzes to form NO and atomic oxygen (O), which subsequently reacts with O2 to produce O3. This process consumes NOx and facilitates its conversion into other nitrogen-containing compounds (e.g., nitric acid), leading to a net reduction in NOx concentration [16]. Additionally, higher temperatures may affect atmospheric vertical convection, causing air to rise and thereby reducing pollutant concentrations in the atmosphere. When temperature exceeds 20 °C, the thermal motion of air molecules accelerates, increasing the probability of molecular collisions and raising NAI concentration [17]. Moreover, this period coincides with the plant growing season, during which plants release more NAI to purify or adsorb NOx, resulting in a significant negative correlation between NAI and NOx concentrations.

4.2. Impact of Humidity on the Correlation Between NAI and NOx

This study revealed that when humidity exceeds 30%, NAI and NOx concentrations exhibit a significant negative correlation, and humidity regulates their correlation. NAI are formed when certain molecules in the atmosphere capture free electrons, acquiring excess negative charges. These charged substances tend to undergo hydration with polar water molecules in the environment, forming stable composite structures. Humidity significantly influences this process: higher relative humidity promotes the aggregation of water molecules around charged ions, generating larger hydrated clusters. Due to their surface charge distribution, these clusters can effectively adsorb airborne aerosol particles and fine pollutants, improving air quality by facilitating their subside. Meanwhile, the hydration layer significantly reduces the recombination rate of NAI with positively charged substances or oxidizing components, greatly extending their residence time in the air. Furthermore, increased humidity enhances particle coagulation, causing small particles to condense and settle into larger ones. The larger particle size reduces mobility, further minimizing NAI loss [18]. NAI may also participate in reactions with NOx, converting them into substances such as nitrates, and this reaction is more efficient under high humidity, thereby reducing NOx concentration [19].
Specifically, NAI in the atmosphere of urban forests mainly exists in two forms: superoxide anions (O2) and hydrated hydroxyl ions (OH·nH2O) [20], and their reactions with NOx exhibit form-specificity and humidity dependence. For the electron transfer reaction between O2 and NO2: as a strong electron donor, O2 can react with NO2 (O2 + NO2 → O2 + NO2); when humidity ranges from 30% to 60%, free H+ in the atmosphere combines with NO2 to form nitrous acid (HNO2), which is further oxidized by O3 to nitric acid (HNO2 + O3 → HNO3 + O2) and finally removed by deposition in the form of nitrates (e.g., NH4NO3). For the addition reaction between OH·nH2O and NO: OH·nH2O can undergo an addition reaction with NO (OH·nH2O + NO → HNO2·(n−1)H2O + H2O), and the generated HNO2 is converted to nitrate (HNO2 + hν → NO3 + H+) under solar radiation (>30 W·m−2).
High humidity (>30%) promotes the above reactions in two ways: first, water molecules can wrap NAI to form a stable hydration shell, reducing the recombination of O2 with positive ions; second, the gas–liquid interface formed by water vapor improves the solubility of NOx, increasing the collision probability between NAI and NOx [20]. This also explains why the negative correlation between NAI and NOx is more significant when humidity > 30% (Table 1).

4.3. Impact of Air Pressure on the Correlation Between NAI and NOx

This study found that air pressure significantly affects the relationship between NAI and NOx concentrations. Under high air pressure, the two exhibit a significant negative correlation, with air pressure playing an important regulatory role [21], noted that poor diffusion conditions under such circumstances hinder the dispersion of pollutants like NOx, leading to their accumulation near the ground. High concentrations of NOx inhibit NAI generation through complex chemical processes in the atmosphere. Meanwhile, high pressure suppresses vertical atmospheric convection, causing pollutants including NOx to accumulate continuously near the ground. In such an environment, NAI are likely to adhere to these accumulated particles, accelerating their settlement and thus reducing NAI concentration. Additionally, turbulent activity in the atmosphere weakens under high pressure, reducing air ionization caused by turbulence and limiting new pathways for NAI generation. These combined factors result in a significant negative correlation between NAI and NOx concentrations under high air pressure.

4.4. Impact of Solar Radiation on the Correlation Between NAI and NOx

The results indicate that solar radiation intensity significantly enhances the negative correlation between NAI and NOx. First, increased solar radiation—especially in the ultraviolet band—promotes atmospheric photochemical reactions, accelerating the oxidation of NOx and volatile organic compounds and thereby generating ozone (O3) [22]. Ozone decomposition releases single oxygen atoms, which react with water molecules to form hydroxyl radicals, further promoting NAI formation Second, intense solar radiation—particularly UV radiation—directly induces photoionization of air molecules, ionizing atmospheric O2 and H2O to produce free electrons. These electrons form negative oxygen ions through attachment, significantly increasing NAI concentration [23]. Furthermore, enhanced solar radiation may indirectly regulate the interaction between NAI and NOx by affecting atmospheric boundary layer stability. Stronger solar radiation is typically accompanied by a higher mixed layer height, facilitating vertical diffusion and dilution of NOx and reducing their near-surface concentration. Simultaneously, increased photochemical activity continuously promotes NAI generation, ultimately strengthening their negative correlation. This study found that high solar radiation intensifies the negative correlation, primarily because strong ultraviolet radiation under high solar radiation promotes photochemical reactions to generate ozone, whose decomposition produces NAI [24]. Additionally, high radiation enhances atmospheric ionization; ultraviolet light ionizes air molecules, generating more NAI [23]. Meanwhile, NOx participates in photochemical reactions: NO2 decomposes into NO and O under light, O reacts with O2 to form O3, increasing O3 concentration while consuming NOx and strengthening the negative correlation.

4.5. Impact of Wind Speed on the Correlation Between NAI and NOx

This study found that the negative correlation is stronger when wind speed is less than 1 m/s, consistent with the findings of [24]. At low wind speeds, the horizontal diffusion capacity of air is significantly weakened, preventing urban forest areas from effectively dispersing NOx through air flow and causing continuous accumulation of pollutants in local spaces. As NOx concentration increases, its inhibition of NAI generation through complex atmospheric chemical reactions intensifies, directly affecting NAI persistence in the environment. Additionally, reduced wind speed weakens friction between air molecules—a key natural mechanism for NAI generation. Diminished friction limits air ionization, significantly reducing new NAI production. Under the dual effects of “NOx-inhibited generation” and “reduced natural generation,” the inverse trend between NAI and NOx concentrations becomes more pronounced, ultimately resulting in a negative correlation under low wind speeds.

5. Conclusions

Changes in temperature, humidity, and solar radiation significantly influence the correlation between NAI and NOx. The greater the temperature, humidity, and solar radiation, the greater the interaction correlation coefficient (r_interaction) and the stronger the correlation between the two, followed by air pressure and wind speed. NAI is most sensitive to changes in NOx when temperature is 0–20 °C, humidity is 30–60%, and solar radiation is greater than 60 W·m−2.
The correlation between NAI and NOx is the strongest under the environmental combination of T3R2A3S2V1 (Ta > 20 °C, RH 30–60%, AP > 940 kPa, SR 30–60 W·m−2, Vw < 1 m·s−1) (r = −0.873, p < 0.01). Under other environmental combinations, NAI and NOx also show significantly negative correlations. Based on cluster analysis, the meteorological factor combinations of T3R2A3S3V1 (Ta > 20 °C, RH 30–60%, AP > 940 kPa, SR > 60 W·m−2, Vw < 1 m·s−1) and T3R3A3S2V1 (Ta > 20 °C, RH > 60%, AP > 940 kPa, SR 30–60 W·m−2, Vw < 1 m·s−1) are screened out, where NAI concentration is high and NOx concentration is moderate, making them suitable for outdoor activities.
Finally, key meteorological factors modulate the relationship between NAI and NOx. Temperature, humidity, and air pressure all serve as significant moderating factors: Air pressure exhibits positive moderation (interaction term t = −2.53, p = 0.02), with NAI showing heightened sensitivity to NOx under low-pressure conditions. Conversely, temperature (interaction term t = 3.06, p = 0.01) and humidity (interaction term t = 2.04, p = 0.05) demonstrate negative moderation, reducing NAI’s responsiveness to NOx under high-temperature and high-humidity conditions.

Author Contributions

Writing—original draft preparation, D.Y.; writing—review and editing, S.L. (Shaowei Lu), X.X., W.Z., S.W., N.Z., B.L. and S.L. (Shaoning Li). funding acquisition, S.L. (Shaoning Li). All authors have read and agreed to the published version of the manuscript.

Funding

This work was supported by the Beijing Academy of Agriculture and Forestry Sciences Innovation Capacity Building Project (KJCX20251202), National Natural Science Foundation of China project (32171844).

Institutional Review Board Statement

Not applicable.

Informed Consent Statement

Not applicable.

Data Availability Statement

Data is contained within the article.

Conflicts of Interest

The authors declare that they have no known competing financial interests or personal relationships that could have appeared to influence the work reported in this paper. All authors confirm that the research was conducted in the absence of any commercial or financial relationships that could be construed as a potential conflict of interest.

References

  1. Li, A.; Li, Q.; Zhou, B.; Ge, X.; Cao, Y. Temporal dynamics of negative air ion concentration and its relationship with environmental factors: Results from long-term on-site monitoring. Sci. Total Environ. 2022, 832, 155057. [Google Scholar] [CrossRef] [PubMed]
  2. Miao, S.; Zhang, X.; Han, Y.; Sun, W.; Liu, C.; Yin, S. Random Forest Algorithm for the Relationship between Negative Air Ions and Environmental Factors in an Urban Park. Atmosphere 2018, 9, 463. [Google Scholar] [CrossRef]
  3. Ling, D. Review on research of the negative air ion concentration distribution and its correlation with meteorological elements in mountain tourist areas. Earth Sci. 2019, 8, 60–68. [Google Scholar] [CrossRef]
  4. Xie, Z.; Li, C.; Lin, Y.; Liu, J.; He, Z. The lagging effect of precipitation on NAIs concentrations on rainy days in Wuyi Mountain National Park, China. Atmosphere 2023, 14, 377. [Google Scholar] [CrossRef]
  5. Zhang, S.Q.; Tan, Y.M.; Wu, Z.W. Study on the relationship between negative air ion concentration and air temperature and humidity. J. Cent. South Univ. For. Technol. 2011, 31, 114–118. [Google Scholar]
  6. Zhou, H.B.; Bao, Y.; Wang, Z.T. Negative air ions on the surface of remaining mountain bodies in cities of different sizes in karst areas and their influencing factors—A case study of Guiyang City. Acta Ecol. Sin. 2023, 43, 6257–6277. [Google Scholar]
  7. Zhang, J.G.; Xu, W.J.; Cui, H.P.; Mei, Y.Y.; Cai, B.F. Variation of negative air ion concentration in Quzhou Daju Hai Forest Park. J. Zhejiang A&F Univ. 2016, 33, 26–32. [Google Scholar]
  8. Shi, G.Y.; Zhou, Y.; Sang, Y.Q.; Zhang, J.S.; Meng, P.; Cai, L.L.; Pei, S.Y.; Wang, Y. Analysis of the influence of meteorological factors on negative air ions based on random forest method. Chin. J. Agrometeorol. 2021, 42, 390–401. [Google Scholar]
  9. Wang, W. Adaptive Study on Evaluating Urban Residential Ventilation Based on Negative Air Ion Concentration. Ph.D Thesis, Huazhong University of Science and Technology, Wuhan, China, 2014. [Google Scholar]
  10. Li, Q.F.; Liu, C.M.; Ding, X.Y.; Li, S.; Cao, R.J.; Gu, J.F.; Wang, Y. Temporal and spatial distribution characteristics and influencing factors of NO2 in Shijiazhuang City. Environ. Monit. China 2022, 38, 62–73. [Google Scholar]
  11. Qi, K.; Tan, G.; Lu, Z.; Gao, X.; Zhang, Z.; Liu, D.; Lv, R.; Jing, D.; Luo, P.; Dong, G. The temperature-controlled optimization of g-C3N4 structure significantly enhances the efficiency of photothermal catalytic NO removal. J. Mater. Chem. A 2024, 12, 6539–6548. [Google Scholar] [CrossRef]
  12. Ou, L.C.; Chen, W.H.; Wu, Y.K.; Wu, L.M.; Wang, X.M. Temporal and spatial characteristics of ozone suppression events under high temperatures in China and their influencing factors. Environ. Sci. 2023, 44, 6586–6597. [Google Scholar]
  13. Chen, X.M.; Zou, Q.; Zhou, G.B. Influence of precipitation intensity on air pollutants in winter and spring in the main urban area of Chongqing. J. Southwest China Norm. Univ. (Nat. Sci. Ed.) 2013, 38, 113–121. [Google Scholar]
  14. Zhou, Y. Study on Temporal and Spatial Variation of Nitrogen Oxides and Sulfur Dioxide Concentrations in the Eastern Suburbs of Xi’an in Spring. Master’s Thesis, Shaanxi Normal University, Xi’an, China, 2015. [Google Scholar]
  15. Wang, S.; Nie, S.S.; Feng, Y.P.; Cui, J.S.; Chen, J.; Liu, D.X.; Shi, W.Y. Temporal and spatial succession characteristics and source analysis of ozone and nitrogen dioxide in Shijiazhuang City. Environ. Sci. 2021, 42, 2679–2690. [Google Scholar]
  16. GB 3095-2012/XG1-2018; Ambient Air Quality Standards. Ministry of Ecology and Environment of the People’s Republic of China: Beijing, China, 2018.
  17. Luo, L.T.; Zhang, Y.L.; Lin, Y.Q.; Mozaffar, A.; Cao, M.Y. Photochemical characteristics and sensitivity analysis of atmospheric ozone in Nanjing in summer. Environ. Sci. 2024, 45, 1382–1391. [Google Scholar]
  18. Zhu, S.X.; He, X.; Su, Y.; Cui, G.F.; Li, J.Y. Study on negative air ion concentration and its influencing factors in urban forests in different geographical spaces. J. Beijing For. Univ. 2023, 45, 66–77. [Google Scholar]
  19. Smirnov, B.M. Cluster Ions and Van der Waals Molecules; CRC Press: Boca Raton, FL, USA, 1992. [Google Scholar]
  20. Xu, H.; Luo, J.L.; Zhang, Z.Q. Seasonal dynamics of atmospheric PM2.5 and its influencing factors in centralized heating areas—A case study of Baoji City, Shaanxi Province. J. Baoji Univ. Arts Sci. (Nat. Sci. Ed.) 2013, 33, 40–43, 57. [Google Scholar]
  21. Dai, G.; Zhang, J.; Rahman, Z.U.; Zhang, Y.; Zhang, Y.; Vujanović, M.; Mikuli, H.; Manic, N.; Magdziarz, A.; Tan, H. Multi-pollutant formation and control in pressurized oxy-combustion: SOx, NOx, particulate matter, and mercury. Engineering 2024, 39, 127–153. [Google Scholar] [CrossRef]
  22. Jiang, S.Y.; Ma, A.; Ramachandran, S. Negative air ions and their effects on human health and air quality improvement. Int. J. Mol. Sci. 2018, 19, 2966. [Google Scholar] [CrossRef] [PubMed]
  23. Shao, H.R.; He, Q.T.; Yan, H.P.; Hou, Z.; Li, T. Study on temporal and spatial variation characteristics of negative air ion concentration in Beijing area. J. Beijing For. Univ. 2005, 3, 35–39. [Google Scholar]
  24. Zhang, H.F.; Du, N.; Wang, L.; Zhang, X.Y.; Gong, D.C.; Li, L. Estimation of near-surface NO2 concentration in Guangdong Province based on Catboost model. Environ. Sci. 2024, 45, 6276–6285. [Google Scholar]
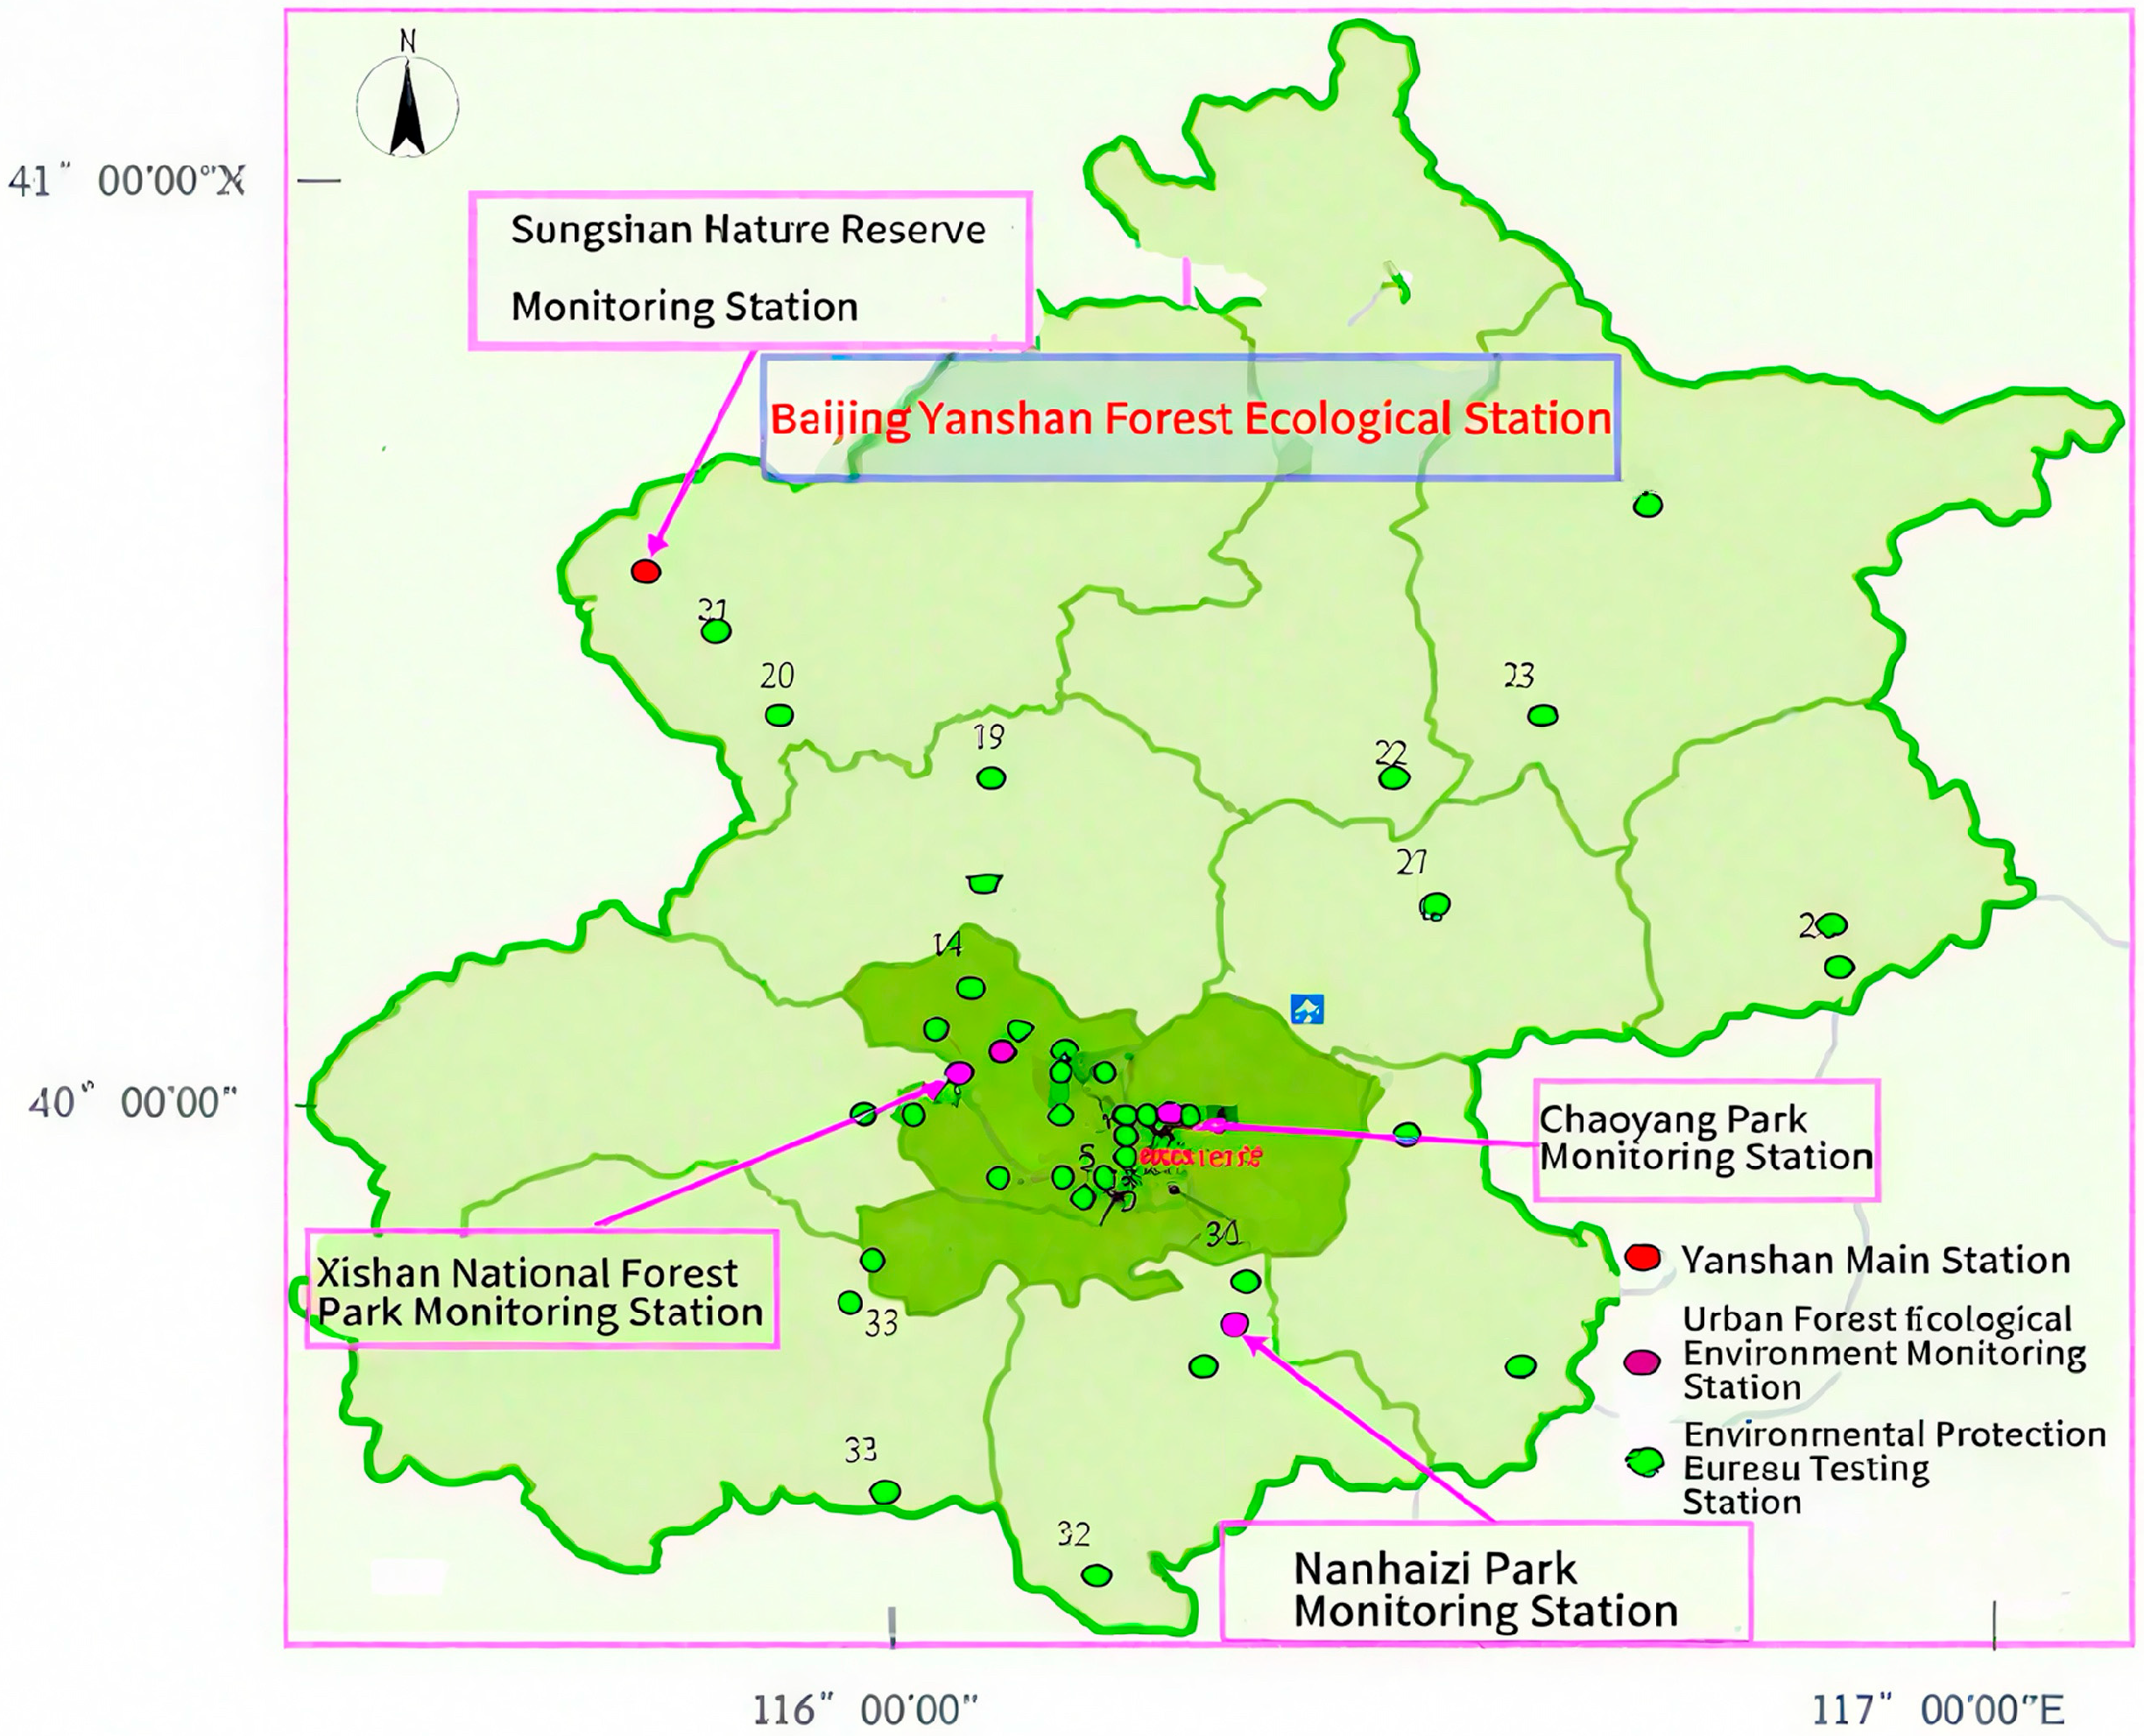
Figure 1. Distribution of urban forest ecological environment monitoring stations.
Atmosphere 16 01186 g001
Figure 2. Schematic diagram of four urban forest ecological environment monitoring stations.
Atmosphere 16 01186 g002
Figure 3. Meteorological conditions of urban forest area in Beijing in 2023. Note: The X-axis represents the months of 2023 (January to December); the Y-axis corresponds to the units of each factor: SR (W m−2), P (mm), AP (kPa), RH (%) (percentage), Ta (°C), and Vw (m s−1)). The negative sign of wind speed indicates that the wind direction is opposite to the positive north direction. It is a vector direction indicator, not the speed size; the wind direction adopts the Angle.
Atmosphere 16 01186 g003
Figure 4. Scatter plot of NAI and NOx concentrations in different intervals of environmental factors.
Atmosphere 16 01186 g004
Figure 5. Correlation between NAI and NOx under cooperative control of different meteorological conditions. ** Significantly correlated at the 0.01 level (bilateral); * Significantly correlated at the 0.05 level (bilateral).
Atmosphere 16 01186 g005
Figure 6. Systematic clustering of the classification of correlation coefficient grades between NAI and NOx under the synergistic regulation of meteorological factors. Note: 1.T2R2A3S2V1 2.T2R2A3S3V1 3.T2R3A3S2V1 4.T2R3A3S3V1 5.T3R2A3S2V1 6.T3R2A3S3V1 7.T3R3A3S2V1 8.T3R3A3S3V1.
Atmosphere 16 01186 g006
Figure 7. Path model of air pressure regulation effect and simple slope graph. ** Significantly correlated at the 0.01 level (bilateral); * Significantly correlated at the 0.05 level (bilateral). Arrows indicate the “influence paths” or “functional relationships” between variables.
Atmosphere 16 01186 g007
Figure 8. Temperature regulation effect path model and simple slope graph. ** Significantly correlated at the 0.01 level (bilateral); * Significantly correlated at the 0.05 level (bilateral). Arrows indicate the “influence paths” or “functional relationships” between variables.
Atmosphere 16 01186 g008
Figure 9. Humidity regulation effect path model and simple slope graph. ** Significantly correlated at the 0.01 level (bilateral); * Significantly correlated at the 0.05 level (bilateral). Arrows indicate the “influence paths” or “functional relationships” between variables.
Atmosphere 16 01186 g009
Table 1. Correlations between NAI, NOx and r and environmental factors in each interval.
Meteorological FactorSubregionRhand Over
rSigModel Equation
Temperature (°C)<00.1630.652Not significantly relevant
0–20−0.212 *0.022y = 1912.20 − 7.30x
>20−0.284 **0.004y = 1844.25 − 5.17x
Humidity (%)<30−0.3320.131Not significantly relevant
30–60−0.254 **0.002y = 1844.25 − 5.17x
>60−0.300 *0.021y = 1890.93 − 6.26x
atmospheric pressure (kPa)<930−0.3160.108Not significantly relevant
930–940−0.1390.22Not significantly relevant
>940−0.267 **0.003y = 1915.36 − 7.62x
Rainfall (mm·h−1)0−0.2740.001Not significantly relevant
0–1−0.2940.173Not significantly relevant
>1−0.2950.171Not significantly relevant
Radiation (w·m−2)<30−0.1950.131Not significantly relevant
30–60−0.261 *0.02y = 1919.88 − 6.61x
>60−0.382 **0.001y = 1943.60 − 10.09x
wind speed (m·s−1)<1−0.365 **0.001y = 1947.16 − 9.23x
1–2−0.110.385Not significantly relevant
>2−0.2750.07Not significantly relevant
** Significantly correlated at the 0.01 level (bilateral); * Significantly correlated at the 0.05 level (bilateral).
Table 2. Intensity grade table of the interaction effect between NAI and NOx under the synergistic regulation of meteorological factors.
Interaction Synergistic Regulation of Meteorological Factors
pole-strengthT3R2A3S2V1 (temperature > 20 °C, relative humidity 30–60%, air pressure > 940 kPa, solar radiation 30–60 W·m−2, wind speed < 1 m·s−1)
T3R3A3S3V1 (temperature > 20 °C, relative humidity > 60%, air pressure > 940 kPa, solar radiation > 60 W·m−2, wind speed < 1 m·s−1)
strengthT3R2A3S3V1 (temperature > 20 °C, relative humidity 30–60%, air pressure > 940 kPa, solar radiation > 60 W·m−2, wind speed < 1 m·s−1)
T3R3A3S2V1 (temperature > 20 °C, relative humidity > 60%, air pressure > 940 kPa, solar radiation 30–60 W·m−2, wind speed < 1 m·s−1)
weakT2R2A3S3V1 (temperature 0–20 °C, relative humidity 30–60%, air pressure > 940 kPa, solar radiation > 60 W·m−2, wind speed < 1 m·s−1)
T2R3A3S3V1 (temperature 0–20 °C, relative humidity > 60%, air pressure > 940 kPa, solar radiation > 60 W·m−2, wind speed < 1 m·s−1)
pole-weakT2R2A3S2V1 (temperature 0–20 °C, relative humidity 30–60%, air pressure > 940 kPa, solar radiation 30–60 W·m−2, wind speed < 1 m·s−1)
T2R3A3S2V1 (temperature 0–20 °C, relative humidity > 60%, air pressure > 940 kPa, solar radiation 30–60 W·m−2, wind speed < 1 m·s−1)
Table 3. Analysis results of air pressure regulation effect.
Pattern 1Pattern 2Pattern 3
BStandard ErrortpβBStandard ErrortpβBStandard Errortpβ
constant1771.8515.96111.050.00 **-1771.8516.10110.070.00 **-1774.7114.97118.550.00 **-
NOx−13.911.65−8.460.00 **−0.82−13.851.66−8.330.00 **−0.82−10.472.04−5.130.00 **−0.62
atmospheric pressure −1.402.23−0.630.53−0.06−0.492.09−0.230.82−0.02
NOx * atmospheric pressure −0.690.27−2.530.02 *−0.31
R20.680.680.74
Adjust R2F = 71.55, p = 0.00F = 35.34, p = 0.00F = 29.53, p = 0.00
F value0.680.010.05
△R2F = 71.55, p = 0.00F = 0.40, p = 0.53F = 6.38, p = 0.02
Note: The dependent variable = NAI * p < 0.05 ** p < 0.01; B (Unstandardized Coefficient); β (Standardized Coefficient)
Table 4. Results of temperature regulation effect analysis.
Pattern 1Pattern 2Pattern 3
BStandard ErrortpβBStandard ErrortpβBStandard Errortpβ
constant1771.8515.96111.060.00 **-1771.8516.02110.590.00 **-1774.5514.34123.720.00 **-
NOx−13.921.64−8.460.00 **−0.82−13.841.65−8.370.00 **−0.82−10.831.78−6.100.00 **−0.64
atmospheric pressure 1.201.420.850.400.082.281.321.730.090.16
NOx * atmospheric pressure 0.480.163.060.01 **0.33
R20.680.690.76
Adjust R20.670.670.73
F valueF = 71.55, p = 0.00F = 35.83, p = 0.00F = 33.04, p = 0.00
△R20.680.010.07
Adjust F valueF = 71.55, p = 0.00F = 0.72, p = 0.40F = 9.34, p = 0.01
Note: The dependent variable = NAI * p < 0.05 ** p < 0.01.
Table 5. Results of humidness regulation effect analysis.
Pattern 1Pattern 2Pattern 3
BStandard ErrortBStandard ErrortBStandard ErrortBStandard ErrortBStandard Errort
constant1771.8515.96111.040.00 **-1771.8516.19109.410.00 **-1764.5715.88111.120.00 **-
NOx−13.911.65−8.460.00 **−0.82−13.931.72−8.110.00 **−0.82−14.791.70−8.730.00 **−0.88
air humidity 0.061.250.050.960.01−0.131.20−0.110.91−0.01
NOx * air humidity 0.240.122.040.05 *0.20
R20.680.680.71
Adjust R20.670.660.69
F valueF = 71.55, p = 0.000F = 34.73, p = 0.00F = 26.75, p = 0.00
△R20.680.000.04
F valueF = 71.55, p = 0.00F = 0.002, p = 0.96F = 4.15, p = 0.05
Note: The dependent variable = NAI * p < 0.05 ** p < 0.01.
Disclaimer/Publisher’s Note: The statements, opinions and data contained in all publications are solely those of the individual author(s) and contributor(s) and not of MDPI and/or the editor(s). MDPI and/or the editor(s) disclaim responsibility for any injury to people or property resulting from any ideas, methods, instructions or products referred to in the content.