1. Introduction
In the modern age, people from every corner of the planet spend most of their time in indoor spaces [
1,
2,
3,
4,
5,
6,
7,
8,
9], which makes the field of indoor air quality (IAQ) more relevant than ever. Furthermore, during the COVID-19 pandemic, a great challenge for the health of cities and societies, people experienced national lockdowns, which made them more vulnerable to massive exposure to indoor air pollution [
5,
6,
10,
11].
The envelopes of modern buildings have become increasingly airtight since the latter half of the 20th century to minimize air leakage, reduce the infiltration of outdoor pollutants, and improve energy efficiency. As a result of this approach, poor air circulation can occur, allowing the concentrations of indoor pollutants to increase to harmful levels if no additional measures are taken [
12,
13,
14].
Previous studies have taken into consideration different strategies to achieve acceptable indoor air quality by varying the ventilation rates based on different parameters. Some of the most common approaches are demand-controlled ventilation strategies, the majority of which are based on carbon dioxide concentrations [
15,
16,
17,
18], but as mentioned previously, a varied range of pollutants can be found in the indoor environment. Similar strategies are considered by other studies [
15] but with a focus on energy-saving costs rather than ensuring indoor air quality, in order to minimize the costs of building operation.
Although many research studies focus on strategies that ensure adequate IAQ or minimize energy costs, very few study the two topics together [
8,
14]. Zhao et al. [
8] studied the performance of different ventilation modes (natural, natural with an air purifier, and mechanical ventilation) by monitoring indoor air quality and energy consumption. The results showed that the daily energy consumption per area for mechanical ventilation is about 1.5 times that for natural ventilation with an air purifier, but the indoor air quality is not significantly enhanced. Ganesh et al. [
14] focused on this issue and formulated an optimization problem in that the ventilation rate is continuously updated to ensure that the concentrations of three pollutants do not reach values higher than the threshold levels mentioned in technical regulations. Pollutant concentrations and energy consumption resulting from the application of this optimization strategy were then compared to a baseline scenario where the ventilation rate was kept constant in the studied space.
In order to ensure an adequate quality of indoor air, complex solutions to this challenging issue must be found because the sources of pollutants, both man-made and natural substances, can be outdoor, indoor, or both [
2,
4,
14]. The specialized scientific literature mentions three main categories of indoor pollutants of concern, namely particulate matter (PM), volatile organic compounds (VOCs), and volatile inorganic compounds (VICs).
The COVID-19 pandemic, during which people were practically stuck inside, strongly emphasized the need to pay more attention to and rethink strategies regarding the insurance of adequate indoor air quality (IAQ) with optimal energy consumption [
4,
5,
10,
13,
14,
15,
16,
19]. The scientific community is looking for solutions to remove the accumulation of indoor pollutants and minimize the risk of infection through ventilation (mechanical or hybrid [
15,
20]), actions that inevitably lead to an increase in energy consumption.
From the IAQ point of view, ventilation is important, being the link between the indoor and outdoor environments, with the simultaneous advantage of reducing indoor pollution through the supply of fresh air and the disadvantage of increasing the level of indoor pollution with pollutants brought from outside. However, ventilation leads to an increase in energy consumption and, for example, in Romania, a methodology is in force for calculating the energy performance of buildings, code MC001-2022 [
21], which defines eight energy classes (energy performance classes) from class A+ to class G based on the total primary energy values. From here resides the fact that ventilation is the link between the two problems to be solved: indoor air quality and energy consumption. A recently proposed approach is natural ventilation [
19], commonly used to achieve energy savings in buildings, but the opening of windows leads to an inflow of pollutants from outdoor air, and countermeasures are required for their removal. Mechanical ventilation is the most studied by scientists, as is shown in a systematic review carried out in [
15] on published research papers from 2020 to 2022, which highlights that 65.6% of the papers focused on this mode of ventilation. Concluding the above, it can be said that interest in one of the areas of either indoor air quality or energy efficiency increases depending on the crisis that humanity is going through. With the outbreak of the COVID-19 pandemic, the IAQ field gained special importance due to its connection with human health, but finally, both issues are of significant importance for our existence.
As mentioned, there are very few studies that focus on the two topics of IAQ and energy consumption together [
8,
14]. In the first phase of research, the obtained results lead to the necessity of extension to include several pollutant species. The lack of a simultaneous analysis of several pollutants is a great disadvantage to the current state of research since the air quality cannot be described only by a single pollutant species. Also, ventilation strategies need to look at air quality as a whole, not just a single pollutant, in addition to energy consumption. Our study fits into this new direction. In our research, the indoor concentration evolution of four different pollutants was studied, comparing their different behaviors. Moreover, in this study, the use of a new indoor air quality index is proposed, I
IAQ, which groups the effects of four types of indoor pollutants. Therefore, our research aims to address the following challenges: (a) Is the ventilation strategy similar for any of the pollutants? (b) Can this new index, I
IAQ, be adapted depending on the type of pollutant that presents the most dangerous values? (c) Can this I
IAQ index be used simultaneously with energy consumption so that there are ventilation strategies that take into account indoor air quality and energy consumption? (d) Should the ventilation strategy have an adaptive behavior? This article will present the methods that were used, the results obtained from the simulations, and the discussions regarding the specifics of each pollutant and the combined indoor air quality index, I
IAQ.
2. Methods
To reach the mentioned goal, in this study, a modeling approach was chosen, both on the indoor air quality side and on the energy side.
With regard to this approach on the indoor air quality side, this study will consider the following to be known:
- (1)
The current levels of pollution inside the building (values measurable in real-time for different buildings by means of real-time measuring techniques);
- (2)
The sources of pollutants from inside the building (the values are predictable through different models that take into account the degree of occupancy of the indoor space and the type of activity carried out inside the building);
- (3)
The condition of the filters in the ventilation installation, the air flows that occur during building operation;
- (4)
Outdoor concentrations of pollutants.
And it will predict the indoor pollution level at the next time step. As far as energy consumption is concerned, this will depend on the functioning of the ventilation system (on the air flow introduced and on the temperature at which the air is heated in the cold season). Thus, this system of equations for modeling this transfer process will have as its objective the simultaneous determination of (i) indoor air quality (both as a pollutant concentration and from the perspective of an indoor air quality class) and (ii) energy consumption.
This process becomes substantially more difficult as the air quality is estimated by several polluting species, each with its own specificity, its own sources of pollution either inside or outside the building, or both.
In this analysis, four different pollutants will be considered, which are among the most frequently encountered indoor pollutants, whose concentration values measured in different types of buildings often exceed the permissible limits: formaldehyde (HCHO), particulate matter with a 2.5 µm diameter (PM
2.5), ozone (O
3), and carbon dioxide (CO
2). For the choice of pollutants, three reasons were taken into consideration, namely the impact of the pollutants on human health, the data from the specialized literature regarding the selection of representative pollutants for the assessment of indoor air quality in buildings [
22,
23], as well as the hypothesis according to which the pollutants considered in the mathematical modeling do not chemically react with each other.
Formaldehyde (HCHO) is one of the most studied compounds [
12,
14,
24] from the category of volatile organic compounds (VOCs) [
24,
25,
26], with high toxicity and carcinogenicity to humans. HCHO indoor sources are wood-based materials (laminate and furniture) and consumer products [
12,
14,
27,
28,
29]. Formaldehyde is classified as a group 1 carcinogen, according to [
30], and long-term exposure to HCHO can cause nasopharyngeal cancer, lung damage, leukemia, and symptoms related to sick-building syndrome [
24,
31].
Particulate matter (PM) can either originate from outdoor sources (natural, such as storms, volcanic eruptions, etc., or anthropogenic, such as burning fuel, steel industry, etc.) or from indoor sources (heaters, fireplaces, household activities, etc. [
32]). The adverse effects of PM
2.5 on human health (on respiratory and cardiovascular systems) can lead to an increase in mortality and morbidity [
2,
4,
14,
33], estimating that, globally, PM
2.5 is the cause of more than 2 million deaths annually [
34].
Carbon dioxide (CO
2) and ozone (O
3) are among the main volatile inorganic compounds [
4]. CO
2 is produced naturally and by human activities. Long-term exposure to these gases causes health problems such as respiratory, cardiovascular, and neurological problems [
35,
36]. Ozone is a result of photochemical reactions involving NOx and VOCs. An O
3 indoor air concentration depends on the O
3 outdoor concentration, air exchange rate, and indoor emissions percentage. Moreover, reactions between O
3 and other chemicals are potentially harmful to human health; even in very small amounts, ozone inhalation cause asthma, emphysema, and chronic pulmonary diseases [
4,
37,
38].
The air exchange rate represents the link between outdoor environment pollution and indoor pollution levels. Moreover, the air exchange rate also considerably influences the energy consumption for the heating of the cold, winter outdoor air. Thus, this research will simultaneously analyze the effects that different building ventilation strategies have on the two design estimators (indoor air quality and energy consumption). The indoor air quality will be estimated as a function of the indoor pollutant concentration and will further be converted in the form of air quality classes, similar to energy classes [
21], which are well known internationally. Finally, the results (the effects of different ventilation strategies) will be compared with the effect of the standard ventilation strategy, and consequently, proposals will be made for an optimal ventilation strategy.
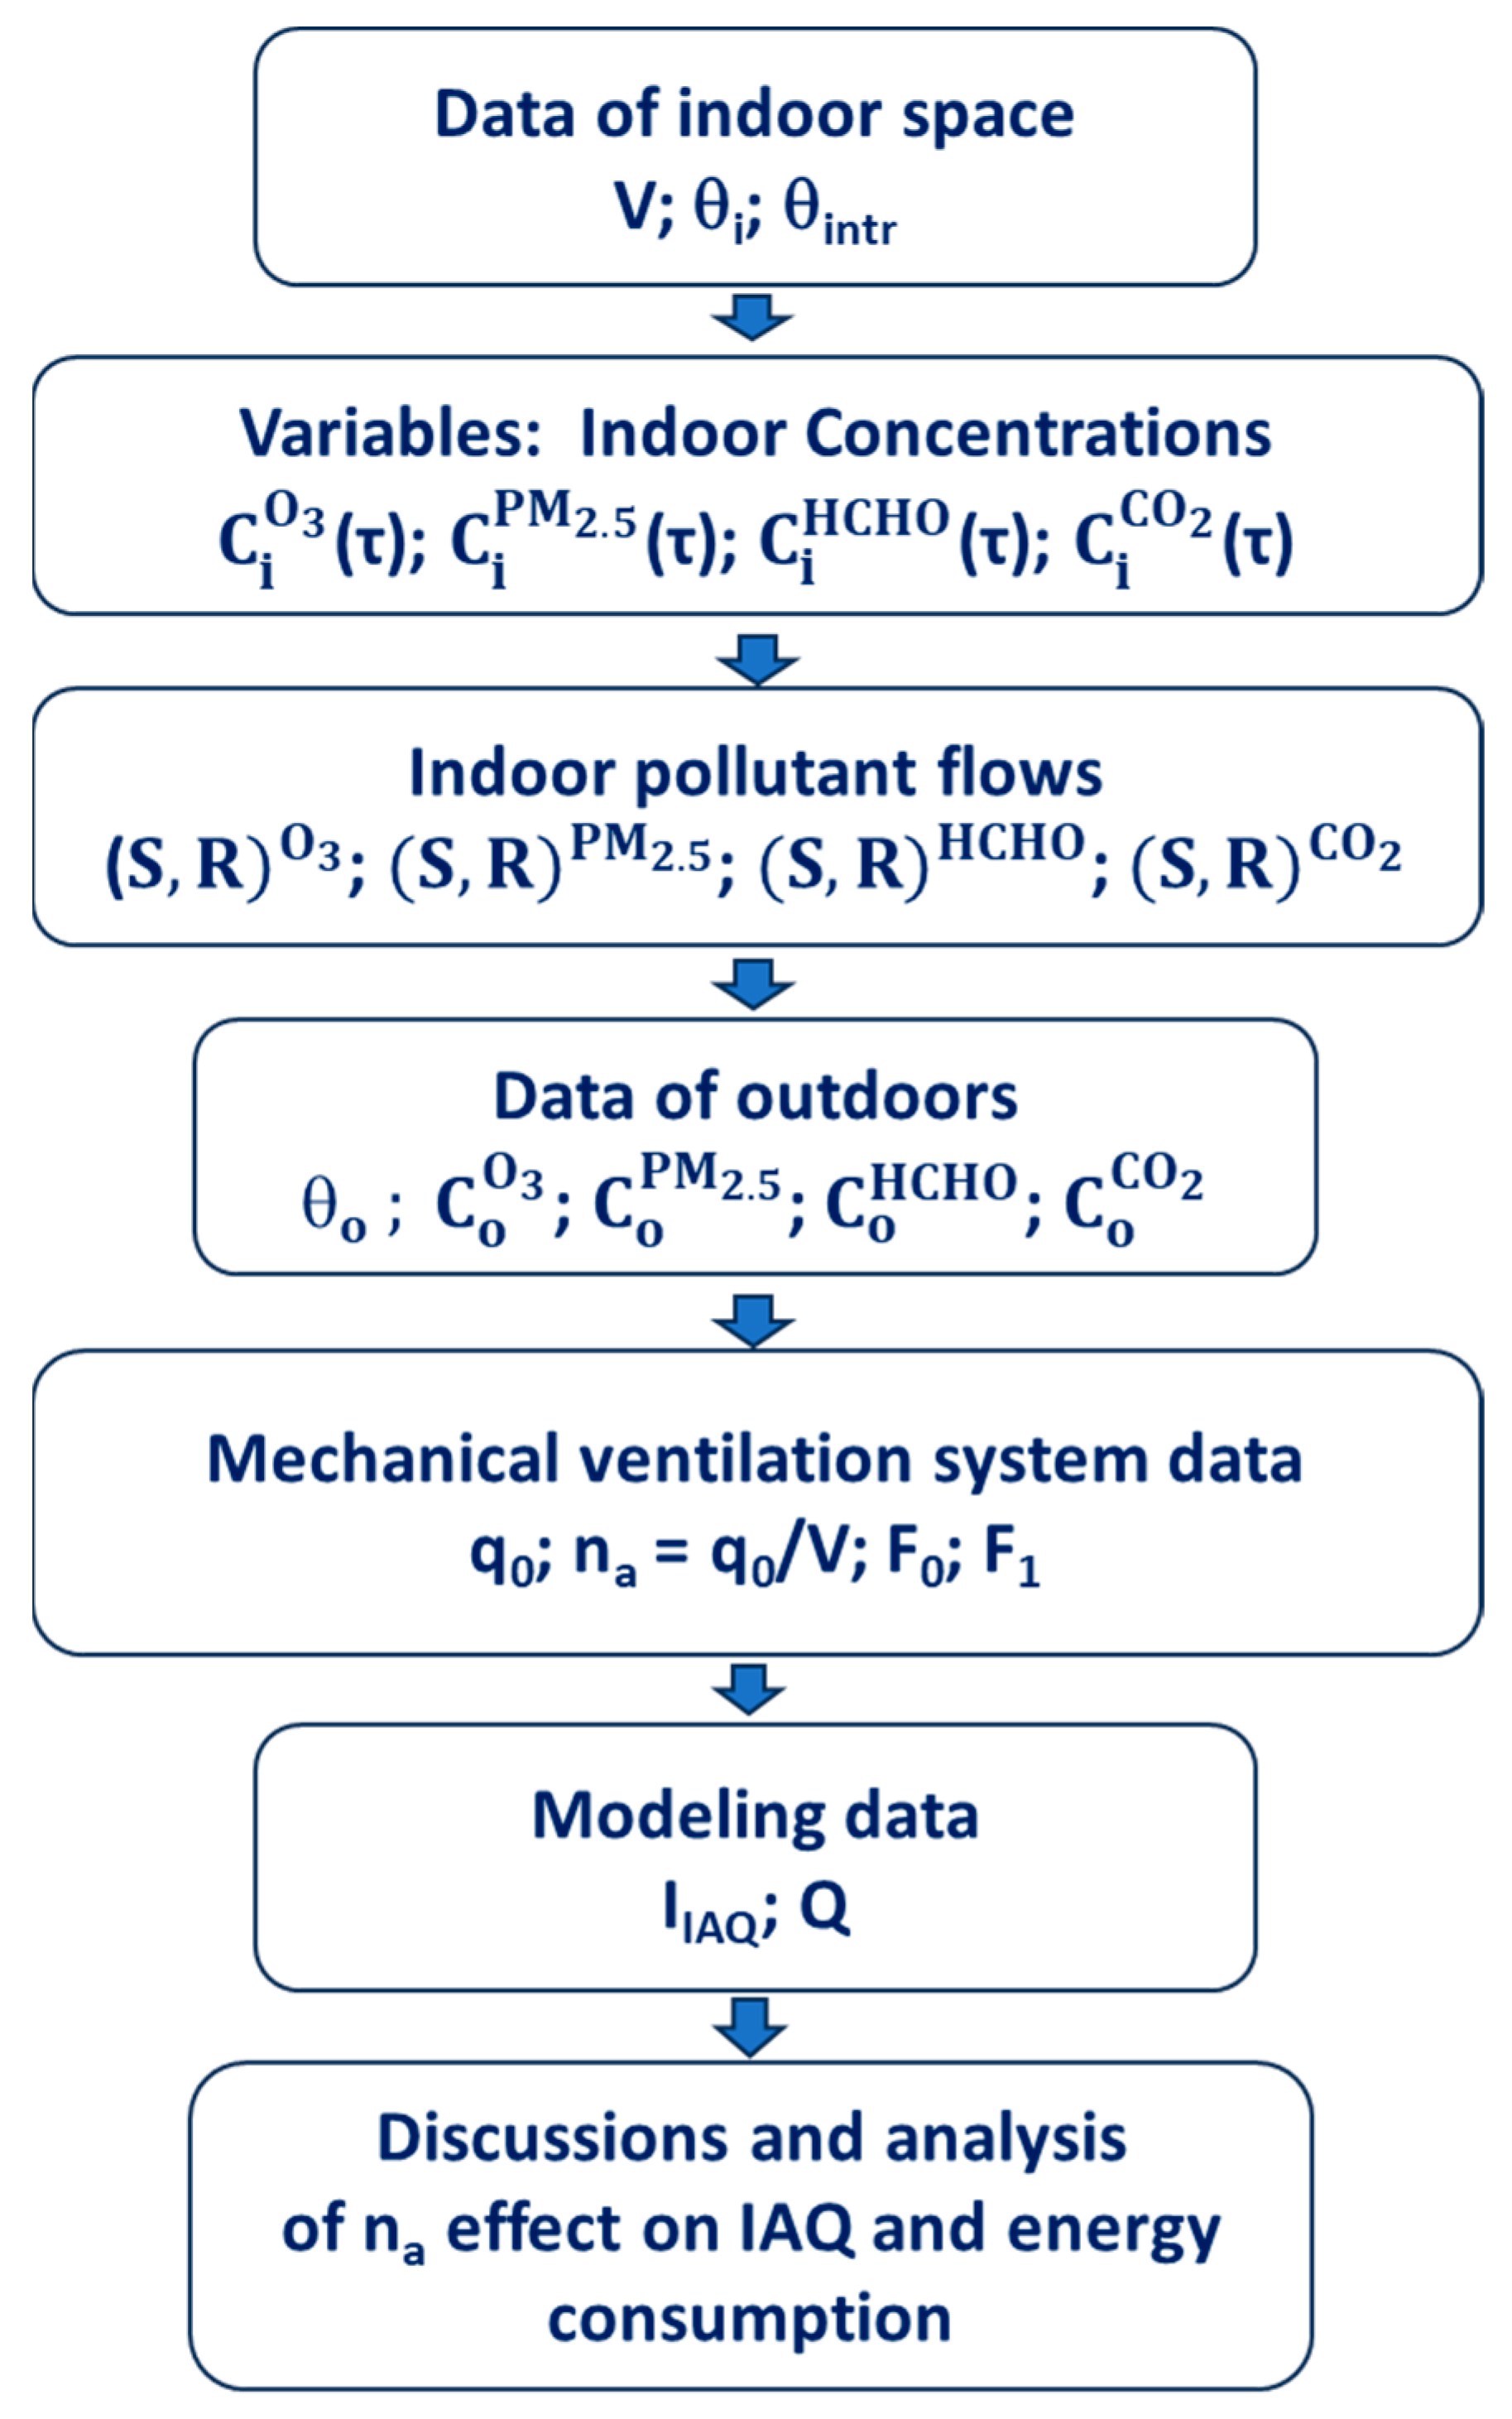
Figure 1 presents the main stages of this research: The description of the indoor space data, the current values of the indoor pollutant concentrations, the indoor pollutant flows, the outdoor pollution levels, the operation strategy of the ventilation system, the modeling of the IAQ index, energy consumption and, finally, an analysis of the simultaneous effects on the IAQ and the energy consumption.
Furthermore,
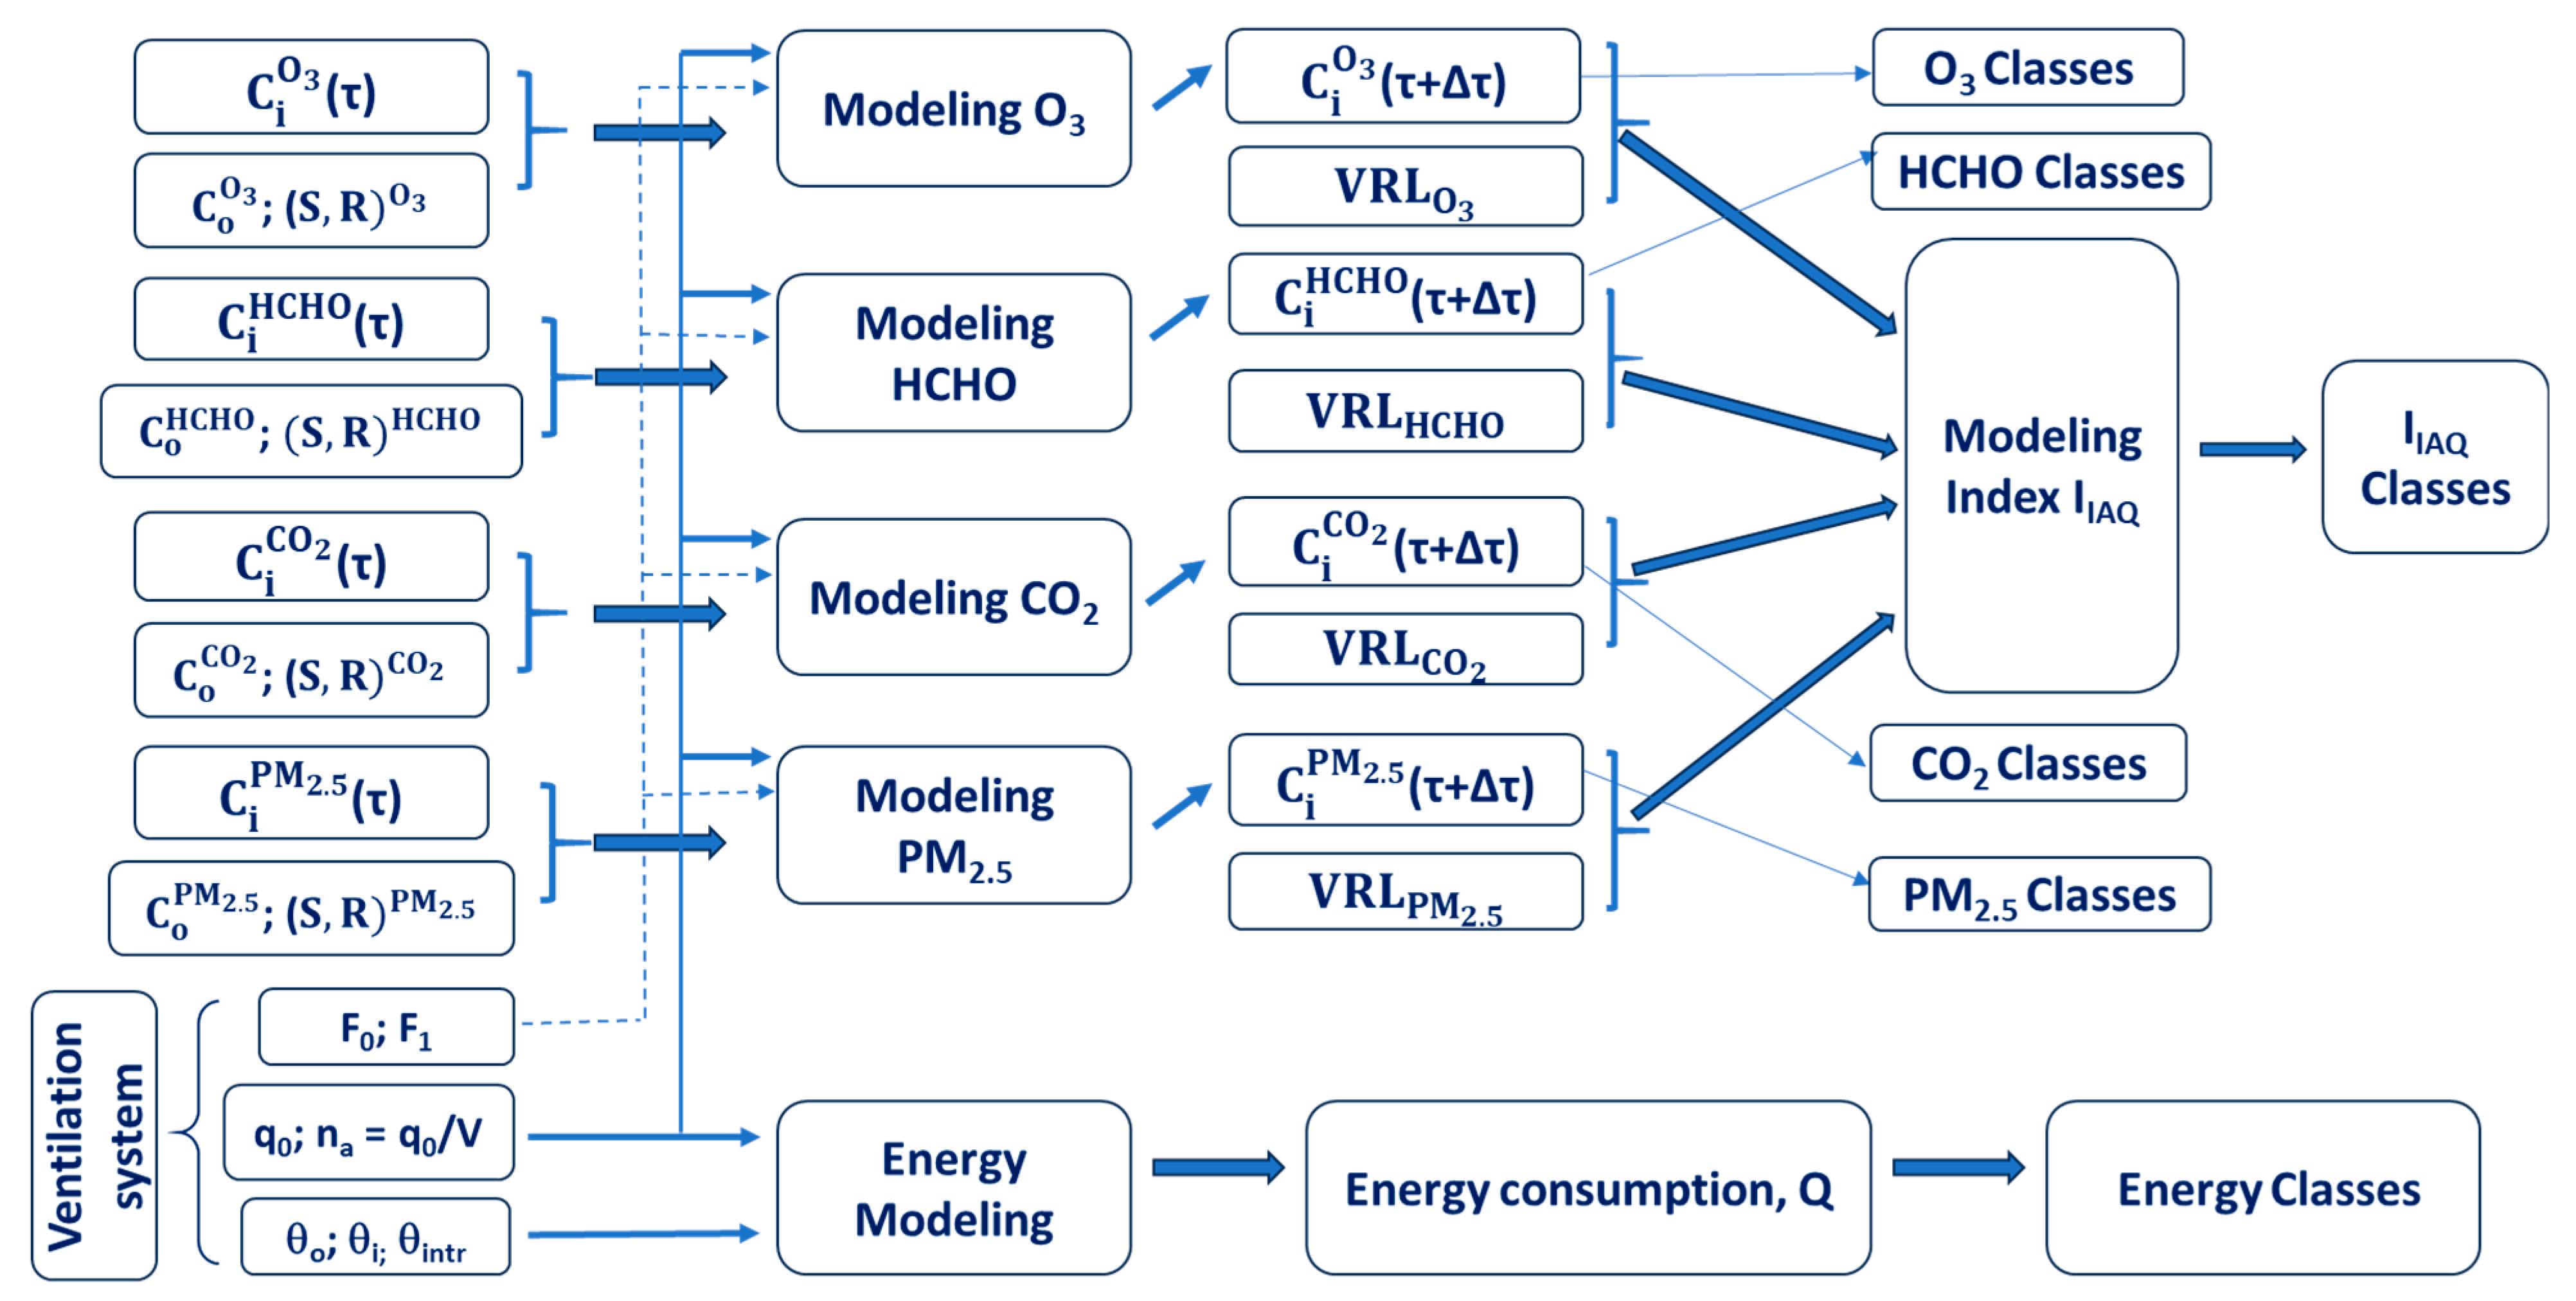
Figure 2 presents the global schema of the modeling of the two output parameters (the IAQ index and energy consumption). The main stages of this large modeling are:
- -
The prediction of the indoor pollutant concentrations at the next time step (τ + Δτ) as a function of the following: (1) their current values (time step τ), (2) the outdoor pollutant concentrations, (3) indoor pollutant flows, and (4) the ventilation rate;
- -
The prediction of the overall IAQ index, regrouping the different pollutant concentrations and their limit values;
- -
The prediction of the energy consumption according to the ventilation rate.
The values of the two predicted parameters of the indoor space (the overall IAQ index and energy consumption) are further analyzed, and the ventilation strategy is discussed.
This chapter will continue by presenting (1) the physical models used to predict indoor air quality at the next time step, (2) the physical model for determining energy consumption, and (3) the indoor air quality classes and energy classes.
2.1. Mathematical Modeling of Indoor Air Quality, by Including the Transfer of Pollutants from External Sources and Variable Indoor Emissions
As previously mentioned, the first stage of our research focused on the mathematical modeling of indoor air quality [
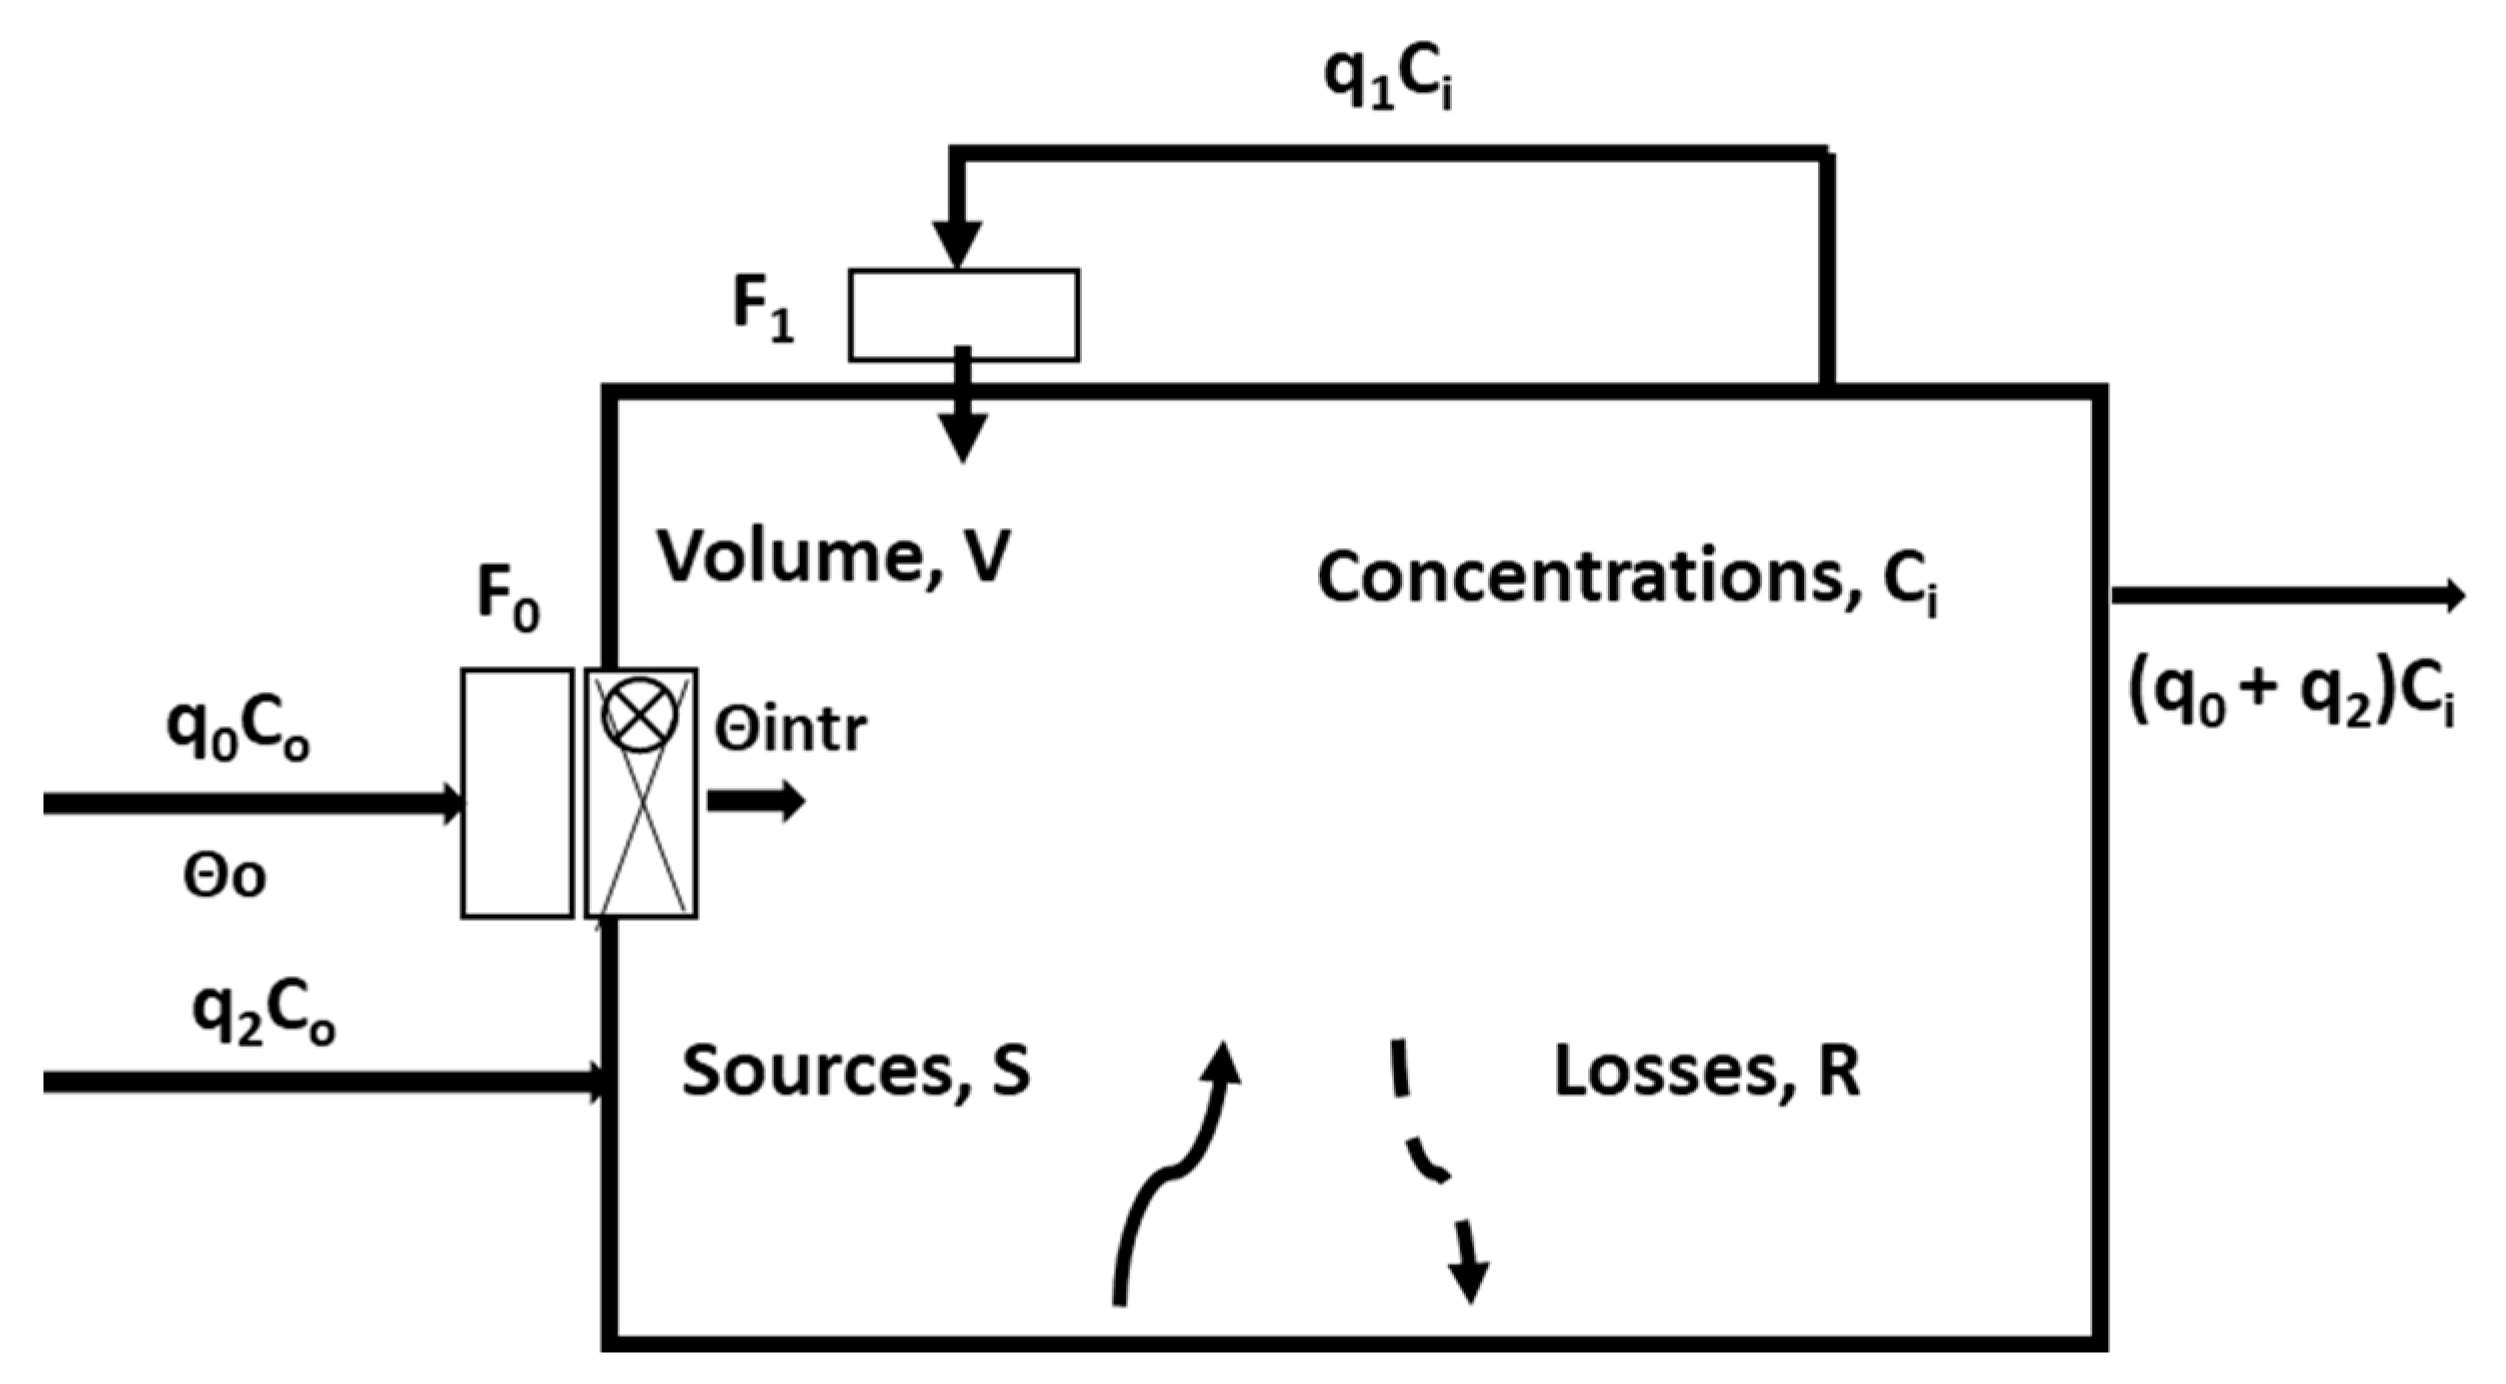
39] in a climatized thermal zone (ZTC). The indoor space has a volume, V, and inside, we assumed a uniformly distributed concentration of pollutant, Ci. This space has a mechanical ventilation system for the introduction of fresh outdoor air and recirculation. Two air flows link the outdoor and the indoor environments together: (1) q
0, introduced through the mechanical ventilation system, and (2) the infiltration air flow, q
2 (
Figure 3).
The pollutant mass balance equation for the indoor space is as follows:
where S and R represent the sources and loss terms, and the left term of the equation represents the pollutant increase indoors. This equation is further developed by introducing the outdoor concentration, C
o, the indoor concentrations, C
i, and the filters F
0 and F
1. After successive processing (shown in extenso in [
39]), the solution of the equation is
where
V, (m3), is the indoor space volume;
q0, (m3/h), is the fresh air flow introduced through the mechanical ventilation system;
q1, (m3/h), is the recirculated air flow;
q2, (m3/h), is the infiltration air flow;
Co, (µg pollutant/m3 air), is the mass concentration of the pollutant from the outside of the space;
Ci, (µg pollutant/m3 air), is the mass concentration of the pollutant from the inside of the space;
F0, (–), is the filter through which it circulates fresh air introduced through the ventilation system, characterized by its constant (the percentage of retained pollutant, which has values between 0 and 1);
F1, (–), is the filter through which it circulates the recirculated air, characterized by its constant (the percentage of retained pollutant, which has values between 0 and 1);
S, (µgpollutant/h), is the mass flow rate of the pollutant source;
R, (µgpollutant/h), is the mass flow rate of the pollutant loss;
Ci(τ), (µg pollutant/m3 air), is the indoor mass concentration of the pollutant at time step τ;
Ci(τ + Δτ), (µg pollutant/m3 air), is the indoor mass concentration of the pollutant at the next time step (τ + Δτ).
While the indoor pollutant concentration is variable from one time step to another, the other parameters (q1, q2, Co, Ci, F0, F1, S, R) are constant during the time interval between the time steps (τ) and (Δτ).
This equation was used for each of the four pollutants, leading to a system of four independent equations. Moreover, the equation of the energy consumption for the heating of the cold ventilation air is added to form a five-equation system, shown in (3).
where
Q, (kWh), is the energy consumption;
Ρair (kg/m3), is the air density;
cair (J/kg·K), is the air-specific heat;
θo, (°C), is the outdoor air temperature;
θintr (°C), is the temperature of the air introduced into the indoor space.
The equations’ system (3) includes independent equations with unknowns: (τ + Δτ), (τ + Δτ), (τ + Δτ), (τ + Δτ), and Q.
2.2. Indoor Air Quality Classes and Indexes
The Romanian regulation for the design, execution, and operation of ventilation and air conditioning installations [
40] states that “all rooms of a building must ensure indoor air quality respecting the limits of specific parameter values (according to the national annex to the standard SR EN 16798-1)”. Also, the regulation emphasizes that “indoor air quality is ensured by ventilation, depending on the purpose of the room, the type of pollution sources and the activity that takes place in the room”. Therefore, four indoor air quality categories (classes) are established, namely: class IDA 1, described as high indoor air quality; class IDA 2, average indoor air quality; class IDA 3, moderate indoor air quality; and class IDA4, low indoor air quality. Also, the regulation stipulates that the ventilation flow rate (with outside fresh air) is determined depending on the ambiance category, the number and activity of the occupants, as well as the polluting emissions of the building and systems. However air quality is classified according to the concentration of CO
2 accepted in the indoor air, which is above the outdoor concentration, when only taking into consideration the source of pollution represented by the bio-effluents emitted by people. The accepted levels of CO
2, which are above the level in the outside air, are lower than or equal to 400 ppm for the IDA1 class, going up to higher or equal to 1000 ppm for the IDA 4 class.
According to the majority of research studies, a large range of pollutants can be found in indoor spaces. In this respect, based on [
7,
23,
39,
41,
42,
43] and on the energy classes idea from [
21], eight indoor air quality classes were designed for each of the four studied pollutants.
To facilitate the understanding of IAQ issues by non-professionals and to promote IAQ improvement, worldwide indices have been created in recent decades, often being incorporated into indoor environmental quality (IEQ) assessments [
41]. Two different approaches are commonly used to construct IAQ indices: questionnaires and indoor measurements. More commonly, IAQ indices are measurement-based, with examples that include the BILGA index proposed in France and reviewed by Kirchner et al. [
44] and the proposed IAQ certification in Hong Kong [
45]. Salis et al. [
46] centralized the scientific information on the IAQ indices according to the different approaches used to define them, as follows:
- (1)
An index for a single pollutant: In this approach, a dimensionless index is defined as the ratio of the concentration to a reference value. The reference value defines a typical health risk. A ratio greater than one, i.e., a concentration greater than the reference value, indicates a potential IAQ problem or risk. An index is calculated for each individual pollutant and is specific only for this pollutant; indices are not aggregated.
- (2)
Simple aggregation: In this approach, a single index is calculated by aggregating the derived indices for the individual pollutants as described above. Aggregation is conducted by adding the individual indices, by taking the maximum index, or by other integration methods.
- (3)
Aggregation, according to pollutant sources and/or types of pollutants: In this approach, an aggregation of pollutants is conducted according to their types and/or sources.
- (4)
Accounting aggregation for the building stock IAQ: In this aggregation method, the index refers to the potentially highest and lowest concentrations of the pollutant of interest measured in the building stock. For example, ref. [
47] proposed the indoor air pollution index (IAPI), a composite index in which sub-indices are aggregated using the arithmetic mean, taking the average concentration of the considered pollutants.
- (5)
Aggregation by simply adding the health impacts: In this approach, the disability-adjusted life years (DALYs) are calculated for each pollutant and added to estimate the burden of disease from indoor exposures. DALYs are simply years of healthy life lost [
48]. DALYs are defined by the WHO [
49] and consider only the tangible health effects documented in human studies.
In our research, a system of indoor air quality indices was built, I
IAQ, for each pollutant considered. These individual indexes are expressed by the ratio between the indoor concentration, C
i, and the permissible limit concentration, C
VRL, according to the WHO [
50] and/or the European Directive 2008/50 [
51]. However, this type of index does not correspond entirely to the real situations when there could be several pollutants simultaneously indoors. Therefore, along with the individual IAQ indexes, a new combined indoor air quality index,
, was used. This new index was obtained by summing the indices for each of the four pollutants and is presented in Equation (4):
This new index is based on the additive effects on human health. This approach for the combined IAQ index was previously used by Wei and colleagues in 2016. In their study, six indices were taken into account. Further, their index is the one proposed by the Paris Hygiene Laboratory (LHVP).
The so-called VRLs (Valeurs à Risques Limités) were chosen as reference limit values, which means that for exposures below these values, the health risks are limited, even zero, or unknown. The considered VRL concentrations for the four pollutants, C
VRL, are:
The indoor air quality classes for the four selected pollutants and the combined index are presented in
Table 1.
2.3. Energy Classes (Energy Performance Classes)
Referring to the topic of energy consumption, in Romania, the methodology for calculating the energy performance of buildings, code MC001-2022 [
21] is in force, which defines the eight energy classes (energy performance classes) from class A+ to class G, based on the total primary energy values, depending on the category of the building and the energy utility.
In order to interpret the value of the amount of energy that was consumed to ensure the quality of the indoor environment, it was compared with the energy consumption scale for heating, taken from [
21]. The energy consumption is expressed in kWh, and the energy scale for heating was processed, transforming the values from kWh/(m
2·year) into kWh. To obtain the kWh scale, the kWh/(m
2·year) values were divided by the number of hours in a year, namely 8760 h. In this way, the energy consumption was expressed in kWh/m
2. Next, the value obtained was multiplied by the surface of the space (90 m
2), obtaining the energy scale in kWh (
Figure 4), corresponding only to the hourly energy consumption for the heating related to the studied space [
52]. In order to facilitate the understanding of the eight energy classes provided by [
21], a color code was used (
Figure 4), ranging from green, meaning more energy efficiently, to red, meaning less energy efficiently, similar to the one established for the energy labeling provided by the European regulations.
The existing grids for energy consumption for heating, presented in [
21], were imported into our study in order to evaluate the energy consumption for the heating of the air flow introduced through mechanical ventilation.
3. Results
The Romanian technical regulation I5-2022 [
40] stipulates that “the air flow for ventilation must ensure the quality of the indoor air, for the hygiene, health and comfort of the occupants”. The flow will be established depending on the following: (1) human occupation (through the occupation profile) and (2) the emissions of polluting substances specific to the building. In [
40], different values of the outdoor air flow are required for different types of spaces, so our research will analyze the effects of several flow rates corresponding to the ventilation rate, n
a = q
0/V, n
a = 0.1–3.5 h
−1.
Based on the requirements specified in [
40], the different values of q
0 (which is the fresh air flow introduced through the mechanical ventilation system) were established, namely 18, 90, 180, 270, 360, 450, 540, and 630 (m
3/h), which corresponds to the following values of n
a: 0.1; 0.5; 1; 1.5; 2.0; 2.5; 3.0, and 3.5 (h
−1). The volume of the indoor space was 180 m
3. The indoor pollutant concentration, C
i, was obtained by using the monitored experimental data on the outdoor pollutant concentration, C
o, for each of the four selected pollutants for a period of 93 h (5580 min), as we described in [
39]. The time step, Δτ, was of 1 h.
The pollutant indoor sources, S, and losses, R, depend on the human activity and the destination of the analyzed space. In this study, we introduced their values according to the literature for each of the four selected pollutants. The specific values are presented in this section for each pollutant.
The working hypothesis is the following: (S−R) is a constant term; no chemical reactions take place between pollutants indoors; absorption/desorption phenomena do not occur on the inner surfaces of the studied space; and there is no recirculated air flow (q1 = 0) and air infiltrations (q2 = 0). Also, F1, the filter through which it circulates the recirculated air, is characterized by its constant, in this case, equal to 0.
For the calculation of energy consumption, Q, the following calculation values were used as follows: the same values of the fresh air flow introduced through the ventilation, q0 = 18–630 m3/h; the air-specific heat, cair = 1012 J/kgK; air density, ρ air = 1.225 kg/m3; the outdoor air temperature, θo = 8 °C; and the temperature of the air introduced into the indoor space, θintr = 22 °C.
In order to understand the simultaneous effects of the ventilation strategy on the IAQ and energy consumption, nomographs in two-dimensional axes were designed: the vertical axis corresponds to the pollutant concentration, and the horizontal axis corresponds to the energy consumption. Further, on each of the axes, both were presented: (1) the parameter values (modeling results) and (2) the classes of the two parameters (constructed according to the methodology presented in
Section 2).
Further, the results obtained for each selected pollutant and energy consumption are presented.
3.1. Ozone (O3)
For the O
3 pollutant that enters the indoor space from the outdoors, its indoor emission rate is assumed to be zero, and the specific calculation values are the following: The fresh air filter constant F
0 = 0; the outdoor O
3 concentration is C
o = 50.96 µg/m
3 [
39]; and the indoor O
3 concentration at the moment τ, C
i(τ) O
3, is considered to have different values between 0 and 60 µg/m
3, with a VRL limit of 120 µg/m
3 and a 1.5·VRL of 180 µg/m
3. Based on the non-reactivity of the four pollutants between themselves, the calculation hypothesis is that the indoor pollutant sources, S, and the losses, R, are both null.
The influence of the fresh air flow introduced through the mechanical ventilation, q
0, on the indoor O
3 concentration at the moment τ + Δτ, C
i(τ + Δτ), and the energy consumption, Q, are presented in graphic form in
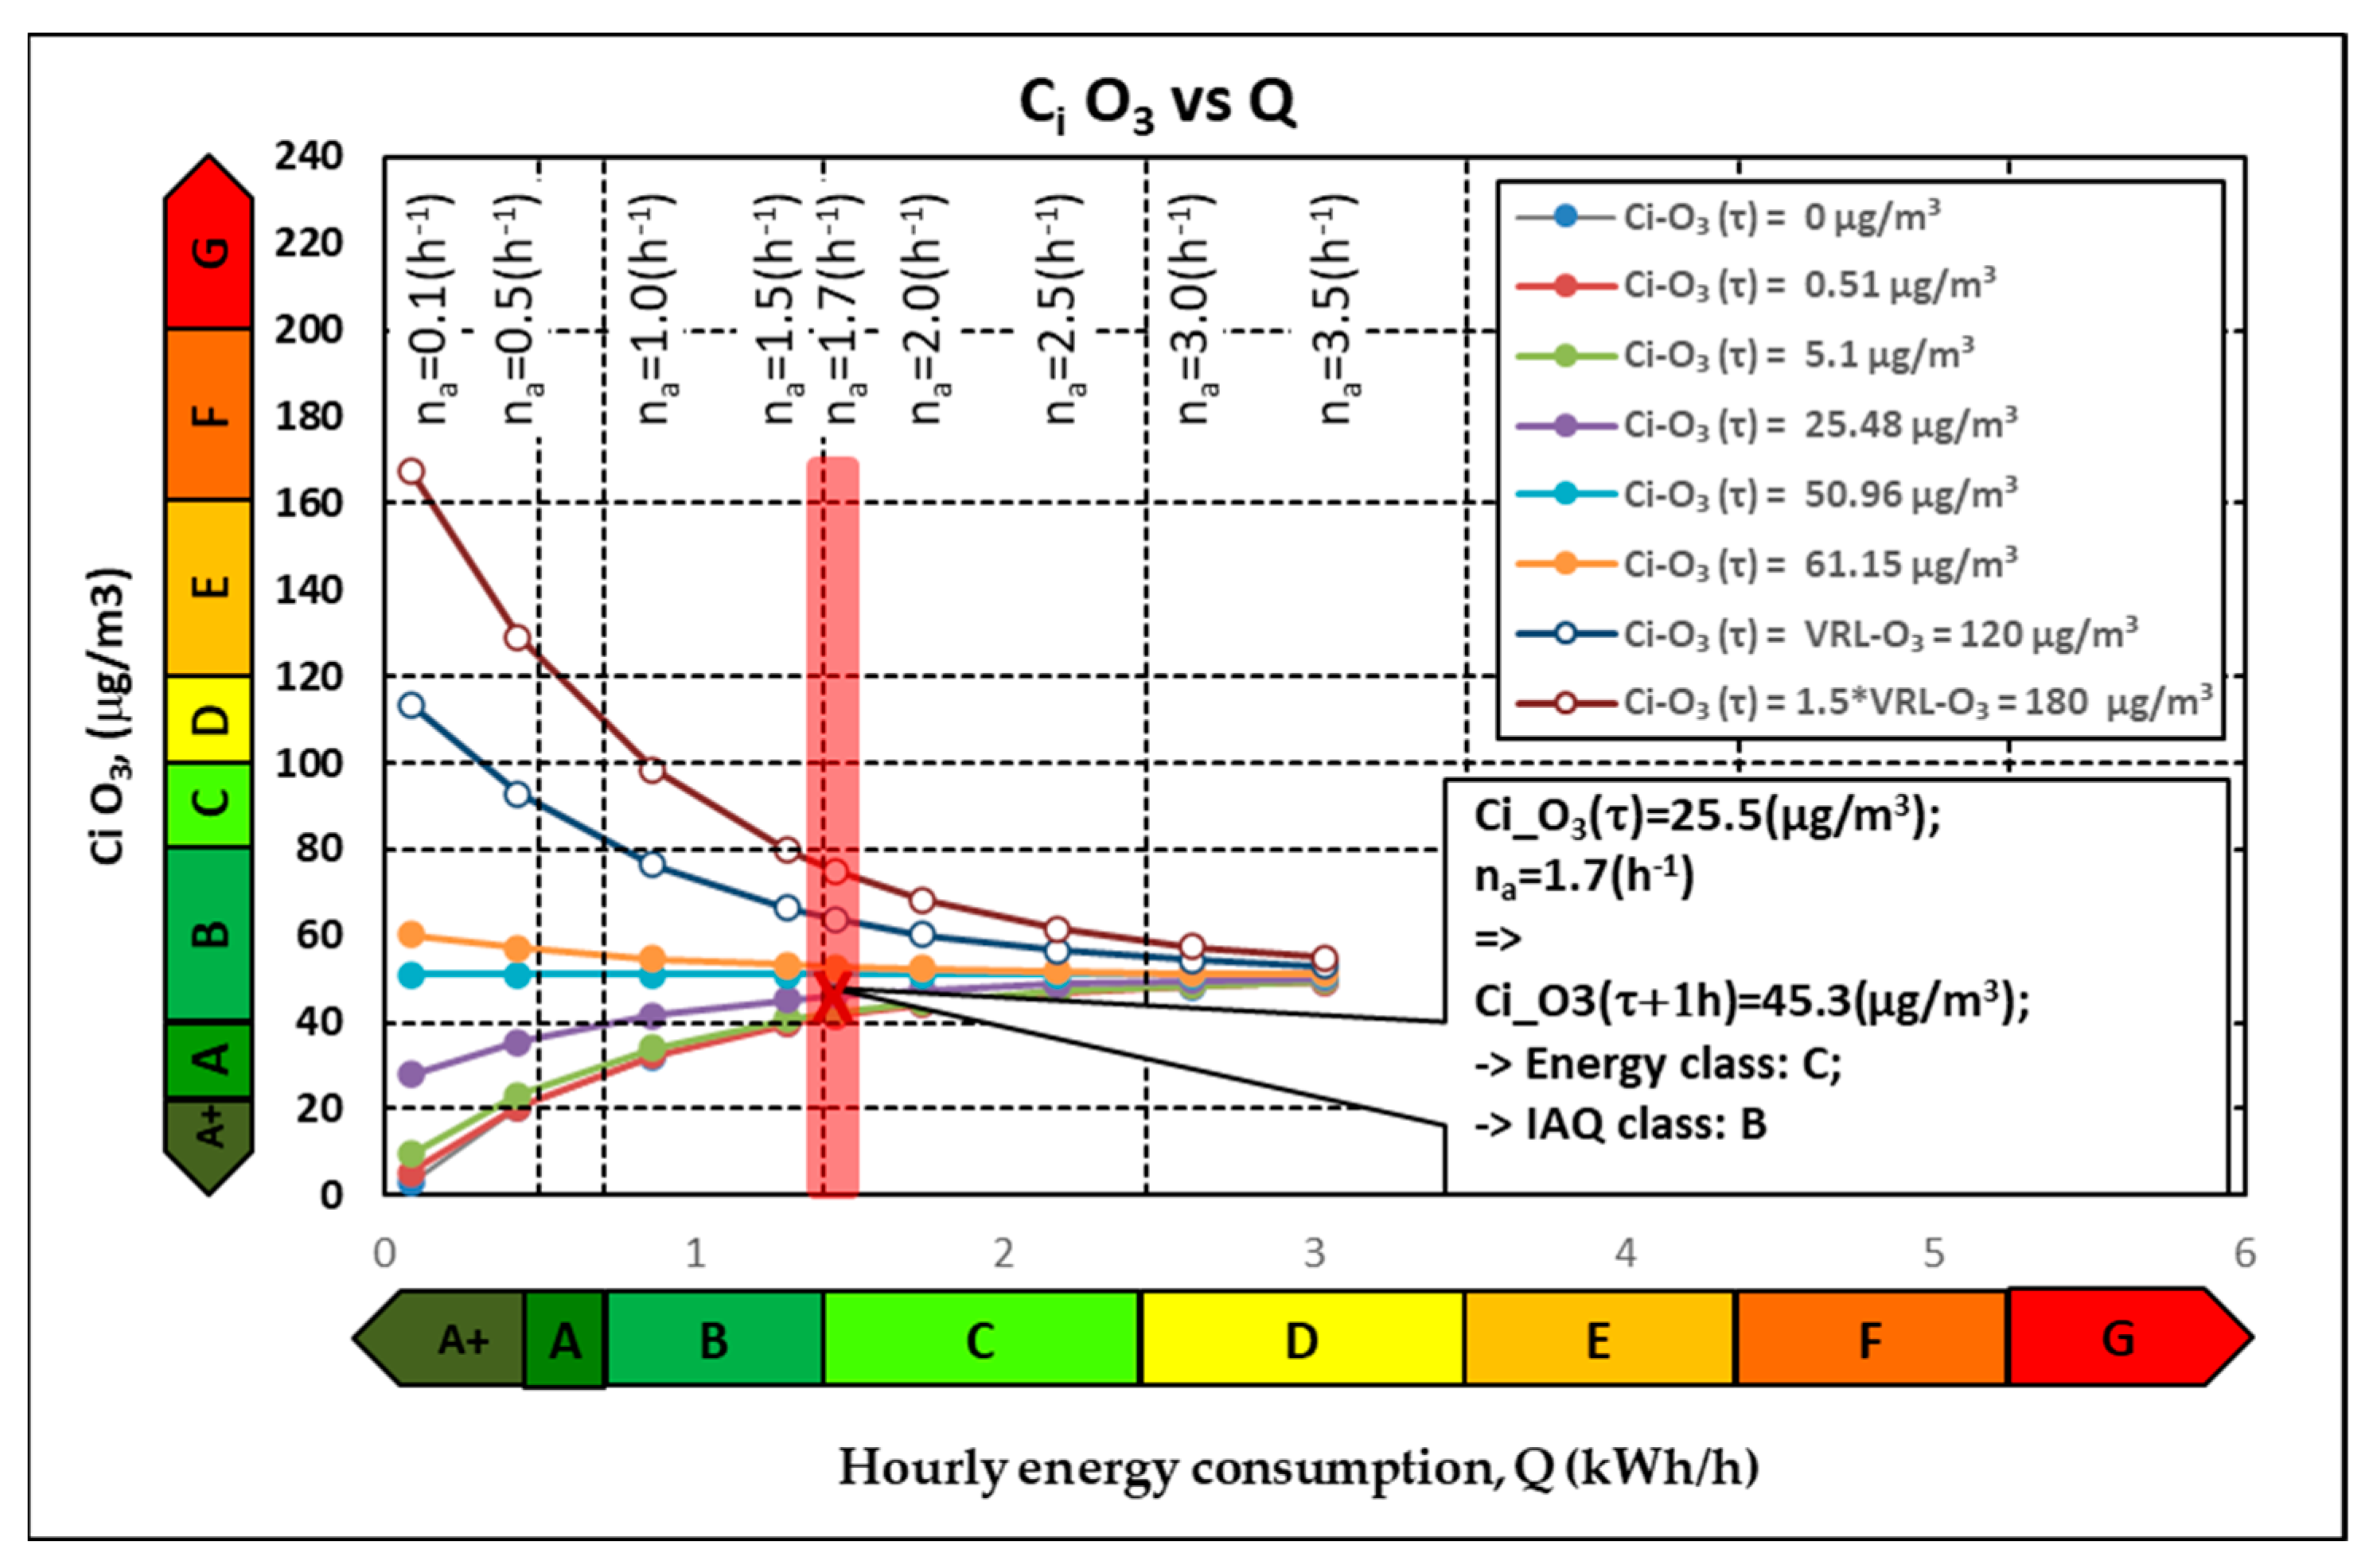
Figure 5.
Figure 5 shows the variation of the indoor concentration at the subsequent time depending on the ventilation rate, n
a, and the current indoor concentration C
i(τ). We note that if the indoor air is polluted, C
i(τ) = 180 µg/m
3 (brown curve in
Figure 3), then the outdoor air has a cleaning effect on the indoor air contaminated with ozone. It is observed that a very low flow rate of outside air (n
a = 0.1 h
−1) leads to a minor decrease in the indoor concentration, C
i(τ + Δτ)=165 µg/m
3, and that a high flow rate (n
a = 3.5 h
−1) leads to a large decrease in the indoor concentration—the latter approaching the value of the outdoor concentration, C
i(τ + Δτ) = 55 µg/m
3. This observation can also be stated from the perspective of air quality classes or energy classes. Thus, corresponding to the high value of the previous indoor O
3 concentration and low air flow, the air quality class is F, and the energy consumption will be small, class A+. Further, corresponding to the high air flow, the air quality class at the next time step will be B, but the energy consumption class is D.
This beneficial effect of ventilation—of cleaning indoor air—is not found, even if the indoor pollutant-generating sources are not functional. In this case, the current indoor concentration is low, Ci(τ) = 0 µg/m3, and the external air flow leads to an increase in the indoor concentration. If the air flow is low, na = 0.1 h−1, the indoor concentration increases very little, Ci(τ + Δτ) = 5 µg/m3. If the air flow is high, na = 3.5 h−1, the indoor concentration significantly increases, approaching the outdoor value, Ci(τ + Δτ) = 45 µg/m3. From the IAQ classes’ perspective, a low flow leads to an air quality class of A and an energy class of A, while a high flow leads to an air quality class of B and an energy class of F. As a general observation, it can be stated that low flow rates do not change the indoor air quality class and are characterized by low energy consumption, while high flow rates change the indoor air quality class with high energy consumption.
For a standardized air flow of 25 m
3/h/person (n
a = 1.7 h
−1) (pink area in
Figure 5), the predicted indoor O
3 concentration for the next time step depends on its previous value. Thus, if the current indoor concentration is high, C
i(τ) = 180 µg/m
3 (class F), after one hour, a concentration of C
i(τ + Δτ) = 78 µg/m
3 (class B) is reached, and the energy consumption in this hour is on the border between classes B and C. On the other hand, if the previous value of the indoor concentration is low, C
i(τ) = 0 µg/m
3 (class A+), then this type of operation of the ventilation system leads to an increase in the indoor concentration, C
i(τ + Δτ) = 41 µg/m
3 (class A–B), with the same energy consumption. Therefore, there is a need for the ventilation system to adapt its operation over time according to the previous value of the indoor O
3 concentration. For example, if during the first hour, the high value of the indoor concentration (180 µg/m
3—class F) was reduced due to a high air flow rate to values similar to those of the outdoor environment, around 50 µg/m
3—class B, then, in the next hour, the air flow can be reduced. This will lead to maintaining the IAQ class with reduced energy consumption, corresponding to energy class A+.
3.2. Particulate Matter (PM2.5)
For the PM2.5 pollutant, the specific calculation values are the following:
The fresh air filter constant F
0 = 1; the mass flow rate of the PM
2.5 source S = 50,000 µg/h [
14]; the mass flow rate of PM
2.5 losses is R = 0 µg/h; the outdoor PM
2.5 concentration is C
o = 50 µg/m
3 [
39], and the indoor PM
2.5 concentration at the moment τ, C
i(τ) PM
2.5, has different values between 280 and 340 µg/m
3.
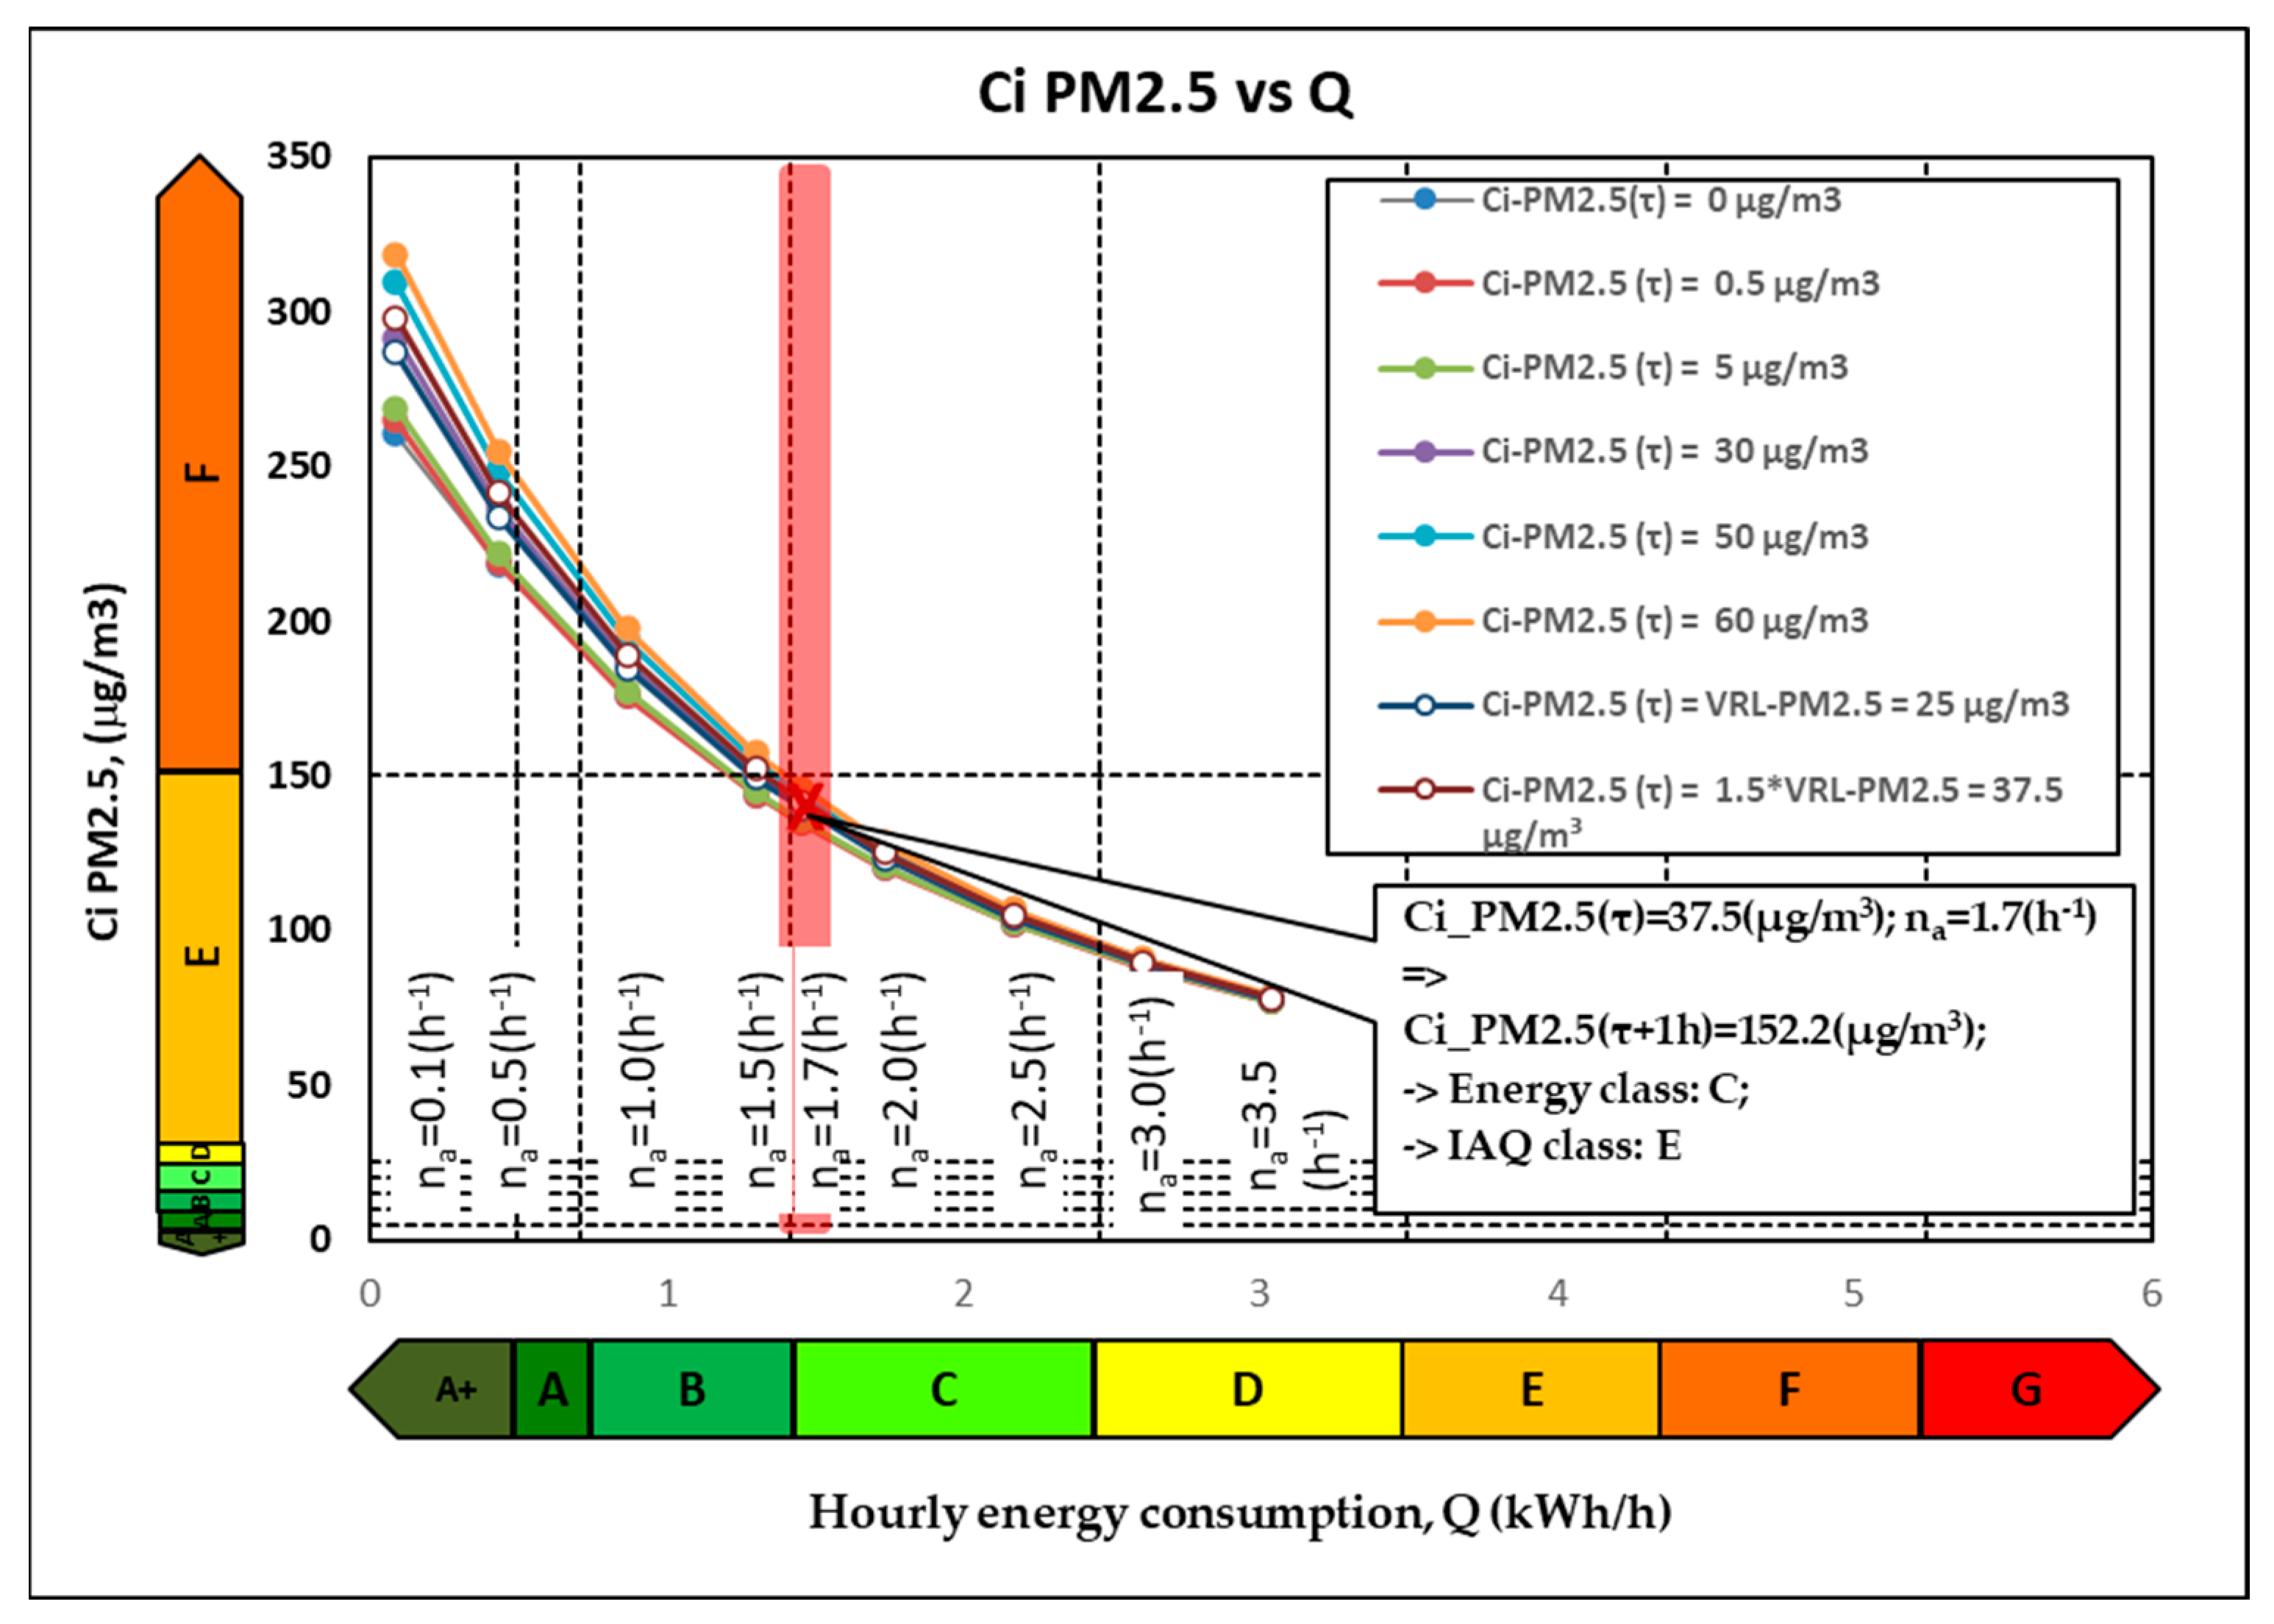
Figure 6 shows the influence of a fresh air flow introduced through the mechanical ventilation, q
0, on the indoor PM
2.5 concentration at the moment τ + Δτ, C
i(τ + Δτ), and the energy consumption, Q.
The indoor concentration at the next time step, Ci(τ + Δτ), is influenced by three levels of pollution: the current indoor, outdoor, and indoor sources of pollution. In the case of this pollutant, the current value of the indoor concentration Ci(τ) and the value of the outdoor exposure during this hour are too small compared to the high flow of the pollutant brought by the indoor sources, so their influence is relatively minor on the concentration from the next step of time, Ci(τ + Δτ). It is observed that in the case of a low air flow, corresponding to na = 0.1 h−1, the concentration at the next time step varies very little, between 260 and 325 µg/m3, with the air quality class being F. In the case of a high outdoor air flow, corresponding to na = 3.5 h−1, the indoor concentration for the next time step is approximately 75 µg/m3, class E.
For standardized ventilation operation (air flow rate na = 1.7 h−1), a high previous value of the indoor PM2.5 concentration, Ci(τ) = 300 µg/m3, class F, can be reduced for the next hour to only Ci(τ + Δτ) = 152 µg/m3, class E.
Therefore, regardless of the outdoor air flow used for the ventilation and regardless of the indoor pollution level, the indoor sources of pollution are too high, and it cannot be lowered to air quality classes B or C. Thus, a general ventilation system for the entire space cannot counterbalance the high flow of pollutant sources from inside the building. Therefore, other ventilation systems must be thought of for this special situation. For example, such an adapted solution would be a customized extraction ventilation near the indoor pollutant source that would prevent the indoor pollutant from spreading throughout the indoor space. Such a situation with extreme pollutant releases is found today in waste storage rooms, where very large amounts of pollutants are released through their rotting, and these rooms are ventilated with air flows that exceed na > 10 h−1.
3.3. Formaldehyde (HCHO)
For the HCHO, whose indoor emissions do not vary with time, the specific calculation values are the following:
The mass flow rate of the HCHO source, S = 1080 µg/h [
53]; the mass flow rate of HCHO losses, R = 0 µg/h; the fresh air filter constant F
0 = 0; the outdoor HCHO concentration, C
o = 0 µg/m
3; and the indoor HCHO concentration at the moment τ, C
i(τ) HCHO has different small values between 0 and 2 µg/m
3 while the VRL value is 50 µg/m
3.
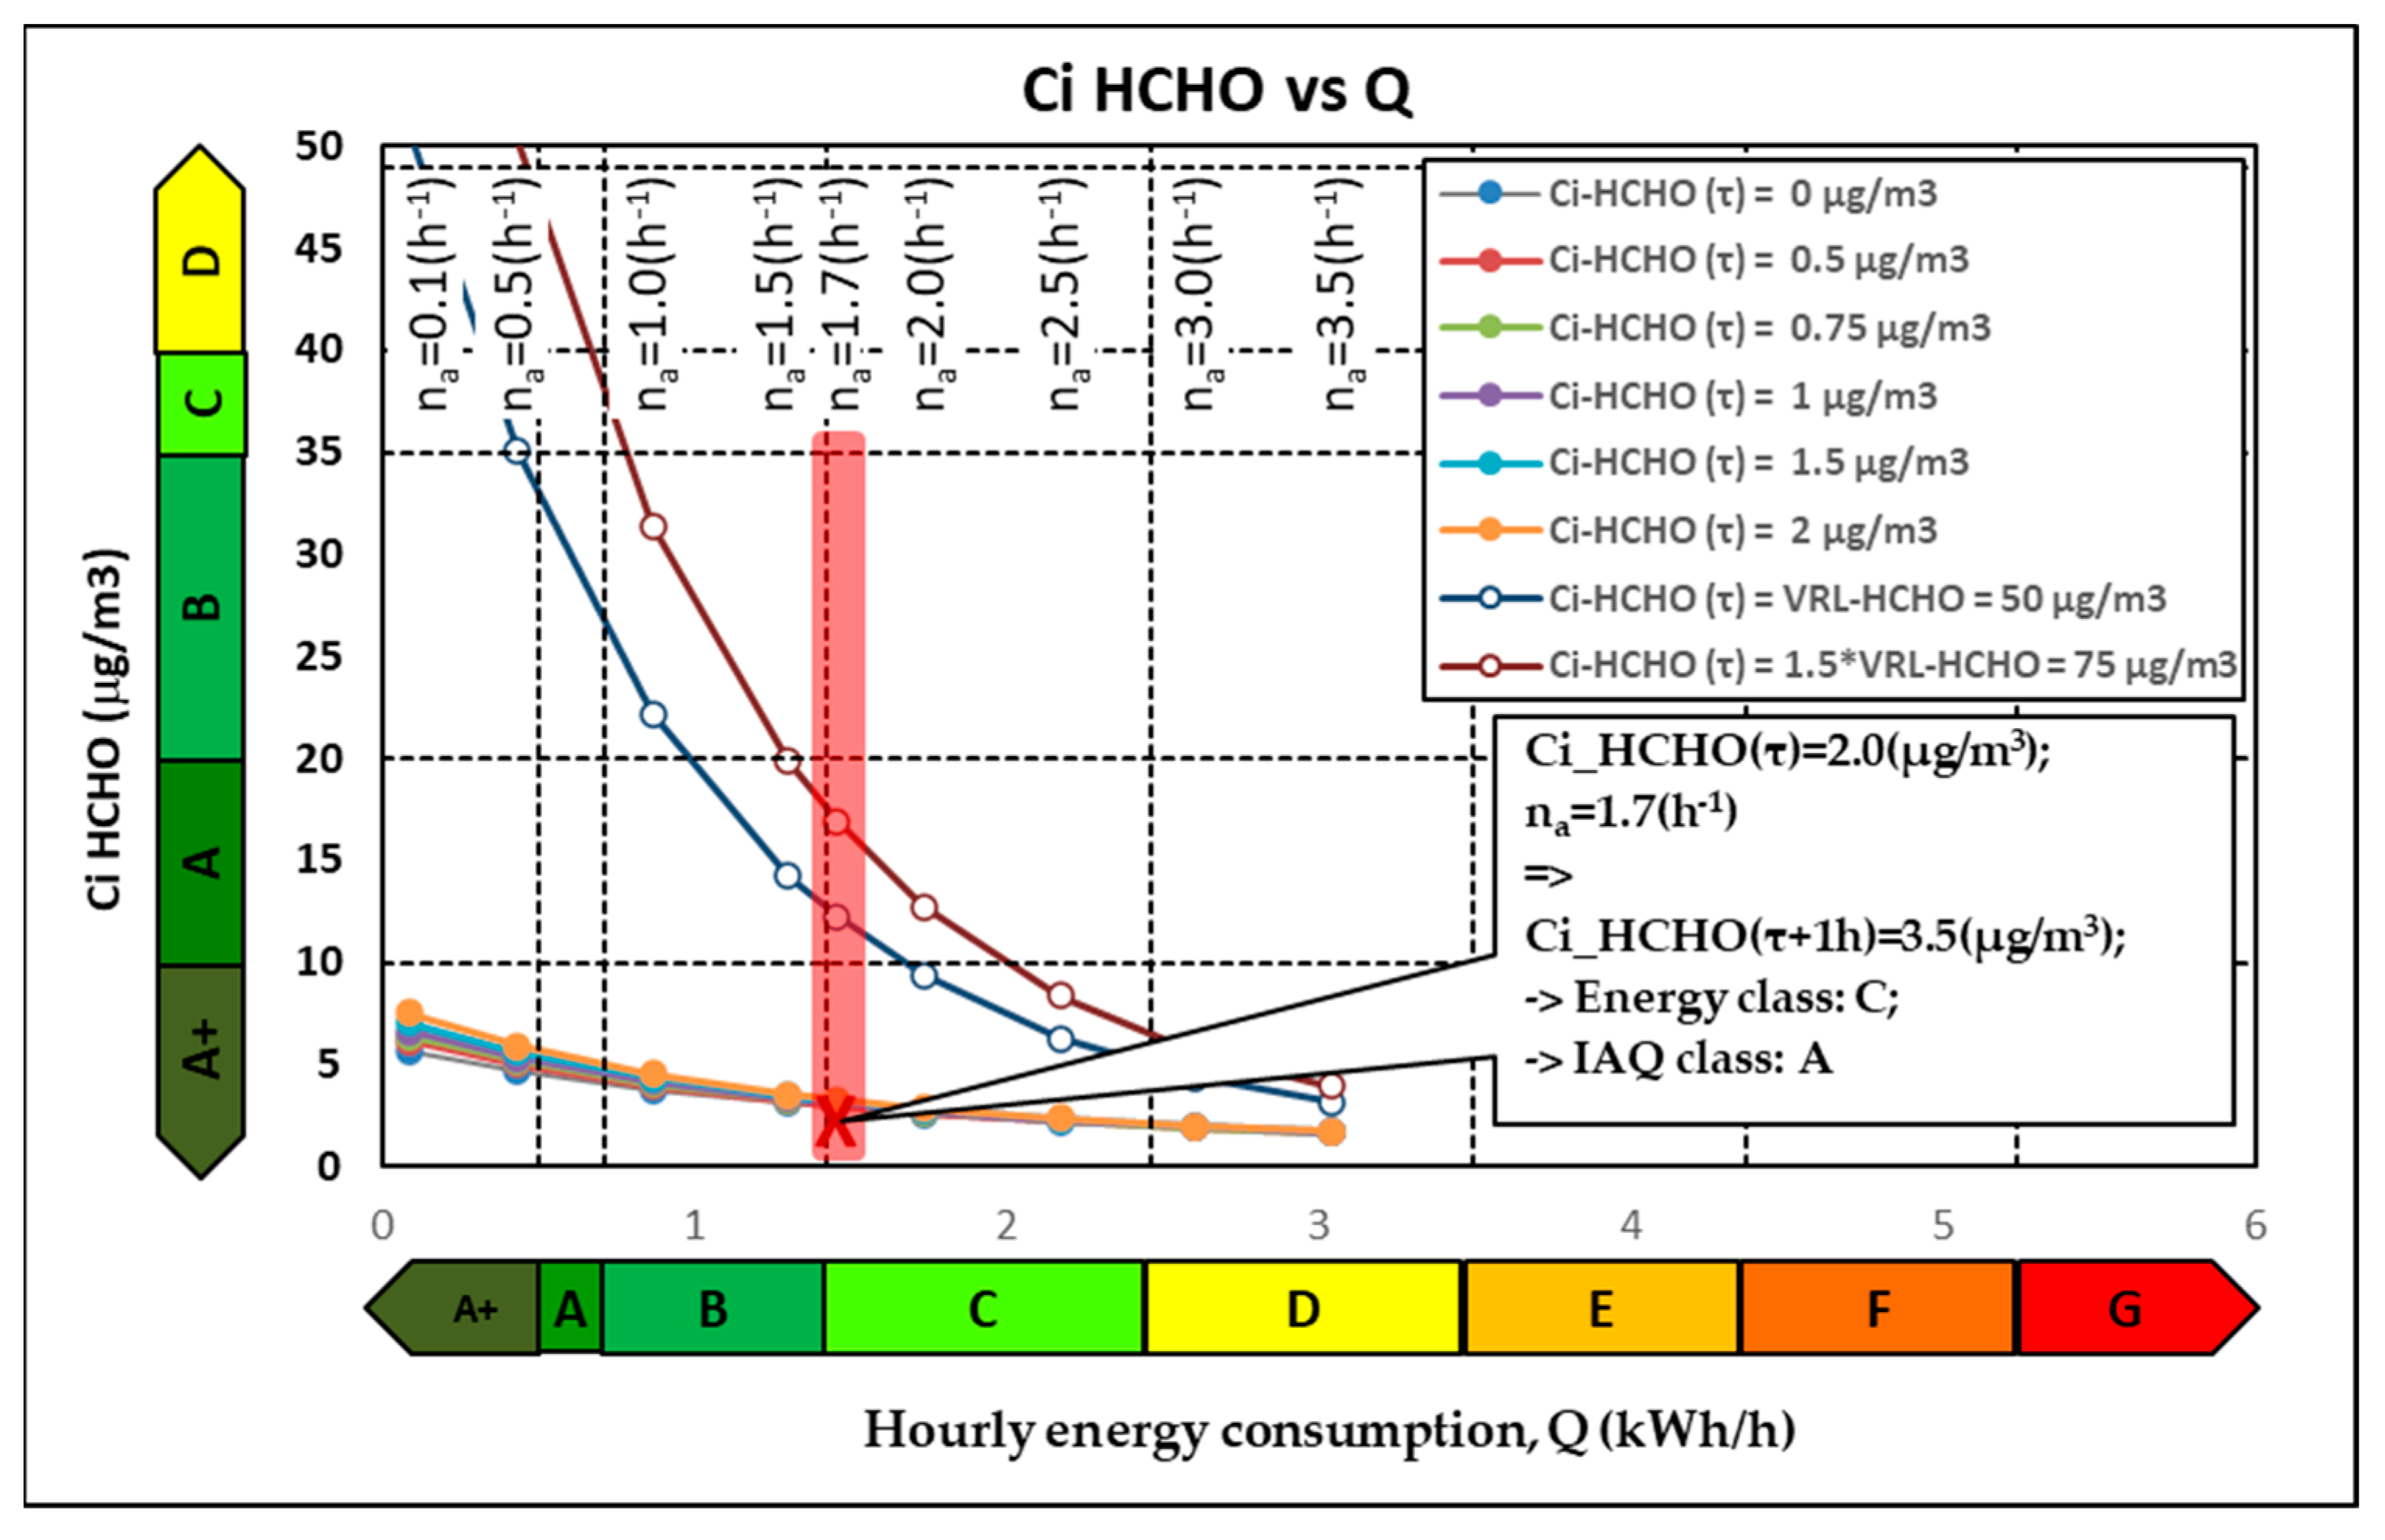
The indoor HCHO concentration at the moment τ + Δτ, C
i(τ + Δτ), and the energy consumption, Q, are influenced by the fresh air flow introduced through the mechanical ventilation, q
0, and this influence is presented in graphical form in
Figure 7.
Formaldehyde is a product specific to the indoor environment; therefore, the ventilation of the indoor space with fresh outside air has the role of cleaning the indoor air of the formaldehyde generated by different sources. In the simulations carried out in this study, it considered that the indoor space is currently characterized by variable concentrations between 0 and 75 µg/m3. Thus, if the indoor air is not polluted with formaldehyde (Ci(τ) = 0 µg/m3—class A), and the outdoor air concentration is also null, then whatever the outdoor air flow introduced through the ventilation system, the indoor air quality class remains A. From an energy point of view, the energy consumption increases proportionally to the outdoor air flow introduced. In the case of existing higher sources of indoor pollution (formaldehyde emissions from paints, plasters, new furniture, etc.), ventilation has a beneficial effect, leading to the reduction of indoor concentrations.
For example, if it considers a standardized ventilation air flow corresponding to a ventilation rate na = 1.7 h−1, and the current indoor concentration is Ci(τ) = 75 µg/m3 (class E), in this case, after an hour, the indoor concentration will drop to approximately Ci(τ + Δτ) = 15 µg/m3 (class A). This cleaning effect of the indoor air is achieved with an average energy consumption (class C).
3.4. Carbon Dioxide (CO2)
For the CO2 pollutant, the specific calculation values are the following:
The fresh air filter constant, F
0 = 0; the mass flow rate of the CO
2 source is S = 36,000 µg/h [
54]; the mass flow rate of CO
2 losses is R = 0 µg/h; the outdoor CO
2 concentration is C
o = 800 mg/m
3 [
39]; and the indoor CO
2 concentration has different values between 0 and 960 mg/m
3 while the VRL limit is 1440 mg/m
3.
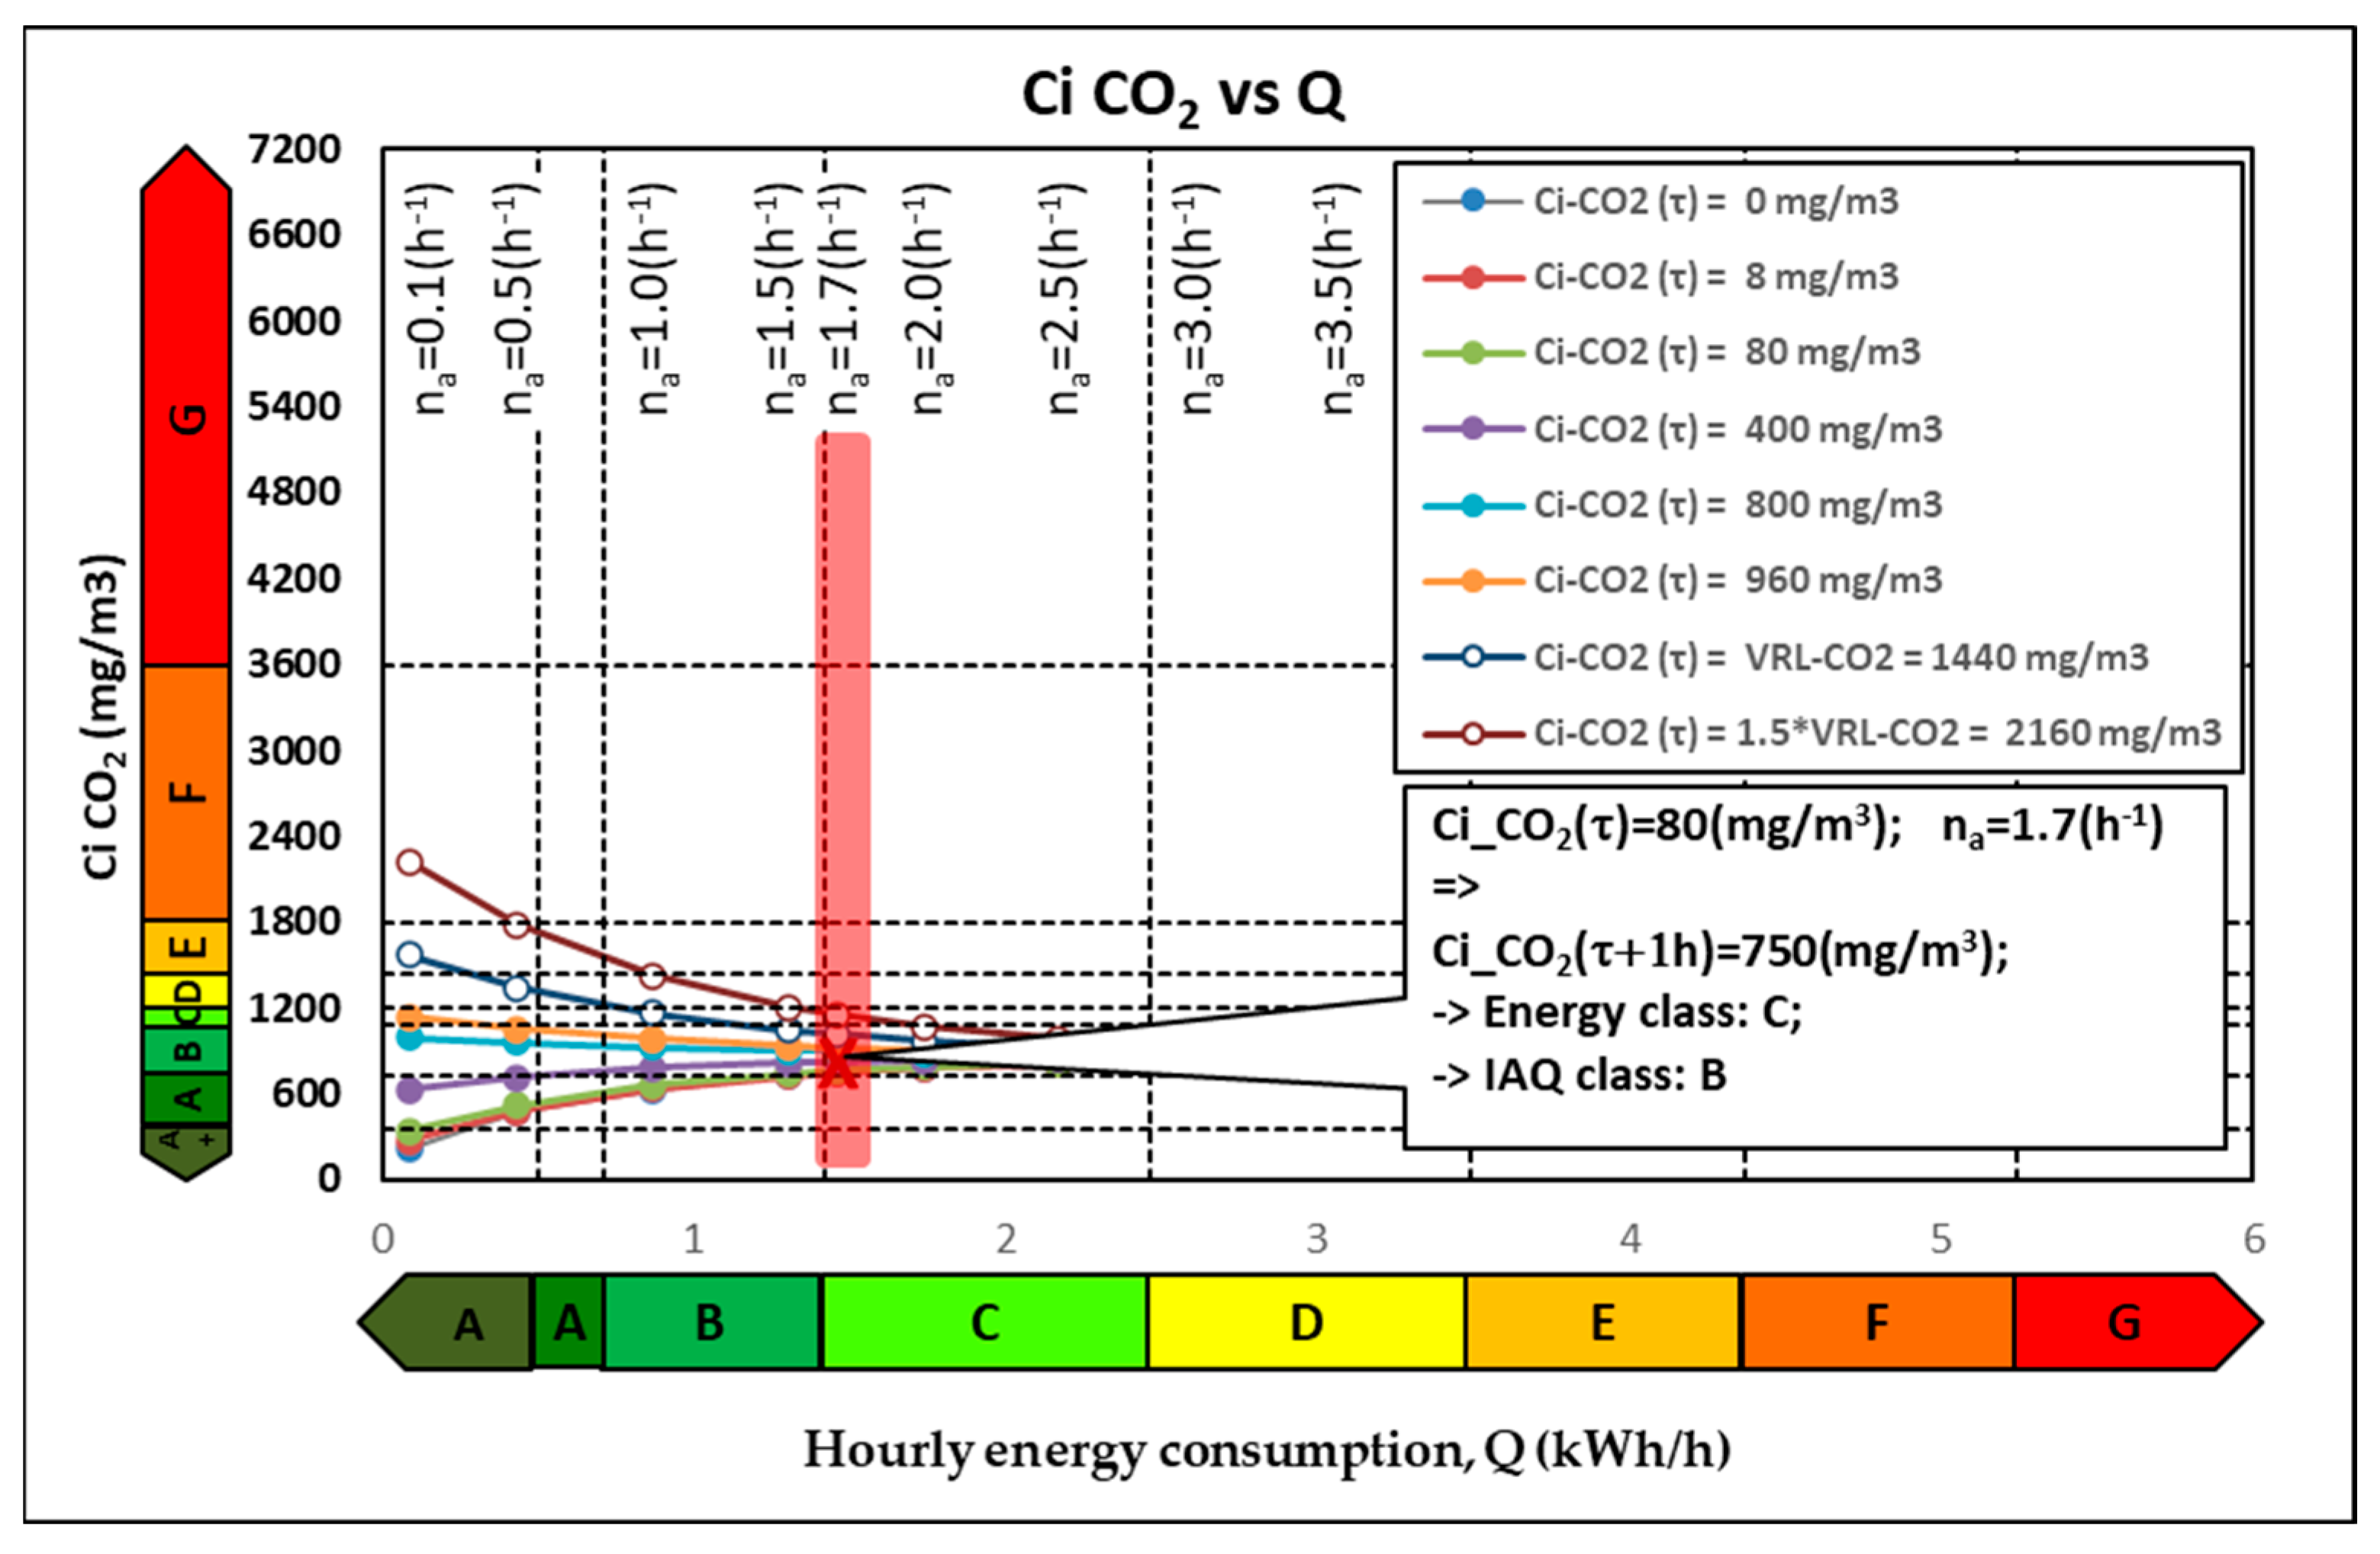
In
Figure 8, the influence of the fresh air flow introduced through the mechanical ventilation, q
0, on the indoor CO
2 concentration at the moment τ + Δτ, C
i(τ + Δτ), and the energy consumption, Q, can be observed.
The indoor CO2 concentration can be found, like O3, at lower and higher values compared to the values outside. Thus, the ventilation of the indoor space with outside air can lead to either positive or negative effects. At low outside air flows (corresponding na = 0.1 h−1), the indoor concentration is not influenced significantly, and at high flows (corresponding na = 3.5 h−1), the indoor concentration for the next time step time reaches values approximately equal to those outside 800 mg/m3 (air quality class B). In the case of a current indoor concentration of Ci(τ) = 80 mg/m3 and a standardized ventilation (an air flow rate of 25 m3/h/person), at the next time step, the indoor concentration reaches the value Ci(τ + Δτ) = 750 mg/m3.
3.5. Indoor Air Quality Index
In previous analyses, air quality was described by means of the concentration of a certain pollutant. In this paragraph, a more complex approach will be presented, namely air quality will be expressed in the form of a general index that is regrouped additively (Equation (4)) regarding the effects of the four pollutants. It is, therefore, normal to ask ourselves questions regarding the problems that such an approach can bring. Equation (4) shows the four effects having equal weight in the calculation of the combined index, but it can be supposed that in the case of reaching extreme values for a certain pollutant, it will significantly influence the value of the combined index; thus, the concentration values of the other pollutants will become derisory in regards to the combined index. Thus, the possibility of the occurrence of these situations will be analyzed in the following, given that the four pollutants show such different behaviors and are characterized by different sources.
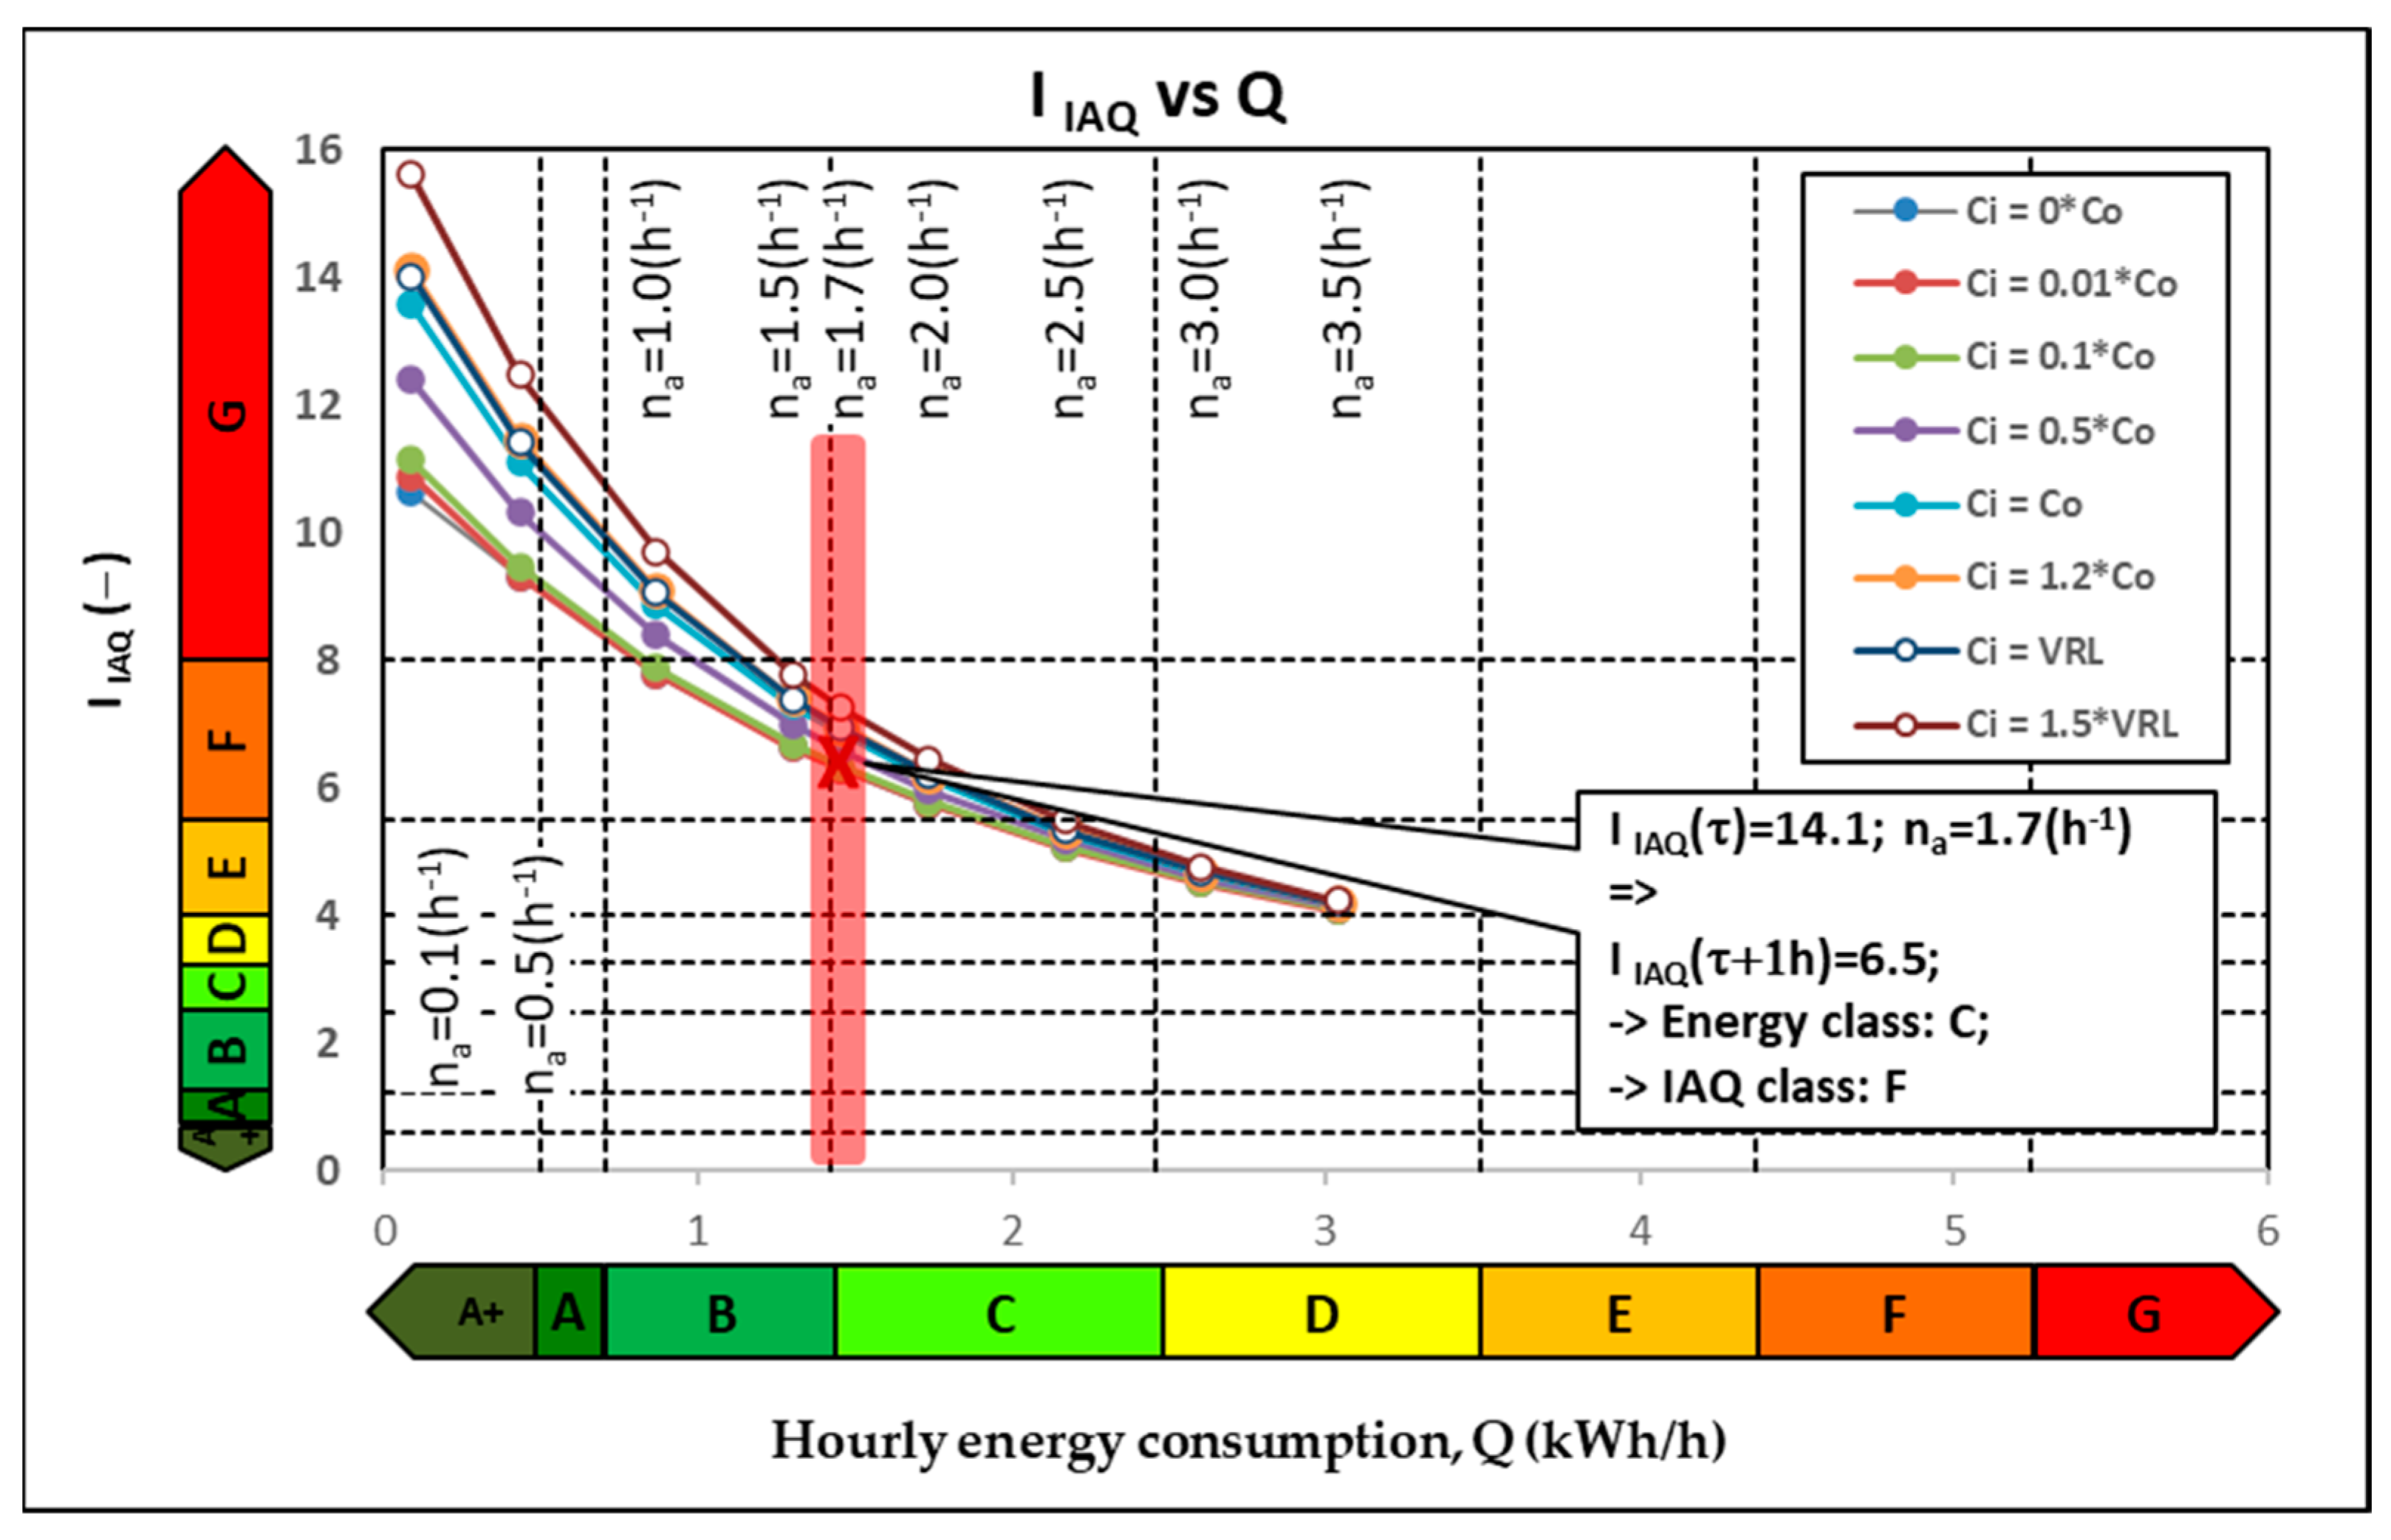
The influence of the fresh air flow introduced through mechanical ventilation, q
0, on the indoor air quality index, I
IAQ, determined according to Equation (4), and the energy consumption, Q, are both presented in graphic form in
Figure 9.
Although, in the case of the O
3 pollutant and the CO
2 pollutant, the actual indoor concentrations Ci_O
3(τ) and C
i_CO
2(τ) can have values either higher or lower than the outdoor concentration, and therefore, the ventilation system has the effect of either cleaning or polluting the indoor space; however, this effect is no longer visible from the perspective of the combined indoor air quality index. It can be seen (
Figure 9) that the I
IAQ index always has higher values at the current moment, and after ventilation for an hour, its value decreases. Therefore, the effect of the strong indoor sources responsible for PM
2.5 imposes a general pattern of variation of I
IAQ depending on the variation rate n
a.
An inverse relationship trend is observed between IIAQ and energy consumption: at low energy consumption, IIAQ is high (polluted indoor air), and at high energy consumption, IIAQ is low (good indoor air quality). In the case of ventilation with a standardized air flow rate (na = 1.7 h−1), the IIAQ index decreases from values above 10 (very high values, class G of indoor air quality) to values of 7 (class F of indoor air quality); thus, this flow does not bring a sufficient improvement to the indoor air quality. To reach an indoor air quality index in class B, it should be ventilated with an infiltration rate of more than 15 h−1. Therefore, it is considered that the formula for estimating the IIAQ, a formula based on the actual value of a concentration may mislead the general IIAQ value. Such situations resemble mathematical errors that lead to false correlation coefficients. In these mathematical studies, Spearman and Kendall proposed considering the class of certain parameters instead of their mathematical values.
Therefore, it is considered that an alternate formula for the IIAQ estimation could be analyzed. This alternative formula could take into account the classes for each indoor pollutant instead of their concentration values.
4. Discussion
This analysis has considered four different pollutants: ozone (O3), particulate matter with a 2.5 µm diameter (PM2.5), formaldehyde (HCHO), and carbon dioxide (CO2). For these four pollutants, eight IAQ classes, from A+ to G, were designed (similar to the eight energy classes, also ranging from A+ to G), along with the indoor quality index, IIAQ, which takes into consideration the admissible limits provided by international and national regulations. Based on the regulation requirements, different values of q0 (which is the fresh air flow introduced through the mechanical ventilation system) were established, ranging from 18 m3 to 630 m3. They correspond to the values of the ventilation rate, na, between 0.1 h−1 and 3.5 h−1.
In this paragraph, we will briefly discuss the main findings related to each pollutant, as well as those related to energy consumption.
The variation in each pollutant concentration is a result of three different phenomena: the concentration’s value at the previous time step, the outside concentration, and the indoor pollutant sources. The extent to which these three phenomena influence the indoor concentration value at the next time step depends on the quality of the building’s ventilation system and its ability to adapt to real requests.
In the case of the pollutant O3, the value of the indoor concentration at a previous time step has a main role in predicting the value at the next time step. Moreover, due to the rapid change in indoor air quality through the ventilation system, maintaining the same operating state of the ventilation system (with a high flow rate) leads to an unreasonably high energy consumption. Therefore, it is necessary to adapt the ventilation strategy one step at a time.
When discussing the PM2.5 pollutant, the high value of the indoor sources of the pollutant plays a main role, and the correct ventilation strategy is only one, namely the highest possible air flow rate. In this situation, a change in the ventilation strategy of the indoor space depends on the presence of indoor pollution sources. Another interesting conclusion consists of the necessity for the installation of a customized extraction, located near the area where the source of PM2.5 pollution is placed.
Referring to the pollutant HCHO, which is of indoor origin only, the sources from where the pollutant can originate are very low, and the indoor concentrations are not dangerous to human health. Thus, the correct strategy consists of reducing the fresh air flow to the maximum so as to reduce the energy consumption to the maximum in order to heat the cold outside air. Likewise, it is not required to adapt the ventilation strategy from one time step to another.
Regarding the CO2 pollutant, originating both outside and inside the building, the conclusions are similar to those presented in the case of the O3 pollutant. There is also a need to adapt the functioning state of the ventilation system for CO2.
When theorizing that all four pollutants are found simultaneously in the indoor space, then the indoor air quality should be described by the combined index, IIAQ. If, in the case of O3 or CO2 pollutants, the need for a certain type of ventilation and a need to change the ventilation strategy appears. Thus, in the case of combining the effect of these two pollutants with the effect of the PM2.5 pollutant, then these effects may lead to different strategies, but the excess of the PM2.5 released indoors makes the global indoor air quality low, and the correct ventilation strategy must take into account the PM2.5 pollutant.
5. Conclusions
This paper aimed to answer a series of questions regarding the influence of a fresh air flow introduced through a building’s mechanical ventilation system, q0, on the two topics taken together, IAQ and energy consumption. A standardized ventilation rate (25 m3/h/person) leads to an increase in indoor O3 concentration (from 5 μg/m3 to 50 μg/m3) and simultaneously to a decrease in indoor CO2 concentration (from 2000 mg/m3 to 800 mg/m3), as well as to a decrease in the PM2.5 concentration (from 300 μg/m3 to 150 μg/m3), or to maintaining a constant indoor HCHO concentration. Air quality classes were designed similarly to the energy classes for each of the four considered pollutants. However, the situation between the two indicators is different; namely, while there is a direct positive relationship between the energy classes and the ventilation rate (when the ventilation rate increases, the energy consumption also increases), for air quality, each pollutant has a different effect, depending on the outdoor air concentration and the indoor pollutant sources.
Thus, a specific ventilation strategy can simultaneously lead to variations in indoor pollutants and different air quality classes, depending on the type of pollutant. In this study, a new approach was introduced by bringing together the four pollutants in a general indoor air quality index.
The advantage of this new approach must be noted here that by combining these pollutants, the ventilation strategy can be an active strategy that:
- -
Takes into account extreme exposure to a certain type of pollutant;
- -
Takes into account the combined effect of several pollutants;
- -
Neglects the effects of pollutants whose concentrations are low.
With an active operation mode that can also be adapted according to several pollutant species, this ventilation system presents clear advantages for indoor air quality. However, in the case of extreme indoor pollution sources, energy consumption significantly increases. This disadvantage can be overcome in different ways, as follows:
- -
Through a ventilation system with local extraction;
- -
By adapting the air circulation inside a building so that the indoor air extraction is carried out near the pollutant source;
- -
By mounting the pollutant source near the place of extraction for contaminated indoor air.
Finally, there is the need to test such an adaptive system, either through simulation or experiments, to showcase the effects on indoor air quality and energy consumption.
