Article

Research on the Terrain Characteristics of Changbai Mountain and Their Impact on Precipitation and Wind Distribution

1
Public Meteorological Service Centre, China Meteorological Administration, Beijing 100081, China
2
National Climate Centre, China Meteorological Administration, Beijing 100081, China
*
Author to whom correspondence should be addressed.
Atmosphere 2024, 15(3), 272; https://doi.org/10.3390/atmos15030272
Submission received: 17 January 2024 / Revised: 8 February 2024 / Accepted: 17 February 2024 / Published: 24 February 2024
(This article belongs to the Special Issue Extreme Weather Events in a Warming Climate)

Abstract

:
The terrain of Changbai Mountain has great influence on the distribution of atmospheric flows and the occurrence and development of precipitation. However, quantitative studies on the real terrain characteristics and the terrain effect on precipitation distribution in this region are scant at present. This study quantitatively analyzes the regional characteristic of topographic perturbations and the relationship between terrain, wind, and precipitation in Changbai Mountain region by using a spectral analysis of the two-dimensional discrete cosine transform. Three domains with relatively heavy summer precipitation are selected as the study region. The results indicate that the overall terrain of the Changbai Mountain region exhibits anisotropic characteristics. The terrain spectra of domain B are less than those of domains A and C across the whole wavelength (λ) bands, indicating that the large-scale topographic perturbations of domain B are relatively weak. The largest topographic spectral peak of domain C shows the most pronounced undulation of terrain among the three domains. The dominant wavelengths of terrain height variance for domains A and C, both close to the respective maximum wavelengths, indicate more prominent large-scale topographic perturbations. For domain A, the variation of the precipitation spectra is consistent with that of the wind spectra at the wavelength bands of λ < 390 km, showing a high correlation between wind field and the occurrence of rainfall. The inverse relationship at larger wavelengths indicates that multiple factors contribute to the occurrence of rainfall. For domain B, there is consistency in the fluctuations of terrain spectra, precipitation spectra, and wind spectra at the wavelength bands of λ < 278.3 km, implying that the smaller-scale terrain has an important effect on the occurrence of summer precipitation. For domain C, the variations of terrain spectra, precipitation spectra, and wind spectra are almost consistent across the whole wavelength bands, indicating that the large-scale terrain and minor terrain both play a crucial role in atmospheric uplift and the occurrence and development of summer rainfall.

1. Introduction

Rainstorms are common disastrous weather events in China, which have caused serious losses of people’s lives and property. In recent years, extreme rainstorm events have gradually increased in the context of global warming [1,2,3]. With the development of observational equipment and numerical models, scholars have made significant progress in understanding the formation mechanisms of rainstorms. Forecast accuracy of rainstorms, especially regional organized systematic rainstorms, has also been improved to a certain extent [4,5,6,7,8]. However, it is still a universal problem to predict the occurrence and intensity of rainstorms over complex terrain, which plays a very important role in triggering precipitation and affecting its spatial and temporal distribution. Major mountain barriers can significantly modulate atmospheric flows and precipitation over mountainous areas through dynamic processes, such as upslope ascent, leeside descent, and associated gravity wave activities [9,10,11,12,13,14,15,16,17]. A rough terrain can lead to increased turbulence near the ground due to the strong disturbance of the terrain to the air flows and the complex flow pattern generated by the terrain. The wind speed and its direction can also be changed within a rough terrain because of the topographic obstruction and relief. In some cases, rough terrain can cause air currents to separate, creating vortices and backflows. These flow features can cause localized climate and weather phenomena.
As a topographic rainstorm usually shows characteristics of suddenness, small coverage, and short duration, it is difficult to give an accurate early warning and prediction. Therefore, it often leads to mountain torrents, debris flows, landslides, and other meteorological secondary disasters. Megacities built near mountains are vulnerable to natural disasters. Rainstorms and other disastrous weather could well cause serious losses of local people’s lives, property, and economy. For example, an extreme weather event occurred in northeast China on 13 July 2017, with the peak precipitation reaching 296 mm. The extensive rainfall accompanied by severe convection weather that included hailstones, thunderstorms, and strong winds caused flooding damage and other geological disasters, such as debris flows and landslides, in some areas. The rainstorm affected nearly one million people and resulted in the direct economic loss of several hundred million yuan [18,19].
Most of the rainstorm events in northeast China are closely related to complex terrain [20,21,22,23]. The Changbai Mountain region stretches for thousands of kilometers from southwest to northeast, across the east of Jilin, Liaoning, and Heilongjiang Provinces, with its chief part located in the southeast of Jilin Province. It is the common birthplace of Tumen River, Yalu River, and Songhua River. With unique geographical location, it is a weather- and climate-sensitive area in northeast China, of which the central part is located in the transitional windward zone between the Changbai Mountain region and the Songliao Plain. The semi-mountainous terrain is an area where meso- and micro-scale systems occur frequently. The local severe weather is the result of the combination of terrain and system development. Therefore, a systematic study on the topography of the Changbai Mountain region is required for accurate forecast of rainstorms over the complex terrain.
Pielke and Kennedy (1980) [24] suggested that terrain characteristics can be truly represented in spectrum space, and terrain spectra can quantitatively reflect the effect of topographic dynamic forcing on the atmosphere. Young and Pielke (1983) [25] and Young et al. (1984) [26] found that the spectral analysis of terrain cross-sections can be used to investigate the terrain spectra. Since then, the one-dimensional operation along several adjacent terrain sections has been extensively used for high computational efficiency [25,26,27,28]. Steyn and Ayotte (1985) [29] proposed that if the terrain of a given area is directional, the one-dimensional spectral analysis method may not be accurate enough to deal with the terrain. Salvador et al. (1999) [30] determined a grid size of 2 km for meso-scale models of the east coast of Spain based on a two-dimensional spectral analysis. However, it is computationally time-consuming to calculate the two-dimensional terrain spectra for a larger study region, in spite of the rapid development of computational resources [31]. Wang and Wang (2004) [32] revealed the physical mechanism of the topographic effect on the westerly perturbation over central and eastern China using the one-dimensional weighted-average spatial spectral method, which was also used to study the mechanism of terrain forcing on precipitation distribution in the Tibet Plateau by Shu et al. (2006) [33].
However, the one-dimensional or two-dimensional spectral analysis methods mentioned above all used traditional discrete Fourier transform (DFT). Denis et al. (2002) [34] proposed that spectral analysis of atmospheric fields on limited-area grids using Fourier transforms can lead to the aliasing or projection of the large-scale trend on the high-wavenumber components, though the DFT is well suited for global atmosphere. The two-dimensional discrete cosine transform (2D-DCT) is suitable for spectral analysis of data over a limited area. Since then, the DCT has been widely applied in spectral analysis of atmospheric fields on limited-area grids [35,36,37,38,39]. For example, Huang and Cui (2016) [39] used 2D-DCT to decompose the terrain height field and torrential rainfall distribution field in Sichuan, China.
Although the terrain of Changbai Mountain plays an important role in atmospheric flows and occurrence and development of rainfall, there is currently a lack of quantitative research on the real terrain characteristics and the terrain effect on precipitation distribution in this region. The aim of this study was to quantitatively explore the effect of topographic dynamic forcing on precipitation distribution in the Changbai Mountain region by using 2D-DCT. The regional characteristic of topographic perturbations can be accurately depicted based on the terrain characteristics represented in spectrum space. The relationships among terrain dynamic forcing, wind and precipitation in spectrum space, and the possible reasons for the high incidence of local rainstorms were also investigated by analyzing the distributions of terrain spectra, wind spectra, and precipitation spectra. In this paper, the data and the spectral analysis method are presented in Section 2. The precipitation distribution characteristics, the terrain spectra of the Changbai Mountain region, and spectral analysis of terrain, precipitation, and wind field are investigated in Section 3. The discussion and conclusions are summarized in Section 4.

2. Data and Methods

2.1. Data

The latest Shuttle Radar Topographic Mission (SRTM) 90 m digital elevation database, originally produced by National Aeronautics and Space Administration (NASA), was used for the algorithm of terrain spectra. The observed precipitation was from the merged hourly precipitation product, which had a horizontal resolution of 0.1° × 0.1°. It is based on the optimum interpolation technique through the combination of the hourly precipitation observed by automatic weather stations and retrieved from Climate Prediction Center Morphing (CMORPH) technique satellite data [40]. The wind data at 850 hPa were from the European Centre for Medium-Range Weather Forecasts (ECMWF) global data, which had a horizontal resolution of 0.125° × 0.125°. Data of wind and precipitation from June to September of each year from 2008 to 2022 were used in this study.

2.2. Methods

Spectral decomposition of terrain height field, wind field at 850 hPa, and precipitation field in the Changbai Mountain domain was determined by the algorithm of 2D-DCT. The DCT was first applied to atmospheric spectral analysis by Denis et al. (2002) [34]. In the spectral analysis of atmospheric fields in limited-area domains, fields on the grids are generally aperiodic and dominated by large-scale factors whose wavelengths are greater than the domain in most cases. Trying to use a standard Fourier transform on limited-area domains can lead to the aliasing of the large-scale trend on the high-wavenumber components, thus destroying all usefulness of spectra at high wavenumbers. The DCT is particularly well adapted for spectral analysis of atmospheric fields on a limited area, comparing favorably with the periodic Fourier transform. It does not need any trend removal or any other prior modification before applying the DCT and can overcome the problem of the aliasing of large-scale variance into shorter scales [39].
An algorithm of spectral computation has been coded, based on Denis et al.’s (2002) study, which used the 2D-DCT. For a two-dimensional physical field h ( i , j ) of Ni by Nj grid points, the direct and inverse DCT are respectively defined as
F ( m , n ) = β ( m ) β ( n ) i = 0 N i 1 j = 0 N j 1 h ( i , j ) × cos ( π m i + 1 / 2 N i ) cos ( π n j + 1 / 2 N j )
and
h ( i , j ) = m = 0 N i 1 n = 0 N j 1 β ( m ) β ( n ) F ( m , n ) × cos ( π m i + 1 / 2 N i ) cos ( π n j + 1 / 2 N j )
with β ( m ) =   2 / N i 1 / N i     m = 1 , 2 , , N i 1 m = 0 and β ( n ) =   2 / N j 1 / N j     n = 1 , 2 , , N j 1 n = 0 .
Here, F(m,n) is the spectral coefficient corresponding to the (m,n) adimensional wavenumbers. The spectral variance can be computed from the spectral coefficients:
σ 2 ( m , n ) = F 2 ( m , n ) / ( N i N j )
In order to analyze the relationship between terrain height spectral variance, total precipitation spectral variance, and wind spectral variance, the two-dimensional spectral coefficients undergo additive synthesis to obtain the relationship between variance and total wavelength. Instead of adding the contribution σ2(m, n) only to wavenumber k as in Denis et al. (2002) [34], an alternative method is to assign this contribution between the two wavenumbers k and k +1 using the distance weight coefficients [38]. Different from the allocation method of variance in Ricard et al. (2013) [38], the allocation is adjusted so that the closer the distance, the stronger the weight. The weight coefficients are distributed into wavenumbers k and k + 1 as follows:
  b m , n = α ( m , n ) α ( k ) α ( k + 1 ) α ( k ) a m , n = α ( k + 1 ) α ( m , n ) α ( k + 1 ) α ( k )
In Equation (4), α(m, n) is the standardized two-dimensional wavenumber, and the specific meaning of and α′(k + 1) is α′(k), shown in Ricard et al. (2013) [38].

3. Results

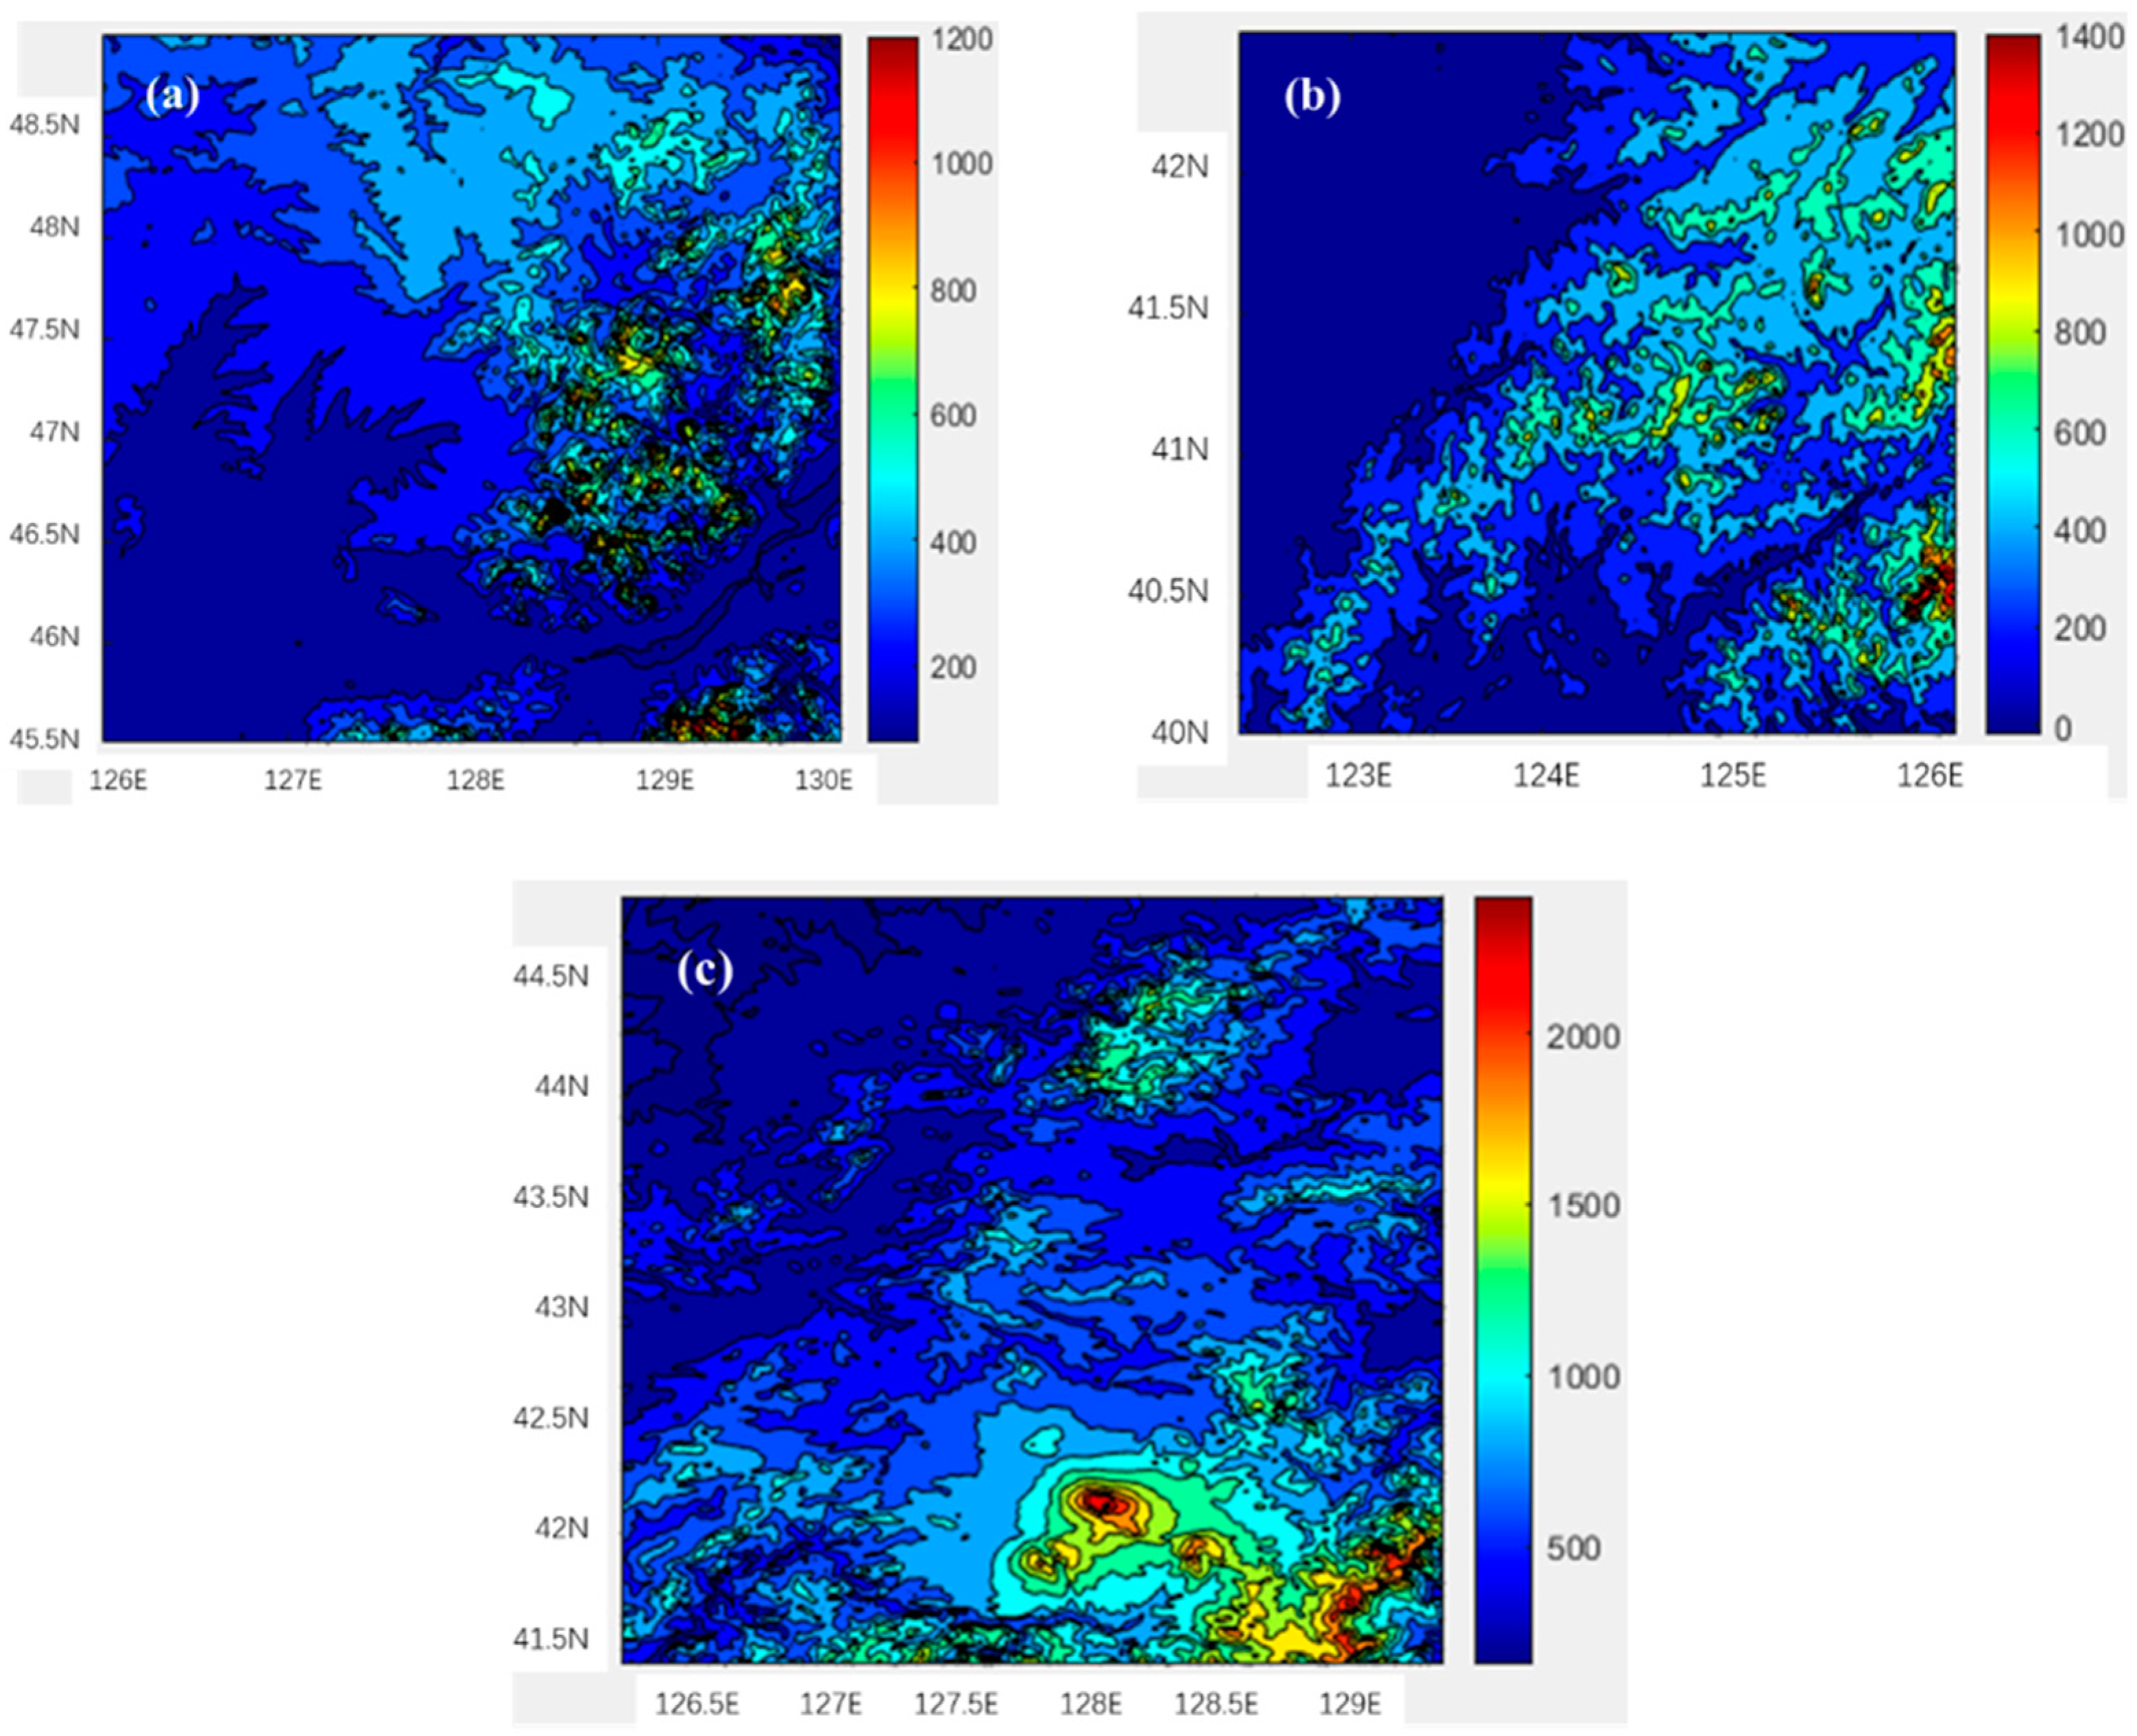
3.1. Precipitation Distribution in Changbai Mountain Region and Selection of Study Region

Before spectral decomposition of terrain height field, wind field, and precipitation field, the precipitation in the Changbai Mountain region is analyzed first. Figure 1 shows the distribution of monthly average precipitation in the Changbai Mountain region from June to September during the period of 2008 to 2022. The precipitation in this region is concentrated from June to August, especially in August (Figure 1c), which is mainly distributed in the southwest of the Changbai Mountain region. For a better understanding of the relationship between the spatial distribution of precipitation and topography, the terrain height of the Changbai Mountain region and the total precipitation from June to August averaged over 2008–2022 in this area are represented in Figure 2. As shown in Figure 2b, the rainband presents a northeast–southwest distribution and the precipitation is mainly concentrated in the areas between 40° N and 42° N and between 47° N and 48° N with three main centers at 129° E, 47° N, 125° E, 41° N, and 127° E, 41.2° N, which have values of 450, 750, and 550 mm, respectively. The three precipitation centers, distributed in steep terrain areas, are located in the Xiaoxing’an Mountain area in the northwest of the Changbai Mountain region, the southwest part of the main Changbai Mountain range, and the eastern part of Jilin Province, respectively. Based on the distribution characteristics of precipitation, three regions, namely domain A with limits of 126° E–130° E, 45.5° N–49° N (rectangle A in Figure 2), domain B with limits of 122.4° E–126.2° E, 40° N–42.5° N (rectangle B in Figure 2), and domain C with limits of 126.2° E–129.4° E, 41.2° N–45° N (rectangle C in Figure 2), are selected for the spectral analysis.
The terrain height fields of the three study areas are shown in Figure 3. It can be seen that the western terrain of all three areas is relatively low, whereas the remaining areas show the towering and complex terrain with crisscrossing gullies. In Figure 3a, though domain A is relatively low-lying compared to the other two domains, there are still many high mountains and deep valleys and ravines, mainly distributed in the northeast of this region, which is conducive to the accumulation and uplift of water vapor, thus forming rainfall in this region. In Figure 3b, the mountain range presents a northeast–southwest orientation in domain B, of which the southern part shows a trumpet-shaped topography, which plays an essential role in the lifting of the low-level southwest air flow, thus resulting in rainfall mainly distributed in the trumpet-shaped area. In Figure 3c, the high mountains are mainly located in the southeast of domain C, where the northwest terrain is relatively flat. The terrain height increases gradually from the northwest to the southeast, and the precipitation is mainly distributed in the southern region of the complex terrain.

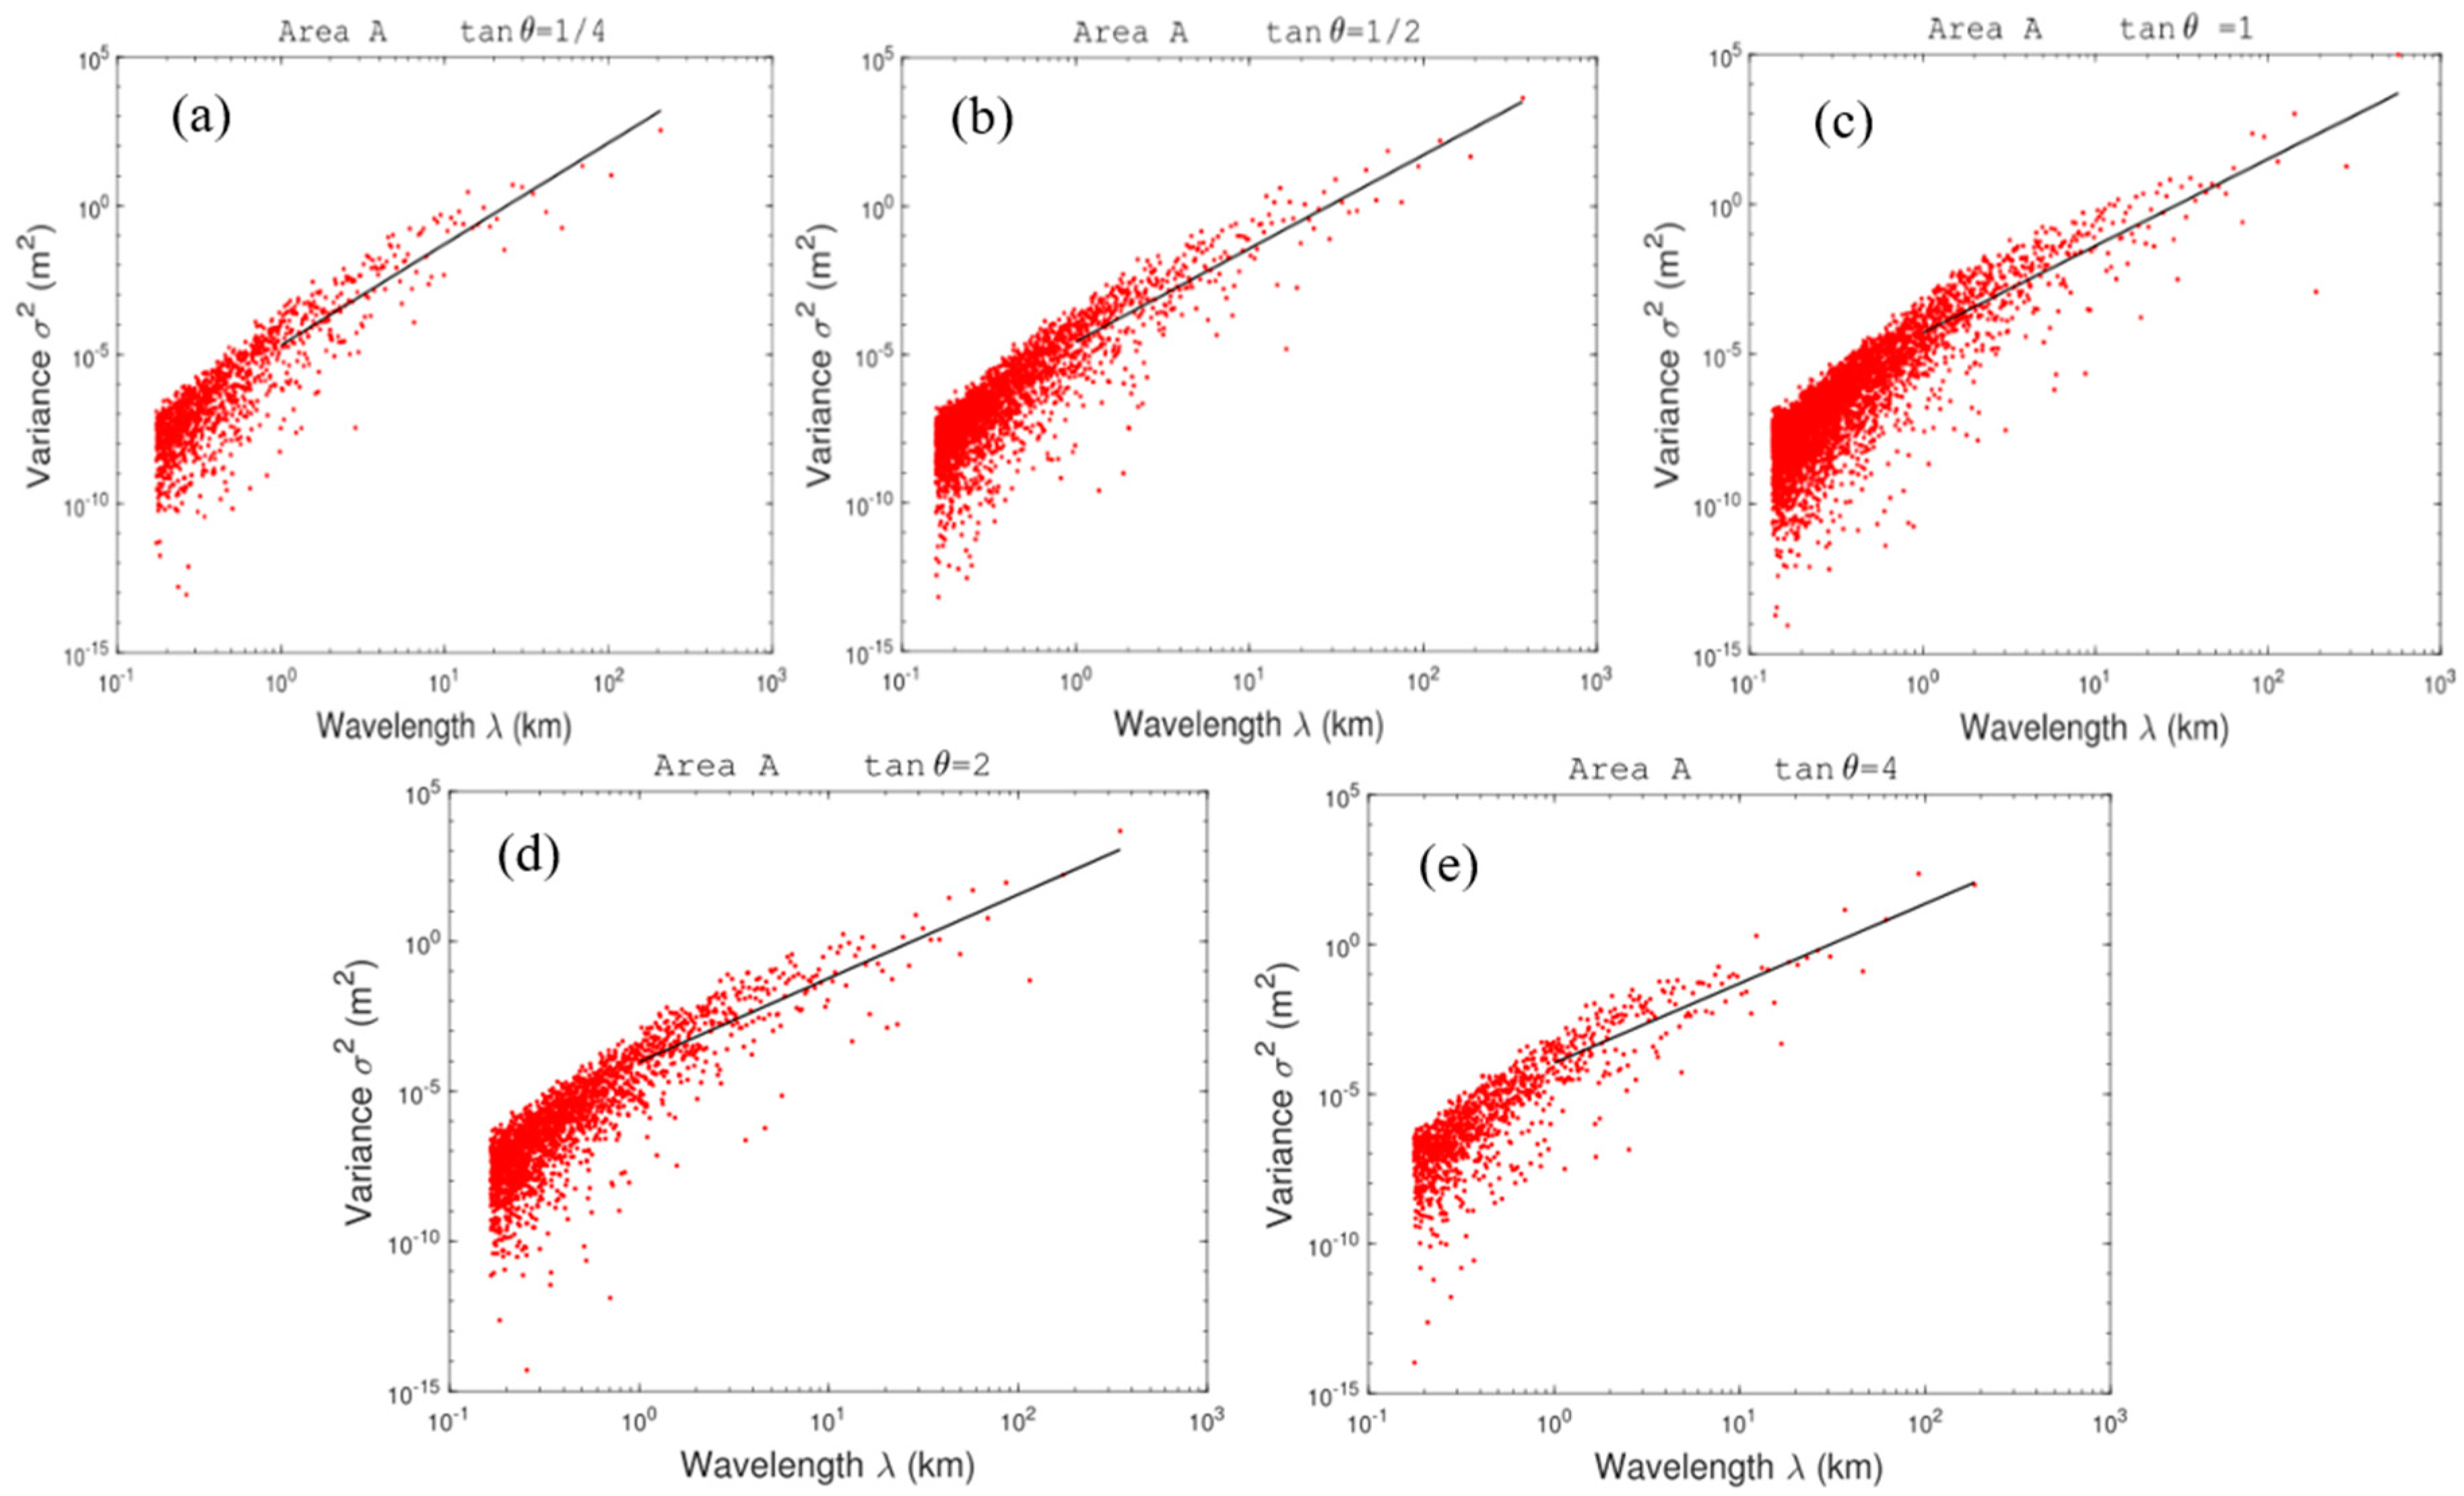
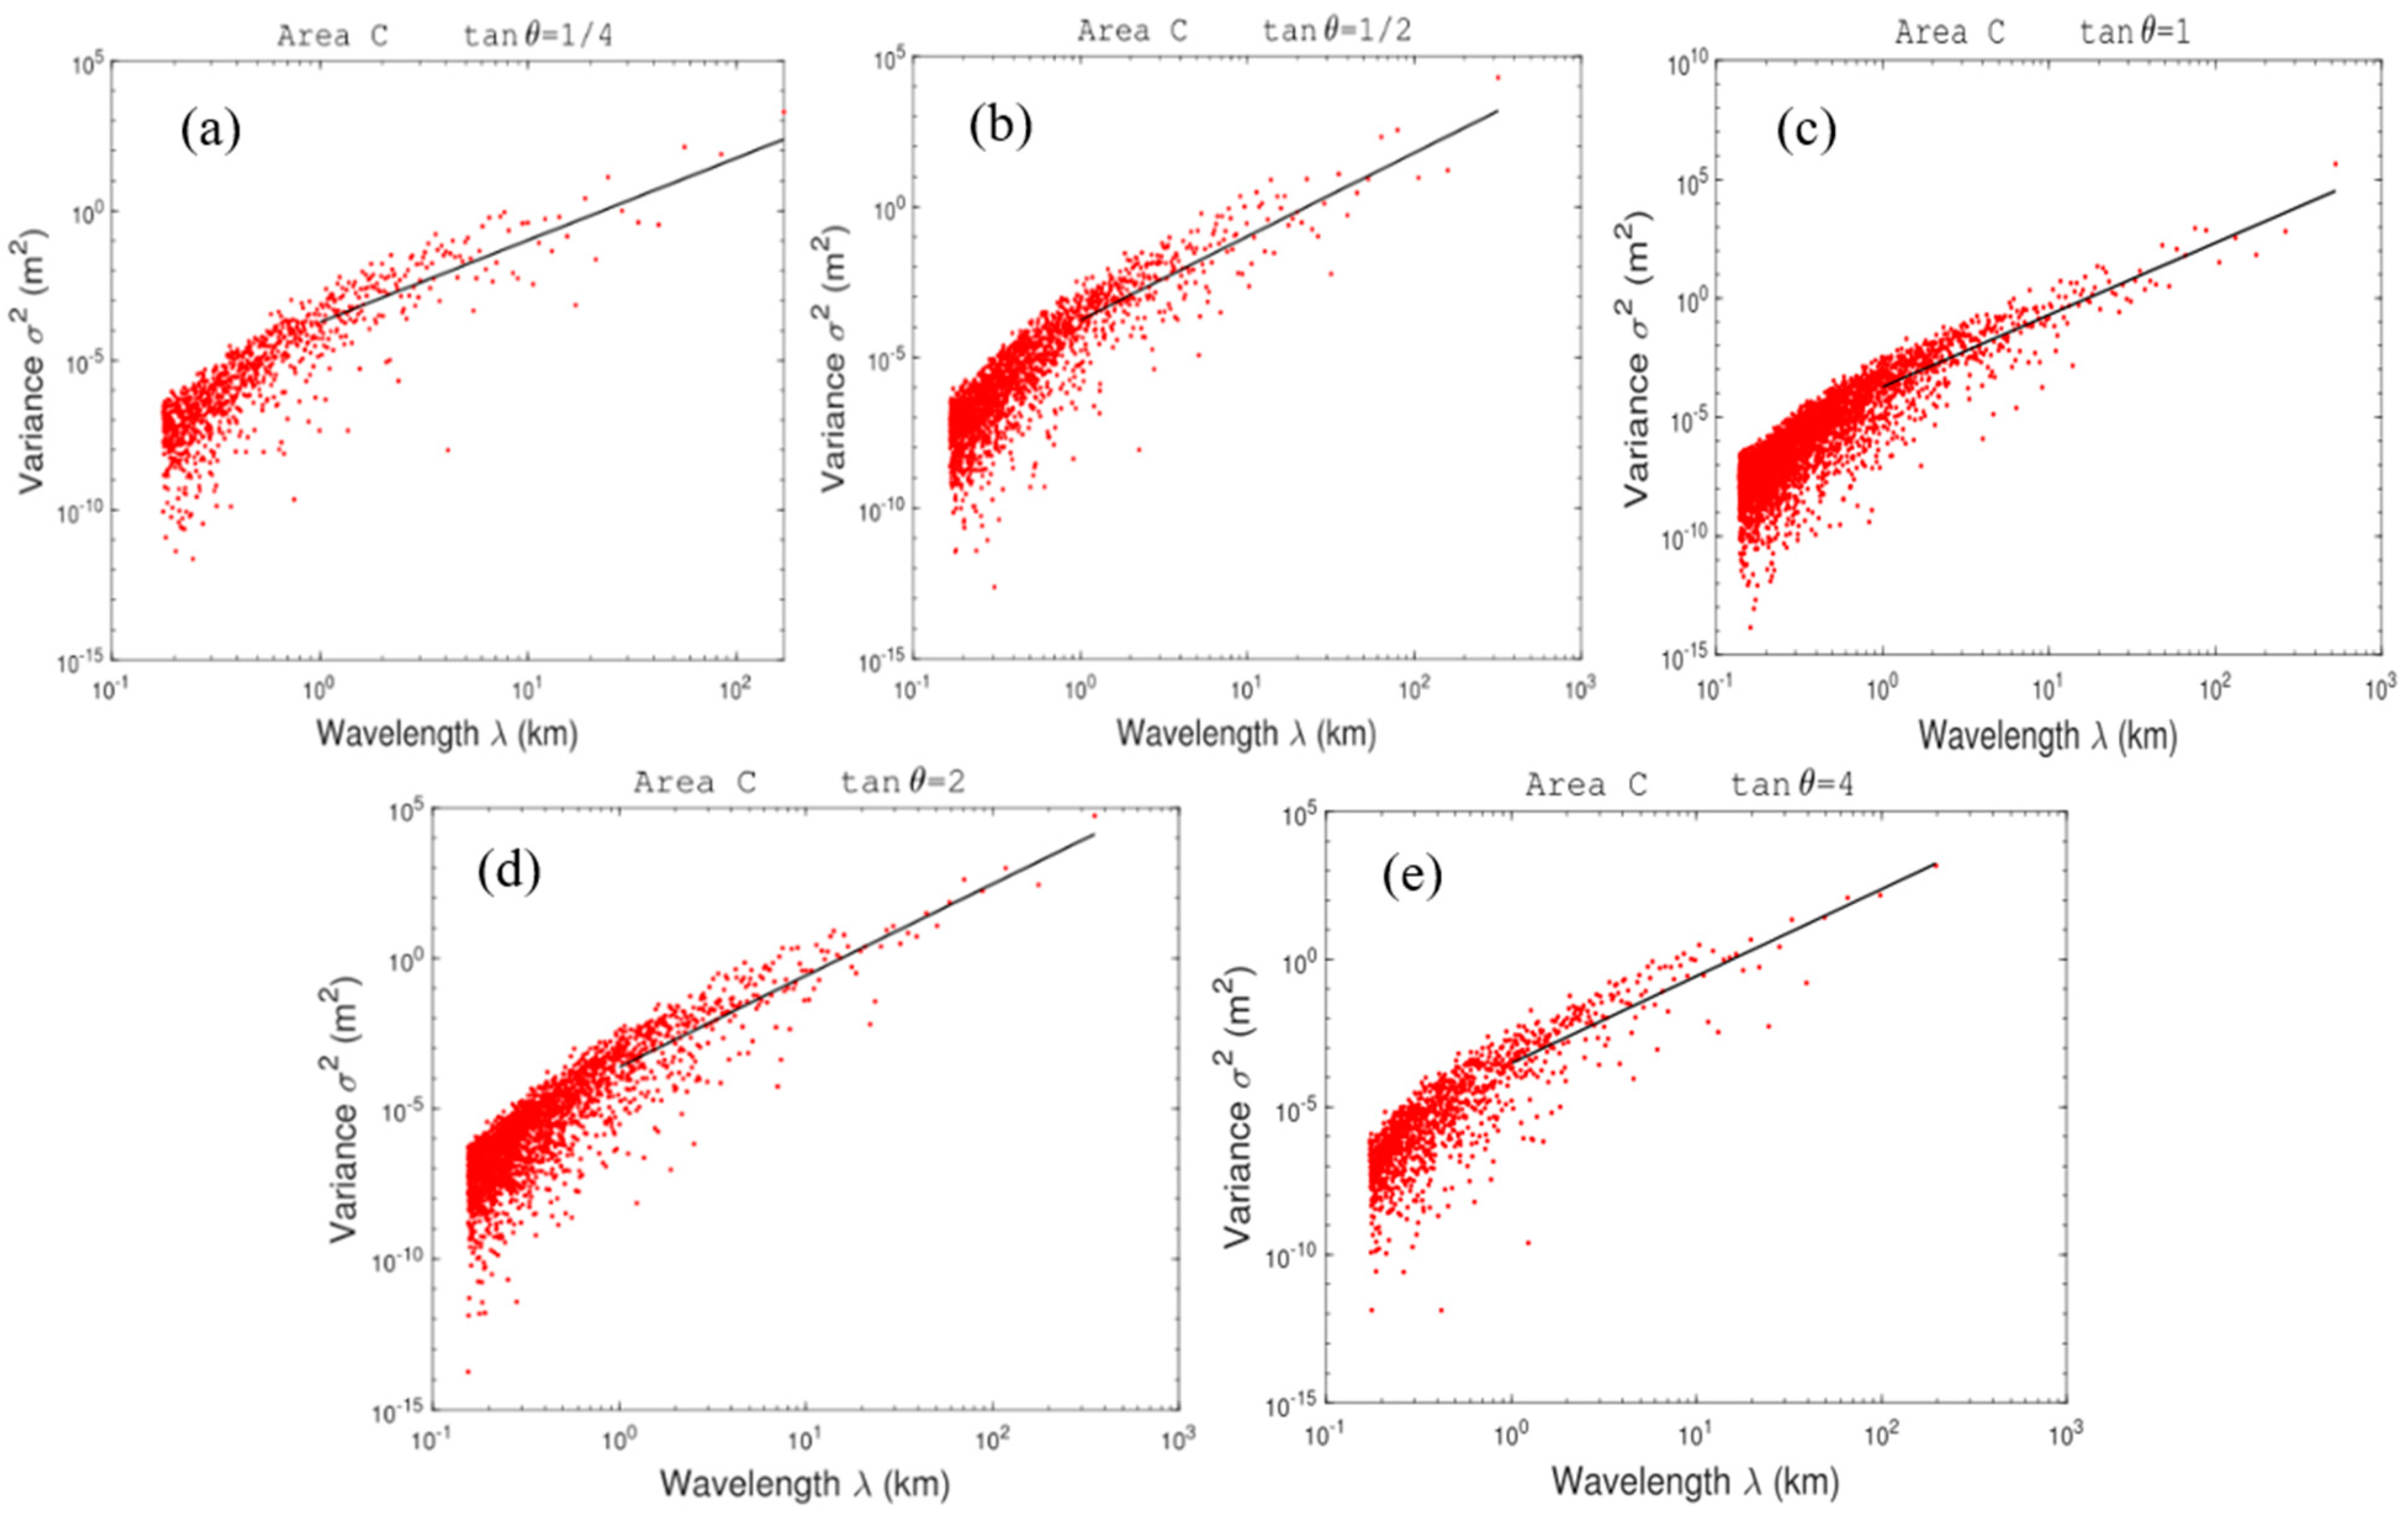
3.2. The Terrain Spectra of Changbai Mountain Region

The 2D-DCT routine is applied over the height values of the three study areas in the Changbai Mountain region, and the resulting spectra depict the distribution of terrain height variances in either wavenumber (k) or wavelength (λ = 1/k) (Figure 4). Terrain height variance spectra reveal the effect of topographic dynamic forcing on the atmosphere, and the greater the spectral energy then the stronger the topographic dynamic forcing [41]. As shown in Figure 4, the terrain height variance in each domain declines with increasing k, implying that the topographic dynamic forcing weakens with the gentleness of the topographic relief. In order to investigate whether there are isotropic features in each study area, the distributions of terrain height variance versus wavelength (km) with the wavenumber (0,0) as the starting point, and the angle (θ) between the rays (as shown in Figure 4) and the x-axes, are represented in Figure 5, Figure 6 and Figure 7, respectively. Because of the discreteness of terrain height variance and the integer variables of the zonal and meridional wavenumbers, the angles meeting with tan θ= 1/4, 1/2, 1, 2, and 4 are used for analyzing. It can be seen that, along these angles in each study area, the longer wavelength presents a larger terrain height variance, and the relatively short wavelength corresponds to the smaller terrain height variance. The variance of the whole wavelength bands has an uptrend with increasing λ, in spite of several departures. Also, the majority of discrete points of terrain height variance are scattered at shorter wavelengths (λ < 1 km), under which the values of the variance are basically less than 0.001 m2.
A power law relationship between the terrain height variance ( σ 2 ) and wavelength λ in the form of σ 2 = a λ b is fitted using the least squares method, and the relevant parameters a, b and the correlation coefficient r can be obtained by the fitting algorithm. Using the F-criterion with a significance level of 0.05, parameters a and b are significant. The coefficient a, representing the terrain height variance when λ = 1 km, reflects the intensity of topographic forcing. The exponent b, which is the spectral slope of the fitting curve in the log–log space, indicates the terrain smoothness. A smaller b shows a greater terrain height variance in shorter wavelength bands and, videlicet, a more pronounced small-scale perturbation. The values of a, b, and r at the wavelength bands of λ ≥ 1 km for the five sections of the three study areas are given in Table 1. It can be found that the values of a and b have considerable differences among these sections in each domain. The average fitting slopes b of the three study areas are 2.98, 2.70, and 2.91, respectively, indicating a pronounced perturbation of large-scale topography in domains A and C. The minimum b of 2.70 implies that the perturbation of small-scale topography is more significant in domain B. The exponent b varies from 2.70 to 2.98, indicating that the terrain of the Changbai Mountain region is complex and there is a difference in the terrain features of different areas, though domains B and C are adjacent.
The values of maximum and minimum b in each domain can be obtained from Table 1. The calculated ratios of the range of b (the difference between the maximum and minimum) to the average value of b for domains A, B, and C are 24.83%, 2.96%, and 10.31%, respectively. Similarly, the ratios of the range of a to the average a for domains A, B, and C are 143.33%, 80%, and 61.01%, respectively. Obviously, the ratios of 24.83% and 143.33%, corresponding to domain A, are the largest in the three study areas, which shows the most obvious anisotropy in the three domains. The minimum ratio of 2.96%, corresponding to domain B, indicates that the anisotropy in this region is the least significant. However, the coefficient a varies considerably from 2.37 to 5.41, and the ratio of the range of a to the average a reaches 80%, implying differing geographic coverage among these sections of domain B. It shows that the overall terrain of the Changbai Mountain region is complex and the anisotropy characteristics are relatively obvious, indicating that simply using one-dimensional terrain spectra may not better present the overall terrain characteristics of this region.

3.3. The Spectral Analysis of Terrain, Precipitation, and Wind Field

In order to investigate the correlation between terrain spectra, total precipitation spectral variance, and average wind spectral variance, the relationship between variance and total wavelength is obtained by performing additive synthesis on the two-dimensional spectral coefficients. Figure 8 shows the distributions of synthesized terrain height variance, total precipitation spectral variance, and average wind spectral variance from June to August averaged over 2008–2022 with respect to λ in the three study areas. It can be seen that the majority of terrain height variance (solid line) is distributed at larger wavelengths (λ > 100 km), under which the values of the variance are basically greater than 1000 m2. The dominant wavelengths (DWs) corresponding to the topographic spectral peak represent the most evident undulation of terrain and, videlicet, the maximum topographic dynamic forcing. When the wavelength is shorter than the DW, the forcing mainly decreases with decreasing λ, in spite of several departures. In Figure 8b, the DW is 278.3 km, corresponding to the maximum spectral energy of 4200 m2 for domain B, less than the values for domains A and C. It indicates that the large-scale topographic perturbations of domain B are relatively weak and the topographic relief of domain B is gentler than that of the other two areas. However, the fluctuation of terrain height variance is more pronounced when λ < DW, indicating significant smaller-scale topographic perturbations of domain B, which is consistent with the result of smaller b for domain B obtained by the previous analysis. Moreover, the maximum topographic spectral energy of 2.6 × 10⁴ m2 for domain C is larger than the values for the other two domains, indicating that the undulation of terrain in domain C is the most pronounced. Also, as shown in Figure 8a and c, the overall fluctuations of terrain height variance are relatively similar, and the DWs are both close to the respective maximum wavelengths for domains A and C, indicating more prominent large-scale topographic perturbations of domains A and C compared to that of domain B.
Further insight into the total precipitation spectral variance (dashed line in Figure 8) and wind spectral variance (dotted line in Figure 8) is gained. It can be seen that the precipitation variances of the three study areas are not exactly the same. The DWs correspond to the spectral peak of precipitation in precipitation spectrum space. As shown in Figure 8a, the DW of precipitation is 390 km, corresponding to the maximum spectral energy of 520 mm2 for domain A. When λ < 390 km, the precipitation spectral variance decreases with decreasing λ, whereas the trend of spectral variance is downward with increasing λ when λ > 390 km. The DWs of precipitation in Figure 8b,c are both close to the respective maximum wavelengths for domains B and C, indicating that the precipitation spectral variance increases with increasing λ in the whole wavelength bands. Similarly, the wind spectral variance of all three domains has an upward spectral energy trend with increasing λ, corresponding to the DWs of wind at the maximum wavelengths. However, differences of the slopes at different wavelength bands exist objectively. A large number of observational facts confirm that the spectral energy of wind displays spectral segments of a −3 slope at the synoptic scale and a −5/3 slope at the meso-scale over wavelengths of <500 km [42,43,44,45,46,47]. Moreover, the wind spectra show a transition characteristic, from dependence at a large-scale range to dependence at a meso-scale range [43,47,48,49,50]. For example, Yu et al. [47] suggested that the average scale of spectral transition is around 300 km when investigating the characteristics of the horizontal kinetic energy spectra of an eastward-moving southwest vortex. Sun et al. [50] found a distinct transition of the wind spectra at a scale of ~400 km. As shown in Figure 8a, the transition scale is at a wavelength of 390 km for domain A, showing the slope transition characteristic of the wind spectra from a large scale to meso-scale. Similarly, the transition scales for domain B and domain C are at a wavelength of 280 km and 260 km, respectively.
A further analysis is undertaken on the relation between the terrain height spectra, wind spectra, and precipitation spectra. Obviously, there is a strong correlation between the variances of the terrain height, total precipitation, and wind field in respective study regions.
For domain A, the variation of the precipitation spectral variance is consistent with that of the wind spectral variance at the wavelength bands of λ < 390 km (the DW of precipitation), implying a high correlation between wind field and the occurrence of rainfall. The inverse relationship between terrain spectra and precipitation spectra appears at larger wavelengths of λ > 390 km, indicating that the precipitation may be dominated by non-topographic factors, and the effect of topographic uplift is not obvious in this region. The occurrence of rainfall is probably the result of the combination of topographic action and the development of weather systems, and the frequency of topographic forcing is not the same as the frequency of the systems. The weather systems that lead to precipitation in this region mainly include the eastward-moving upper trough, the northward-moving north China cyclone, the anomalous cold vortex activity, the high- and low-level jets, frontal systems, and gravity waves. The mountain terrain has a precipitation enhancement effect under some circumstances.
In Figure 8b, it can be seen that there is consistency in the fluctuations of terrain spectra, precipitation spectra, and wind spectra at the wavelength bands of λ < 278.3 km (the DW of terrain), especially at the range of 50–100 km. The consistency shows that the small-scale terrain in this region plays an important role in the uplift of atmosphere and therefore the occurrence and development of summer precipitation. When λ > 278.3 km, there is a reverse relationship of the variation between the terrain height variance and the precipitation spectral variance, whereas the fluctuations of precipitation spectra and wind spectra are relatively consistent. It indicates that the large-scale topographic perturbations of domain B are relatively weak, and precipitation is mainly dominated by certain precipitation weather systems.
For domain C, the topographic spectral energy mainly increases with increasing λ, though there are sporadic departures (100 km < λ < 140 km) from this trend for the actual complex terrain. The precipitation spectral variance also has a spectral energy upward trend with increasing λ, in spite of several departures. The fluctuations of terrain spectra, precipitation spectra, and wind spectra show a significant positive correlation across the whole wavelength bands. The occurrence of resonance between terrain, wind field, and precipitation implies that the large-scale terrain and minor terrain both play a crucial role in atmospheric uplift and the occurrence and development of summer rainfall in domain C. The precipitation systems are impacted by continuous periodic topographic forcing. When the frequency of topographic forcing equals or almost equals the vibration frequency of the precipitation systems or the background fields, the precipitation systems resonate with topographic forcing, thus resulting in the formation of precipitation.

4. Discussion and Conclusions

The terrain of Changbai Mountain has great influence on the distribution of meso-scale atmospheric flows and the occurrence and development of precipitation through dynamic processes. However, quantitative studies on the real terrain characteristics and the terrain effect on precipitation distribution are scant at present, and even fewer studies reference the Changbai Mountain region. This study quantitatively analyzes the distributions of terrain spectra, wind spectra, and precipitation spectra in this region by using a spectral analysis of 2D-DCT. The regional characteristic of topographic perturbations, the distribution characteristics of summer precipitation, and the relationship between terrain, wind field, and precipitation in spectrum space are discussed. The main conclusions are presented below.
The summer precipitation in the Changbai Mountain region is mainly concentrated in August, which is mostly distributed in the southwest of the Changbai Mountain region. The rainband of the summer precipitation presents a northeast–southwest distribution and the precipitation is mainly concentrated in the areas between 40° N and 42° N and between 47° N and 48 °N, of which the terrain is steep. Based on the distribution characteristics of precipitation, three domains with relatively heavy precipitation are selected as the study region for the spectral analysis. The results of the two-dimensional spectral decomposition of the terrain height field in each domain indicate that the overall terrain of the Changbai Mountain region shows anisotropic characteristics. The anisotropy of the terrain in domain A is the most obvious among the three domains, while the terrain in the southwest of the main Changbai Mountain range shows the least significant anisotropy. The complex terrain implies that only using one-dimensional terrain spectra may not better present the overall terrain characteristics of this region, whereas the terrain spectra performing the 2D-DCT routine can successfully demonstrate the anisotropic characteristics.
Through the comparison among the three spectral curves of synthesized terrain height variance with respect to λ in the three study areas, the values of the variance for domain B are basically less than the values for domains A and C in the whole wavelength bands, indicating that the large-scale topographic perturbations of domain B are relatively weak, and the topographic relief is gentler than that of the other two domains. However, the smaller-scale topographic perturbations of domain B are prominent because of undulation of terrain in the shorter wavelength bands. The dominating peak value of terrain height variance for domain C is larger than the values for the other two domains, indicating that the undulation of terrain in domain C is the most pronounced. Also, the dominant wavelengths of terrain height variance for domains A and C are both close to the respective maximum wavelengths and the overall fluctuation of terrain height variance for domain A is similar to that for domain C, indicating more prominent large-scale topographic perturbations of domains A and C compared to that of domain B. The distributions of the total precipitation spectral variance of the three domains are not exactly the same. The DW corresponding to the spectral peak of precipitation for domain A is 390 km, whereas the DWs for domains B and C are close to the maximum wavelengths, respectively. It indicates that the precipitation spectra of domains B and C both increase with increasing λ in the whole wavelength bands. Similarly, the wind spectral variance of all the three domains has an upward trend with increasing λ and shows the slope transition characteristic from a large scale to meso-scale.
Based on the analysis of the relation between the terrain height spectra, wind spectra, and precipitation spectra, the variation of the precipitation spectral variance is consistent with that of the wind spectral variance in the wavelength bands of λ < 390 km for domain A, showing a high correlation between wind field and the occurrence of rainfall. The inverse relationship between terrain spectra and precipitation spectra at larger wavelengths indicates that both terrain and non-topographic factors contribute to the occurrence of rainfall and the terrain effect is weakened. For domain B, there is consistency in the fluctuations of terrain spectra, precipitation spectra, and wind spectra in the wavelength bands of λ < 278.3 km, implying that the dynamic forcing of the smaller-scale terrain has an important effect on the occurrence of summer precipitation. When λ > 278.3 km, a reverse fluctuation exists between the terrain spectra and the precipitation spectra, indicating that the large-scale topographic perturbations are relatively weak, and precipitation is mainly dominated by certain precipitation weather systems. For domain C, the variations of terrain spectra, precipitation spectra, and wind spectra are almost consistent across the whole wavelength bands. The occurrence of resonance between terrain, wind field, and precipitation implies that the large-scale and smaller-scale terrain both play a crucial role in atmospheric uplift and the occurrence and development of summer rainfall in domain C.
The study accurately characterizes the regional characteristics of topographic disturbance over the area of focus by using 2D-DCT. The improved method of additive synthesis is first proposed to calculate the two-dimensional spectral coefficients in order to analyze the relationship between terrain height spectral variance, total precipitation spectral variance, and wind spectral variance. Representing the terrain, wind field, and precipitation in spectrum space simultaneously can more truly reflect the distribution characteristics of the actual terrain, wind field, and precipitation and also indicate the specific response relationship between them, which is conducive to in-depth understanding of the impact of complex terrain on the summer precipitation at different scales. Moreover, terrain height variance plays a key role in the simulation of meso-scale atmospheric flows [51]. The ability to simulate local circulation and rainfall accurately relies heavily on resolving the important terrain features over the study area. Research on the terrain characteristics and its impact on precipitation and wind distribution can help to focus on the dominant terrain that modulates atmospheric flows and precipitation and determine the required grid spacing for meso-scale models of the focus region.

Author Contributions

Author Contributions: Conceptualization, L.L.; Methodology, L.L. and W.A.; Formal analysis, L.L. and W.A.; Investigation, L.L.; Data curation, W.A. and X.Y.; Writing—original draft, L.L.; Writing—review & editing, L.L., W.A., X.Y. and L.Z.; Visualization, L.L.; Supervision, W.A., X.Y. and L.Z.; Funding acquisition, X.Y. and L.Z. All authors have read and agreed to the published version of the manuscript.

Funding

This study was funded by the National Key Research and Development Plan (Grant No. 2022YFC3003000, No. 2022YFC3003004 and No. 2023YFC3006800).

Institutional Review Board Statement

Not applicable.

Informed Consent Statement

Not applicable.

Data Availability Statement

The SRTM digital elevation data used in this work are available from the National Aeronautics and Space Administration (NASA) (https://srtm.csi.cgiar.org/ (accessed on 16 January 2024)). The observed precipitation data are available from the corresponding author on request. The wind data are available from the European Centre for Medium-Range Weather Forecasts (ECMWF) (https://cds.climate.copernicus.eu/cdsapp#!/dataset/reanalysis-era5-pressure-levels?tab=form (accessed on 16 January 2024)).

Acknowledgments

The authors thank the anonymous reviewers for their suggestions, which helped to improve the manuscript.

Conflicts of Interest

The authors declare no conflict of interest.

References

  1. Sun, W.Y.; Mu, X.M.; Song, X.Y.; Wu, D.; Cheng, A.F.; Qiu, B. Changes in extreme temperature and precipitation events in the Loess Plateau (China) during 1960–2013 under global warming. Atmosphere 2016, 168, 33–48. [Google Scholar] [CrossRef]
  2. Zhao, Y.F.; Zou, X.Q.; Cao, L.G.; Xu, X. Changes in precipitation extremes over the Pearl River Basin, southern China, during 1960–2012. Quat. Int. 2014, 333, 26–39. [Google Scholar] [CrossRef]
  3. Domroes, M.; Schaefer, D. Recent climate change affecting rainstorm occurrences: A case study in East China. Clim. Past 2008, 4, 303–309. [Google Scholar] [CrossRef]
  4. Chen, S.J.; Wang, W.; Lau, K.H.; Zhang, Q.H.; Chung, Y.S. Mesoscale convective systems along the Meiyu front in a numerical model. Meteorol. Atmos. Phys. 2000, 75, 149–160. [Google Scholar] [CrossRef]
  5. Hu, B.W.; Cui, C.G.; Fang, C.H. Causes of a two-day successively heavy rain along the Changjiang Valley in the eastern Hubei Province during 21–22 July 1998. Chin. J. Atmos. Sci. 2001, 25, 479–491. (In Chinese) [Google Scholar]
  6. Ding, Z.Y.; Zhang, X.Q.; Shou, S.W. Analysis of relation of South Asia High and rainstorm caused by northwesterly upper-level jet. J. Appl. Meteorol. Sci. 2002, 13, 671–679. (In Chinese) [Google Scholar]
  7. Chen, J.; Liu, L. Characteristics of urban rainstorm and its disaster cause over Beijing in flood season of 2011. Torrential Rain Disasters 2011, 30, 282–287. (In Chinese) [Google Scholar]
  8. Wang, C.X.; Gao, S.T.; Liang, L.; Ding, D.F.; Gong, H.N. Multi-scale characteristics of moisture transport during a rainstorm process in North China. Atmos. Res. 2014, 145–146, 189–204. [Google Scholar] [CrossRef]
  9. Scorer, R.S. Theory of waves in the lee of mountains. Q. J. R. Meteorol. Soc. 1949, 75, 41–56. [Google Scholar] [CrossRef]
  10. Mclntyre, M.E. On Long’s hypothesis of no upstream influence in uniformly stratified or rotating flow. J. Fluid Mech. 1972, 52, 209–243. [Google Scholar] [CrossRef]
  11. Klemp, J.B.; Lilly, D.K. Numerical simulation of hydrostatic mountain waves. J. Atmos. Sci. 1978, 35, 78–107. [Google Scholar] [CrossRef]
  12. Tucker, D.F.; Reiter, E.R. Modeling heavy precipitation in complex terrain. Meteorol. Atmos. Phys. 1988, 39, 119–131. [Google Scholar] [CrossRef]
  13. Johnson, G.L.; Hanson, C.L. Topographic and atmospheric influences on precipitation variability over a mountainous watershed. J. Appl. Meteorol. 1995, 34, 68–87. [Google Scholar] [CrossRef]
  14. Aebischer, U.; Schar, C. Low-level potential vorticity and cyclogenesis to the lee of the Alps. J. Atmos. Sci. 1998, 55, 186–207. [Google Scholar] [CrossRef]
  15. Jiang, Q.F. Precipitation over concave terrain. J. Atmos. Sci. 2006, 63, 2269–2288. [Google Scholar] [CrossRef]
  16. Jiang, Q.F. Precipitation over multiscale terrain. Tellus 2007, 59, 321–335. [Google Scholar] [CrossRef]
  17. Steeneveld, G.J.; Holtslag, A.A.M.; Nappo, C.J.; van de Wiel, B.J.H.; Mahrt, L. Exploring the possible role of small-scale terrain drag on stable boundary layers over land. J. Appl. Meteorol. Climatol. 2008, 47, 2518–2530. [Google Scholar] [CrossRef]
  18. Jia, B.S.; Jia, F.N.; Zhang, W.T.; Liu, G.Y.; Cui, Z.Q. Analysis of heavy rainstorm weather process in Jilin province from July 13 to 14, 2017. Mod. Agric. Sci. Technol. 2021, 4, 176–180. (In Chinese) [Google Scholar]
  19. Yu, J.H.; Gong, Y.F.; Mao, W.S. Comparative analysis on two extreme severe precipitation events in Yongji county, Jinlin province in July 2017. J. Chengdu Univ. Inf. Technol. 2019, 3, 287–296. (In Chinese) [Google Scholar]
  20. Zhang, L.; Li, Z.C. The reason of a heavy rain event in Nenjiang valley in August, 1998. Meteorol. Mon. 2003, 8, 7–12. (In Chinese) [Google Scholar]
  21. Zheng, X.Y.; Zhang, Y.Z.; Bai, R.H. Rainstorm in Northeast China; Meteorology Press: Beijing, China, 1992; pp. 142–145. [Google Scholar]
  22. He, B.H.; Sun, J.Q.; Yu, E.T.; Wang, H.J.; Zhang, M.Q.; Hua, W. Simulation study on the Influence of the great Khingan Strip and Changbai Mountain on summer rainfall in Northeast China. Clim. Environ. Res. 2020, 3, 268–280. (In Chinese) [Google Scholar]
  23. Liu, C.H.; Wang, Y.; Yan, Q.; Tan, Z.H.; Liu, S.; Jiao, H.R.; Jin, Y. Impact of flow over and flow around caused by super low-level jet on a sudden rainstorm over the Changbai Mountains. Torrential Rain Disaster 2023, 3, 273–282. (In Chinese) [Google Scholar]
  24. Pielke, R.A.; Kennedy, E. Mesoscale Terrain Features. Report UVA-ENV SCI-MESO-1980-1; University of Virginia: Charlottesville, VA, USA, 1980; p. 19. [Google Scholar]
  25. Young, G.S.; Pielke, R.A. Application of terrain height variance spectra to mesoscale modeling. J. Atmos. Sci. 1983, 40, 2555–2560. [Google Scholar] [CrossRef]
  26. Young, G.S.; Pielke, R.A.; Kessler, R.C. A comparison of the terrain height variance spectra of the Front Range with that of a hypothetical mountain. J. Atmos. Sci. 1984, 41, 1249–1252. [Google Scholar] [CrossRef]
  27. Srinivasan, K.; Ramanathan, N. Terrain variance spectra for Indian Western Ghats. Proc.-Indian Natl. Sci. Acad. Part A 1994, 60, 133–138. [Google Scholar]
  28. Ramanathan, N.; Srinivasan, K. An estimation of optimum grid size for Kashmir Valley by spectral method. J. Appl. Meteorol. 1995, 34, 2783–2786. [Google Scholar] [CrossRef]
  29. Steyn, D.G.; Ayotte, K.W. Application of two-dimensional terrain height spectra to mesoscale modeling. J. Atmos. Sci. 1985, 42, 2884–2887. [Google Scholar] [CrossRef]
  30. Salvador, R.; Calbo, J.; Millan, M.M. Horizontal grid size selection and its influence on mesoscale model simulations. J. Appl. Meteorol. 1999, 38, 1311–1329. [Google Scholar] [CrossRef]
  31. Wang, C.X.; Liang, L.; Zhang, W.C.; Gao, S.T.; Yang, S. The Impact of Improved Topographic Resolution on the Distribution of Terrain Spectra and Grid-Size Selection for Mesoscale Models. Atmosphere 2022, 13, 708. [Google Scholar] [CrossRef]
  32. Wang, W.T.; Wang, Y. A spectral analysis of satellite topographic profile: A coincident pattern between latitudinal topographic and westerly perturbation on the lee side of Qinghai-Tibet Plateau. J. Nanjing Univ. 2004, 40, 304–317. (In Chinese) [Google Scholar]
  33. Shu, S.J.; Wang, Y.; Li, Y. Effect of topographic perturbation on the precipitation distribution in Tibetan Plateau. Adv. Water Sci. 2006, 17, 585–591. (In Chinese) [Google Scholar]
  34. Denis, B.; Cote, J.; Laprise, R. Spectral decomposition of two-dimensional atmospheric fields on limited-area domains using the discrete cosine transform (DCT). Mon. Weather Rev. 2002, 130, 1812–1829. [Google Scholar] [CrossRef]
  35. Zheng, Y.J.; Jin, Z.Y.; Chen, D.H. Kinetic energy spectrum analysis in a semi-implicit semi-Lagrangian dynamical frame work. Acta Meteorol. Sin. 2008, 70, 371–386. (In Chinese) [Google Scholar]
  36. Jiang, C.; Shen, X.S. Assessment of the simulative performance of the GRAPES model on the convective boundary layer based on the large eddy simulations. Acta Meteorol. Sin. 2013, 71, 879–890. (In Chinese) [Google Scholar]
  37. Prein, A.F.; Holland, G.J.; Rasmussen, R.M. Importance of regional climate model grid spacing for the simulation of heavy precipitation in the Colorado Headwaters. J. Clim. 2013, 26, 4848–4857. [Google Scholar] [CrossRef]
  38. Ricard, D.; Lac, C.; Riette, S.; Legrand, R.; Mary, A. Kinetic energy spectra characteristics of two convection-permitting limited-area models AROME and Meso-NH. Q. J. R. Meteorol. Soc. 2013, 139, 1327–1341. [Google Scholar] [CrossRef]
  39. Huang, Y.J.; Cui, X.P. Spectral characteristics of terrain in the Sichuan basin and the horizontal grid size selection for a mesoscale model. Acta Meteorol. Sin. 2016, 1, 114–126. (In Chinese) [Google Scholar]
  40. Pan, Y.; Shen, Y.; Yu, J.J.; Zhao, P. Analysis of the combined gauge-satellite hourly precipitation over China based on the OI technique. Acta Meteorol. Sin. 2012, 6, 1381–1389. (In Chinese) [Google Scholar]
  41. Pielke, R.A. Mesoscale Meteorological Modeling; Academic Press: SanDiego, CA, USA, 1984; p. 599. [Google Scholar]
  42. Boer, G.J.; Shepherd, T.G. Large-scale two-dimensional turbulence in the atmosphere. J. Atmos. Sci. 1983, 40, 164–184. [Google Scholar] [CrossRef]
  43. Nastrom, G.D.; Gage, K.S. A climatology of atmospheric wavenumber spectra of wind and temperature observed by commercial aircraft. J. Atmos. Sci. 1985, 42, 950–960. [Google Scholar] [CrossRef]
  44. Cho, J.Y.N.; Newell, R.E.; Barrick, J.D. Horizontal wavenumber spectra of winds, temperature, and trace gases during the Pacific Exploratory Missions: 1. Climatology. J. Geophys. Res. 1999, 104, 5697–5716. [Google Scholar] [CrossRef]
  45. Cho, J.Y.N.; Lindborg, E. Horizontal velocity structure functions in the upper troposphere and lower stratosphere: 1. Observations. J. Geophys. Res. Atmos. 2001, 106, 10223–10232. [Google Scholar] [CrossRef]
  46. Shikhovtsev, A.Y.; Kovadlo, P.G.; Lezhenin, A.A.; Korobov, O.A.; Kiselev, A.V.; Russkikh, I.V.; Kolobov, D.Y.; Shikhovtsev, M.Y. Influence of Atmospheric Flow Structure on Optical Turbulence Characteristics. Appl. Sci. 2023, 13, 1282. [Google Scholar] [CrossRef]
  47. Yu, S.W.; Zhang, L.F.; Wang, Y.; Peng, J. Mesoscale Horizontal Kinetic Energy Spectra of an Eastward-Moving Southwest Vortex. Atmosphere 2022, 13, 653. [Google Scholar] [CrossRef]
  48. Waite, M.L.; Snyder, C. Mesoscale energy spectra of moist baroclinic waves. J. Atmos. Sci. 2013, 70, 1242–1256. [Google Scholar] [CrossRef]
  49. Peng, J.; Zhang, L.; Luo, Y.; Zhang, Y. Mesoscale Energy Spectra of the Mei-Yu Front System. Part I: Kinetic Energy Spectra. J. Atmos. Sci. 2014, 71, 37–55. [Google Scholar] [CrossRef]
  50. Sun, Y.; Zhang, F. Intrinsic versus practical limits of atmospheric predictability and the significance of the butterfly effect. J. Atmos. Sci. 2016, 73, 1419–1438. [Google Scholar] [CrossRef]
  51. Wang, C.X.; Gao, S.T.; Ran, L.K.; Liang, L. Proof of the monotonicity of grid size and its application in grid-size selection for mesoscale models. Adv. Atmos. Sci. 2015, 32, 1005–1015. [Google Scholar] [CrossRef]
Figure 1. Distribution of monthly average precipitation in Changbai Mountain region from 2008 to 2022 (contour, unit: mm) in (a) June, (b) July, (c) August, (d) September.
Atmosphere 15 00272 g001
Figure 2. (a) Topographic height of Changbai Mountain region (shade, unit: m) and (b) Distribution of the total precipitation from June to August averaged over 2008–2022 in Changbai Mountain region (contour, unit: mm). The red rectangles indicate the three study areas (A, B, and C) in this study.
Atmosphere 15 00272 g002
Figure 3. Terrain height fields in the study areas A (a), B (b), and C (c). The study area locations are plotted in Figure 2.
Atmosphere 15 00272 g003
Figure 4. The logarithm distribution (lgσ2) of two-dimensional terrain height spectral variance (σ2) in domains A (a), B (b), and C (c). x and y represent the zonal and meridional wavenumber axes, respectively.
Atmosphere 15 00272 g004
Figure 5. The distribution of terrain height variance ( σ 2 ) versus wavelength ( λ ) with the wavenumber (0,0) as the starting point and the angle (θ) between the rays (as shown in Figure 4a) and the x-axes meeting with tanθ = 1/4 (a), 1/2 (b), 1 (c), 2 (d), and 4 (e), respectively, for domain A.
Atmosphere 15 00272 g005
Figure 6. The distribution of terrain height variance ( σ 2 ) versus λ with the wavenumber (0,0) as the starting point and the angle (θ) between the rays (as shown in Figure 4b) and the x-axes meeting with tanθ = 1/4 (a), 1/2 (b), 1 (c), 2 (d), and 4 (e), respectively, for domain B.
Atmosphere 15 00272 g006
Figure 7. The distribution of terrain height variance ( σ 2 ) versus wavelength λ with the wavenumber (0,0) as the starting point and the angle (θ) between the rays (as shown in Figure 4c) and the x-axes meeting with tanθ = 1/4 (a), 1/2 (b), 1 (c), 2 (d), and 4 (e), respectively, for domain C.
Atmosphere 15 00272 g007
Figure 8. The distributions of terrain height variance (solid line), total precipitation variance (dashed line), and average wind spectral variance (dotted line) from June to August averaged over 2008–2022 versus wavelength λ for domains A (a), B (b), and C (c).
Atmosphere 15 00272 g008
Table 1. Parameters of the least square fitting relation σ 2 = a λ b (λ ≥ 1 km) for the five sections in each domain.
Domaintan θ1/41/2124Average
AA(10−4)
b
r
0.21
3.40
0.94
0.27
3.14
0.93
0.50
2.90
0.93
0.94
2.79
0.93
1.07
2.66
0.92
0.60
2.98
 
BA(10−4)
b
r
2.90
2.75
0.93
2.37
2.78
0.94
3.80
2.70
0.91
4.50
2.70
0.92
5.41
2.59
0.91
3.80
2.70
 
CA(10−4)
b
r
1.90
2.74
0.90
1.70
2.77
0.90
1.87
3.03
0.91
2.38
3.04
0.92
3.03
2.95
0.91
2.18
2.91
 
Disclaimer/Publisher’s Note: The statements, opinions and data contained in all publications are solely those of the individual author(s) and contributor(s) and not of MDPI and/or the editor(s). MDPI and/or the editor(s) disclaim responsibility for any injury to people or property resulting from any ideas, methods, instructions or products referred to in the content.

