Abstract
The ENSO phenomenon is associated with below average rainfall and influences the climate regime of southern Africa. With the advent of climate change, drought frequencies and magnitudes have worsened in the developing world and this in turn negatively impacts the natural environment and communities’ livelihoods. This study evaluated the relationship between El Niño-induced drought and reservoir water levels over the Albasini Dam Catchment (ADC) areas in Limpopo Province, South Africa. Standardised indices (i.e., SPI and SSI) were used to define drought events over the study area. Mann–Kendall and Sequential Mann–Kendall were used for trends analysis as well as correlation and wavelet coherence to evaluate the relationship between variables of interest. There exists a relationship between El Niño-induced drought event and reservoir water levels. This was shown by the correlation between drought indices and reservoir water levels with the coefficient of determination being stronger at the 12th timescale (i.e., 0.743 and 0.59) compared to the 6th timescale (i.e., 0.07 and 0.44) for both precipitation and streamflow indices, respectively. Wavelet analysis further showed that there existed a phased relationship between the two variables. Although there are other factors that may affect reservoir water resources, these study findings show that El Niño-induced drought also negatively affect water resources. Therefore, this study recommends the development of multidimensional and multiscale management strategies to minimise drought impacts and adaptation in the region.
1. Introduction
The El Niño–Southern Oscillation (ENSO) influences the global climatic regime [1] and is characterised by a cool (La Nina) and warm phase (El Niño). The phenomenon results from the fluctuating equatorial Pacific Ocean temperatures and large-scale air pressure changes [2,3]. The ENSO phenomenon impacts the southern Africa climatic regime, with regional and international events [1]. It is associated with drought hazards, a recurrent feature of the region’s climate. This may be influenced by higher-than-normal global temperatures associated with the phenomenon [4], which are frequently associated with below-average rainfall in southern Africa [5]. As a result, countries in the region experience severe and extensive droughts, and in the case of South Africa, some of the major drought events over the last four decades occurred in 1982/84, 1991/92, 2004/05, 2015/16, and the most recent one was experienced in 2018/20 [6]. The consequences of increased drought events linked to El Niño events include impacts on the availability of water resources, communities’ livelihoods, and environmental and human health [7]. Previous studies have described a strong and consistent teleconnection among ENSO and temperature patterns worldwide [2,8,9] while [10] reported this at a regional scale. This can be further justified by the work of Halpert and Ropelewski [11], which was one of the first studies to establish a teleconnection between El Niño events to southeastern Africa temperatures. Teleconnections have the capability to modify regional circulation patterns [12], and as such, an El Niño signal has evidently modulated fluxes of moisture advected onto the southern African plateau [13,14]. Notable El Niño events that have been associated with severe droughts occurred in 1991/92, 2002/03, and 2015/16, with the one occurring in 1997/98 resulting in dry conditions [14]. In 1992, a more critical El Niño event was reported compared to those experienced in 2016, 1998, and 1983 [5]. On a regional scale, the 2014/15 and 2015/16 El Niño events exacerbated agricultural production challenges around the Limpopo Province. This resulted in drought events that affected different water-dependent sectors, i.e., recreational, agricultural, industrial, and domestic. While water security in South Africa is diverse, the least developed and rural areas experience severe and direct risks. This is a result of the high spatial–temporal variability of rainfall and general semi-arid climate characteristics of the country [15]. South Africa’s water resources are linked through inter-catchment transfers and managed as large integrated systems. Such a management system is helpful in decreasing the probable risk of collapse through the collective use of resources and harmonising climatic variability over vast geographic areas [16].
The Luvuvhu River Catchment (LRC) in the northernmost part of South Africa, which hosts the Albasini, Nandoni, and Vondo dams, experienced a decrease in mean annual precipitation (MAP) of 14% between 1991 and 1992 [17], resulting in the severe 1991/92 event. Since rainfall is a major contributor to reservoir water resources, a reduction in annual precipitation negatively impacts water supply to different water users. Studies focused on drought such as [18,19,20,21,22] have been conducted in the LRC. However, these aimed to characterise, assess, and predict drought events and not much attention has been directed to evaluate the relationship between El Niño-induced drought and reservoir water resources. There are studies that have examined El Niño-induced drought in various part of the world, e.g., [23,24]; meanwhile, Ref. [25] examined water resource management strategies in times of ENSO over the transboundary Santa Cruz River Basin. The latter studies focused on the impacts of ENSO on agricultural production, water quality, and reservoirs, with less attention on the statistical correlation between reservoir water resources and El Niño-induced drought. From a water management perspective, a study that seeks to investigate drought impacts on reservoir water resources is significant, more so now that the frequency of such events has been predicted to be on an increasing trend due to climate change-related disasters [26]. In the case of Sub-Saharan Africa, drought episodes are often linked to desertification, which may result in serious land degradation of semi-arid and arid environments emanating from climate change, as well as human activities such as unsustainable and inefficient farming practices [27]. The latter further indicate that exacerbate desertification from an increase in drought frequency and severity resulting from climate change could lead to a loss in vegetation cover, a reduction in carbon sinks, and the release of additional greenhouse gases to the environment. The management of droughts resulting in El Niño events is one of the significant challenges of the 21st century. Thus, information on the influence of El Niño on drought occurrence can aid in disaster risk reduction and management. This study aims to explore the critical impact of drought on reservoir water resources in the semi-arid region of South Africa.
2. Materials and Methods
2.1. The Study Area
The Albasini Dam as shown in Figure 1 is located 22 km southeast of the town of Louis Trichardt within the Luvuvhu River Catchment (LRC) in Limpopo Province. The Albasini Dam is found 45 km west (upstream) of the most recent constructed Nandoni Dam in the Luvuvhu River. Constructed on the Luvuvhu River stem in 1952, the Albasini Dam covers a surface area of 350 ha with a maximum carrying capacity of 252 × 105 m3. The biggest consumer of the Albasini Dam freshwater is the irrigated agriculture in the Levubu Valley [28]. This area is known for its richness in tropical fruits such as bananas, avocados, mangos, and macadamia nuts amongst others. More water from the dam is used by trees that may result in lowered reservoir water levels (RWLs) as the dam is characterised by a high downstream tree density [29]. Average temperatures in summer are in the 30 °C ranges whilst the winter temperatures vary between 20 °C and 25 °C with a mean annual precipitation of 608 mm.
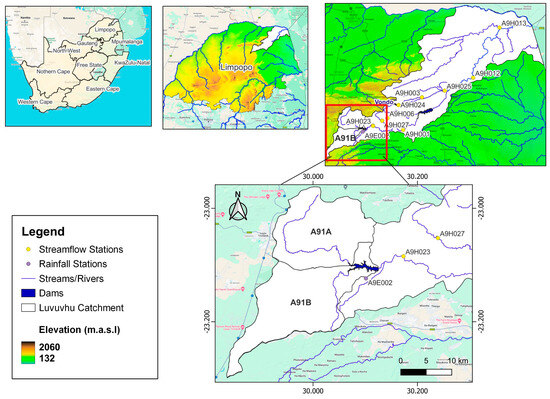
Figure 1.
Map of the study area showing the location of Albasini Dam in the context of South Africa, Limpopo Province and the LRC (accession numbers).
2.2. Datasets
To achieve the objective of this study, secondary monthly mean rainfall, streamflow, and reservoir storage data from 1990 to 2020 were obtained from the National Department of Water and Sanitation, South Africa. The Niño 3.4 monthly climate time series was downloaded from National Oceanic and Atmospheric Administration repository (https://psl.noaa.gov/data/timeseries/monthly/NINO34/ accessed on 15 June 2022). Rainfall and streamflow data were used determine the standardised precipitation index (SPI) and standardised streamflow index (SSI), respectively. Meanwhile the reservoir water levels were correlated with the SPI and SSI to determine the influence of drought episodes on reservoir water resources.
2.3. Data Analysis Methods
2.3.1. Standardised Indices
The SPI and SSI were used to describe meteorological and hydrological drought, respectively. These were formulated at the 6- and 12-month timescales. The 6-month SSI and SPI indicate medium-term changes in streamflow and precipitation time series, respectively, whereas the 12-month SPI and SSI indicate long-term patterns [30]. The SPI was used to evaluate rainfall patterns within respective reservoir catchment areas for 30 years. The SPI [31] was developed for drought monitoring in the USA; however, the index has been extensively adapted in many regions of the world. The authors of [32] reported that the gamma distribution better fitted the precipitation time series than the exponential time series, and as such, this former distribution was adopted for this study. The probability density function that defines the Gamma distribution is given by Equation (1):
where α > 0, α is a shape factor and β > 0, β is a scale factor.
where, Ґ(α) is the gamma function. Computation of the SPI involves fitting a gamma probability density function to a given frequency distribution of a precipitation total for a particular station. The cumulative probability is given by Equation (3):
By letting t = x/β, Equation (3) becomes Equation (4):
The gamma function is undefined for x equal to 0 and a precipitation distribution may contain zeros. Therefore, to compute the cumulative probability, Equation (5) is used:
where q is the probability of a zero. If m is the number of zeros in a precipitation time series, then q can be approximated by m/n. The cumulative probability, H(x), is then altered to the standard normal arbitrary variable Z with the mean equal to zero and a variance of one, which is the value of the SPI [33]. SSI was computed by following the same steps as applied in computing SPI using streamflow data, and like SPI, this index shows a proper gamma distribution [34]. McKee [31] defined different drought SPI values to a drought category, i.e., −0.99 to 0.99 is classified as near normal or mild conditions, −1 to −1.49 shows moderate category, while −1.50 to −1.99 and −2.0 or greater depict severe and extreme drought categories, respectively.
2.3.2. Drought Characterisation
To characterise historical droughts, the standardised indices time series were used. For this study, drought events will be characterised based on duration, severity, and intensity. Drought duration denoted by is the months between the beginning and an end of a drought event; the beginning is included in the computations, whereas the end is excluded [35]. To obtain drought duration, the total of the durations of each drought event is divided by the number of drought events [36] as shown in Equation (6):
where is the duration of the i-th drought event in a particular area and is the total number of drought events in that area. Drought severity () is the absolute value of sum of an index value during a drought event and is given by Equation (7):
where is the drought event, is the month, and indexj is the index value in month . Drought intensity is given by the division of drought severity with drought duration. Intensity is directly proportional to severity of drought: when one increases, the other also increases [37]. Intensity is calculated using the following Equation (8):
where is the drought duration, drought severity, and the intensity of a drought event.
2.3.3. Trend Analysis
The Break for Additive Seasonal and Trend (BFAST) method as presented in Equation (9) was used to decompose reservoir water levels and drought indices time series.
In Equation (9), m is the mean, T is trend component, S is seasonal component, and R is the random component of the time series. Mann–Kendall (MK) non-parametric trend test [38,39] was used for drought trend analysis. This trend analysis method has been recommended by the WMO as an approach to computing trends of hydro-meteorological time series. The method has been widely applied in testing trends of climatological time series [40]. The test statistic S is calculated using Equation (13).
The average value of S is E[S] = 0. The value of the S statistic is associated with the test statistics , and this is computed using Equation (11):
This study considered a 5% confidence level, where the null hypothesis of no trend was rejected if |z| > 1.96. The extended MK trend, known as the Sequential MK (SQMK) [41] is used to detect the turning points of trend in the time series. The SQMK creates two-time series, a progressive and a retrograde . Equation (12) defines the statistic :
Equations (13) and (14) are used in calculating the mean and variance :
and
Statistic sequential values, which are standardised, are calculated by Equation (15):
Equation (15) gives a forward sequential progressive statistic. To calculate the backward/retrograde statistic values (), the same time series () is used; however, the tail end of the time series is the starting point in this calculation. By combining the forward and backward sequential statistics, it makes it possible for the recognition of the estimated start of a developing trend [42]. When plotted, if and cross each other and diverge beyond the ±1.96 (95% confidence interval) threshold, a statistically significant trend exits in a time series. The region where they cross each other is the time where the trend turning point begins.
2.3.4. Wavelet Analysis
The wavelet transform coherence (WTC) is presented by a ratio of the cross-spectrum to the product of the spectrum of each time series and further proposes local correlation between two variables’ time series within frequency bands and time intervals [43]. In comparison with other correlation techniques, wavelet coherence analysis can acquire the coherence coefficients at different spatial locations and scales while considering the spatial phase, thereby obtaining the spatial heterogeneity of the association across scales [44]. The WTC technique has frequency and phase variation analysis capabilities across time in a signal at several scales [45,46]. Since climatic variables vary over space and time, the authors of [47] suggested that WTC offers improved analyses of climate time series as these features can be identified through the frequency domain. Therefore, the Morlet Carlo wavelet and coherence analysis was used to quantify the relationship between El Niño-induced drought and water resources for the current study. Additional information and the mathematics on the wavelet analysis applied in this study can be obtained in [48,49].
3. Results
3.1. Drought Assessment
SPI time series were analysed at two timescales (6 and 12 months) in this study, and these were used to analyse historical drought in the Albasini Dam Catchment for a duration of 30 hydrological years (January 1990 to December 2020). Figure 2 shows SPI and SSI results for stations A9E002 and A9H023, respectively. The analysis of all SPI timescales detected all the major drought events between 1990 and 2020 (1991/92, 1995–1996, 2002–2003, 2005–2006, and 2015–2016). The SPI-6 drought classification’s percentage occurrence of mild, moderate, severe, and extreme drought conditions ranged between 66.49%, 23.94%, 8.51%, and 1.06%, respectively. The SPI-12 had a percentage occurrence of 66.28% for mild drought, 21.51% for moderate drought, and 12.21% for severe drought conditions. The most extreme drought cases were in 2006 for SPI-6 and between 2002 and 2004 and 2005 and 2006 for SPI-12. The station reported 36, 25, and 24 drought months between 2002 and 2006, 2008 and 2010, and 2015 and 2016, respectively. These three droughts months’ durations are the highest in the SPI-12 analysis. The results of the highest duration in 2002–2006 for SPI-12 were similar to findings by Kumar et al. [50]. Catchment A91A at the SPI-12 timescale did not detect any extreme dry drought months, but the SPI-6 timescale detected two extreme dry months. Moderate droughts for SPI timescales had a minimum of −1.49 and SPI-6 had a maximum of −1, whereas SPI-12 had a maximum of −1.04.
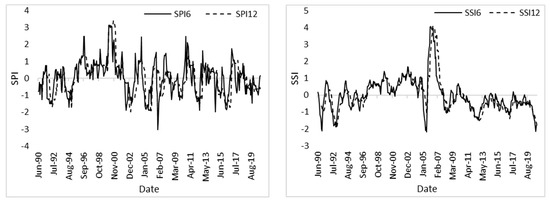
Figure 2.
Meteorological (SPI) and hydrological (SSI) drought time at 6- and 12-month timescales for stations A9E002 and A9H023, respectively.
The SSI detected all the major drought events (1991/1992, 2002/2003, and 2015/2016) that have been previously reported in literature over the study period [11,51,52]. SSI reported that the 1991/92 drought had the highest magnitude for both 6- and 12-month timescales, which can be categorised similarly to the extreme drought found by the authors of [51]. The 2004/05 drought is also seen as an extreme drought event, and this agrees with the findings of [52]. The drought period of 2014/15 for this study experienced mild drought and 2016/17 showed severe streamflow drought conditions, particularly from the month of May 2016 to April 2017. The SSI-6 indicates that the ADC experienced mild drought for 160 months and 30 months of moderate drought, with 12 and 5 months of severe and extreme drought, respectively, from 1990 to 2020. SSI-12 has numerous mild droughts than the SSI-6 timescale between 1990 and 2020. Both indices at both timescales detected that mild drought was more dominant throughout the entire study period. This means that the study area experienced mild drought for a majority of the months in the study period. This study found that the increase in timescales increases with drought severity since a majority of the severe droughts were reported at both the 6- and 12-month timescales considered in this study.
3.2. Historical Drought Characterisation
Three drought characteristics (i.e., duration, severity, and intensity) were analysed in this study for both SPI and SSI and the results are presented in Table 1. The table shows the longest duration, strongest severity, and highest intensity of drought events for the indices considered at 6- and 12-month timescales. The longest drought duration between 2010 and 2014 was shown for SSI-6 and between 2010 and 2020 for SSI-12. SPI reported the lowest duration between 2002 and 2003 and 2002 and 2006 at SPI-6 and SPI-12, whereas SSI recorded the highest duration for both timescales.

Table 1.
Duration, severity, and intensity of drought events for different periods as depicted by SPI and SSI.
The SSI showed the strongest severity between 2010 and 2020, which was −89.36, and was then followed by 2002–2006 (−39.21), and the one with the least severity was observed between 1992 and 1993 (−20.34). This therefore shows that the 2014/2016 drought was more severe compared to the 1992 drought. Drought severity was found to increase with increasing timescale. SSI reported the highest intensity of −1.35 for SSI-6 and −3.57 for SSI-12. In the case of drought intensity increasing with an increased timescale, the results were more evident between 2010 and 2020, and 2005. The relationship between duration and severity is important for the drought intensity results and analysis. Intensity is directly proportional to severity, which means high intensity corresponds to high severity.
3.3. Drought Trends and Their Significance
The trends for both SPI and SSI indices were found to be negative. The study found that at both timescales, the decreasing trends were significant. Figure 3 shows that the BFAST extracted non-linear trend fitted with a linear regression line to show the direction of trend. Like the MK trend findings, the BFAST non-linear trend depicts a downward trend which signifies that over the 30 years of study, drought events were on an increase in catchment A91A.
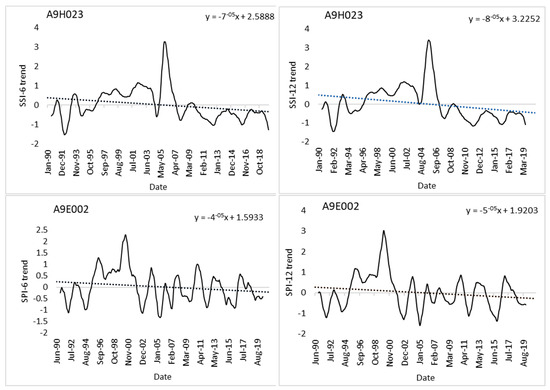
Figure 3.
SPI and SSI BFAST trend at 6- and 12-month timescales for stations A9H023 and A9E002.
Sequential Mann–Kendall (SQMK) test statistic for monthly mean standardised indices at the 6th and 12th timescales time series clearly detects the statistically significant change points, and this is shown in Figure 4. Figure 4a,b show a trend increase in 1995; this was followed by a continuous significant decreasing trend after 2005. The SSI at both timescales showed a significant negative trend from the early 2000s. This therefore indicated that streamflow drought is increasing in the study area. These findings are consistent with the MK test and BFAST as well as the drought periods reported in the literature.
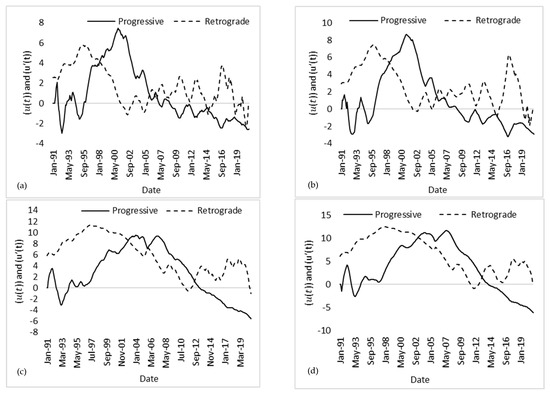
Figure 4.
Forward and backward series of SQMK test for (a) SPI6, (b) SPI12, (c) SSI6, and (d) SSI12 for sub-catchment A91A.
3.4. Correlation of Drought Events and Reservoir Water Levels
Figure 5 shows a comparison between reservoir water levels and SPI and SSI at 6- and 12-month timescales for major drought events reported over the study area (i.e., 1991/1992, 1995/1995, 2003/2004, 2005/2006, and 2014/2016). For all the drought periods, reservoir water levels decreased as SSI and SPI decreased at both timescales. For the 1995/1996 and 2005/2006 droughts, an increase in reservoir water levels was noted at the end of 1995 and 2005.
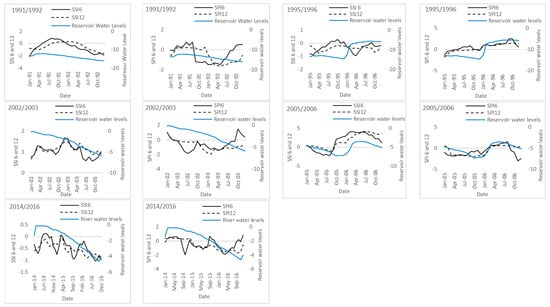
Figure 5.
Relationship between SPI and SSI at 6- and 12-month timescales and reservoir water levels for major droughts that have been reported over the study area between 1990 and 2020.
Figure 6 shows the Pearson correlation between the reservoir water levels, Niño 3.4, SSI, and SPI for the study period between 1990 and 2020. The correlation was low at the 6-month timescale compared to the 12-month timescale. Niño time series showed a moderate negative correlation of −0.4 with SPI and a low positive relationship with SSI at both timescales. The correlation between indices and reservoir water levels was found to be 0.36 for SPI-12, while the rest were low and ranged between 0.16 and 0.21.
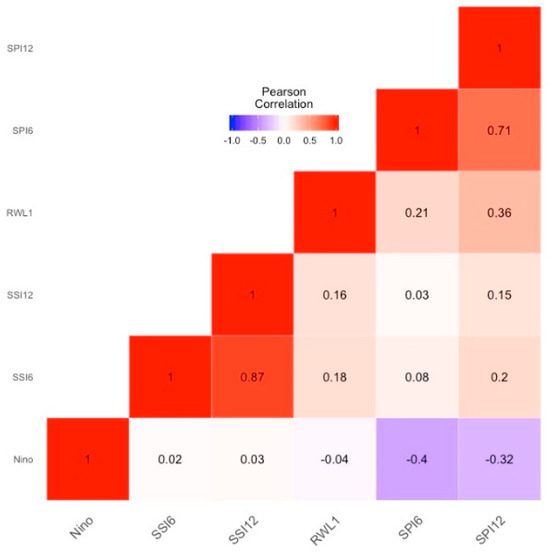
Figure 6.
Correlation heatmap between Niño, SPI6, SPI12, SSI6, SSI12 and RWLs.
To further illustrated the relationship between drought and reservoir water levels, the study computed the coefficient of determination as shown in Figure 7. The SPI-12 and water levels possess a strong correlation with an R2 of 0.7343. The correlation for SSI-6 and SSI-12 timescales are considered to have a moderate correlation with reservoir water levels. The correlation categories based on [53] relates an R2 of 0.00–0.10 as negligible, 0.10–0.39 as a weak correlation, 0.40–0.69 as moderate correlation, 0.70–0.89 as strong correlation, and 0.90–1.00 as a very strong correlation. This, therefore, shows that there exists a relationship between reservoir water resources and drought over the catchment and this correlation is more pronounced at higher drought indices timescales.
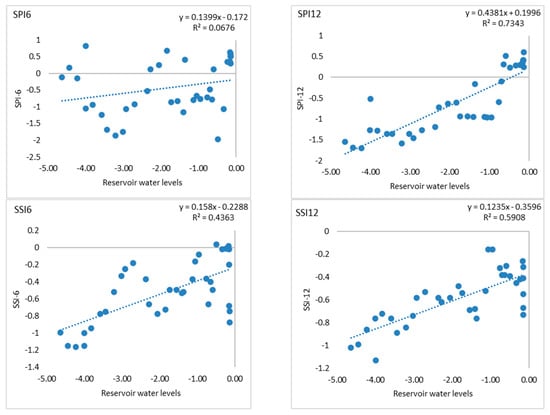
Figure 7.
Scatterplot showing SPI and SSI correlation against reservoir water levels.
3.5. Wavelet Coherence Analysis
To investigate the interdependence among SSI, SPI, RWLs, and Niño 3.4, WTC was used. The wavelet coherence analysis between SSI and SPI at the 6th and 12th timescales with Niño 3.4 time series and reservoir water levels is shown in Figure 8a–h. The u-shaped solid line in all the figures represents the cone of influence (COI) [54] and is the only region considered for analysis. The thick solid line within the COI represents the 95% significance regions of the confidence interval [49], and it is within this area where the significance interdependence between Niño 3.4 and the drought indices as well as reservoir water level is studied. Wavelet coherence reveals that the coherence and phase lag between two time series are both a function of time and frequency [55]. SPI showed an anti-phase relationship with the Niño 3.4 time series at both timescales between the 32nd and 64th month. Meanwhile, a high wavelet coherence is observed between the 22nd and 28th month in Figure 8e,f and the upward arrows in the same figures indicate that Niño 3.4 leads the streamflow drought in the study area. SPI showed a strong in-phase relationship with reservoir water level compared to SSI and this was the strongest at the 6th timescale. This in-phase relationship is seen roughly after the 32 months, and this intensified between 2006 and 2016.
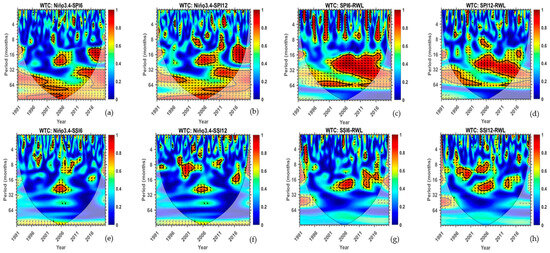
Figure 8.
Wavelet coherence between (a) Niño 3.4 and SPI12, (b) Niño 3.4 and SPI12, (c) SPI6 and RWLs, (d) SPI12 and RWLs, (e) Niño 3.4 and SSI6, (f) Niño 3.4 and SSI12, (g) SSI6 and RWLs, and (h) SSI12 and RWLs. The phase relationship is represented by arrows (in-phase ⇾; anti-phase ⇽). The black solid line is the cone of influence and indicates a 95% confidence level; contours delimit the region where there is a strong correlation.
4. Discussion
Using SPI and SSI as drought quantifying parameters, this study evaluated the relationship between El Niño-induced drought and reservoir water level. Both indices detected that a majority of drought events were reported to have occurred over the region at the 6th and 12th timescales and these were classified at different categories. From the findings of the study, high streamflow drought duration was observed between 2010 and 2020 and this coincided with one of the strongest El Niño event experiences in the southern hemisphere. Furthermore, as this is the longest duration observed on the streamflow index, this will have convoluted effects on the amount of water making its way to the reservoir. It should be noted that, in addition to natural controls, anthropogenic activities, e.g., reservoir operations and abstractions, can influence streamflow drought event characteristics [56]. However, the authors of [57] suggested different approaches to investigate human influences on streamflow drought. One such approach is the straightforward comparison of meteorological droughts with streamflow droughts as demonstrated in this study. Although studies such as [58,59] critiqued this approach, this study considered both meteorological and hydrological relationship deficits at different timescales. Further statistical analyses were employed to demonstrate the usefulness and effectiveness of the applied approach.
Over the considered study period, trends of both streamflow and rainfall drought show a negative linear trend and this is further supported by the SQMK findings which shows a negative progressive trend at both timescales for SPI and SSI. The general relationship shown in Figure 5 indicates a proportional relationship between the drought indicators and reservoir water level. This relationship is supported by [60] which looks at the “Day zero” phenomenon in Cape Town; the study reported a significant drop in the storage of reservoirs supplying water to 3.7 million people in the metropolitan area. This drop was the result of a three-year rainfall deficit, which resulted in the 2015–2017 drought in southwestern South Africa. The study findings further show a correlation between reservoir water levels and the drought quantifying parameters. With the coefficient of determination showing a higher correlation at the 12th timescale, and the 6th timescale of the SPI showing the least correction. Wavelet coherence analysis showed a significant relationship between reservoir water levels and SPI at both timescales, while the same was not the case for SSI. This strong relationship between SPI and reservoir water levels was observed between 2006 and 2016 in the region of the 20th and 40th months. Moderate-to-strong correlations between hydrological and climatic drought indices point to other factors having an effect on the water levels [61]. Such factors may be attributed to anthropogenic abstraction such as water reservoir abstractions for domestic and agricultural demand. Due to reservoir water levels dropping significantly during the major drought periods, this is an indication of the influence which the phenomenon has on water resource availability. This is evident from the wavelet coherence analysis, which showed that the Niño 3.4 time series leads to streamflow drought, which may affect surface water availability. This is therefore a further indication that during drought events, there is a deficit in rainfall, which affects the amount of water flowing into the reservoirs. This may further be exacerbated by anthropogenic drought. Anthropogenic drought is the compound multidimensional and multiscale phenomenon governed by a combination of factors (i.e., natural water variability, climate change, human decision and activities, and altered micro-climate conditions due to changes in land and water management) [62].
5. Conclusions
This study explored the impacts of drought on reservoir water resources in the Albasini Dam Catchment in the Levubu Valley. The study findings showed a positive relationship between rainfall and streamflow drought with reservoir water levels. A further decreasing trend of streamflow and rainfall was observed. These findings have an implication of surface water availability and sustainability in this area, where there is a critical need for agricultural water demand. In addition to the observed decreasing trends of hydroclimatic variables, together with unpredictable impacts of climate change on rainfall and drought magnitudes and frequencies, the implication on water resources is eminent. To ensure the sustainable management of water resources in this area to circumvent future shortages, management strategies should be improved. These improved management strategies should aim to minimise drought impacts with the development of adaptation plans which consider the multidimensional and multiscale nature of drought.
Author Contributions
Conceptualization, F.I.M. and L.M.; methodology, F.I.M., L.M. and N.M.; software, N.M.; formal analysis, F.I.M., L.M., S.M. and N.M.; data curation, N.M.; writing—original draft preparation, F.I.M.; writing—review and editing F.I.M., L.M., S.M. and N.M.; visualization, N.M. All authors have read and agreed to the published version of the manuscript.
Funding
This research received no external funding.
Institutional Review Board Statement
Not applicable.
Informed Consent Statement
Not applicable.
Data Availability Statement
All data used in the study are freely available from the South Africa Department of Water and Sanitation Hydrological Services, https://www.dws.gov.za/Hydrology/, accessed on 15 July 2021.
Acknowledgments
Authors acknowledge the Department of Water and Sanitation in South Africa for freely providing data used in this study.
Conflicts of Interest
The authors declare no conflicts of interest.
References
- Govender, R.L.; Grab, S.W. Assessing the impact of El Niño-Southern Oscillation on South African temperatures during Austral summer. Int. J. Climatol. 2018, 39, 143–156. [Google Scholar] [CrossRef]
- World Meteorological Organisation. El Niño/Southern Oscillation; WMO: Geneva, Switzerland, 2014; Volume 1145, pp. 2–4. Available online: http://www.wmo.int/pages/prog/wcp/wcasp/documents/JN142122_WMO1145_EN_web.pdf (accessed on 27 June 2016).
- Bartholomew, H.; Jin, S. ENSO effects on land skin temperature variations; A global study from satellite remote sensing and NCEP/NCAR reanalysis. Climate 2013, 1, 53–73. [Google Scholar] [CrossRef]
- Davey, M.K.; Brookshaw, A.; Ineson, S. The probability of the impact of ENSO on precipitation and near-surface temperature. Clim. Risk Manag. 2014, 1, 5–24. [Google Scholar] [CrossRef]
- Ibebuchi, C.C. Revisiting the 1992 severe drought episode in South Africa: The role of El Niño in the anomalies of atmospheric circulation types in Africa south of the equator. Theor. Appl. Climatol. 2021, 146, 723–740. [Google Scholar] [CrossRef]
- Mahlalela, P.T.; Blamey, R.C.; Hart, N.C.G.; Reason, C.J.C. Drought in the Eastern Cape region of South Africa and trends in rainfall characteristics. Clim. Dyn. 2020, 55, 2743–2759. [Google Scholar] [CrossRef] [PubMed]
- Mukheibir, P.; Sparks, D. Water Resources Management Strategies in Response to Climate Change in South Africa, Drawing on the Analysis of Coping Strategies Adopted by Vulnerable Communities in the Northern Cape Province of South. Africa in Times of Climate Variability; WRC Report No. 1500/1/06, 398; Water Research Commission: Pretoria, South Africa, 2006. [Google Scholar]
- Banholzersand, D.S. The Influence of different El Niño types on global average temperature. Geophys. Res. Lett. 2014, 41, 2093–2099. [Google Scholar] [CrossRef]
- Cai, W.; Borlace, S.; Lengaigne, M.; van Rensch, P.; Collins, M.; Vecchi, G.; Timmermann, A.; Santoso, A.; McPhaden, M.J.; Wu, L.; et al. Increasing frequency of extreme El Niño events due to greenhouse warming. Nat. Clim. Chang. 2014, 4, 111–116. [Google Scholar] [CrossRef]
- Chowdary, J.S.; John, N.; Gnanaseelan, C. Interannual variability of surface air-temperature over India: Impact of ENSO and Indian Ocean Sea surface temperature. Int. J. Climatol. 2014, 34, 416–429. [Google Scholar] [CrossRef]
- Halpert, M.S.; Ropelewski, C.F. Surface temperature pattern associated with Southern Oscillation. J. Clim. 1992, 5, 577–593. [Google Scholar] [CrossRef]
- Gray, W.M.; Sheaffer, J.D. El Niño and QBO influences on tropical cyclone activity, In Teleconnections Linking Worldwide Climate Anomalies: Scientific Basis and Social Impacts; Glantz, M.H., Katz, R.W., Nicholls, N., Eds.; Cambridge University Press: Cambridge, UK, 1991. [Google Scholar]
- Pinault, J.L. The anticipation of the ENSO: What resonantly forced baroclinic waves can teach us (Part II). J. Mar. Sci. Eng. 2018, 6, 63. [Google Scholar] [CrossRef]
- Reason, C.J.C.; Jagadheesha, D. A model investigation of recent ENSO impacts over southern Africa. Meteorol. Atmos. Phys. 2005, 89, 181–205. [Google Scholar] [CrossRef]
- Basson, M.S. Water development in South Africa. In Proceedings of the UN-Water International Conference, Zaragoza, Spain, 3–5 October 2011; Available online: http://www.un.org/waterforlifedecade/green_economy_2011/pdf/session_1_economic_instruments_south_africa.pdf (accessed on 20 June 2022).
- Basson, M.; Van Rooyen, J. Practical application of probabilistic approaches to the management of water resource systems. J. Hydrol. 2001, 241, 53–61. [Google Scholar] [CrossRef]
- International Water Management Institute (IWMI); Agricultural Research Council (ARC). Limpopo Basin Profile; CGIAR Challenge Program on Water and Food: Pretoria, South Africa, 2003; p. 132. [Google Scholar]
- Mazibuko, S.M.; Mukwada, G.; Moeletsi, M.E. Assessing the frequency of drought/flood severity in the Luvuvhu River catchment, Limpopo Province, South Africa. Water SA 2021, 47, 172–184. [Google Scholar] [CrossRef]
- Mathivha, F.I.; Sigauke, C.; Chikoore, H.; Odiyo, J.O. Short-term and medium-term drought forecasting using generalised additive models. Sustainability 2020, 12, 6. [Google Scholar] [CrossRef]
- Masupha, T.E.; Moeletsi, M.E. Analysis of potential future droughts limiting maize production, in the Luvuvhu River catchment area, South Africa. Phys. Chem. Earth 2018, 105, 44–51. [Google Scholar] [CrossRef]
- Mpandeli, N.S.; Maponya, P.I. Coping with climate variability in Limpopo Province, South Africa. Peak J. Agric. Sci. 2013, 1, 54–64. [Google Scholar]
- Kabanda, T.A. Climatology of Long-Term Drought in the Northern Region of the Limpopo Province of South Africa. Ph.D. Thesis, University of Venda, Thohoyandou, South Africa, 2004. [Google Scholar]
- Tilahun, S.; Demeke, K. The influence of El Niño-induced drought on cyanobacterial community structure in a shallow tropical reservoir (Koka Reservoir, Ethiopia). Aquat. Ecol. 2019, 53, 61–77. [Google Scholar] [CrossRef]
- Ainembabazi, J.H. The 2015-16 El Niño-Induced Drought Crisis in Southern Africa: What Do We Learn from Historical Data? In Proceedings of the 2018 Conference, Vancouver, BC, Canada, 28 July–2 August 2018; International Association of Agricultural Economists: Vancouver, BC, Canada, 2018. [Google Scholar]
- Sprouse, T.W.; Vaughan, L.F. Water Resource Management in Response to El Niño/Southern Oscillation (ENSO) Droughts and Floods. In Climate and Water. Advances in Global Change Research; Diaz, H.F., Morehouse, B.J., Eds.; Springer: Dordrecht, The Netherlands, 2003. [Google Scholar] [CrossRef]
- Naumann, G.; Alfieri, L.; Wyser, K.; Mentaschi, L.; Betts, R.A.; Carrao, H.; Spinoni, J.; Vogt, J.; Feyen, L. Global changes in drought conditions under different levels of warming. Geophys. Res. Lett. 2018, 45, 3285–3296. [Google Scholar] [CrossRef]
- Gizaw, M.S.; Gan, T.Y. Impact of climate change and El Niño episodes on droughts in sub-Saharan Africa. Clim. Dyn. 2017, 49, 665–682. [Google Scholar] [CrossRef]
- Dagada, K. Influence of Climate Change on Flood and Drought Cycles and Implications on Rainy Season Characteristics in Luvuvhu River Catchment, South Africa. Master’s Thesis, University of Venda, Thohoyandou, South Africa, 2016. [Google Scholar]
- Mokgoebo, J.M.; Kabanda, T.A.; Gumbo, J.R. Assessment of the Raparian Vegetation Changes Downstream of Selected Dams in Vhembe District, Limpopo Province Base on Historical Aerial Photography. In Environmental Risks; Mihai, F., Grozavu, A., Eds.; IntechOpen: Rijeka, Croatia, 2018. [Google Scholar] [CrossRef]
- WMO. Standardized Precipitation Index: User Guide; WMO: Geneva, Switzerland, 2012. [Google Scholar]
- Mckee, T.B.; Doesken, N.J.; Kleist, J. The relationship of drought frequency and duration to time scales. In Proceedings of the 8th Conference on Applied Climatology, Anaheim, CA, USA, 17–22 January 1993; pp. 17–22. [Google Scholar]
- Aksoy, H. Use of gamma distribution in hydrological analysis. Turk. J. Eng. Environ. Sci. 2000, 24, 419–428. [Google Scholar]
- Tsakiris, G.; Loukas, A.; Pangalou, D.; Vangelis, H.; Tigkas, D.; Rossi, G.; Cancelliere, A. Drought characterization [Part 1. Components of drought planning. 1.3. Methodological component]. In Drought Management Guidelines Technical Annex; CIHEAM: Zaragoza, Spain, 2007; pp. 85–102. [Google Scholar]
- Shamshirbad, S.; Hashemi, S.; Salimi, H.; Samadianfard, S.; Asadi, E.; Shadkani, S.; Kargar, K.; Mosavi, A.; Nabipour, N.; Chau, K.-W. Predicting Standardised Streamflow Index for Hydrological Drought using machine learning Models. Eng. Appl. Comput. Fluid Mech. 2020, 14, 342–343. [Google Scholar] [CrossRef]
- Tan, C.; Yang, J.; Li, M. Temporal-Spatial variation of drought indicated by SPI and SPEI in Ningxia Hui Autonomous Region, China. Atmosphere 2015, 6, 1399–1421. [Google Scholar] [CrossRef]
- Shah, R.; Bharadiya, N.; Manekar, V. Drought Index Computation Using Standardised Precipitation Index (SPI) method for Surat District, Gujarat. Aquat. Procedia 2015, 4, 1243–1249. [Google Scholar] [CrossRef]
- Guttman, N.B. Accepting the Standardized Precipitation Index: A Calculation Algorithm. J. Am. Water Resour. Assoc. 1999, 35, 311–322. [Google Scholar] [CrossRef]
- Mann, H.B. Non-parametric tests against trend. Econometrica 1945, 13, 245–259. [Google Scholar] [CrossRef]
- Kendall, M.A.; Stuart, A. The Advanced Theory of Statistics, 2nd ed.; Charles Griffin: London, UK, 1967. [Google Scholar]
- Zhang, X.; Lucie, A.V.; Hogg, W.D.; Niitsoo, A. Temperature and precipitation trends in Canada during the 20th century. Atmosphere 2000, 38, 395–429. [Google Scholar] [CrossRef]
- Sneyers, S. On the Statistical Analysis of Series of Observations; Technical note no. 143, WMO No. 725 415; Secretariat of the World Meteorological Organization: Geneva, Switzerland, 1990; p. 192. [Google Scholar]
- Jain, V.K.; Rivera, L.; Zaman, K.; Espos, R.A.; Sirivichayakul, C.; Quiambao, B.P.; Rivera-Medina, D.M.; Kerdpanich, P.; Ceyhan, M.; Ener, C.; et al. Vaccine for prevention of mild and moderate-to-severe influenza in children. N. Engl. J. Med. 2013, 369, 2481–2491. [Google Scholar] [CrossRef]
- Aladwani, J. Wavelet Coherence and Continuous Wavelet Transform-Implementation and Application to the Relationship between Exchange Rate and Oil Price for Importing and Exporting Countries. Int. J. Energy Econ. Policy 2023, 13, 531–541. [Google Scholar] [CrossRef]
- Peng, J.; Qiao, R.; Liu, Y.; Blaschke, T.; Li, S.; Wu, J.; Xu, Z.; Liu, Q. A wavelet coherence approach to prioritizing influencing factors of land surface temperature and associated research scales. Remote Sens. Environ. 2020, 246, 111866. [Google Scholar] [CrossRef]
- Torrence, C.; Compo, G.P. A Practical Guide to Wavelet Analysis: With Significance and Confidence Testing. University of Colorado at Boulder, Program in Atmospheric and Oceanic Sciences. 2011. Available online: https://atoc.colorado.edu/research/wavelets/ (accessed on 29 September 2022).
- Restrepo, J.C.; Higgins, A.; Escobar, J.; Ospino, S.; Hoyos, N. Contribution of low-frequency climatic–oceanic oscillations to streamflow variability in small, coastal rivers of the Sierra Nevada de Santa Marta (Colombia). Hydrol. Earth Syst. Sci. 2019, 23, 2379–2400. [Google Scholar] [CrossRef]
- Baghanam, A.H.; Nourani, V.; Norouzi, E.; Vakili, A.T.; Gökçekuş, H. Application of Wavelet Transform for Bias Correction and Predictor Screening of Climate Data. Sustainability 2023, 15, 15209. [Google Scholar] [CrossRef]
- Grinsted, A.; Moore, J.C.; Jevrejeva, S. Application of the cross wavelet transform and wavelet coherence to geophysical time series. Nonlin. Processes Geophys. 2004, 11, 561–566. [Google Scholar] [CrossRef]
- Torrence, C.; Compo, G.P. A practical guide to wavelet analysis. Bull. Am. Meteorol. Soc. 1998, 79, 61–78. [Google Scholar] [CrossRef]
- Kumar, R.; Musuuza, J.L.; Van Loon, A.F.; Teuling, A.J.; Barthel, R.; Ten Broek, J.; Mai, J.; Samaniego, L.; Attinger, S. Multiscale evaluation of the standardized precipitation index as a groundwater drought indicator. Hydrol. Earth Syst. Sci. 2015, 12, 7405–7436. [Google Scholar] [CrossRef]
- Archer, E.R.M.; Landman, W.A.; Tadross, M.A.; Marumbwa, F.M. Understanding the evolution of 2014–2016 summer rainfall seasons in Southern Africa. Clim. Risk Manag. 2017, 16, 22–28. [Google Scholar] [CrossRef]
- Rojas, O.; Li, Y.; Cumani, R. Understanding the Drought Impact of El Niño on Global Agricultural Areas: An Assessment Using FAO’s Agricultural Stress Index (ASI); FAO: Rome, Italy, 2014; pp. 9–23. [Google Scholar]
- Schober, P.; Boer, C. Correlation Coefficients: Appropriate Use and Interpretation. Anesth. Analg. 2018, 126, 1764–1765. [Google Scholar] [CrossRef]
- Loua, R.T.; Bencherif, H.; Mbatha, N.; Bègue, N.; Hauchecorne, A.; Bamba, Z.; Sivakumar, V. Study on Temporal Variations of Surface Temperature and Rainfall at Conakry Airport, Guinea: 1960–2016. Climate 2019, 7, 93. [Google Scholar] [CrossRef]
- Chang, C.; Glover, G.H. Time-frequency dynamics of resting-state brain connectivity measured with fMRI. NeuroImage 2010, 50, 81–98. [Google Scholar] [CrossRef]
- Tijdeman, E.; Hannaford, J.; Stahl, K. Human influences on streamflow drought characteristics in England and Wales. Hydrol. Earth Syst. Sci. 2018, 22, 1051–1064. [Google Scholar] [CrossRef]
- Van Loon, A.F.; Stahl, K.; Di Baldassarre, G.; Clark, J.; Rangecroft, S.; Wanders, N.; Gleeson, T.; Van Dijk, A.I.J.M.; Tallaksen, L.M.; Hannaford, J.; et al. Drought in a humanmodified world: Reframing drought definitions, understanding, and analysis approaches. Hydrol. Earth Syst. Sci. 2016, 20, 3631–3650. [Google Scholar] [CrossRef]
- Haslinger, K.; Koffler, D.; Schöner, W.; Laaha, G. Exploring the link between meteorological drought and streamflow: Effects of climate-catchment interaction. Water Resour. Res. 2014, 50, 2468–2487. [Google Scholar] [CrossRef]
- Barker, L.J.; Hannaford, J.; Chiverton, A.; Svensson, C. From meteorological to hydrological drought using standardised indicators, Hydrol. Earth Syst. Sci. 2016, 20, 2483–2505. [Google Scholar] [CrossRef]
- Pascale, S.; Kapnick, S.B.; Delworth, T.L.; Cooke, W.F. Increasing risk of another Cape Town “Day Zero” drought in the 21st century. Proc. Natl. Acad. Sci. USA 2020, 117, 29495–29503. [Google Scholar] [CrossRef]
- Saase, R.; Schütt, B.; Bebermeier, W. Analyzing the Dependence of Major Tanks in the Headwaters of the Aruvi Aru Catchment on Precipitation. Applying Drought Indices to Meteorological and Hydrological Data. Water 2020, 12, 2941. [Google Scholar] [CrossRef]
- AghaKouchak, A.; Mirchi, A.; Madani, K.; Di Baldassarre, G.; Nazemi, A.; Alborzi, A.; Anjileli, H.; Azarderakhsh, M.; Chiang, F.; Hassanzadeh, E.; et al. Anthropogenic Drought: Definition, Challenges and Opportunities. Rev. Geophys. 2021, 59, e2019RG000683. [Google Scholar] [CrossRef]
Disclaimer/Publisher’s Note: The statements, opinions and data contained in all publications are solely those of the individual author(s) and contributor(s) and not of MDPI and/or the editor(s). MDPI and/or the editor(s) disclaim responsibility for any injury to people or property resulting from any ideas, methods, instructions or products referred to in the content. |
© 2024 by the authors. Licensee MDPI, Basel, Switzerland. This article is an open access article distributed under the terms and conditions of the Creative Commons Attribution (CC BY) license (https://creativecommons.org/licenses/by/4.0/).