3.1. Simulation Model Performance
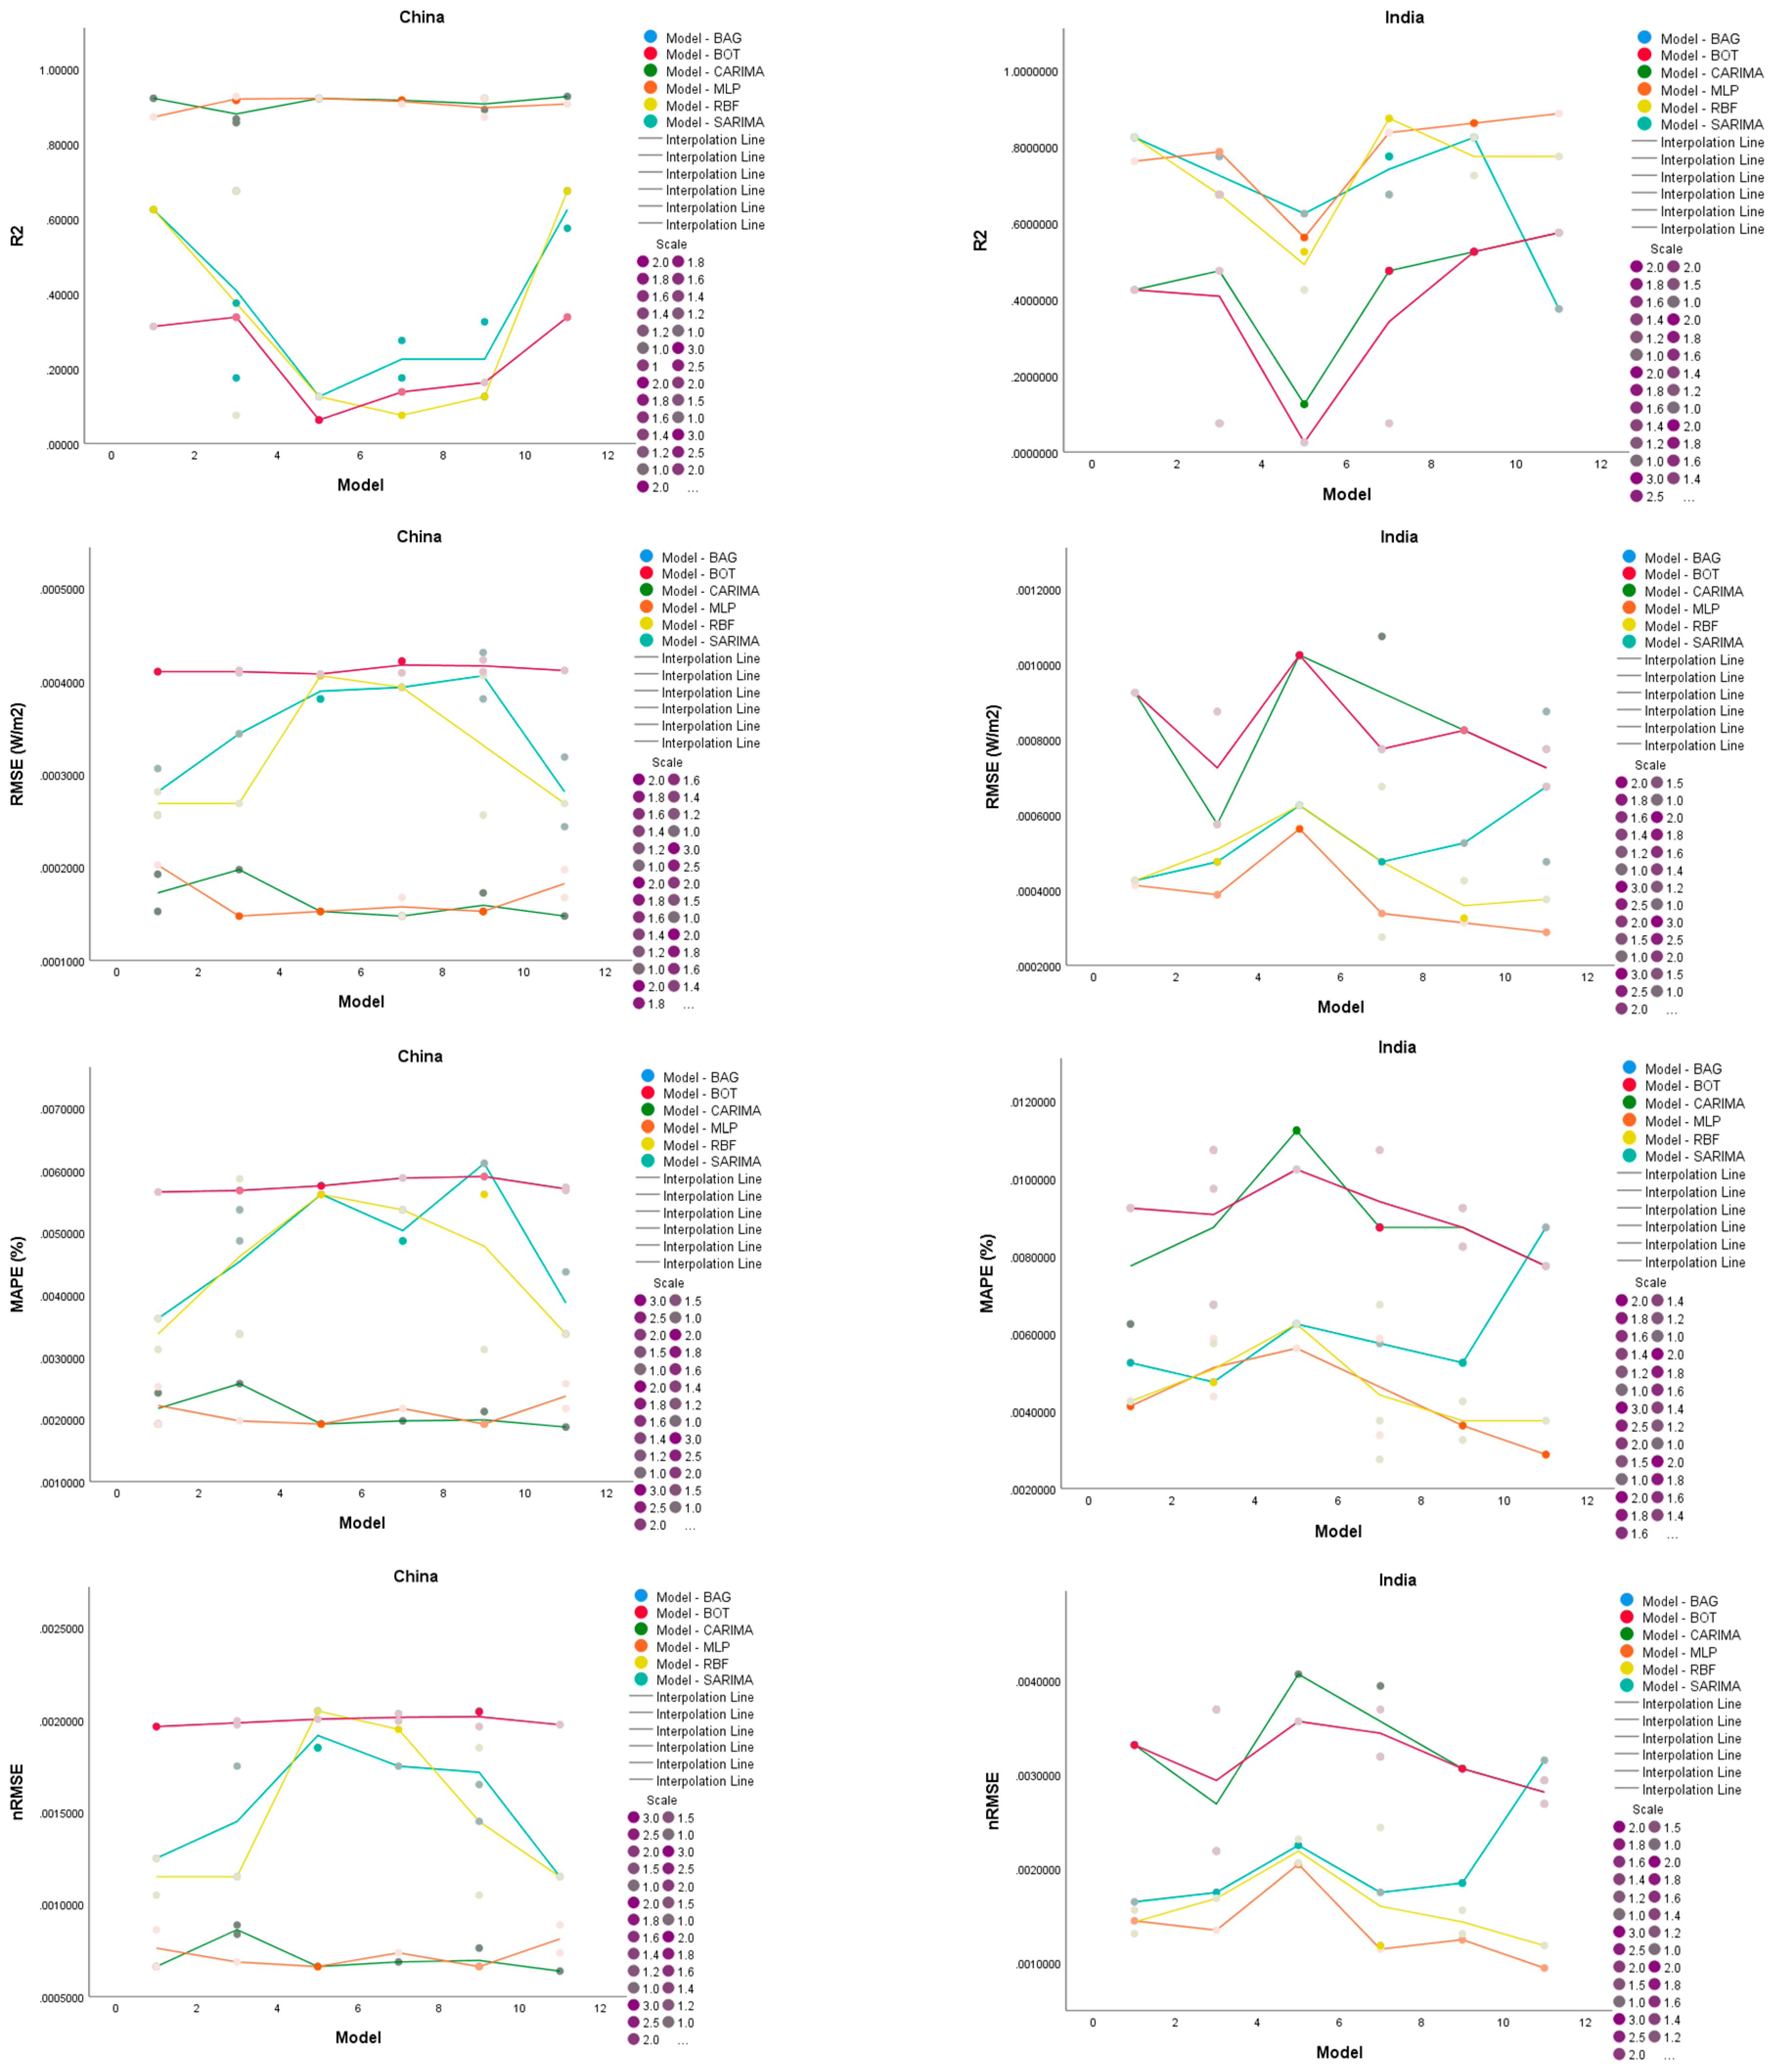
The comprehensive overview of the MLP-CARIMA-LG hybridization approach’s performance is derived from the analysis of four error metrics, as depicted in
Figure 4 and
Table 7. These results offer valuable insights into the effectiveness and efficiency of this innovative approach in addressing complex forecasting challenges. The use of multi-layer perceptron (MLP) combined with the controlled autoregressive integrated moving average (CARIMA) model and the logistic probabilistic approach (LG) presents an innovative approach to forecasting the fraction of absorbed photosynthetically active radiation in China and India, as presented in
Table 8. MLP is a powerful artificial neural network that can effectively capture complex relationships between input variables, while CARIMA is capable of handling time series data by considering both autoregressive and moving average components. By incorporating LG, which provides a probabilistic framework, the forecast model can account for uncertainties and provide confidence intervals for the predicted values. This combination of techniques allows for a more accurate and robust prediction of the fraction of absorbed photosynthetically active radiation in China and India, enabling a better understanding and management of their respective ecosystems.
The results presented in
Table 8 effectively demonstrate the accuracy and reliability of the proposed methodology by showcasing the prediction performance of monthly mean FAPAR productivity. These findings highlight the potential of our innovative approach in accurately estimating FAPAR productivity on a monthly basis. This finding suggests that leveraging the complementary aspects of boosting and bagging can enhance the overall predictive power of ensemble models. Such integration could potentially revolutionize the field of ensemble learning by achieving unprecedented levels of accuracy and robustness. This highlights the potential of incorporating more intricate neural network architectures to enhance the extraction of underlying data patterns. By leveraging the superior performance of MLP over RBF, we can explore the benefits of employing increasingly complex models to achieve even more accurate and comprehensive pattern recognition. The MLP-CARIMA-GPM model demonstrated the highest performance among all machine learning methods, indicating its effectiveness in predicting and analyzing the common impacts of different input combination parameters. This variability in forecasting FAPAR productivity using RH, Tdew, and SVP input parameters across China and India highlights the importance of considering regional climatic conditions and their impact on vegetation growth. By incorporating these factors into predictive models, we can better understand and anticipate variations in FAPAR productivity, enabling more accurate assessments of ecosystem health and potential agricultural yields. The error metrics in
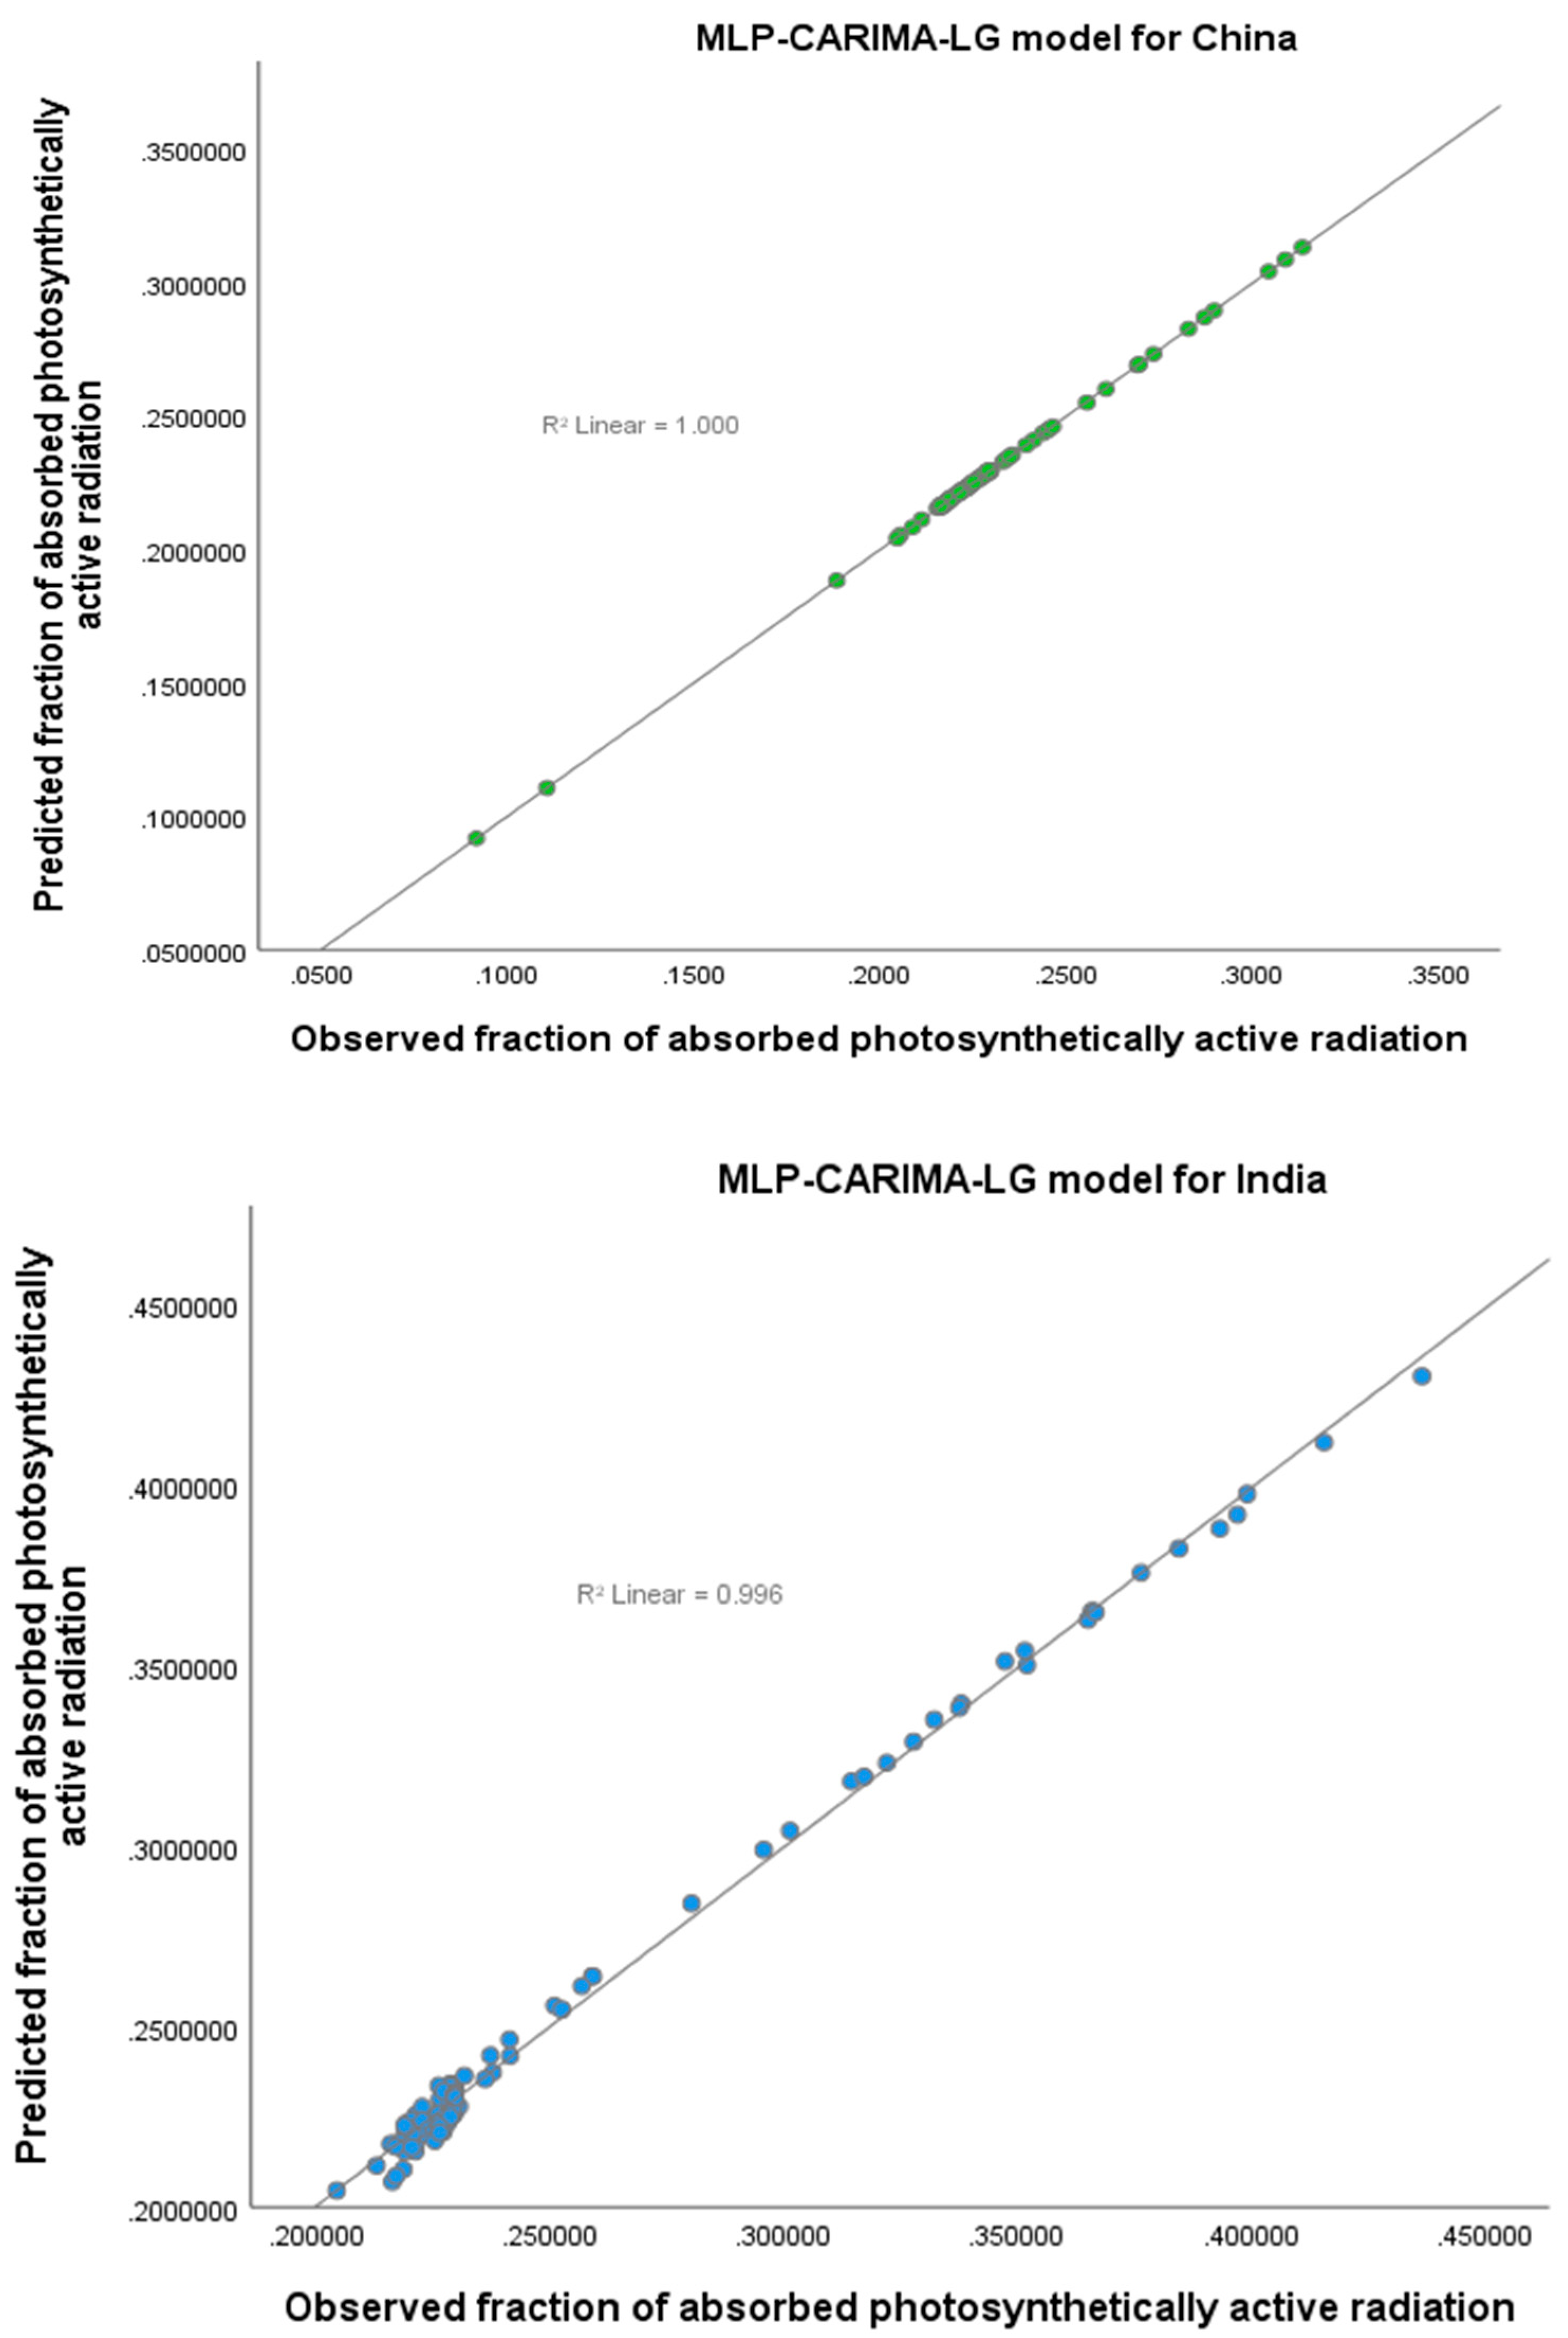
Figure 4 and
Figure 5 revealed that the hybrid-based model MLP-CARIMA-LG, along with the six machine learning models (MLP, RBF, BOO, BAG, CARIMA, and SARIMA), exhibited similar levels of variability. These findings highlight the effectiveness of the MLP-CARIMA-LG model in achieving comparable results to the other machine learning models. These evaluation metrics were chosen to comprehensively assess the effectiveness and accuracy of the seven techniques. The combination of nRMSE, R
2, MAPE, RMSE, and RPE allowed for a holistic understanding of how each input parameter impacted the performance of these techniques. The results demonstrate the superior performance of the hybridized model (MLP-CARIMA-LG) over the other six approaches, as it achieved the highest level of accuracy with respect to R
2 and the lowest level of error in terms of MAPE, RMSE, RPE, and nRMSE. These findings highlight the effectiveness and potential of combining MLP, CARIMA, and logistic probabilistic models to improve predictive accuracy. The hybridized model’s superior predictive performance suggests that the combination of MLP, CARIMA, and the logistic probabilistic model is highly effective in achieving accurate and precise results. This innovative approach showcases the potential for further advancements in predictive modeling techniques. The results indicate that the models from each of the seven approaches consistently demonstrated strong performance across both training and testing categories. These findings are supported by the reliability range of 0.677 < R
2 < 0.999 for R
2, 0.000018 < MAPE < 0.006393 for MAPE, 0.000004 < RMSE < 0.00058 for RMSE, and 0.0000183 < nRMSE < 0.002215 in China and India, as shown in
Table 7 and
Figure 4. The integration of MLP, CARIMA, and the logistic probabilistic model yields a powerful predictive tool, demonstrating exceptional accuracy in outcome forecasting. This groundbreaking approach showcases the immense potential for improved decision-making and planning based on these combined models. The consistency of performance across both training and testing categories further validates the reliability of these models. The bagging and boosting ensemble methods are one exception, which in China provided negative estimations for the evaluation of error measures. Each simulated approach yields a different error measure. The MLP technique demonstrated higher R
2 values for both China and India, ranging from 0.872 to 0.923 and 0.554 to 0.871, indicating a stronger correlation between the predicted and actual values. In contrast, the SARIMA technique yielded lower R
2 values of 0.117 to 0.677% and 0.374 to 0.815% for China and India, suggesting a weaker predictive performance in comparison. The R
2 values for China and India, respectively, varied from 0.857 to 0.925% and 0.117 to 0.677% when utilizing the CARIMA technique. It was shown that the MLP method consistently delivered greater R
2 values for both India and China compared to the SARIMA and CARIMA algorithms. Additionally, for both nations, the R
2 values for the SARIMA method were often lower than those for the CARIMA technique. The small differences between China and India observed in the outputs of the six machine learning algorithms can be attributed to the utilization of identical input configuration parameters. These parameters were specifically designed to capture the diverse geographic and climatic characteristics inherent to both nations. The superior performance of the MLP algorithm is evident from the distinct orange color in the plot’s legend, which represents its exceptional capabilities. This is further supported by
Figure 4, where the error metrics clearly illustrate the effectiveness of input combination models M7–M11 in India and M2–M6 and M8–M9 in China when utilized with the MLP algorithm. In
Table 7, the characteristics and specifications of each model are presented, providing a comprehensive understanding of their differences. The visualization in
Figure 4 highlights the MLP algorithm’s exceptional predictive capabilities, showcasing its superiority over alternative methods. This robust performance further solidifies the algorithm’s reliability and precision in forecasting future outcomes. The superiority of the MLP algorithm over other models in predicting FAPAR productivity in China and India indicates its potential to revolutionize agricultural forecasting. Its exceptional performance showcases the immense value of leveraging artificial intelligence for accurate and efficient crop yield predictions. The MLP algorithm’s ability to accurately predict outcomes in different geographical regions highlights its robustness and versatility. This makes it a valuable tool for various applications beyond FAPAR productivity prediction, such as climate modeling and ecological studies.
The performance of all input combination-based models (M1–M11) was consistently worse in China compared to India. Additionally, the BAG, BOT, RBF, CARIMA, and SARIMA approaches exhibited similar underperformance in China when compared to India. The superior predictive performance of the MLP algorithm was observed in both countries, indicating its effectiveness. This highlights the algorithm’s potential to revolutionize predictive modeling in diverse contexts. MLP’s superior predictive performance suggests that it is a reliable choice for accurately modeling FAPAR productivity in both countries. Its ability to outperform all other combination-based models and algorithm-based approaches further solidifies its recommendation as the top choice for researchers and practitioners in China and India.
A comparison was conducted to determine if the hybrid approach could outperform the standalone MLP algorithm. The results from China and India indicated that the MLP-CARIMA-LG approach indeed yielded superior models, making it a promising choice for predictive modeling in these regions, as shown in
Table 5. These results suggest that the MLP-CARIMA-LG approach has the potential to provide more accurate predictions in both China and India, making it a valuable tool for predictive modeling in these regions, as shown in
Table 5. Additionally, the superior performance of the hybrid model in both training and testing categories indicates its robustness and reliability for future forecasting tasks. This is because the MLP-CARIMA-LG model has been specifically trained and optimized using data from China and India, making it better suited to capture the unique patterns and dynamics of RH, Tdew, and SVP in these regions. Additionally, the model incorporates advanced machine learning techniques and combines them with the CARIMA-LG framework, further enhancing its ability to accurately predict these parameters in China and India. This demonstrates the robustness of the projected datasets, highlighting their ability to accurately capture and predict climate change impacts, making them valuable tools for informed decision-making in a rapidly changing world. The MLP-CARIMA-LG-fitted method demonstrates exceptional accuracy in predicting FAPAR levels in China and India, making it an invaluable tool for informed decision-making in environmental and renewable energy planning. Its application holds great potential for optimizing resource allocation and promoting sustainable development in these regions. No study has been able to use the logistic probabilistic model (LG) and machine learning techniques like CARIMA and MLP to predict solar FAPAR fluxes in China and India with meteorological RH, TDEW, and SVP input combination parameter values. By comparing the performance of the fitted PAR models with that of the evolutionary MLP-CARIMA-LG model, we can gain valuable insights into their respective strengths and weaknesses. This comparative analysis will enable us to make informed decisions regarding the most effective model for predicting future trends and patterns. By combining multiple algorithms and leveraging their strengths, these models can now be tested using a diverse range of hybridization techniques, leading to enhanced performance and accuracy. By comparing the effectiveness of combining multiple algorithms for predicting solar FAPAR fluxes in China and India, valuable insights can be gained. This analysis will shed light on the potential benefits and limitations of utilizing various algorithms for accurately forecasting solar FAPAR fluxes in these two countries. It will help determine if the hybridization of the MLP-CARIMA-LG model can improve the accuracy of predictions compared to using a single algorithm. The superior performance of the proposed hybridized MLP-CARIMA-LG algorithm, as evidenced by its highest R
2 value and lowest RMSE error metrics, highlights its potential to revolutionize predictive modeling in various fields. Its innovative combination of MLP, CARIMA, and LG techniques sets a new benchmark for accuracy and efficiency in algorithmic predictions. The MLP-CARIMA-LG model, proposed as an alternative to the empirical model by Akitsu et al. [
31], outperformed their approach by achieving a higher R
2 value of 0.845 and a lower RMSE value of 0.0082 in the same location of Tateno, Japan. This innovative model combines multiple advanced techniques to enhance accuracy and predictive capabilities in PAR estimation. The MLP-CARIMA-LG model achieved a higher R
2 value of 0.996 in India and 0.999 in China and a lower RMSE value of 0.00008 in India and 0.0000041 in China, indicating its superior performance compared to the empirical model. This suggests that incorporating additional variables and utilizing advanced machine learning techniques can improve the accuracy of solar radiation prediction models.
The proposed MLP-CARIMA-LG performed better than the multivariate regression models fitted by Garcia-Rodriguez et al. [
32] at Soux Falls, South Dakota, USA [
33], and Burgos, Spain. This further validates the better performance of the MLP-CARIMA-LG model by showing its efficacy in various geographical contexts. Furthermore, as compared to conventional regression models, modern machine learning approaches may be included in FAPAR prediction models to produce more accurate and trustworthy findings.
The results obtained from the empirically established model by Foyo-Moreno et al. [
34] demonstrated superior accuracy and performance metrics for Granda, Spain, with R
2 values of 0.994 and 0.993, as well as error metrics of 0.047 W/m
2 and 0.050 W/m
2, respectively. Conversely, the proposed hybrid model exhibited exceptional performance in China and India, yielding an impressive R
2 value of 0.999 and a narrow RMSE value of 0.0002–0.0061 W/m
2.
These results suggest that the proposed hybrid model outperforms the empirically established model in terms of accuracy and precision as expected from the literature standpoint [
35,
36,
37,
38]. This highlights the potential benefits of incorporating modern machine learning approaches into FAPAR prediction models However, Wang et al.’s multilinear regression model showed a high level of accuracy in predicting the variables in Changbaishan, China [
35]. Despite its slightly lower performance compared to the recommended MLP-CARIMA-LG model, it still demonstrated strong predictive capabilities with an R
2 value of 0.985 and an RMSE value of 0.1330. These findings indicate that the multilinear regression model may not be as effective as the proposed MLP-CARIMA-LG model for FAPAR prediction in Changbaishan, China.
The hybridization of sustainable machine learning and numerical models in this study demonstrated a superior performance compared to leading empirical multilinear regression models for assessing PAR potential in Burgos, Spain [
32]. This innovative approach not only showcased the effectiveness of combining different methodologies but also highlighted the potential for more accurate predictions in similar environmental studies. This study highlights the importance of incorporating advanced numerical models and sustainable practices in improving the accuracy of environmental predictions. These reports have consistently shown the effectiveness of empirical and multilinear regression in accurately predicting PAR [
20] and solar radiation across various regions, climates, and geographical locations [
39]. The extensive range of studies conducted in different areas, such as Africa, Australia, Algeria, Nigeria, and Pakistan [
40], further strengthens the validity and reliability of these predictive models. These studies have consistently shown that empirical multilinear regression models are effective in accurately predicting PAR potential in various geographic locations and climates. Furthermore, the wide range of regions covered by these studies demonstrates the versatility and applicability of these models in different contexts. The MLP-CARIMA-LG model offers a more comprehensive and accurate assessment of solar FAPAR fluxes by incorporating the complexities of global sustainability, global warming, and climate change. Its ability to align with SDG prescriptions and requirements ensures a holistic approach towards quantifying the potential of solar FAPAR fluxes in the current era. The MLP-CARIMA-LG model incorporates advanced machine learning techniques and time series analysis to accurately predict solar FAPAR fluxes. By considering the complex interplay between various environmental factors and their impact on FAPAR, this model offers a more comprehensive understanding of the changing dynamics in the context of sustainable development goals and climate change mitigation strategies. This breakthrough model demonstrates superior performance compared to previous studies that have employed machine learning and hybridization techniques for FAPAR flux prediction. Its MLP-CARIMA-LG framework surpasses all existing approaches, setting a new benchmark in accurately forecasting FAPAR fluxes. This model combines the strengths of multiple techniques, such as multilayer perceptron (MLP), composite autoregressive integrated moving average (CARIMA), and local–global (LG) modeling. The superior performance of this model highlights its potential for supporting decision-making processes in various sectors, including agriculture, forestry, and land management.
The high R
2 values obtained by Wang et al. [
41] demonstrate the accuracy and reliability of the MLP, GRNN, and RBNN models in capturing the complex dynamics of diverse Chinese ecosystems. The low RMSE values indicate the models’ ability to closely estimate solar radiation with minimal error. These findings are consistent with those reported by Ferrera-Cobbs et al. [
42], who observed similar ranges for R
2 and RMSE values, further validating the robustness of these models
These findings suggest that the MLP, GRNN, and RBNN models are highly accurate in predicting FAPAR fluxes in diverse Chinese ecosystems. The R2 values indicate a strong correlation between the predicted and observed values, while the low RMSE values indicate minimal errors in the predictions. These results further validate the potential of these models for decision-making processes in various sectors, such as agriculture, forestry, and land management. These results suggest that the MLP-CARIMA-LG model could be a valuable tool for accurately forecasting solar FAPAR fluxes in various environmental conditions. The use of commonly measured RH, Tdew, and SVP input parameters makes this model easily applicable and accessible for researchers and practitioners in the field. The new prediction method used in this study is therefore crucial for mapping the monthly mean prediction of solar FAPAR fluxes in China and India and represents a new area of investigation for global research. This study opens up opportunities for further research on the impact of solar FAPAR fluxes on vegetation growth and ecosystem dynamics in these regions. The findings of this study can inform policymakers and land managers to make informed decisions regarding land use planning and agricultural practices to optimize vegetation productivity.
3.2. Climate Variability’s Impacts on Shifts in FAPAR Efficiency
3.2.1. Impacts of Climate Modification on Shifts of FAPAR from the Interpolated Line Graphs
Modifications in vegetation patterns and productivity are effects of climate change on shifts in FAPAR, as seen in the interpolated line graphs. Climate modification can lead to alterations in temperature and precipitation patterns, which directly affect the availability of water and nutrients for plants. These changes can result in shifts in the distribution and abundance of different plant species, ultimately impacting the overall FAPAR values observed in interpolated line graphs. Climate modification can also influence the timing of phenological events, such as flowering and leaf senescence, further contributing to variations in FAPAR values over time.
The overlay line plots in
Figure 6 demonstrate that, in general, changes in the FAPAR are anticipated to decrease on an annual basis, in all seasons, and for various shared socio-economic pathways (SSPs) emission scenarios in China and India, with the exception of boreal autumn (SON), which reported a significant but slight increase in India. This suggests that the overall trend in FAPAR changes is towards a decrease, indicating potential challenges for vegetation growth and productivity in these regions. However, the slight increase observed in boreal autumn in India may be attributed to specific environmental factors that favor vegetation growth during this season. In general, the declining trend in FAPAR is alarming because it denotes a decline in ecosystem productivity and carbon uptake, which can have significant effects on the global carbon cycle and climate change. This decline in FAPAR can lead to reduced food production and ecosystem services, posing a threat to both human livelihoods and biodiversity conservation efforts. The decrease in vegetation growth may also exacerbate the impacts of climate change by reducing the capacity of plants to sequester carbon dioxide from the atmosphere. Putting into practice reforestation and afforestation projects, which could increase plant cover and improve carbon absorption, might be a good choice. These projects have the potential to not only mitigate the effects of climate change but also enhance biodiversity and provide additional ecosystem services. Additionally, promoting sustainable land management practices and implementing policies that prioritize conservation and restoration efforts can further contribute to reversing the decline in vegetation growth and ensuring long-term environmental sustainability.
The R2 values ranged from 0.554 to 0.871 for India and 0.872 to 0.923 for China when using the MLP algorithm; 0.374 to 0.815% for India and 0.089 to 0.695 for China when using the SARIMA algorithm; 0.117 to 0.677% for India and 0.857 to 0.925% for China when using the CARIMA algorithm; and 0.069 to 0.678% for India and 0.073 to 0.333% for China when using both bagging and boosting. The same pattern was observed when RMSE, MAPE, nRMSE, and RPE error metrics were considered using different algorithms. FAPAR is predicted to decline rapidly in both China and India under the best-case emission scenario, moderately under the moderate-case emission scenario, and hardly under the worst-case emission scenario. This decline is primarily due to the increased frequency and intensity of extreme weather events, such as heatwaves and droughts, and rapid urbanization and industrialization in both countries. However, India’s FAPAR potential reduction is expected to be less than China’s, especially when compared to the worst-case and moderate-case emission scenarios. India has implemented policies and initiatives to promote sustainable development and reduce emissions, and its larger proportion of rural areas with higher vegetation cover can help mitigate the decline in FAPAR compared to China’s predominantly urban landscape. For instance, between 2020 and the year 2099 in China during the boreal winter (DJF) season, the FAPAR potential is predicted to decrease from 3.0% under the best-case emission scenario. The FAPAR potential for India is expected to drop from 0.01 to 7.5 in the best-case emission scenario, on the other hand. This indicates that India’s FAPAR potential is more vulnerable to declining, highlighting the need for effective measures to preserve and enhance vegetation cover in India’s rural areas. The differences in FAPAR potential between the two countries could have significant implications for ecosystem health, agricultural productivity, and overall climate resilience.
The decline in FAPAR potential, a key indicator of vegetation productivity, could significantly impact agriculture and food security in China and India. This decline could lead to decreased agricultural yields and negatively affect food security. FAPAR potential can also serve as an early warning signal for climate-related hazards, enabling timely interventions to mitigate their impact on food production. Investing in monitoring and improving FAPAR potential could ensure food security and resilience in these populous countries. India’s FAPAR potential is predicted to increase photosynthetic productivity slightly from 2015 to the end of the century, with a range of 4.5 to 7% during boreal autumn and 1.2% to 11.8% during summer. China’s photosynthetically absorbed radiation is expected to decrease rapidly from 2060 to the end of the century, with a range of 0.1 to 1.1% for boreal autumn and 0.1% to 1.8% for boreal summer. These trends are expected to occur annually in boreal winter and spring, highlighting the need for sustainable land management practices and investments in alternative food sources. Further research is needed to understand the underlying causes and potential mitigation strategies. The findings also show that if the warming of the Earth’s circulation system is kept at 1.5 °C by the end of this century, changes in the potential of the photosynthetically absorbed fraction in China are expected to climb by 0.027% to 0.631%. These changes in FAPAR could have significant implications for China’s agricultural productivity and carbon sequestration capabilities. It is crucial for policymakers to consider these findings when developing strategies to mitigate and adapt to climate change in the region.
The R2 values ranged from 0.554 to 0.871 for India and 0.872 to 0.923 for China when using the MLP algorithm; 0.374 to 0.815% for India and 0.089 to 0.695 for China when using the SARIMA algorithm; 0.117 to 0.677% for India and 0.857 to 0.925% for China when using the CARIMA algorithm; and 0.069 to 0.678% for India and 0.073 to 0.333% for China when using both bagging and boosting. The same pattern was observed when RMSE, MAPE, nRMSE, and RPE error metrics were considered using different potential values of China’s photosynthetically absorbed fraction, which could decrease by 0.015 to 2.28% if the Earth’s temperature rises above 1.5 °C. To maintain this potential, global warming must be kept below 1.5 °C. Failure to do so could lead to a drop in this potential, affecting ecosystem health and food security. The carbon cycle relies on this photosynthetically absorbed portion, and its decrease could accelerate global warming. Therefore, immediate action is needed to reduce greenhouse gas emissions and prevent permanent harm to the ecosystem. Taking immediate action to reduce greenhouse gas emissions is crucial to preventing permanent harm to the ecosystem. If global warming exceeds 1.5 °C, there is a risk of a drop in the fraction, which could decrease by 0.015 to 2.28%. This would have detrimental effects on ecosystem health and food security, as the carbon cycle heavily relies on this photosynthetically absorbed portion. Thus, it is imperative to keep global warming below 1.5 °C to maintain this potential and preserve the delicate balance of the ecosystem. Additionally, exceeding this temperature threshold could lead to the loss of crucial habitats, such as coral reefs and polar ice caps, further disrupting the biodiversity and stability of ecosystems worldwide. Therefore, implementing sustainable practices and transitioning to renewable energy sources are necessary steps to mitigate the harmful effects of climate change and safeguard the ecosystem for future generations. If the Earth’s circulation system is preserved at 1.5 °C by the end of this century, global warming might have a considerable influence on India’s FAPAR fluxes. If global warming exceeds 1.5 °C, India’s potential changes in photosynthetically absorbed fraction fluxes could decrease by 0.592 to 4.478%. This underscores the need for immediate action to reduce greenhouse gas emissions and mitigate climate change effects. India’s agriculture sector is highly vulnerable to climate change, and any disruption could have severe consequences for food security. Therefore, prioritizing climate action and implementing sustainable agricultural practices are crucial for a secure future for the sector. The impacts of climate change on India’s agriculture sector could extend beyond food security, affecting livelihoods and economic stability. It is imperative for policymakers to recognize the urgency of addressing these challenges and allocate resources towards adaptation and resilience-building measures in the agricultural industry. Climate change has been found to have significant impacts on the variations in the fraction of absorbed photosynthetically active radiation (FAPAR). These impacts can be observed through changes in vegetation growth, as climate change alters temperature and precipitation patterns, leading to shifts in plant phenology and productivity. Additionally, studies have shown that rising atmospheric CO2 levels can directly affect FAPAR by influencing plant physiology and altering leaf structures. These changes in vegetation growth and FAPAR can have cascading effects on ecosystems, such as changes in species composition and biodiversity. The alterations in FAPAR can also impact carbon cycling and the global carbon balance, as vegetation plays a crucial role in absorbing and storing carbon dioxide from the atmosphere. The changes in FAPAR can also lead to shifts in the timing and duration of plant growth, which can have implications for agricultural productivity and food security. Moreover, the alterations in FAPAR can affect ecosystem services such as water regulation and soil erosion control, further highlighting the importance of understanding and monitoring these changes in order to mitigate their potential impacts on both natural and human systems.
3.2.2. Implications of Climate Shifts on FAPAR Modifications during Various Overlapping Times
Table 9 shows the percentage changes in FAPAR for the near future (2015–2049), the far future (2050–2099), and the full future (2015–2099) for a number of common socio-economic routes in China and India (SSP 126, SSP 245, and SSP 585). These changes are compared to the historic era of 1984–2014. India had significantly higher FAPAR productivity values for growing than for falling productivity for each of the three sequencing periods, on a yearly basis, and for all four seasons. This suggests that India’s FAPAR productivity is expected to increase in the near future, far future, and full future compared to the historic era. The higher values for growing productivity indicate a positive trend in vegetation growth in India. India consistently outperformed China in terms of improved productivity across all four seasons, on an annual basis, and during the three sequencing periods. This was observed not only under the best-case scenario (SSP 126) but also across all emission scenarios. China’s competitors, on the other hand, experienced declining values for changes in FAPAR fluxes, further highlighting India’s superior performance in generating higher values of improved productivity. India may be better able to adapt to the effects of climate change and maintain agricultural productivity, despite facing difficulties in this area. India should expect mixed results in future scenarios under the best-case scenario, with a significant increase in FAPAR productivity of 0.002 to 0.281%. During the early stages of this century (2015–2040), there was a decrease of 0.512 to 4.670% in FAPAR productivity during the far-future sequencing period (2050–2099). However, China’s FAPAR productivity is predicted to decline in all seasons, sequencing periods, and scenarios under the best-case and worst-case scenarios. This highlights the varying impacts of climate change on different regions, with India potentially experiencing both positive and negative effects, while China is expected to see a consistent decrease in FAPAR. These findings suggest that India may have some resilience to climate change, as it is projected to experience both positive and negative effects on FAPAR productivity. On the other hand, China’s consistent decrease in FAPAR productivity across all scenarios indicates a more vulnerable situation in terms of climate change impacts. These divergent outcomes emphasize the importance of region-specific strategies for adapting to and mitigating the effects of climate change. India experienced an increase in FAPAR productivity under moderate- and worst-case scenarios, but it is expected that climate change impacts will cause decreases more frequently than increases in China. This suggests that India may be better suited to deal with climate change effects on vegetation productivity than China. The agricultural sector in India could benefit from climate change scenarios where a rise in FAPAR productivity could improve crop growth conditions and mitigate climate change effects. India’s subtropical location, where climate change is expected to increase atmospheric water vapor, is likely the cause of this. In contrast, China’s climate change projections indicate a higher likelihood of decreased FAPAR productivity, which could negatively impact its agricultural sector. This difference in vegetation productivity response between the two countries highlights the importance of considering regional variations when addressing climate change impacts on agriculture. Additionally, India’s geographical diversity and extensive irrigation systems may further contribute to its potential resilience in managing climate change effects on vegetation productivity. In a changing climate, India’s agricultural sector may benefit from higher photosynthetically active radiation productivity because it has easier access to moisture and can produce more FAPAR than China, where the effects of climate change are more pronounced. This contrasts with other regions experiencing decreased FAPAR productivity, highlighting the need for sustainable practices and mitigating measures to mitigate climate change’s negative effects on agricultural production and food security. Implementing sustainable agricultural practices and investing in climate change mitigation measures will be crucial for India to harness the potential benefits of higher photosynthetically active radiation productivity. By prioritizing these measures, India can ensure long-term food security and resilience in the face of a changing climate while also setting an example for other regions grappling with decreased FAPAR productivity. Climate change could lead to a decline in FAPAR productivity, lowering food production and potentially causing a crisis in food production and an increase in the risk of hunger and malnutrition among the population. This highlights the urgent need for China to implement effective measures to mitigate the effects of climate change on its food industry, such as investing in sustainable agriculture and reducing greenhouse gas emissions. Failure to do so could have severe consequences for both the economy and public health. The Chinese government must take immediate action to mitigate the effects of climate change on agriculture, such as investing in sustainable farming practices and developing drought-resistant crops, to ensure food security for its citizens. Implementing these measures would not only help to reduce the impact of climate change on the food industry but also contribute to the overall sustainability and resilience of China’s agricultural sector. By prioritizing these actions, the government can safeguard the livelihoods of farmers, maintain a stable food supply, and protect the health and well-being of its population in the face of changing climatic conditions.
3.3. Influences of Climate Modifications (CLC), Urbanization (URE) and the Photosynthetic Residual Factor (PRF) on Modifications in FAPAR
To differentiate between the proportional contributions of climate change, urban expansion, the FAPAR residual factor (PRF), and changes in the potential FAPAR output, the team established a relationship between these three variables.
Table 10 offers a more accurate and neutral portrayal of the effects of each parameter. The analysis in
Table 10 reveals that the impact of urban growth on FAPAR productivity was consistently higher than that of climatic change across different scenarios and time periods. This suggests that addressing urbanization should be a priority in efforts to mitigate the decline in FAPAR productivity. The analysis shows that the effects of urban growth on FAPAR productivity remained significant even when considering different scenarios and time periods. This highlights the urgent need to implement measures that effectively manage urbanization and its impact on FAPAR productivity in order to sustainably address the decline in vegetation health.
3.3.1. Impacts of Urbanization on Modifications in FAPAR under Different Conditions
The influence of urban expansion on the fraction of absorbed photosynthetically active radiation (FAPAR) can be explained by the alteration of land cover and the introduction of artificial structures. As cities expand, natural vegetation is often replaced by impervious surfaces such as buildings, roads, and parking lots. These surfaces absorb and reflect more solar radiation compared to vegetation, leading to a decrease in FAPAR as less sunlight is available for photosynthesis. Urban areas may experience increased air pollution and heat islands, which can further impact FAPAR. Air pollution from industrial activities and vehicle emissions can deposit pollutants on leaves, reducing their ability to absorb sunlight and carry out photosynthesis. The heat generated by urban infrastructure like buildings and pavements can create urban heat islands, causing higher temperatures that can stress plants and decrease their photosynthetic activity. These factors can lead to a decrease in FAPAR, as plants may struggle to receive sufficient sunlight and energy for photosynthesis. The combination of air pollution and urban heat islands can create unfavorable conditions for plant growth and development, ultimately affecting the overall health and productivity of urban vegetation. In addition, the reduced FAPAR and compromised plant health in urban areas can also have cascading effects on local ecosystems, such as a decline in biodiversity and disruption of ecological processes. Increased temperatures and air pollution can exacerbate respiratory issues in humans, further highlighting the importance of mitigating urban heat islands and improving air quality for both plant and human well-being. The decline in urban vegetation can also lead to increased stormwater runoff and decreased water quality, as plants play a crucial role in absorbing and filtering rainwater. This can further impact aquatic ecosystems and contribute to flooding in urban areas. Therefore, implementing strategies to promote and maintain healthy urban vegetation is essential for the overall sustainability and resilience of cities.
Urban expansion in China and India has had varying impacts on the fraction of absorbed photosynthetically active radiation (FAPAR). In China, rapid urbanization has led to extensive land cover changes, resulting in the loss of vegetation and a decrease in FAPAR. This is primarily due to the conversion of green spaces into built-up areas, reducing the overall surface area available for photosynthesis. In contrast, India’s urban expansion has also resulted in land cover changes, but the impact on FAPAR has been more mixed. While some areas have experienced a decrease in FAPAR due to similar reasons as China, other regions have seen an increase in FAPAR. This could be attributed to the implementation of green infrastructure initiatives and urban greening projects, which have helped to mitigate the loss of vegetation and promote photosynthesis in urban areas.
On the other hand, in India, urban expansion has been accompanied by efforts to promote green infrastructure and increase urban green spaces. These initiatives have helped to mitigate the loss of vegetation and maintain a higher fraction of absorbed photosynthetically active radiation. The implementation of sustainable urban planning practices in India has also contributed to the preservation of natural habitats and the protection of existing vegetation, further enhancing FAPAR levels. These sustainable urban planning practices in India include the establishment of protected areas and wildlife corridors within cities, ensuring the conservation of biodiversity. The integration of green roofs and vertical gardens in urban development projects has not only increased FAPAR levels but also improved air quality and reduced urban heat island effects. However, China’s approach to sustainable urban planning differs in some aspects. While they also prioritize the protection of natural habitats and vegetation, their focus is more on creating eco-cities that are self-sufficient in terms of energy and resources. This includes the implementation of renewable energy systems, such as solar and wind power, and the promotion of green transportation options like electric vehicles. China has been investing heavily in green infrastructure projects, such as greenways and urban parks, to enhance the habitability and sustainability of their cities. These efforts not only provide recreational spaces for residents but also contribute to improving air quality and mitigating the effects of climate change. China’s commitment to sustainable urban development is evident in their adoption of green building practices and the integration of nature-based solutions, such as green roofs and vertical gardens, into their urban landscapes.
Urbanization increased emissions in China by 45.26%, 47.75%, 47.10%, and 46.70%, respectively, in the best-case scenario (SSP 126), the moderate-case scenario (SSP 245), the worst-case emissions scenario (SSP 585), and the overall case emission scenarios. It supplied various contributions to India, totaling 33.95%, 44.61%, 37.72%, and 38.76%. These findings highlight the significant impact of urbanization on emissions in both China and India. The varying percentages indicate that the level of urbanization plays a crucial role in determining the extent of emissions. These data highlight the significant role of urban expansion in contributing to China’s emissions across various scenarios. Despite China’s rapid urbanization, it is interesting to note that India, with a moderate level of urbanization, also makes substantial contributions to emissions. These data suggest that urban expansion plays a significant role in both China and India’s emissions. However, the varying levels of urbanization between the two countries indicate that China’s higher contribution to emissions can be attributed to its more rapid urbanization compared to India. China’s higher contribution of urban expansion to emissions can be attributed to its rapid urbanization, which has led to increased energy consumption and industrial activities. On the other hand, India’s moderate level of urbanization suggests that its emissions from urban expansion are comparatively lower, indicating a different trajectory in terms of development and environmental impact [
43].
Given the current rate of urbanization and growth in both countries toward the end of this century, it is clear from
Table 10 that urban growth may have had a significant impact on potential photosynthetic productivity in both China [
44] and India. Future innovations are probably going to continue in this direction. Both China and India have had large increases in urban growth over the past two decades, with China seeing a bigger proportional contribution due to its quicker rate of urbanization and expansion [
45]. The reports gathered for this study for China and India are consistent with those found in the literature.
According to research by Zhong et al. [
43], China’s urbanization has resulted in a dramatic decline in FAPAR vegetation. The study found that between 2000 and 2015, FAPAR decreased by 6.4% in urban areas of China. In contrast, a study by Chakraborty et al. [
46] highlights that urban expansion in India has resulted in a relatively smaller decrease of only 2.1% in FAPAR compared to China between 2000 and 2015. The study suggests that this difference could be attributed to variations in urban planning and land use policies between the two countries. Chakraborty et al. [
46] emphasizes the importance of implementing sustainable urban development strategies in India to mitigate the negative impacts of urban expansion on vegetation and ecosystem services.
In a study conducted by Yang et al. [
47], it was found that urban expansion in China has led to a significant decrease in FAPAR due to increased surface sealing and reduced vegetation cover. This decline in FAPAR has resulted in decreased ecosystem productivity and biodiversity loss. On the other hand, a study by Chakraborty et al. [
46] highlights that urban expansion in India has also led to a reduction in FAPAR, but the impact on ecosystem productivity and biodiversity loss is not as pronounced as in China. This difference may be attributed to different urban planning strategies and land management practices in the two countries. Chakraborty et al. [
46] suggest that the implementation of green infrastructure and urban greening initiatives can help mitigate the negative effects of urban expansion on FAPAR in India.
A study by Guan et al. [
48] found that urban expansion in China has led to a significant decrease in FAPAR, indicating a decline in vegetation productivity. In contrast, a study by Chakraborty et al. [
46] observed a less pronounced impact of urban expansion on FAPAR in India, suggesting that land use policies and urban planning strategies may have been more effective in preserving vegetation and ecosystem services. These findings highlight the need for further research to understand the specific factors contributing to the differing impacts of urban expansion on vegetation productivity in different regions. Factors such as population density, infrastructure development, and land management practices could play a crucial role in determining the extent of vegetation decline. Studying the long-term effects of urban expansion on ecosystem services like air quality, water regulation, and biodiversity conservation would provide valuable insights for sustainable urban planning and development.
In contrast to India, studies have shown that urban expansion in China has had a more significant impact on FAPAR. For example, Guan et al. [
48] found that FAPAR in urban areas of China decreased by 17% due to urban expansion. Similarly, Jiao et al. [
49] reported a decline of 12% in FAPAR in highly urbanized regions of China. These findings suggest that the impact of urban expansion on FAPAR in China is more pronounced compared to India. This could be attributed to various factors, such as the rapid pace of urbanization and the extensive use of land for infrastructure development in China. Understanding these differences can provide valuable insights for sustainable urban planning and development in both countries, helping policymakers make informed decisions to mitigate the negative effects of urban expansion on vegetation and promote greener cities.
Urbanization and expansion in these nations are predicted to continue to have a considerable influence on photosynthetic productivity in the future. But it is crucial to take into account any potential environmental harm that urbanization can do and to use sustainable development techniques. The development of green infrastructure, such as parks and green roofs, as well as the encouragement of mass transit, might be some of these strategies to lower emissions from automobiles. Incorporating renewable energy sources into urban development might also lessen the adverse environmental consequences of urbanization. Cities can also implement policies to encourage sustainable practices among residents and businesses, such as recycling programs and energy-efficient building codes. Urban planning that prioritizes walkability and bikeability can reduce the need for cars and promote healthier lifestyles. Implementing policies that encourage sustainable practices in urban areas can also lead to improved public health and quality of life for residents, as well as economic benefits through job creation and increased property values. These measures can help create more resilient and habitable cities for future generations.
In our earlier paper, ref. [
50], we provide a thorough description of the effects of PAR on urban expansion (URE). We discuss the potential implications of these effects on urban ecosystems and emphasize the need for effective mitigation strategies to maintain ecological balance in rapidly expanding urban areas. Given that the effects of urban expansion on FAPAR and PAR are likely to be similar, we propose that our findings on PAR can also be applied to understand the impact of urban expansion on FAPAR. Additionally, by examining the relationship between urban expansion and FAPAR, we can gain insights into the potential consequences of climate change and urbanization on vegetation health and productivity. Understanding the impact of urban expansion on FAPAR is crucial for developing effective mitigation strategies. By analyzing the relationship between urbanization and FAPAR, we can identify areas where vegetation health and productivity are most at risk. This knowledge can guide urban planning and conservation efforts to ensure ecological balance is maintained in rapidly expanding urban areas, minimizing the negative effects of climate change and urbanization on vegetation.
3.3.2. Impacts of Climate Modification on Changes in FAPAR under Different Conditions
The impacts of climate change on the fraction of absorbed photosynthetically active radiation (FAPAR) can be explained through the lens of altered vegetation dynamics. As climate patterns shift and temperatures rise, certain plant species may struggle to adapt, leading to changes in their distribution and abundance. This can result in variations in FAPAR, as different plants have varying abilities to efficiently absorb and utilize sunlight for photosynthesis. Climate change-induced extreme weather events such as droughts or heatwaves can directly damage vegetation, further impacting FAPAR. Droughts can cause water stress in plants, leading to reduced leaf area and lower FAPAR values. Similarly, heatwaves can increase the rate of evapotranspiration [
51], drying out the soil and reducing plant productivity, ultimately affecting FAPAR. These climate-induced extreme events can have cascading effects on ecosystems and alter the overall functioning of vegetation, highlighting the complex relationship between climate change and FAPAR. In addition to direct damage to vegetation, extreme weather events such as hurricanes and storms can also uproot trees and disrupt the canopy structure, leading to a decrease in FAPAR.
Prolonged periods of extreme heat can exacerbate the occurrence of wildfires, which not only destroy vegetation but also release large amounts of carbon dioxide into the atmosphere, further contributing to climate change. These interconnected processes highlight the importance of understanding and mitigating the impacts of climate-induced extreme events on FAPAR and ecosystem functioning. Climate-induced extreme events such as storms and wildfires can also have cascading effects on other aspects of ecosystem functioning. For example, the loss of vegetation due to these events can lead to soil erosion and reduced water retention capacity, affecting the availability of nutrients for plant growth. The disruption of the canopy structure can alter microclimate conditions, impacting the habitat suitability for various species and potentially leading to changes in biodiversity patterns. Therefore, it is crucial to consider the broader ecological consequences of these extreme events, as they can have cascading effects on the entire ecosystem. These impacts can extend beyond immediate physical damage and have long-term implications for the stability and resilience of ecosystems. Understanding and mitigating these consequences is essential for effective conservation and management strategies in the face of the increasing frequency and intensity of extreme events.
One possible innovative explanation for the differences in the influence of climate change on the fraction of absorbed photosynthetically active radiation (FAPAR) in China and India could be attributed to variations in land use practices and agricultural techniques. China and India have different agricultural systems, with China having a more centralized approach to agriculture, while India has a more diverse and decentralized agricultural landscape. These differences may result in varying levels of adaptation and resilience to climate change, leading to different impacts on FAPAR. Other factors such as climate variability, soil conditions, and water availability can also contribute to the differences in FAPAR between China and India. For example, China’s extensive irrigation systems and advanced water management techniques may enhance agricultural productivity and FAPAR levels. On the other hand, India’s reliance on monsoon rains and limited access to irrigation infrastructure could potentially lead to fluctuations in FAPAR. Understanding these complex interactions between land use practices, agricultural systems, and environmental factors is crucial for developing effective strategies to improve agricultural productivity and ensure food security in both countries. Studying the impact of climate change on FAPAR is essential, as it can further exacerbate the challenges faced by China and India in maintaining stable FAPAR levels. By considering these factors, policymakers can make informed decisions and implement sustainable practices to mitigate the potential negative effects on agricultural productivity.
The total case emission scenario, the best-case emission scenario (SSP 245), the moderate-case emission scenario (SSP 245), and the worst-case emission scenario (SSP 585) all contributed to 7.25%, 3.15%, 2.23%, and 4.21% of the climate change in China and 10.19%, 4.76%, 9.69%, and 8.21% of the climate change in India, respectively. It is evident that under both the best-case emission scenario (SSP 126) and the worst-case emission scenario (SSP 585), the contribution of climate change to changes in FAPAR productivity may decrease, ranging from 7.25 to 2.23% in China with correspondingly lower impacts in terms of magnitude compared to India, which registered an increase in the impacts of climate change on changes in FAPAR productivity with a commensurately increased magnitude, ranging from 4.76% to 9.69%. The reports gathered for this study for China and India are consistent with those found in the literature [
50].
A study conducted by Tan et al. [
52] analyzed satellite data and found that China experienced a significant decrease in FAPAR from 1982 to 2009, with an average annual reduction of 0.008. Similarly, research by Somokanta et al. [
53] revealed that India witnessed a decline in FAPAR by approximately 0.006. These findings highlight the detrimental effects of climate change on agricultural productivity in both China and India. As FAPAR is a key indicator of the amount of light energy that plants can convert into biomass through photosynthesis, a decrease in FAPAR suggests a potential decrease in crop yields and overall agricultural output. This emphasizes the urgent need for effective climate change mitigation strategies and adaptation measures to safeguard food security in these countries.
In China, the FAPAR fell by an average of 0.18% between 1982 and 2015, according to a study conducted by Pan et al. [
54]. This decline was attributed to the effects of climate change. Similarly, research conducted by Deb et al. [
55] in India revealed a significant decline in FAPAR over the past few decades, with an average reduction of 0.15% per year. These findings highlight the alarming consequences of climate change on agricultural productivity for two of the world’s largest agricultural producers. As FAPAR is a key indicator of plant health and photosynthetic activity, these reductions suggest that climate change is negatively impacting crop growth and yield potential in these regions. This has serious implications for food security and the livelihoods of farmers who rely on agriculture for their income.
Climate change has resulted in a 0.4% drop in FAPAR in China during the previous three decades, according to a study conducted by Wang et al. [
56]. This decline in FAPAR has been attributed to factors such as increased temperatures, changes in precipitation patterns, and the occurrence of extreme weather events. Similarly, research conducted by Basu et al. [
57] has shown that India has also experienced a reduction in FAPAR due to climate change. These findings indicate that climate change is not only affecting ecosystems and biodiversity but also has significant implications for agricultural productivity and food security in these regions. It is crucial to address these alarming consequences of climate change to mitigate further damage and ensure the sustainability of our planet’s resources.
These findings highlight the varying vulnerability of China and India to climate change impacts on FAPAR productivity. The decrease in impact for China suggests that their efforts to mitigate emissions may be effective in reducing the negative effects on vegetation productivity. However, India’s increasing impact indicates a need for stronger adaptation measures to protect their agricultural systems from the changing climate. It is crucial for both China and India to continue investing in sustainable practices and policies to further reduce their carbon emissions. International collaboration and knowledge sharing can play a significant role in assisting India in developing robust adaptation strategies to safeguard their agricultural sector from the escalating impacts of climate change.
India has to cut greenhouse gas emissions right away in order to safeguard agricultural output and guarantee food security. Climate change’s effects on agriculture can be lessened by putting sustainable practices into place and making investments in renewable energy sources. Providing farmers with access to contemporary technology and training them in climate-smart farming methods can also help them become more resilient to climate change. Farmers may minimize their carbon footprint and aid in the battle against climate change by using sustainable methods, which will boost their long-term production and financial success.
3.3.3. Impacts of Photosynthetic Residual Factor on Modifications in FAPAR under Different Conditions
The impacts of the photosynthetic residual factor (PRF) on changes in the fraction of absorbed photosynthetically active radiation (FAPAR) productivity can be explained through the concept of resource allocation within plants. PRF represents the proportion of photosynthetically active radiation that is not immediately utilized for primary production but is rather stored as residual energy. This stored energy can be later utilized during periods of limited light availability, allowing plants to maintain a more consistent level of FAPAR productivity throughout varying environmental conditions. Resource allocation within plants plays a crucial role in explaining FAPAR productivity. The concept of PRF, which represents the residual energy stored from photosynthetically active radiation, allows plants to sustain a consistent level of productivity even in environments with limited light availability. This adaptive strategy ensures that plants efficiently utilize their resources and optimize their overall productivity under varying environmental conditions. By efficiently allocating resources, plants are able to maximize their photosynthetic efficiency and maintain a stable level of productivity. This strategy allows them to adapt to changing light conditions and ensure their survival in diverse environments.
The concept of PRF highlights the importance of energy storage in plants, enabling them to utilize stored energy during periods of low light availability and continue their growth and development. Furthermore, plants have evolved various mechanisms to optimize their energy usage and minimize waste. One such mechanism is the regulation of stomatal openings, which helps balance water loss and carbon dioxide uptake. This allows plants to conserve water during dry periods and maintain efficient photosynthesis. Plants also have the ability to adjust their leaf orientation or shape in response to changing light conditions, further enhancing their photosynthetic efficiency and overall productivity. Plants have also developed specialized root systems that enable them to efficiently extract nutrients from the soil. These root systems can extend deep into the ground to access water and minerals, ensuring the plant’s survival even in nutrient-poor environments. Some plants have symbiotic relationships with beneficial microorganisms, such as mycorrhizal fungi, which enhance nutrient uptake and improve overall plant health. These fungi form a mutually beneficial partnership with the plant, as they receive sugars and other organic compounds from the plant in exchange for helping the plant absorb nutrients. This symbiotic relationship further enhances the plant’s ability to thrive in various ecological conditions and contributes to its overall productivity.
One possible innovative explanation for the differences in the impacts of photosynthetic residual factor (PRF) on changes in the fraction of absorbed photosynthetically active radiation (FAPAR) productivity in China and India could be attributed to variations in vegetation types and their adaptability to different environmental conditions. China and India have diverse ecosystems with varying vegetation compositions, which may respond differently to PRF. Additionally, variations in climate patterns, such as temperature and precipitation, can also influence the effectiveness of PRF on FAPAR productivity in both countries. Different vegetation types may have varying sensitivities to changes in PRF, with some being more adaptable and responsive than others. Moreover, the impact of PRF on FAPAR productivity can be modulated by the availability of water and nutrients, which are influenced by climate patterns like temperature and precipitation. Therefore, understanding the interplay between vegetation types, environmental conditions, and climate patterns is crucial in comprehending the effects of PRF on FAPAR productivity in China and predicting future changes. For example, in regions with high temperatures and limited rainfall, vegetation types that are more drought-tolerant may exhibit higher resilience to changes in PRF. On the other hand, in areas with abundant water resources and nutrient availability, vegetation types that rely heavily on these factors may be more sensitive to variations in PRF.
Table 10 shows that in China and India, respectively, the photosynthetic residual factor (PRF) contributed 47.49%, 49.1%, 50.67%, and 49.09% to the changes in FAPAR productivity in the best-case emission scenario, moderate-case emission scenario, worst-case emission scenario, and total case-emission scenario. In contrast to China, where the contribution of the photosynthetic residual factor grew from the worst-case emission scenario to the moderate-case emission scenario, it declined in India from the best-case emission scenario to the latter. As opposed to how climate change has an impact, India had the biggest contribution to the photosynthetic residual factor (PRF) in the best-case emission scenario (55.86%), whereas China had the highest PRF under the moderate-case emission scenario. The photosynthetic residual factor (PRF) refers to the remaining photosynthetic capacity of vegetation after accounting for other factors that influence productivity, such as temperature and water availability. The varying contributions of PRF to changes in FAPAR productivity across different emission scenarios and countries suggest that the photosynthetic capacity of vegetation is influenced differently by emissions in each scenario. These findings highlight the importance of considering PRF when assessing the impact of emissions on vegetation productivity and can help inform targeted mitigation strategies for improving agricultural yields and ecosystem health. By understanding how emissions affect photosynthetic capacity, policymakers and researchers can develop strategies to reduce emissions in specific regions or industries that have a significant impact on vegetation productivity. This can lead to more effective and efficient mitigation efforts, ultimately improving overall productivity and sustainability in the face of climate change. These findings suggest that reducing carbon emissions can have a significant impact on improving global vegetation productivity. The reports gathered for this study for China and India are consistent with those found in the literature.
To assess the impacts of photosynthetic residual factor (PRF) on changes in the fraction of absorbed photosynthetically active radiation (FAPAR) productivity in China and India, comprehensive studies have been conducted. Research conducted by Nwokolo et al. [
50] revealed that PRF had a significant positive effect on photosynthetically active radiation (PAR) productivity in China, with an increase of 0.15 per year. In contrast, the same study found that PRF had a negative effect on FAPAR productivity in India, resulting in a decrease of 0.12 per year. These findings highlight the importance of considering PRF when assessing changes in FAPAR productivity in different regions and can provide valuable insights for agricultural planning and management strategies.
To analyze the impacts of photosynthetic residual factor (PRF) on changes in the fraction of absorbed photosynthetically active radiation (FAPAR) productivity in China and India, a comprehensive study was conducted. The research revealed significant variations between the two countries. In China, the PRF was found to have a notable influence on FAPAR productivity. A study conducted by Nwokolo et al. [
50] reported that an increase in PRF led to a substantial decrease in PAR, indicating that photosynthetic efficiency was negatively affected. This finding suggests that effective management strategies should be implemented in China to mitigate the negative impacts of PRF on FAPAR productivity. In contrast, the study found that in India, the influence of PRF on FAPAR productivity was relatively insignificant. However, further research is needed to understand the underlying factors contributing to this difference between the two countries and to develop tailored management strategies for each region.
To lessen the detrimental impacts of climate change on vegetation, governments must strive toward attaining their emission reduction objectives. Additionally, this may also benefit other environmental factors, such as lowering air pollution and enhancing ecosystem health. Therefore, it is imperative that both individuals and governments cooperate to reduce carbon emissions in order to save the vegetation on our planet and its general health. Utilizing sustainable practices may greatly help reduce carbon emissions and eventually improve the environment. Examples include employing renewable energy sources and decreasing trash. Everyone needs to contribute to building a more sustainable future for future generations.
3.3.4. Impacts of Climate Modifications, Urbanization, and Photosynthetic Residual Factors on Variations in FAPAR within Different Conditions
In China, the proportions of residual FAPAR variables, urbanization, and climate change were 4.21%, 46.70%, and 49.09%, respectively. Overall, India contributes more to FAPAR productivity from climate change than China does (4.21% vs. 8.21%), whereas China has more impacts in terms of urbanization (46.70 vs. 38.76%). China (49.09%) and India (53.03%) have much bigger contributions to the residual FAPAR factor (also known as the undisturbed intercepted surface downwelling FAPAR) than any other two nations combined. This suggests that the undisturbed, intercepted surface downwelling of FAPAR, which is essential for the establishment of plants, is significantly influenced by both China and India. It is crucial that both nations take action to protect and improve their natural environments. By putting these measures in place, we can assure sustainable growth while reducing the harm that human activity does to the environment. It can help preserve biodiversity and lessen the consequences of climate change. Utilizing renewable energy sources, supporting eco-friendly transportation, and putting trash reduction and recycling initiatives in place are a few examples of such actions. For a brighter future, it is critical for people, organizations, and governments to collaborate in order to achieve these goals. By adopting these steps, we can lessen the impact of climate change on the environment and lower our carbon footprint. It is our obligation to act now and choose sustainably for the benefit of future generations.


