Abstract
The vertical mass exchange of ozone (O3) plays an important role in determining surface O3 air quality, the understanding of which, however, is greatly limited by the lack of continuous measurements in the vertical direction. Here, we characterize O3 variations at a high-altitude monitoring site at the top of Shanghai Tower (SHT) and discuss the potential impacts of the vertical exchange of air pollutants on O3 air quality within the urban planetary boundary layer (PBL) based on continuous measurements during 2017–2018. During the daytime, two distinct patterns of vertical O3 gradient are detected. In summer, the daytime O3 formation at SHT is observed to be more limited by nitrogen oxides (NOx) than the surface, which, together with the efficient vertical mixings, results in higher O3 levels in the upper mixing layer. In cold months, the opposite vertical gradient is observed, which is associated with weak vertical exchange and NOx-saturated O3 formation. A nighttime O3 reservoir layer and consistent morning O3 entrainments are detected all year round. These results provide direct evidence of the vertical mixings within the urban PBL, underscoring the pressing need for improving vertical resolution in near-surface layers of air quality models.
1. Introduction
Ozone (O3) pollution has become an urgent environmental problem in China, posing a serious threat to air quality, human health, land ecosystem, and climate change [1,2,3,4]. In polluted regions, surface O3 is generated by the photochemical oxidation of volatile organic compounds (VOCs) and carbon monoxide (CO) in the presence of nitrogen oxides (NOx ≡ NO + NO2). The production process is highly nonlinear, and ambient O3 concentrations can be sensitive to changes in precursor emissions in terms of both magnitude and sign. To alleviate air pollution, stringent emission control measures have been implemented by the Chinese government through the Clean Air Action [5]. However, the sharply reduced emissions of NOx led to an unexpected increase in surface O3 levels since O3 formation is generally in the NOx-saturated regime [6,7]. During 2013–2017, the observed daily maximum 8 h averaged (MDA8) O3 concentrations increased at a rate of 1–3 ppb yr−1 in eastern China [8]. Most severe O3 pollution occurred in urban agglomerations, which are densely populated, resulting in elevated exposure of the population and increasing damages to public health [9]. Therefore, understanding the processes that influence O3 accumulation in cities has become one of the top concerns in dealing with air pollution problems in China.
Tropospheric O3 has a lifetime ranging from a few hours to weeks in polluted urban areas, which can thus be transported at difference time and spatial scales. The synthetic effect of nonlinear O3 formation and complex horizontal and vertical transport of O3 and its precursors within the planetary boundary layer (PBL) significantly increase the difficulties of controlling O3 pollution in cities. In addition to serving as hotpots for anthropogenic emissions of NOx and VOCs, cities also have unique canopy structures which modify the thermal and dynamical characteristics of air, leading to changes in meteorological conditions, which then influence the physical (e.g., advection, vertical mixing, and deposition) and chemical (e.g., photochemical reaction) behaviors of air pollutants [10,11,12,13]. For instance, elevated temperature and increased roughness near the urban surface were proved to greatly modify local circulations in cities, which accelerate chemical conversions, suppress horizontal lower boundary layer transport, and enhance vertical mixings within the PBL [10,14,15,16,17]. A large number of studies have investigated the impact of city-modified circulations on regional air quality, suggesting that enhanced vertical mixings tend to decrease the concentrations of primary air pollutants (e.g., NOx, CO, and primary organic aerosols) while increasing the concentrations of secondary air pollutants (e.g., O3 and secondary organic aerosols) near the surface [11,16,18,19,20,21,22].
As a result of suppressed horizontal transport and enhanced vertical mixing, concentrations of air pollutants usually exhibit a sensitive response to the diurnal variations in PBL height in cities. The case of O3 is even more complicated than that of other species (e.g., PM2.5), since the boundary layer dynamics affect not only O3 but also its precursor, thus resulting in more nonlinear changes in O3 concentrations. Vertical O3 exchanges are usually considered to aggravate surface air pollution [10,12,23,24,25]. O3 from the daytime mixing layer (ML) can also be maintained at the nocturnal residual layer (RL) in the absence of advection when the PBL decreases after sunset. Due to a lack of emission sources, aloft O3 cannot be completely titrated and consumed by nitric oxide (NO) and other reductive pollutants at night, resulting in a reservoir of O3 at a few hundred meters above the surface. The high level of O3 in the nighttime RL exerts a significant influence on nighttime heterogeneous chemistry (e.g., secondary aerosol formation) [26,27,28]. O3-rich air may also mix down to the surface, triggering a nocturnal O3 enhancement under favorable weather conditions [29,30]. As the PBL develops after sunrise, the preserved O3 from the RL is regarded as an important contributor of morning O3 accumulation near the surface, since the increasing surface temperature and the formation of the ML accelerate the vertical exchange of O3 between the RL and the surface, especially under clear skies and weak surface wind conditions [13,19,24,31,32,33,34,35,36]. By analyzing measurements obtained from 220 ozonesondes in Houston, Morris et al. [32] indicated that the morning RL O3 concentrations explained 60–70% of the variability observed in the afternoon ML O3 during July 2004–June 2008. Zhu et al. [37] suggested that more abundant O3 at the RL would lead to higher concentrations of O3 near the surface. Based on two cases of sounding measurements in the summer of 2012 and 2013, their calculations suggested that the downward transport of the RL O3 contributed to more than 50% of the surface O3 during 06:00–10:00 LST (local standard time) in Beijing compared to those produced by photochemical reactions.
Though the impacts of enhanced vertical mixings on urban O3 air quality have been reported in many cities, direct observations of the upper PBL O3, especially those during nighttime, are extremely limited. Previous observational studies mostly focused on cases [27,32,37,38], where observations are either typically scheduled for the afternoon (e.g., ozonesond), operated at a low frequency (e.g., aircraft and balloon), or limited by the retrieval algorithm and instrument coverage (e.g., satellite and lidar). Tower-based measurements are thus considered the most effective approaches to obtain continuous O3 observations in the upper PBL with a high accuracy. Compared to densely conducted surface measurements, tower-based O3 monitoring sites are quite limited in China. Based on continuous tower measurements, vertical distributions, the seasonal/decadal changes in O3, and the formation of surface nighttime O3 enhancement were examined in Beijing [39,40,41], Tianjin [39,42], and Guangzhou [43,44,45], respectively, with the highest measurements conducted at 488 m. In this study, we present the first analysis of continuous upper-layer O3 measurements conducted at a high-altitude opening observatory at the top of Shanghai Tower with a monitoring height of 600 m. The vertical O3 exchange in/between different PBL structures in Shanghai is investigated by comparing the 2-year O3 and NOx measurements at the Shanghai Tower site (referred to as SHT in the following) to those obtained simultaneously at a surface monitoring site at Pudong (PD). The impacts of different vertical exchange patterns on surface O3 air quality and related mechanisms are discussed, aiming to provide additional observational evidence and implications for surface O3 pollution control in cities.
2. Materials and Methods
2.1. The Surface and Tower-Based Measurements
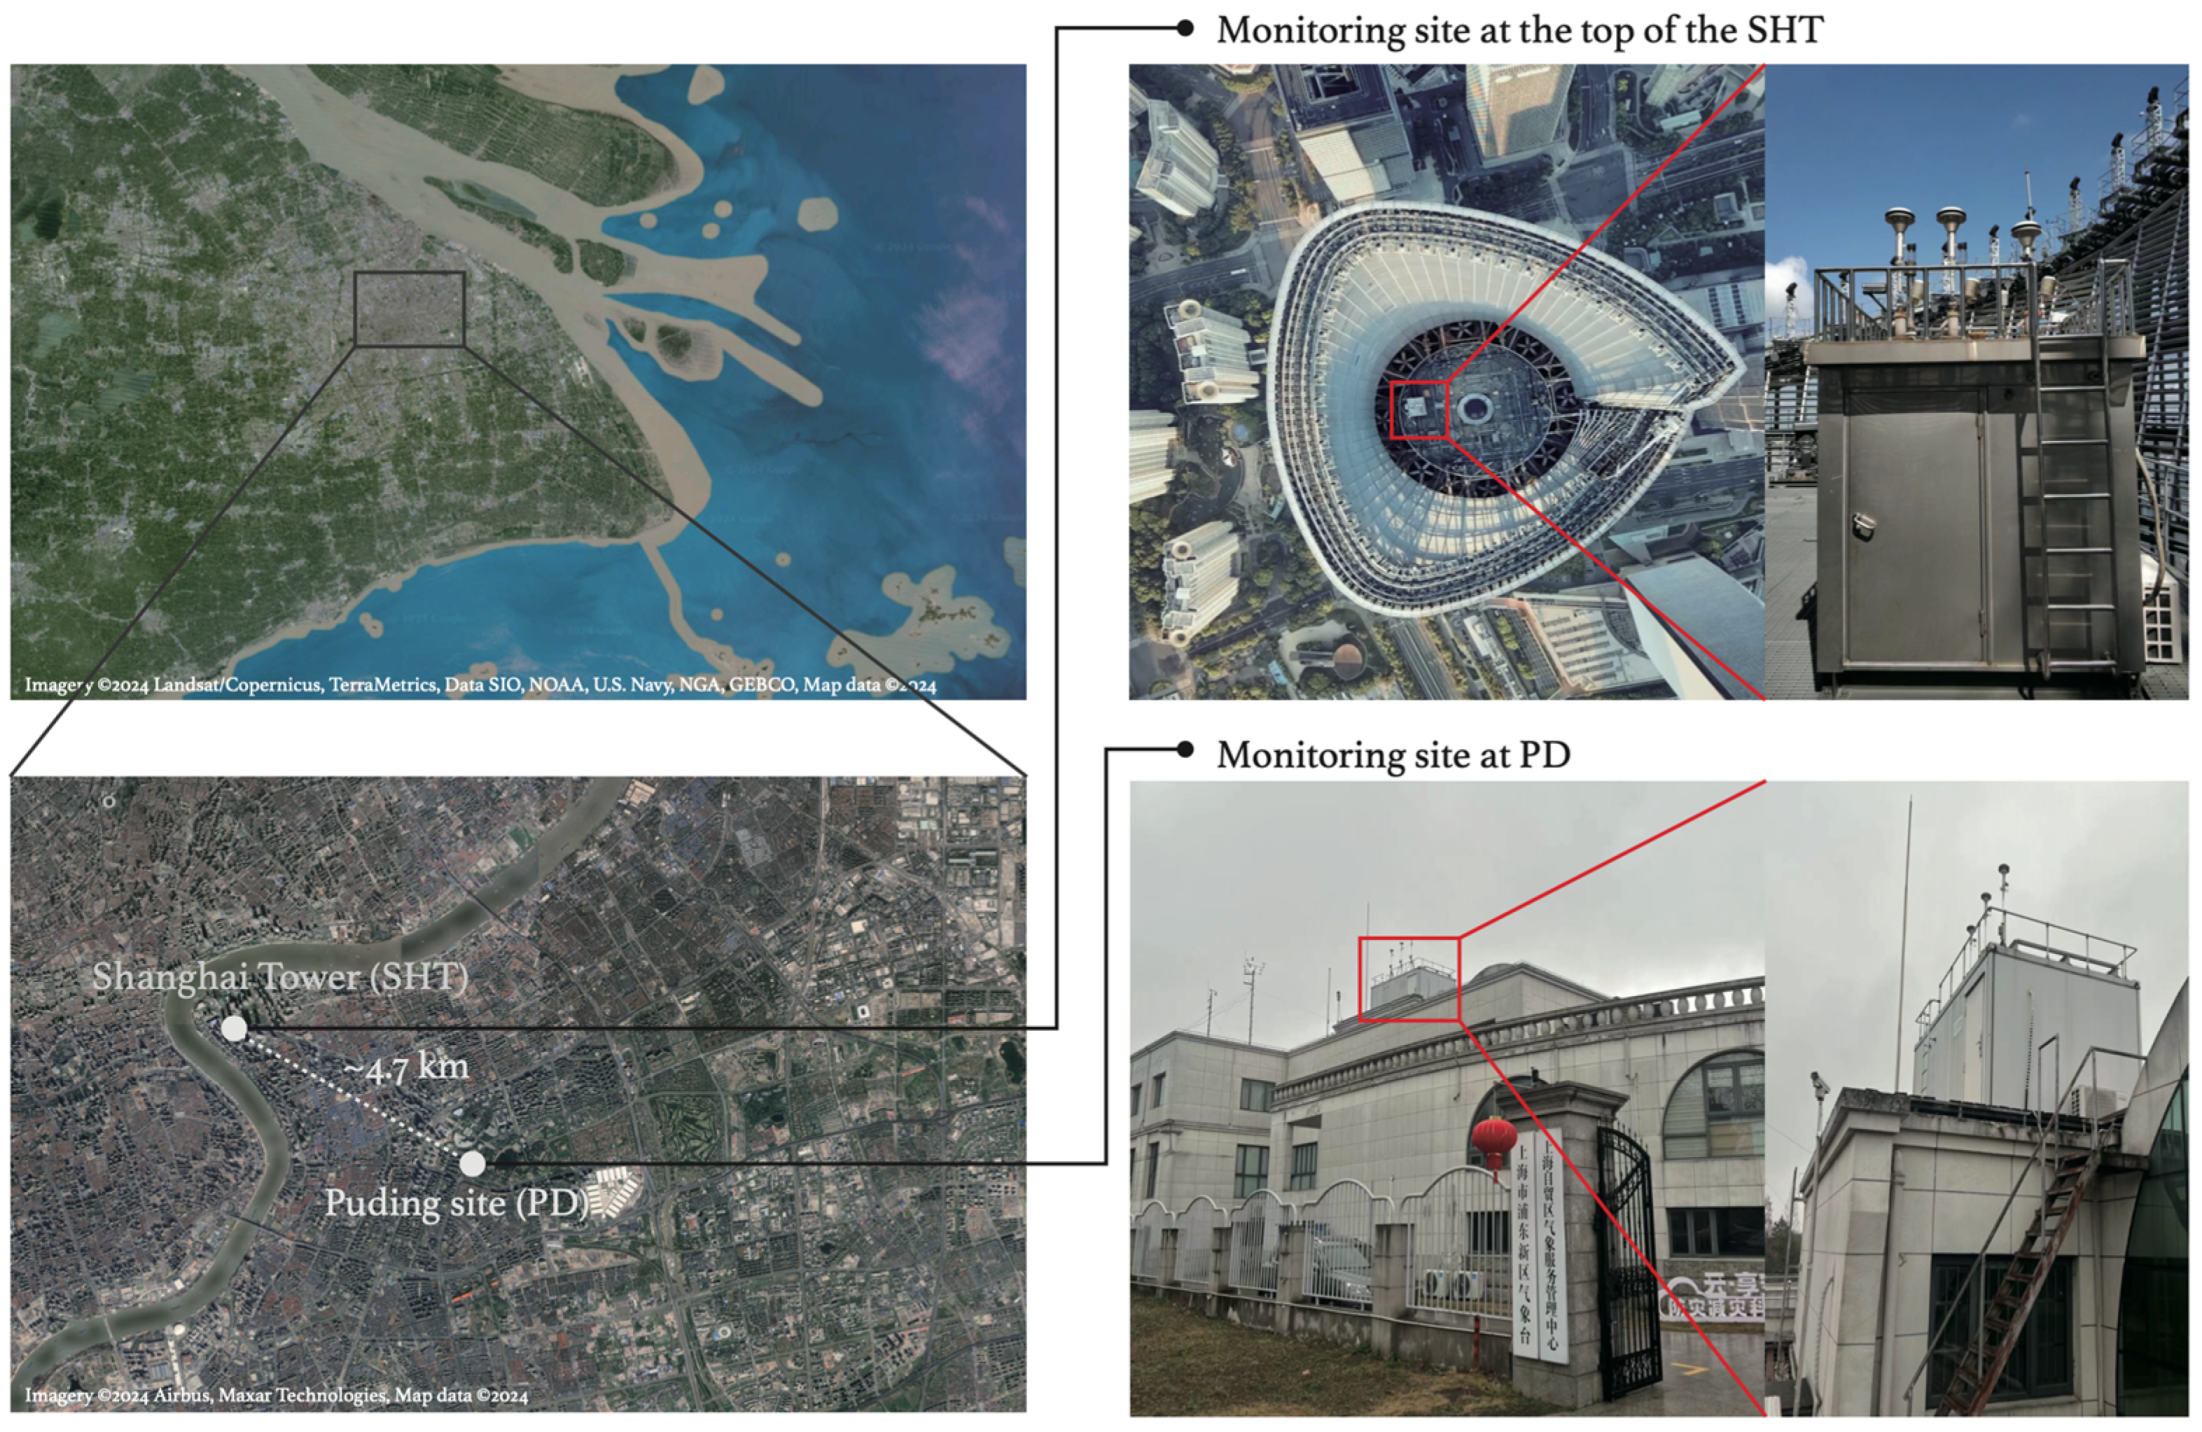
We conducted continuous observations of O3, NO, and nitrogen dioxide (NO2) at an opening observatory at the top of Shanghai Tower (121.512° E, 31.239° N, 632 m) from 1 January 2017 to 31 December 2018. Shanghai Tower is Asia’s tallest and the third tallest building in the World by height to architectural top, located at Lujiazui, the financial center of Shanghai. Compared to heights where other tower observations (e.g., 280 m in Beijing [39,40,41]; 220 m in Tianjin [39,42]; 450 m in Guangzhou [43,44,45]; 160 m in London [46]) are conducted, SHT (~600 m) is higher, at about 1/2 of the daytime ML (~800–1200 m) [47,48]. The relative location of the site to the top of the boundary layer varies during different stages of PBL evolution (Section 3.1). The observations thus provide unique observational evidence of the O3 characteristics in the ML, RL, and nocturnal boundary layer (NBL) during different times of day. To investigate the vertical exchanges of O3 and its precursors between the surface and RL, and in the convective mixing layer, O3 and NOx measurements were simultaneously collected at a surface monitoring site (121.559° E, 31.226° N, ~9 m) at PD, Shanghai. The PD site (referred to as PD in the following) is located ~4.7 km southeast from SHT in the same district, where the observed air pollutant concentrations were used to represent the surface pollutant levels over SHT and surrounding areas [49].
At both PD and SHT, hourly O3 concentrations were measured using the Model 49i Ozone Analyzer (Thermo Fisher Scientific Inc., Waltham, MA, USA) based on the absorbance of ultraviolet light by ozone molecules at a wavelength of 254 nm. Hourly NOx concentrations were measured by a chemiluminescent trace level analyzer (Model 42i-TL, Thermo Fisher Scientific Inc., Waltham, MA, USA) with a detection limit of 0.025 ppb. All instruments met the technical specifications for the United States Environmental Protection Agency, with a quality control check performed every 3 d. The filter was replaced every 2 weeks and calibrated every month. During the observational period, the capture rates of the qualified O3 and NOx measurements were 90.9% and 92.4%, respectively. To investigate the influence of wet deposition on our results, the observational results are compared with those considering only nonrainy periods. The qualified records were selected according to the simultaneous surface measurements of meteorological parameters, including temperature, relative humidity, horizontal wind speed, wind direction, and precipitation at PD. The geographical locations of the monitoring sites are displayed in Figure 1.
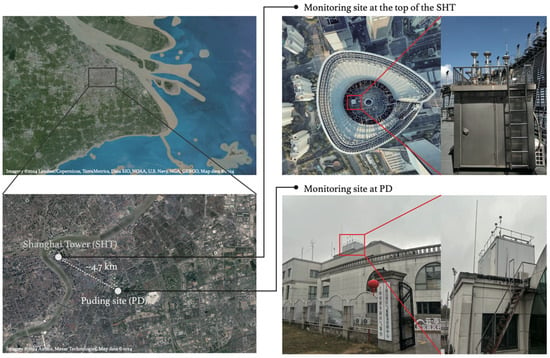
Figure 1.
The geographic location, landscape, and deployment of the monitoring sites at Shanghai Tower (SHT, high-altitude) and Pudong (PD, surface), respectively.
2.2. The PBL Height Reanalysis Data
To analyze the seasonal variations in the PBL height, hourly PBL height data during the observational period (i.e., 2017–2018) were obtained from the fifth-generation reanalysis datasets developed by the European Center for Medium-Range Weather Forecasts (ERA5, https://cds.climate.copernicus.eu/cdsapp#!/dataset/reanalysis-era5-single-levels, last access: 20 December 2023), with a horizontal resolution of 0.25° × 0.25° [50]. Being compared with many radiosonde-based observations, the ERA5 reanalysis PBL height has been reported to be able to capture the diurnal and seasonal cycle of the PBL structure [51,52,53]. For deep boundary layers (>1000 m), the uncertainties of the reanalysis data are generally within 20%. Based on five-year (2010–2015) lidar measurements deployed at PD, Pan et al. [47] examined the diurnal and seasonal variations in PBL height exactly over the studied urban region, suggesting that the daytime PBL height ranged from ~800 m in winter to ~1200 m in summer, while the NBL heights were generally shallower than 200 m. We thus assume that the daytime ML can be well reflected by the ERA5 data. The urban NBL heights, however, were usually observed to range from approximately 100 to 400 m [47,54], in which case the uncertainties of the reanalysis data can exceed 50%. The reanalysis PBL heights were still reported to be able to capture seasonal variations when multi-year averages were considered [51]. Therefore, we only considered the two-year mean values to identify the PBL height in our analysis. By making comparisons with remote sensing retrievals, recent studies have indicated that the ERA5 which estimated the NBL heights did not reflect the influence of the RL [55,56]. We infer the location of the RL by comparing the height of the NBL to that of the daytime ML, as the top of the ML can generally become the top of the leftover when the PBL transited from unstable in the daytime to stable at night [53].
3. Results and Discussion
3.1. The Location of the SHT Site
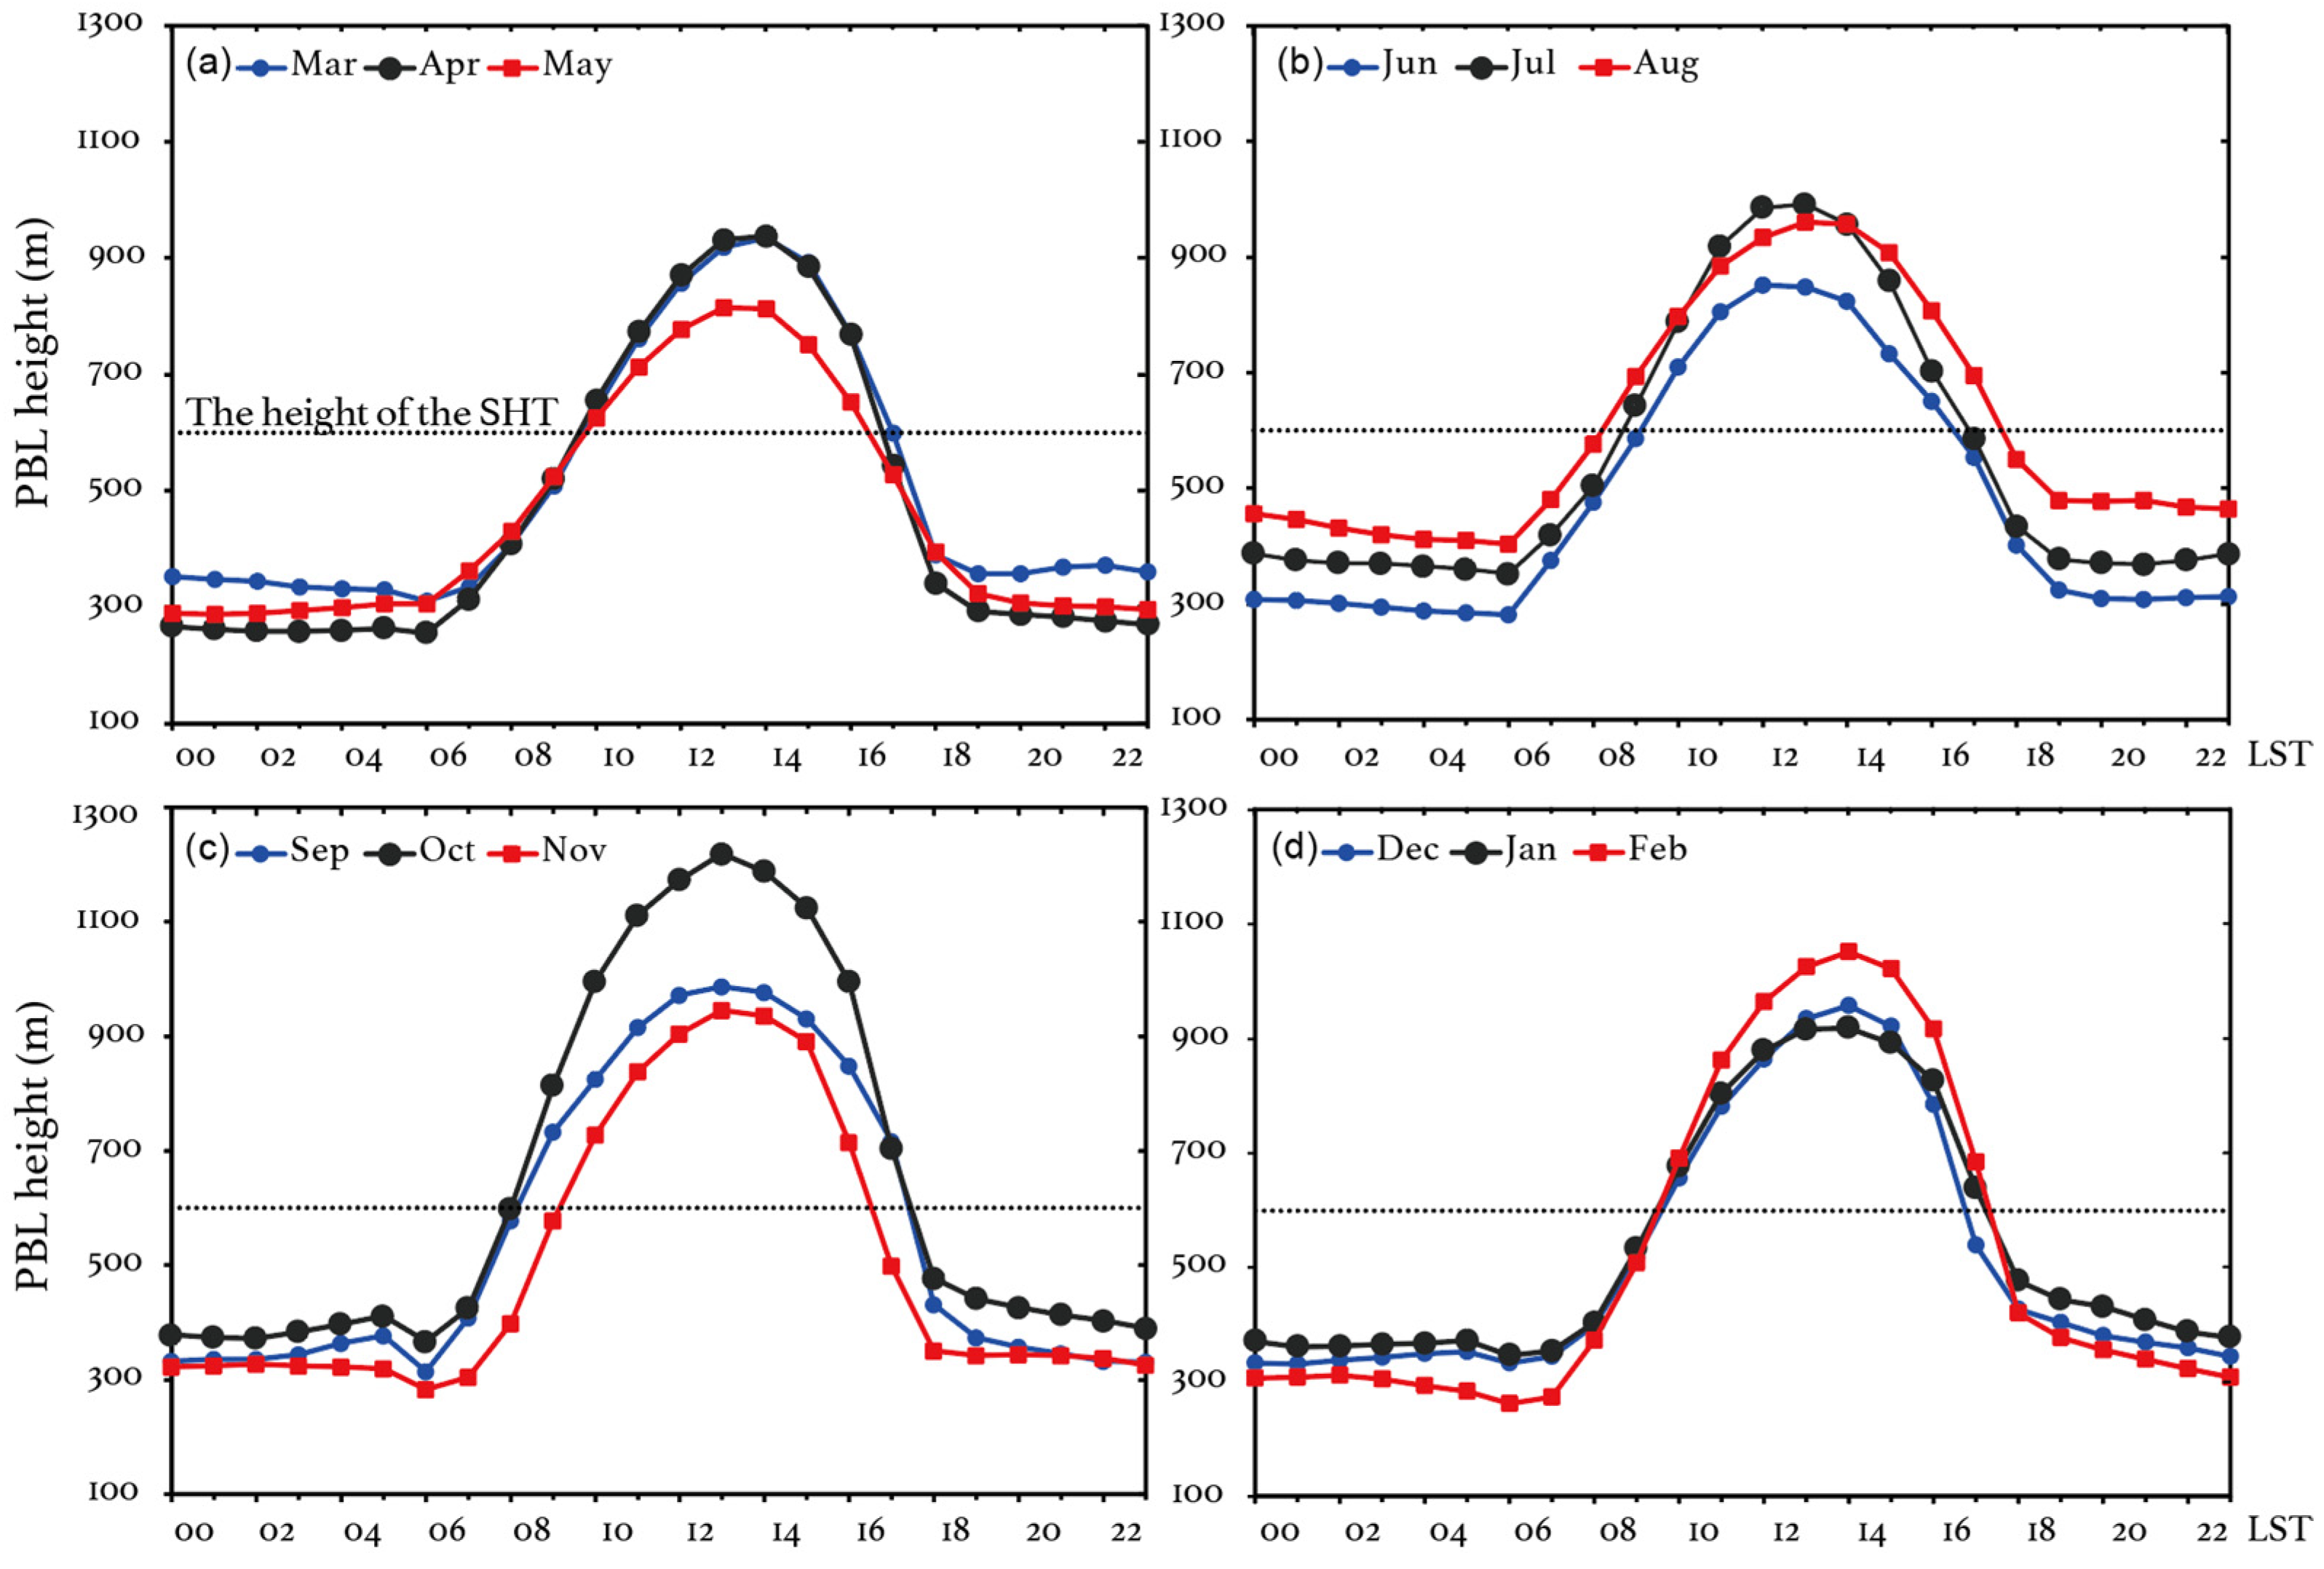
The earlier observational evidence indicates that the layer (~600 m) where the SHT site is located (referred to as the SHT layer in the following) is in the upper ML during the daytime, while it is above the top of the PBL during the nighttime. When the RL is formed, the SHT layer is more likely to be included in the RL. The observations are thus able to represent air pollutant levels in various PBL structures during different times of day. The reanalysis data provide additional evidence of the relative location of SHT to the ML, NBL, and RL. Figure 2 displays the diurnal variations in the reanalysis PBL height in the pixel where SHT is located. The reanalysis PBL heights present comparable magnitudes and similar diurnal patterns as those derived from sounding data [48,57]. In all the seasons, the PBL heights start to increase at 07:00–08:00 LST, achieving peak values (~800–1200 m) at 13:00–14:00 LST and decreasing to 200–300 m after sunset. The deepest daytime PBL appears in October since the prevailing synoptic of the continental high pressure favors the development of the convective ML. SHT is included in the urban PBL from 10:00 to 16:00 LST as a result of vigorous turbulent mixing, when the SHT measurements can be used to analyze O3 characteristics at the upper ML. During other times of day, SHT is observed to be mostly above the top of the reanalysis PBL. The SHT observations, especially those taken during the nighttime, tend to reflect air pollutant levels in the RL or even the free atmosphere. By comparing the observed O3 variations at the surface (PD) and SHT layers, we are thus able to obtain direct observational evidence to investigate vertical O3 exchanges, for example, the O3 entrainments from the RL to the surface in the morning and the strong vertical O3 mixings during noontime, over this urban area.
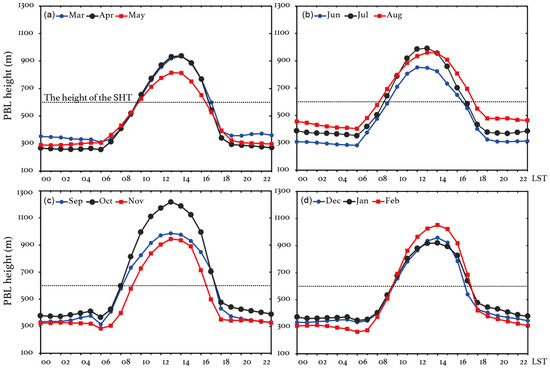
Figure 2.
Diurnal variations in the reanalysis PBL height (unit: m) at the grid box where the Shanghai Tower site (SHT) is. The black dash lines represent the altitude (~600 m) of SHT. The results for (a) spring (March to May), (b) summer (June to August), (c) autumn (September to November), and (d) winter (December to February) are shown. Numbers in the x-axis are local standard time (LST).
3.2. Observed O3 Characteristics at the Surface and SHT
3.2.1. Monthly Variations in O3 at SHT and the Surface
Figure 3a shows the observed monthly variations in O3 concentrations at SHT and PD. Generally, SHT O3 exhibits similar seasonal patterns to those at PD, presenting higher concentrations in warm seasons but lower concentrations in winter. The observed seasonal variations are consistent with the general variations in solar radiation throughout the year, indicating that O3 production is dominated by the photochemical processes at both the surface and upper PBL. Compared to the surface measurements, SHT O3 exhibited higher concentrations, with an observed mean level of 40.0 ppbv during the observational period, 23.8% higher than that (32.3 ppbv) at PD. As the relative location of SHT to the PBL changes (Section 3.1), the relationship of O3 between SHT and the surface is different when the layer is included in various PBL structures. Figure 3b,c further display the monthly O3 variations at PD and SHT, averaged over daytime and nighttime, respectively. The daytime observations are selected from 09:00 to 16:00 LST, when SHT is generally included in the convective ML (Figure 1). Compared to the nighttime (22:00–05:00 LST) observations, the daytime O3 concentrations at SHT show better consistency with those at PD. The mean O3 concentrations are 42.3 and 42.0 ppbv at SHT and PD, respectively. Consistency can be achieved since air pollutants tend to be well mixed in a fully developed convective ML. It is noted that the observed SHT O3 exhibits higher concentrations in summer and early autumn compared to the surface ones, but it presents negative deviations in spring and winter. The results indicate a different mechanism of O3 accumulation at the surface and upper ML in various seasons. During nighttime, the observed O3 exhibits more pronounced discrepancies between the two sites (Figure 3c), when the observed mean O3 concentration (38.4 ppbv) at SHT is 51.8% higher than that (25.3 ppbv) at PD. As SHT is generally above the top of the shallow NBL (Figure 1), air pollutants at SHT are more likely to be isolated from those near the surface at night. The large nighttime discrepancies thus can be explained since SHT O3 tends to be less titrated and consumed. Once the RL forms under favorable weather conditions (e.g., weak winds and strong inversion), the O3-rich air would be able to be stored and entrain to the surface again as the convective ML develops in the subsequent morning. To investigate the impact of precipitation on the O3 characteristics, we compare the seasonal variations with those considering measurements only taken during nonrainy days. The results (Figure S1) suggest that the seasonal patterns are barely affected by rain.

Figure 3.
The observed monthly mean O3 concentrations (unit: ppbv) at SHT and PD during 2017–2018. The results for (a) all-day (00:00–24:00 LST), (b) daytime (09:00–16:00 LST), and (c) nighttime (22:00–05:00 LST) averages are presented.
3.2.2. Diurnal Variations in the O3 Differences between SHT and the Surface
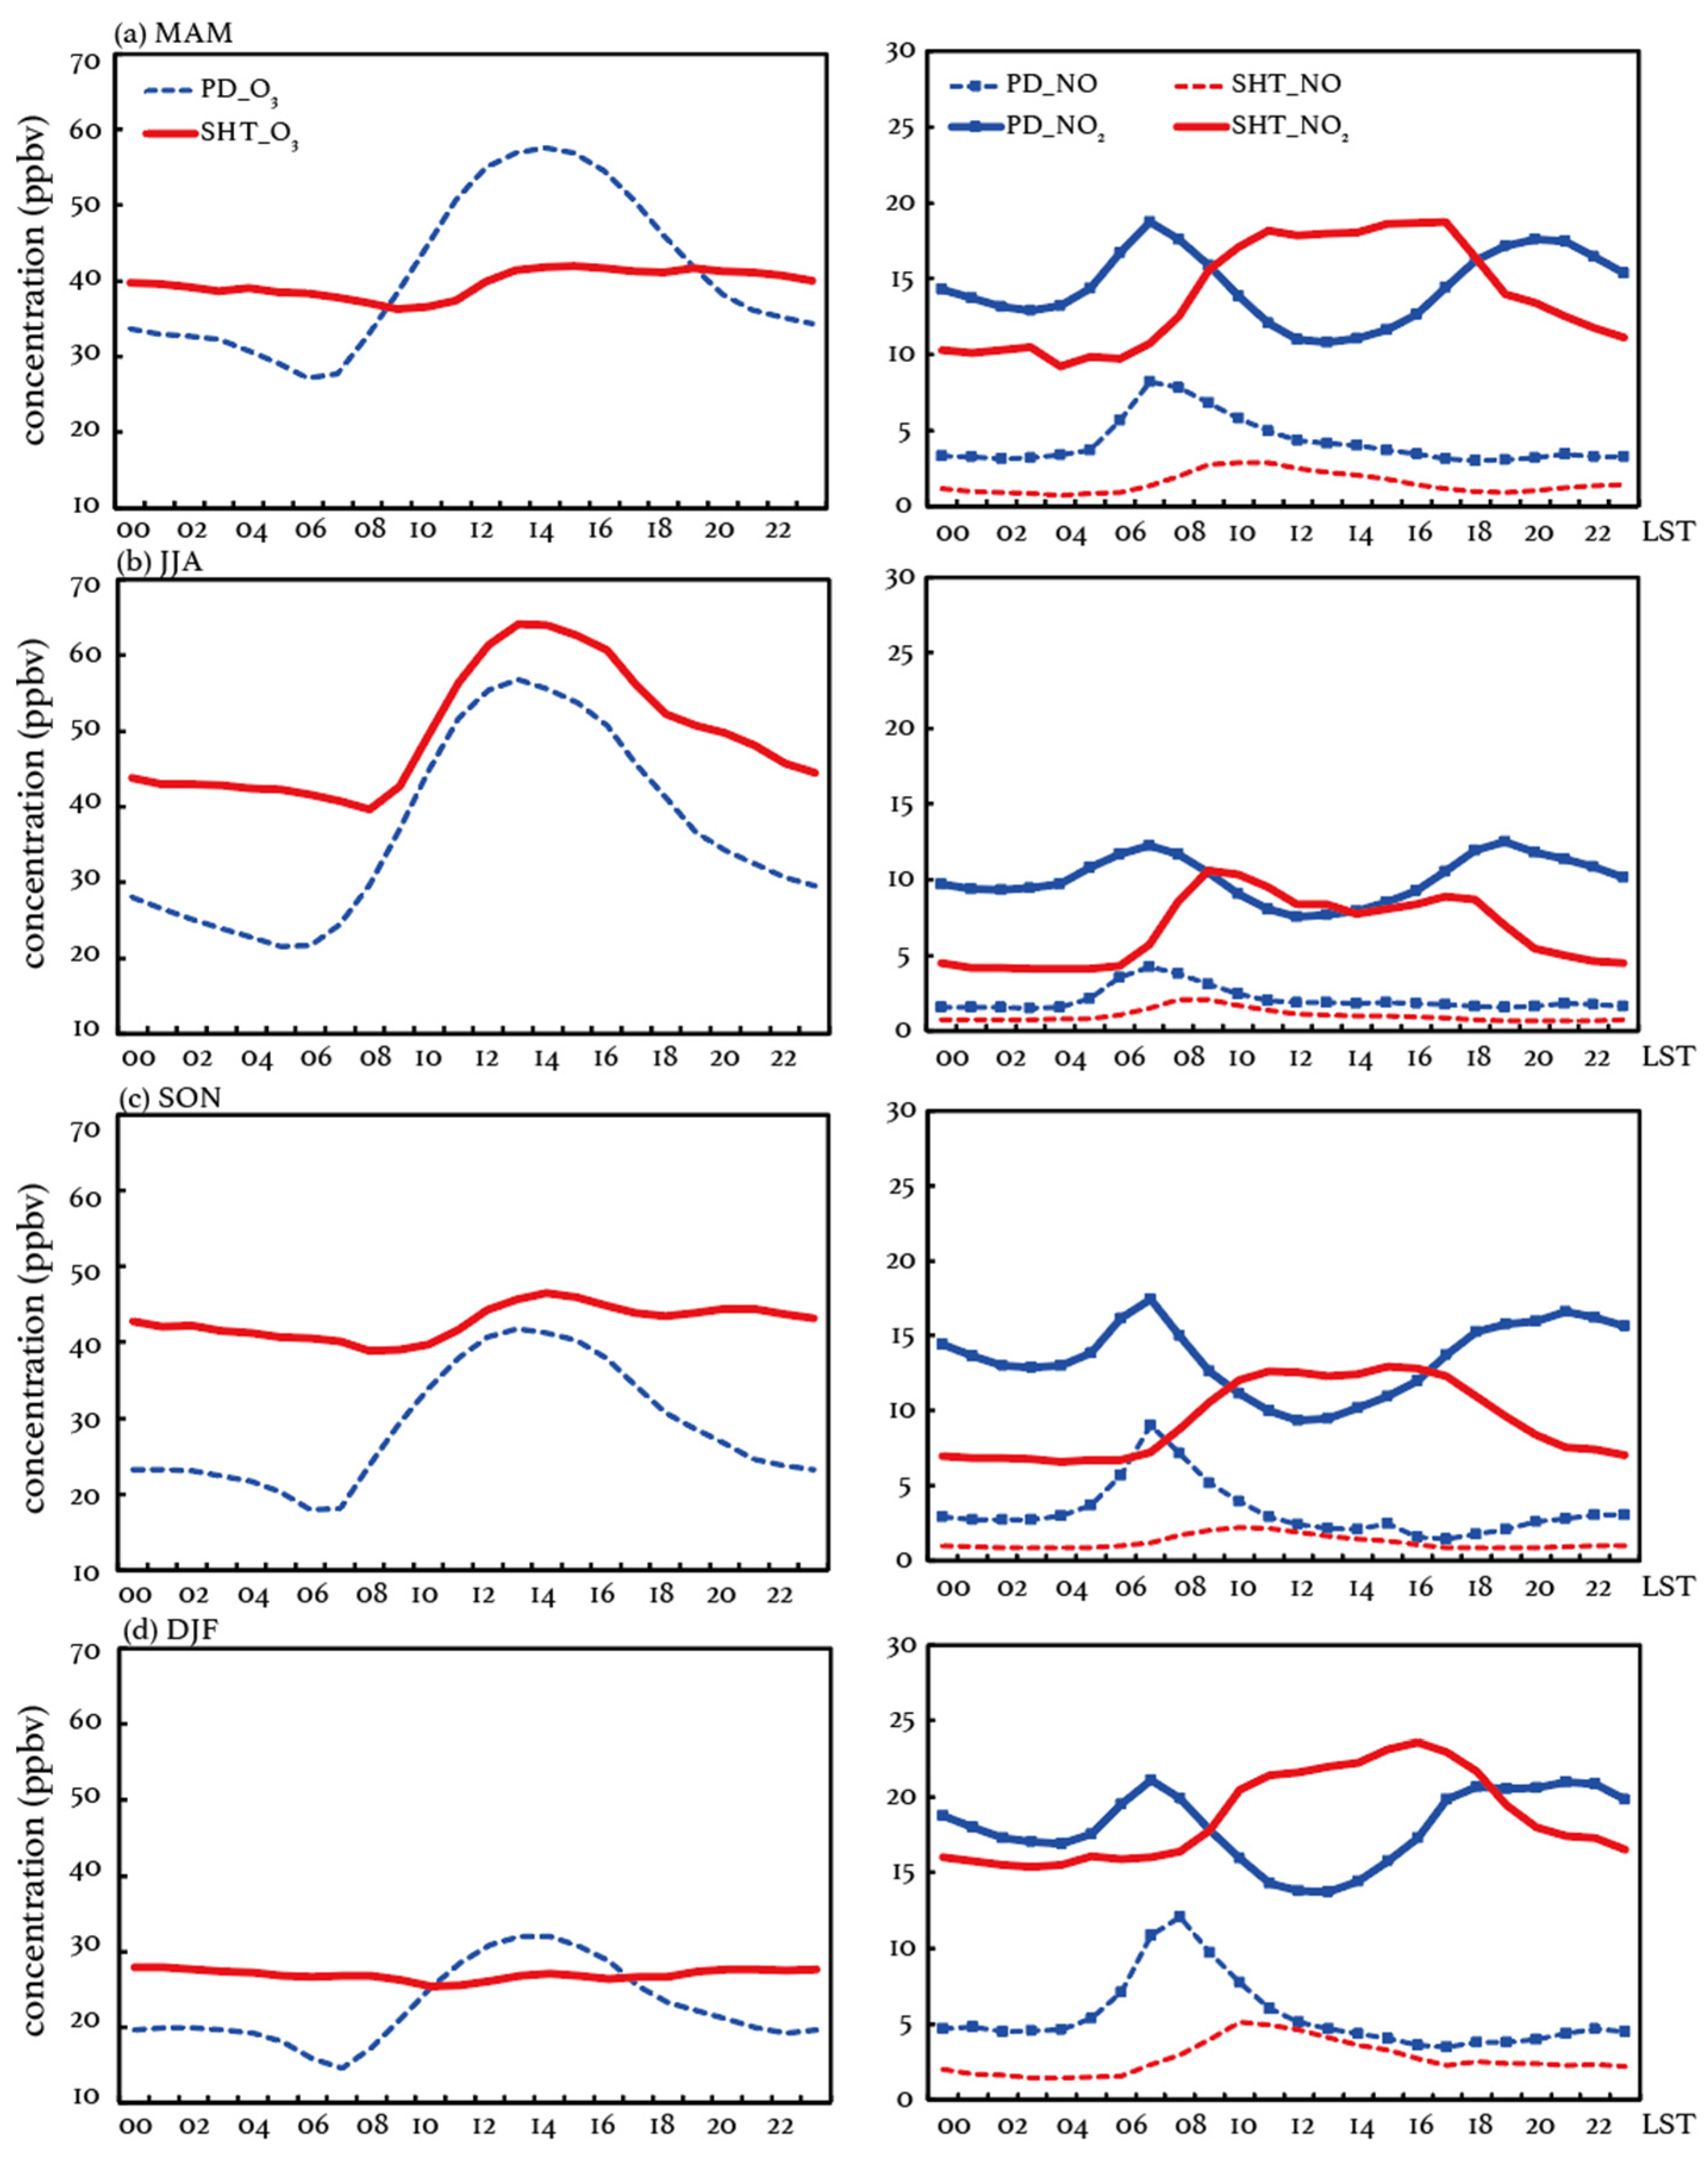
To investigate the potential mechanism resulting in the observed O3 differences at the surface and upper PBL, we calculate the O3 difference (OD), defined as the observed seasonal mean O3 concentrations at SHT minus those at PD. The mean diurnal variations in O3 in each season are shown in Figure 4. SHT O3 exhibits a similar diurnal pattern to that in PD in summer (June to August, JJA), while the diurnal variations it presents in other seasons are not distinctive, especially in winter (December to January, DJF). The results suggest that O3 at SHT can be more affected by surface pollutants in summer than in other seasons, indicating more significant vertical mixings during these two layers. The calculated OD exhibits positive peaks in the morning and evening, while it presents a valley or a negative peak during the noontime, which aligns well with the diurnal variations in the urban PBL. The observed OD starts to decrease at 05:00–06:00 LST when the convective ML begins to develop and increase again in the afternoon as the turbulence becomes weaker. These changes suggest a period when the vertical exchanges between the surface and SHT layer occur. As the ML fully develops near the noontime, O3 tends to exhibit the highest homogeneity in the vertical direction within the urban PBL, which is reflected by the relatively small differences in O3 levels between the surface and SHT during this period. Once the inversion is established after sunset, the high-level O3 produced or dispersed in the daytime ML is likely to be stored at the SHT layer, since this layer is generally above the top of the NBL and can be a part of the RL, where air pollutants are isolated from the surface. In the absence of NOx, O3 at the SHT layer is less likely to be titrated and consumed at night compared to those near the surface, resulting in an increased OD between PD and SHT. Consistent with the shallow and stable NBL, the observed large OD sustains from 21:00 to 05:00 LST, ranging from 15 to 20 ppbv in summer, 19 to 23 ppbv in fall (September to November, SON), and 5 to 9 ppbv in winter and spring (March to May, MAM).
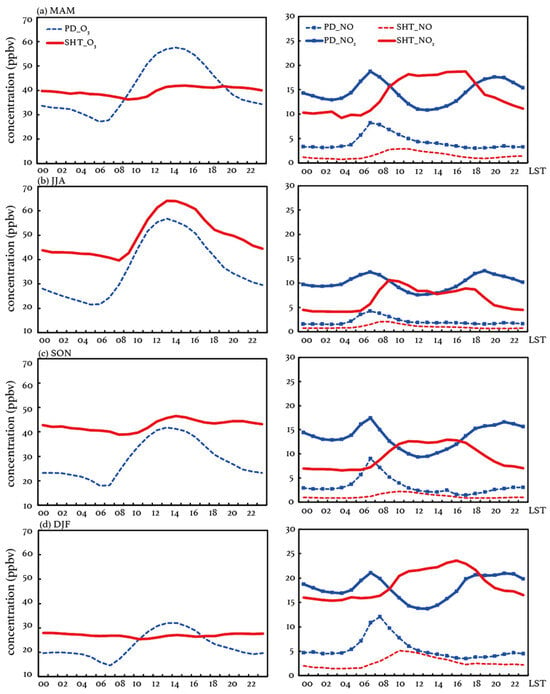
Figure 4.
The seasonal mean diurnal variations in concentrations (unit: ppbv) of O3, NO, and NO2 at SHT and PD in (a) spring (MAM), (b) summer (JJA), (c) autumn (SON), and (d) winter (DJF) during 2017–2018.
Though the OD exhibits similar decreases from around 06:00 LST all year round, the O3 concentrations at SHT are observed to be smaller than those at PD, resulting in negative OD values during 10:00–16:00 LST in DJF and MAM. The negative values suggest that the vertical exchanges during this period are more likely to result in upward O3 flux, which helps to alleviate surface O3 pollution. The O3-rich air aloft is then able to be stored in the SHT layer, which is reflected by the observed peak (11.1–12.2 ppbv) of the positive O3 deviations in the early morning. Vertical mixings after the destruction of the inversion layer thus contribute to the accumulation of O3 near the surface. In JJA and SON, the OD is observed to be positive during both the daytime and nighttime, indicating that the vertical O3 exchanges, if they occur, are more likely to aggravate surface O3 pollution. The positive ODs present maximum values of 20.6–22.5 ppbv during 4:00–6:00 and minimum values of 3.5–4.6 ppbv during 09:00–12:00 LST. Compared to those in MAM and DJF, the observed OD in JJA and SON is undoubtedly more favorable for the surface O3 enhancements during vertical mixing. As Figure 3 displays, the observed O3 concentrations at SHT are generally consistent during the polluted season. The large OD can mainly be attributable to low surface O3 concentrations (PD), indicating more vigorous O3 depression, especially at night. The large nighttime differences may result in more O3 entrainments from the RL to the surface during the morning, exerting more significant adverse impacts on surface O3 air quality.
3.2.3. Diurnal Variations in the O3 Changing Rate
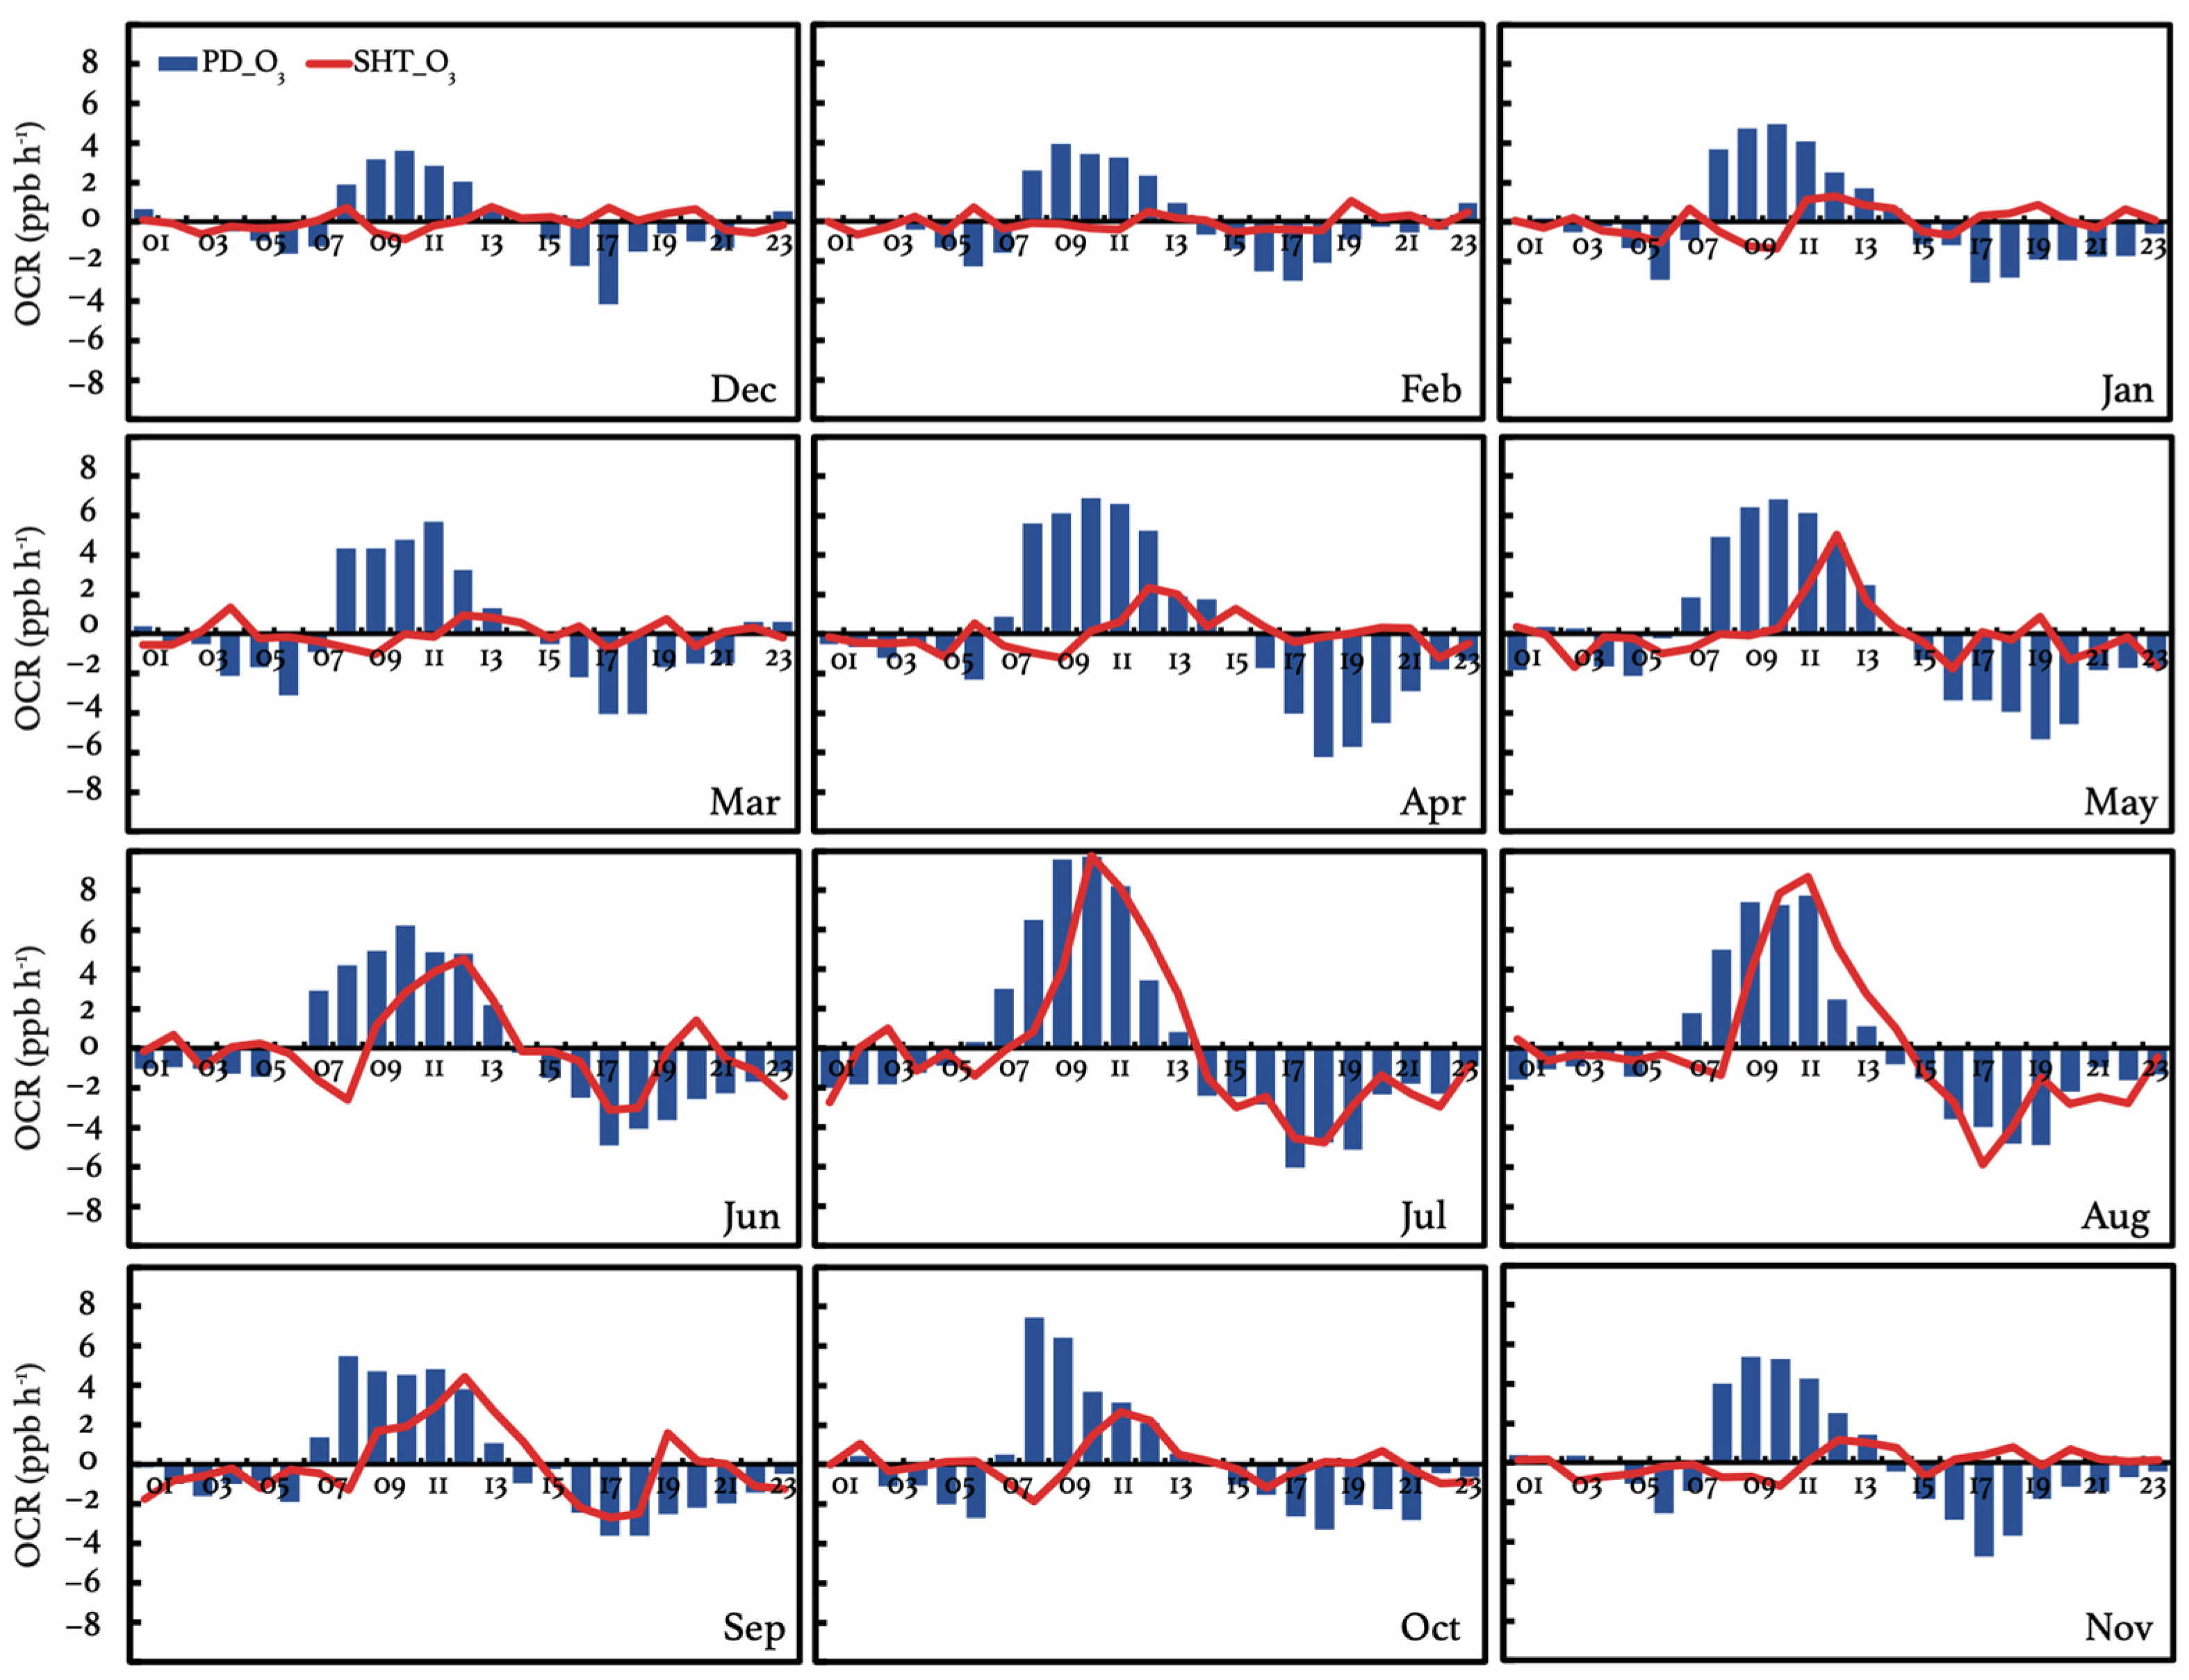
To further investigate the causes of ODs in various seasons, we analyze the diurnal variation in the O3 changing rate (OCR = d[O3]/dt) at SHT and PD in Figure 5. The OCR can be determined by the changes in air pollutant concentrations due to transport, chemical production, chemical loss, and emissions. Since O3 is a secondary pollutant which is not directly emitted into the atmosphere, d[O3] induced by emission changes can be zero. The effect of advection can also be mitigated by the application of a monthly average for the diurnal trend analysis. The observed OCR at PD exhibits similar diurnal patterns as those reported in previous works [58]. Generally, a positive OCR is evident from 06:00 to 14:00 LST during summertime and 08:00 to 13:00 LST during wintertime, suggesting the accumulation of O3 near the surface. Between 08:00 and 10:00 LST, the OCR reaches relatively high values due to enhanced O3 production promoted by increasing precursor emissions and sunlight. Negative OCRs are observed after 15:00 LST, and these extend to the morning. This period is characterized by weakened photochemistry as the sun goes down, leading to an increase in the titration and consumption of O3. Consequently, there is a prevalence of O3 depressions compared to production near the surface. The most rapid O3 decrease, ranging from −3.0 to −6.0 ppbv h−1, at PD occurs during 17:00–19:00 LST, which is associated with a resurgence in NOx emissions during evening rush hours.
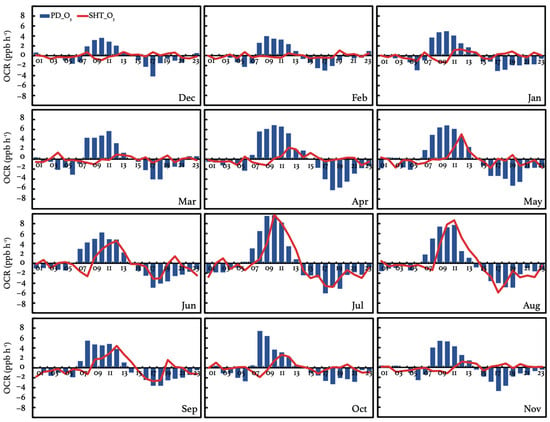
Figure 5.
Monthly mean diurnal variations in O3 changing rate (OCR = d[O3]/dt, unit: ppbv h−1) at SHT and PD from April to September averaged over 2017–2018.
In contrast, the observed OCR at SHT exhibits more diversities in diurnal and seasonal variations, which has been seldom discussed in the literature. During October to May, the daytime OCR at SHT is consistently lower than that at PD. This distinction is particularly pronounced in winter, when the mean OCR ranges between 1.2 and 2.0 ppbv h−1 at PD, contrasting with nearly zero values at SHT. In addition to lower magnitudes, the positive OCR at SHT stands out for its comparatively briefer duration during the daytime. Lasting 2 h in winter and 4–5 h in summer, the duration of the positive OCR at SHT is approximately one-third to one-half of the time observed at PD. The results suggest that the daytime O3 production at the upper ML can be smaller than that near the surface, which explains the observed negative OD in DJF and MAM in Figure 4. During June to September, there is a notable increase in the daytime OCR at SHT. The largest enhancement is observed in July and August, when the positive OCR shows a duration of approximately 7 h, with peak values ranging from 8.7 to 9.7 ppbv h−1. These values are comparable and even higher than those recorded at PD, where the peak OCR values range from 7.8 to 9.7 ppbv h−1. The increased OCR indicates more favorable conditions for O3 accumulation at SHT, which results in the observed positive OD in these months. The observed maximum daytime O3 concentrations at SHT reach 68.3 ppbv in July, 15.1 ppbv higher than those at PD. The pronounced vertical O3 gradient is highly likely to exert detrimental effects on the surface O3 air quality, especially during periods of vertical O3 mixing facilitated by favorable weather conditions (e.g., weak horizontal winds). The positive O3 differences between the surface and upper PBL during the nighttime are also more likely to be preserved.
At night, the OCR variance at SHT is generally smaller than that at PD, suggesting that less O3 is depressed at the upper layer. Notably, a consistent negative OCR is detected during 05:00–07:00 LST at SHT, ranging from −0.1 to −1.6 ppbv h−1. Concurrently, the observed OCR at PD begins to rise, exhibiting positive values ranging from 0.30 to 3.0 ppbv h−1. In the early morning, NO2 undergoes minimal photo-disassociation due to weak sunlight, resulting in limited O3 production. The observed O3 increases at PD and O3 decreases at SHT thus can be largely attributed to vertical mass exchanges since the convective ML starts to develop. The vertical O3 gradient leads to opposite changes in O3 concentrations at SHT and PD. Since the surface O3 is continuously depressed by the NO exhaust in the morning [58,59], the adverse impacts of the downward entrainments on the surface O3 air quality can be partly offset, which is reflected by the less significant reflections in surface O3 concentrations than those at SHT, as shown in Figure 5.
3.3. The Observed O3-NOx Relationship
The vertical gradients of O3 production play a critical role in the vertical O3 exchanges, determining whether the O3 flux is upward or downward within the urban PBL. Given the limited direct emissions of O3 precursors at the upper layer, the monthly mean O3 production at SHT is predominantly affected by the boundary layer dynamics and solar radiation. The former brings surface precursors to the upper layer, while the latter influences photochemistry. As SHT is close to the skyline of Shanghai, we assume that the daylight conditions there can be more beneficial to NO2 photolysis than those near the surface due to less shielding of the urban canopy. However, the observed daytime OCR at SHT exhibits seasonally varying differences compared to that at PD. During cold months, daytime O3 production tends to be inhibited at SHT, indicating faster O3 accumulation near the surface than the upper ML, while in summer and early autumn, daytime O3 production is promoted at SHT. The different O3 productions result in a different OD, which brings opposite outcomes during the vertical daytime mixings.
To investigate the potential causes affecting daytime O3 production at SHT, the seasonal mean diurnal variations in NO and NO2 are examined in Figure 4 as well. The observed NO at SHT exhibits similar patterns of diurnal variations as those near the surface, yet peak values appear later. The surface NO concentrations reach their peak at around 7:00, aligning with the increasing NO emissions during the morning rush hour. In contrast, at SHT, the NO peaks appear at 08:00–09:00 LST in JJA and 10:00–11:00 LST in other seasons, exhibiting a lag of 1–4 h compared to the those near the surface. The observed NO2 at SHT peaks simultaneously with the NO, which occurs 1–4 h later than those near the surface. For lack of direct emissions, the delayed NO and NO2 peak at SHT can be mainly associated with the boundary layer dynamics. The surface NO2 presents two peaks during the daytime, which is a typical diurnal pattern in urban areas. The first peak is driven by the increased NOx emissions in the morning, which aligns closely with the increases in NO. As a result of enhanced photolysis, the NO2 concentrations at PD decrease quickly after the first peak, accompanied by increases in surface O3 concentrations (Figure 4). After reaching the minimum during 12:00–14:00 LST, the surface NO2 concentration re-increases due to weakened photolysis and reaches the second peak during the evening rush hour. In summer, NO2 at SHT is observed to present a similar magnitude and variations as those near the surface after the appearance of the delayed morning peak. The observational evidence suggests a likely uniform mixing of air pollutants between the surface and the SHT layer. The more efficient upward transport of surface air pollutants is also supported by the significant enhancement of the OCR (Figure 5) and the earlier inclusion of SHT in the daytime convective ML (Figure 2). In MAM and DJF, the NO2 concentrations are observed to be consistent after the morning peak, indicating relatively weak NO2 photolysis and less effects of surface sources.
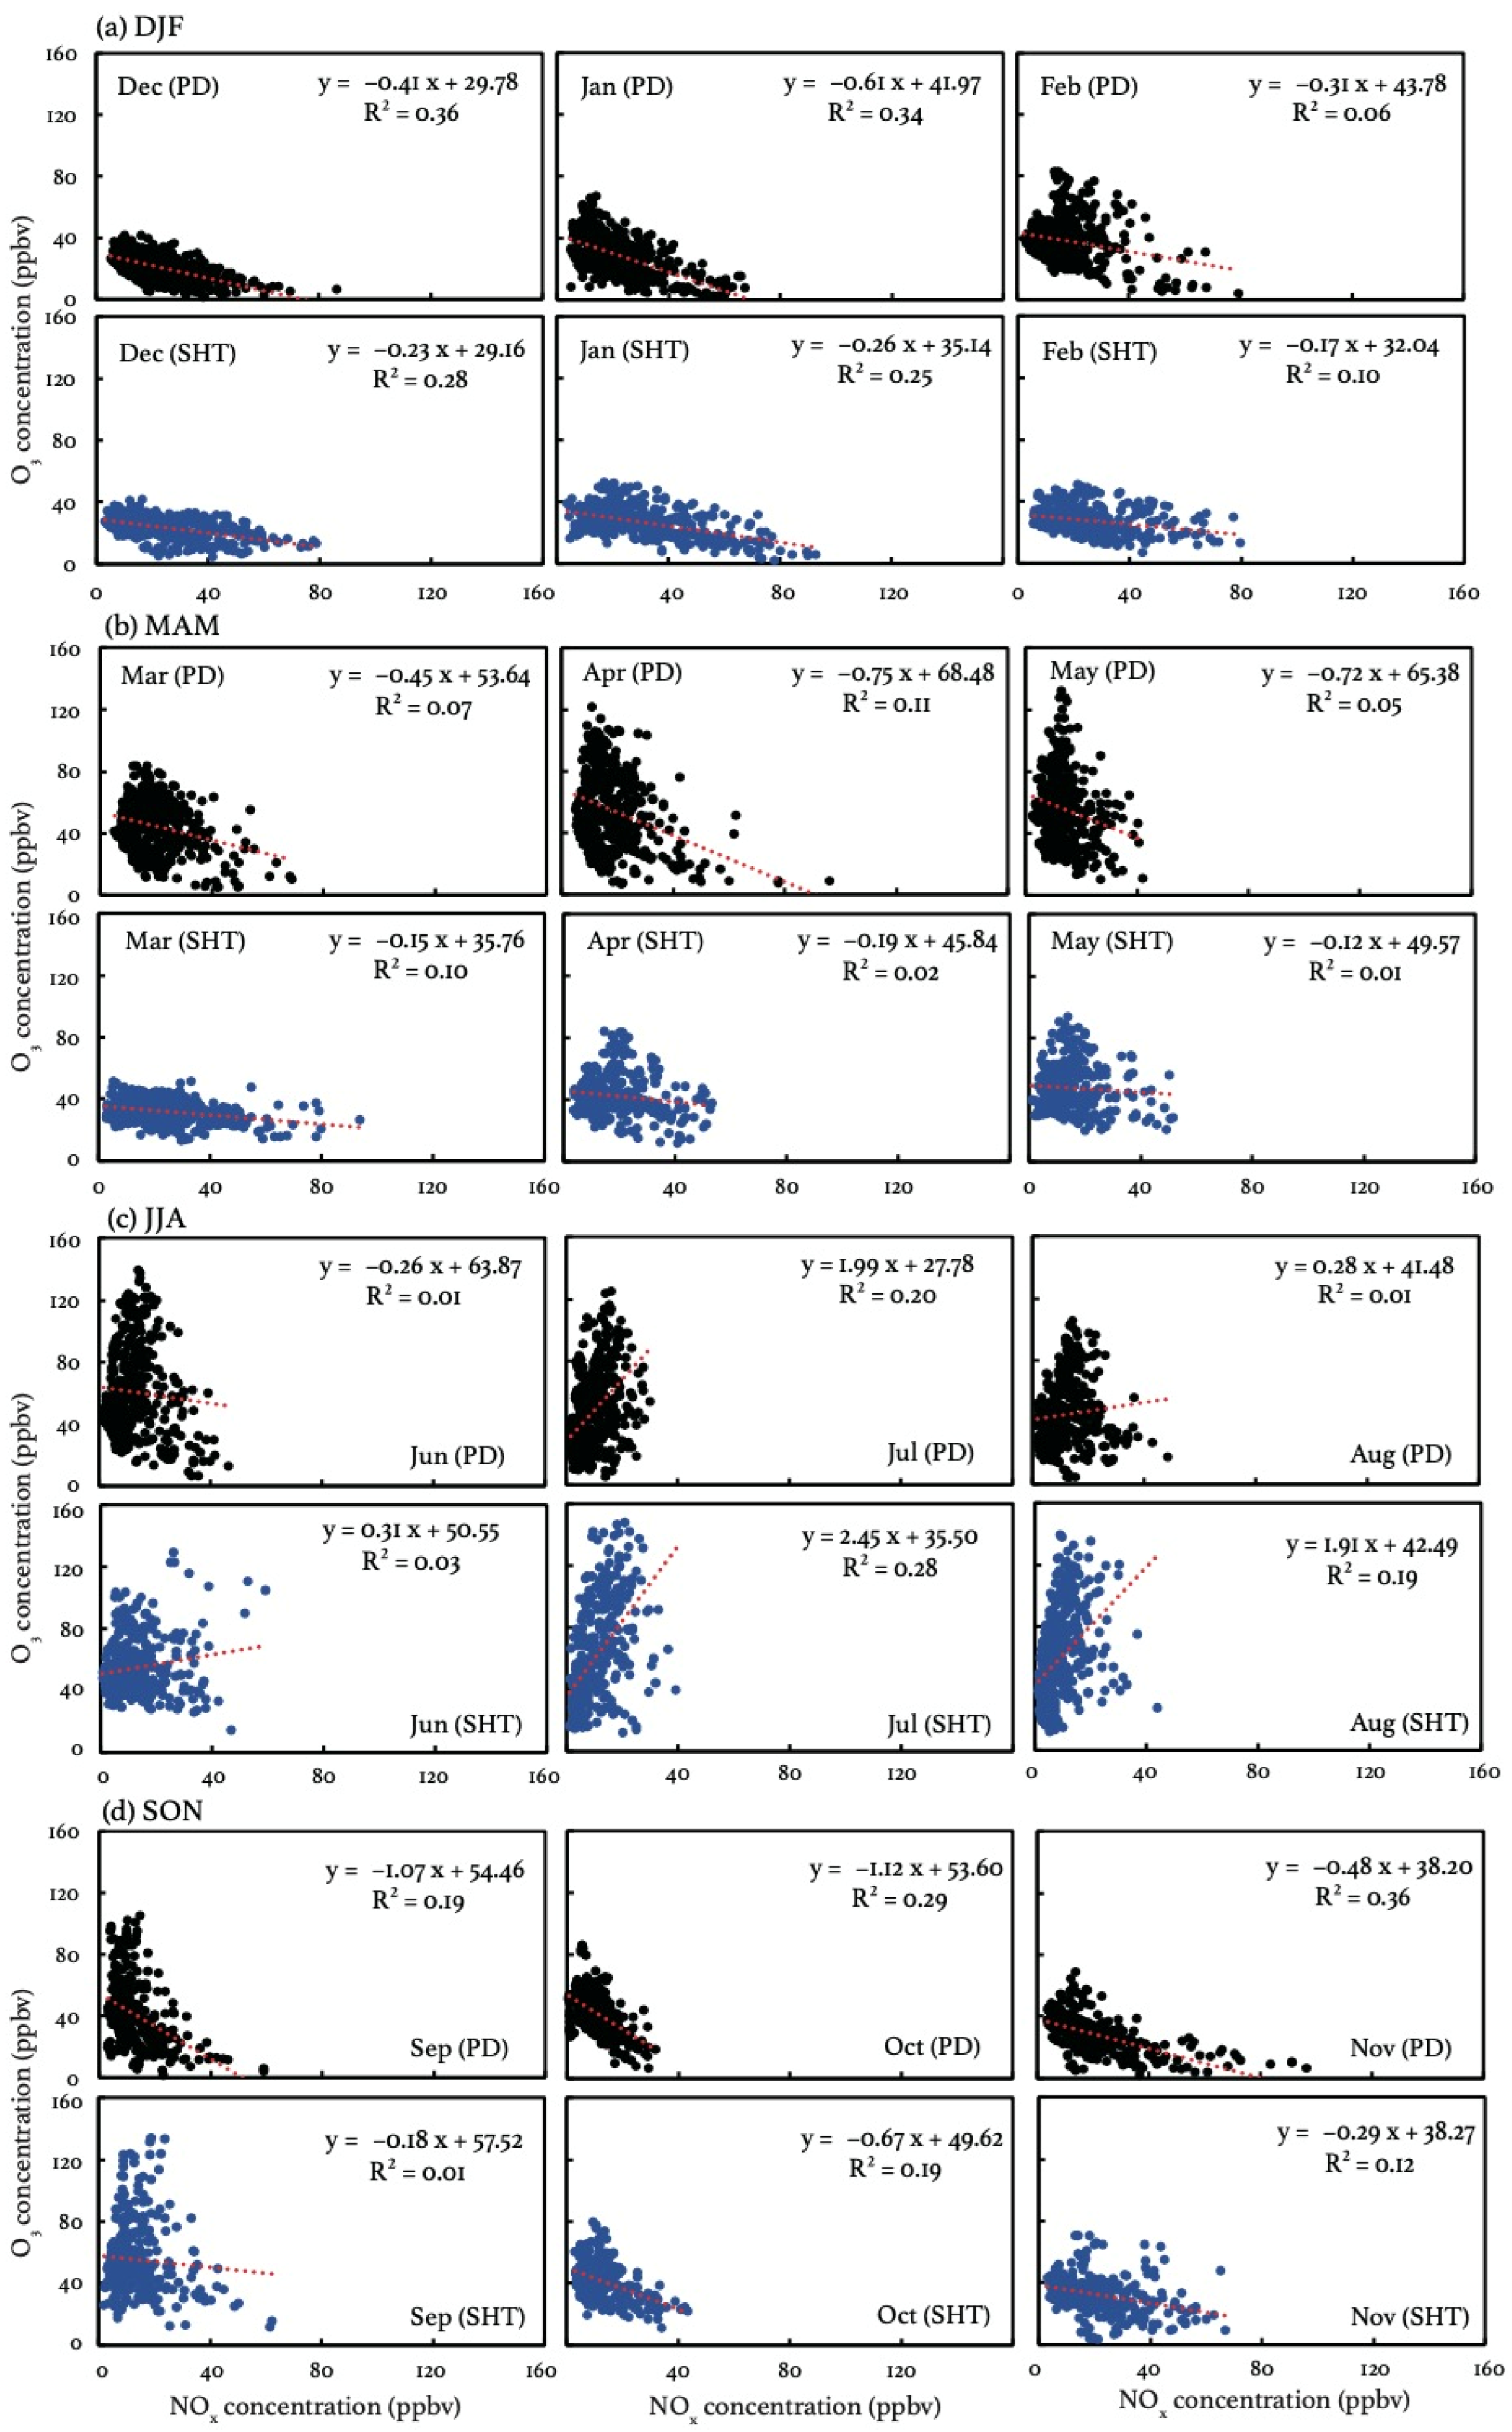
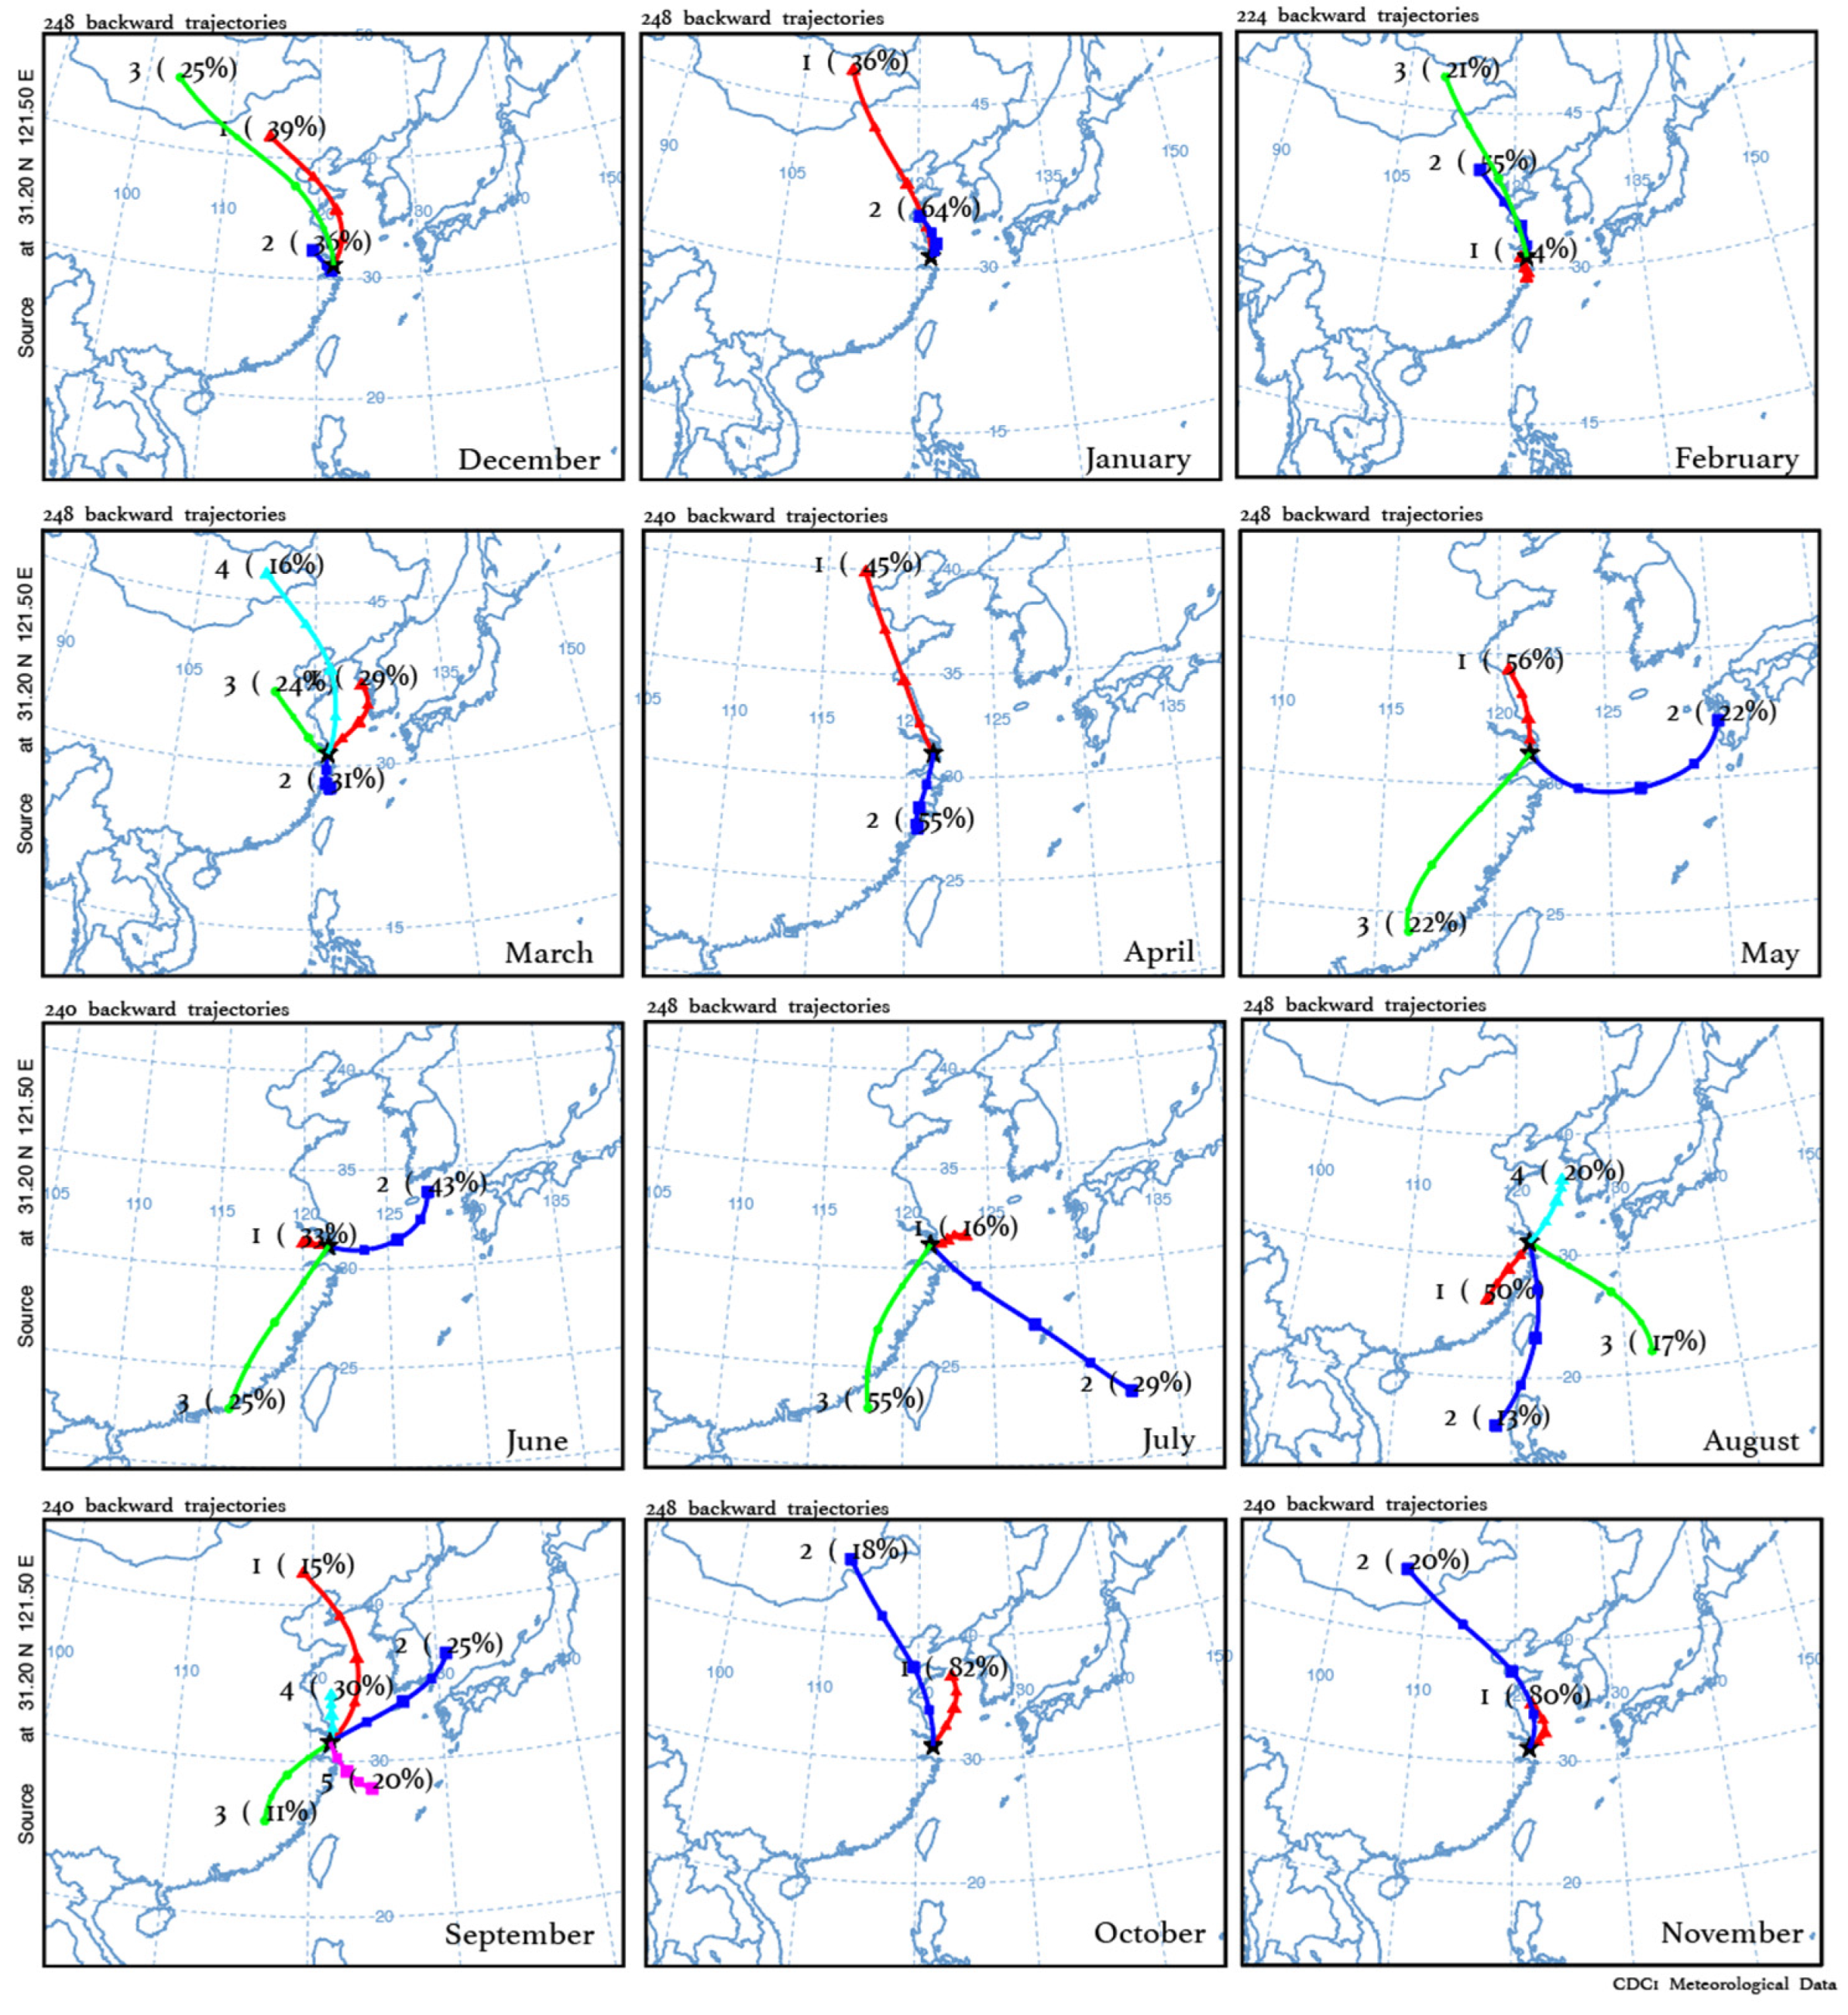
Even though the vertical exchange has been proved to be sufficient in summer, it can still not explain well the observed potential differences in daytime O3 production between the surface and the SHT layer. Figure 6 compares the relationship between O3 and NOx at PD and SHT. The results, considering only nonrainy periods, are displayed in Figure S2, exhibiting little difference from Figure 6 due to the low solubility of O3 and NOx. As VOC measurements are not available in this study, the observed O3-NOx relationship can reflect the relative role of these two major precursors in the formation of O3. The observational evidence shows that O3 and NOx concentrations present negative correlations in cold months at both PD and SHT, suggesting that O3 production is inhibited by increased NOx concentrations. The negative O3-NOx correlation elucidates why the wintertime O3 production is not significant at SHT, even during the daytime when the surface NOx can be transported upward by the weak vertical mixings. In addition to high NOx emissions [60], the atmospheric composition at SHT is more affected by air masses from north China in cold months, according to the back trajectory results (Figure 7). The influx of polluted north winds carries NOx-saturated air, which increases the ambient NOx/VOCs ration and thereby reinforces the NOx-saturated O3 formation [7,61]. In warm months, the negative O3-NOx relationship is observed to be weak. Instead, O3 concentrations tend to exhibit positive correlations with NOx, with the most significant positive correlations observed in July. Compared to those near the surface, O3 concentrations at SHT present a more sensitive response (2.45 ppb−1) to NOx changes, indicating that O3 formation is more limited by NOx in the upper layer. The result explains why a similar magnitude of NOx results in more O3 production at SHT than PD, and the observed large OD during the summertime. The back trajectory results suggest that the influence from southwest winds intensifies during the summertime, accounting for 50–55% of the total flows affecting the SHT region. These southwest flows have been proved to be abundant in biogenic VOCs as they traverse extensive forested areas, which are conducive to the production of hydrogen radicals in warm months [62].
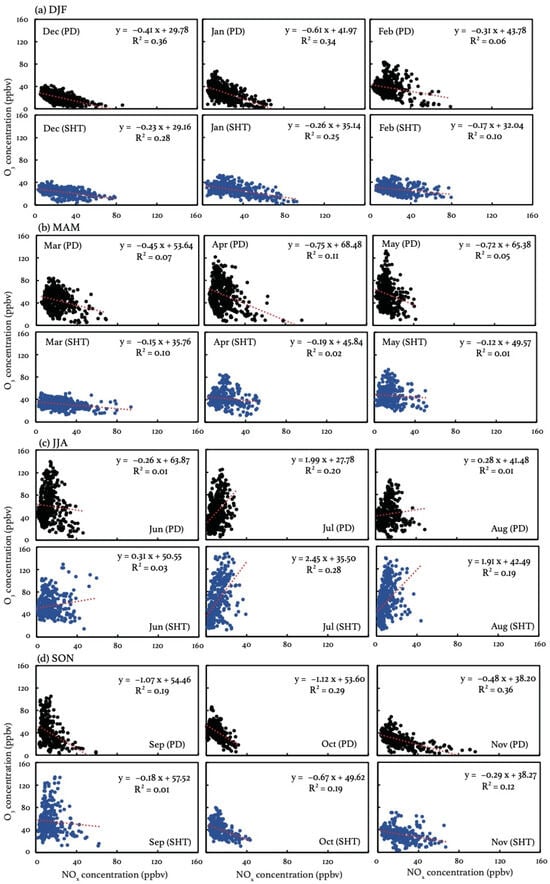
Figure 6.
The scatter plots of monthly mean O3 (y axis) and NOx (x axis) concentrations during the daytime (09:00–16:00 LST) in (a) DJF, (b) MAM, (c) JJA, and (d) SON during 2017–2018.
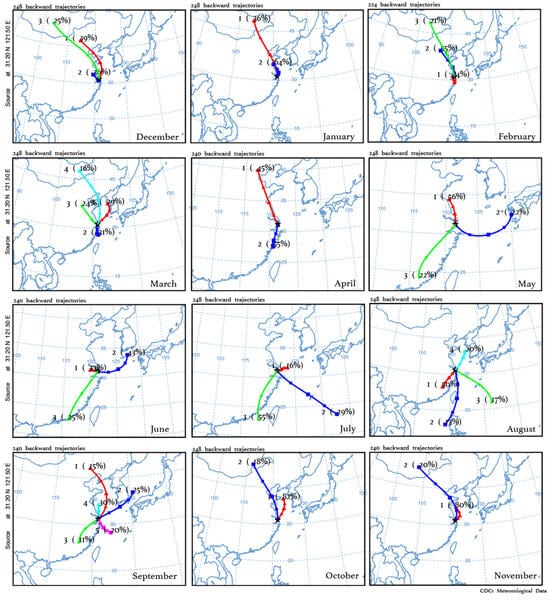
Figure 7.
The 48 h backward trajectory cluster results during each month in 2017 and 2018 using the Hybrid Single-Particle Lagrangian Integrated Trajectory (HYSPLIT) model driven by the reanalysis data (2° × 2.5°) provided by the National Centers for Environmental Prediction (NCEP) and the National Center for Atmospheric Research (NCAR). The starting location is where SHT locates (31.2° N, 121.5° E, 600 m) the percentage of each group in the total number of flows are marked in each figure.
4. Conclusions
In this study, we characterize O3 variations at a high-altitude monitoring site, SHT, based on measurements from a 2-year continuous period and discuss the potential impacts of the vertical exchange of air pollutants on the O3 air quality within the urban PBL in Shanghai. SHT is located in the ML during the daytime and above the NBL during the nighttime, where the observations provide a unique proxy to study the different characteristics of O3 and its precursors in different PBL structures.
The daytime O3 concentrations at SHT are observed to be higher than the surface ones in warm months, indicating that the vertical exchange tends to result in downward O3 flux, thereby aggravating surface pollution. During this period, vertical mixing is observed to be more efficient, resulting in a substantial amount of surface O3 precursors transported upward to the SHT layer. The O3 formation at SHT is observed to more limited by NOx compared to the surface, resulting in increased O3 production when a similar amount of NOx is presented. The prevailing southwest winds which are abundant in biogenic VOCs contribute to the NOx-limited formation in the urban PBL as well. In contrast, the daytime O3 at SHT is observed to exhibit lower levels than the surface O3 in cold months. During this period, the O3 formation is observed to be inhibited by NOx increases at both PD and SHT. As the vertical mixings are weak, O3 at SHT thus exhibits little response to surface sources. The daytime vertical mixings are more likely to mitigate surface O3 pollution due to the negative vertical gradient of O3.
Additionally, the observations provide direct evidence of the O3 entrainments in the morning. A nighttime O3 reservoir layer and consistent negative OCR during 05:00–07:00 LST at SHT are detected all year round. Limited by the means of these measurements, we might not be able to quantify the impacts of these vertical exchanges on surface air quality based on the current dataset. However, our results provide observational evidence that vertical mixings, either in the morning or during the daytime, can occur within the initial layer (~600 m) of air quality models. To enhance our understanding of the vertical transport processes of O3 and other related species, additional measurements in different boundary layers, encompassing a broader range of species and meteorological parameters, are essential. There is also an increasing need for improved vertical resolution under 900 mb in air quality models to better represent these processes.
Supplementary Materials
The following supporting information can be downloaded at: https://www.mdpi.com/article/10.3390/atmos15030248/s1, Figure S1: Similar results as Figure 3 but with measurements only during nonrainy periods; Figure S2: Similar results as Figure 6 but with measurements only during nonrainy periods.
Author Contributions
Conceptualization, Y.G. and J.X.; methodology, Y.G. and J.X.; validation, F.Y., J.X., C.Y., L.P. and W.G.; formal analysis, Y.G. and J.X.; investigation, Y.G. and J.X.; resources, J.X.; data curation, F.Y., C.Y., L.P. and W.G.; writing—original draft preparation, Y.G.; writing—review and editing, Y.G., J.X. and H.L.; visualization, Y.G.; project administration, J.X.; funding acquisition, Y.G. and C.Y. All authors have read and agreed to the published version of the manuscript.
Funding
This research was funded by the National Natural Science Foundation of China, grant number 42205189, Natural Science Foundation of Shanghai, grant number 22ZR1467500, and Shanghai Sailing Program, grant no. 21YF1412400.
Institutional Review Board Statement
Not applicable.
Informed Consent Statement
Not applicable.
Data Availability Statement
The data presented in this study are available on request from the corresponding author. The data are not publicly available due to the data protection regulation of Shanghai Meteorological Service.
Acknowledgments
We acknowledge all the anonymous reviewers for their comments to improve the original manuscript.
Conflicts of Interest
The authors declare no conflicts of interest.
References
- Unger, N.; Zheng, Y.; Yue, X.; Harper, K.L. Mitigation of Ozone Damage to the World’s Land Ecosystems by Source Sector. Nat. Clim. Chang. 2020, 10, 134–137. [Google Scholar] [CrossRef]
- Fuhrer, J.; Martin, M.V.; Mills, G.; Heald, C.L.; Harmens, H.; Hayes, F.; Sharps, K.; Bender, J.; Ashmore, M.R. Current and Future Ozone Risks to Global Terrestrial Biodiversity and Ecosystem Processes. Ecol. Evol. 2016, 6, 8785–8799. [Google Scholar] [CrossRef]
- Gu, Y.; Henze, D.K.; Nawaz, M.O.; Wagner, U.J. Response of the Ozone-Related Health Burden in Europe to Changes in Local Anthropogenic Emissions of Ozone Precursors. Environ. Res. Lett. 2023, 18, 114034. [Google Scholar] [CrossRef]
- Gu, Y.; Li, K.; Xu, J.; Liao, H.; Zhou, G. Observed Dependence of Surface Ozone on Increasing Temperature in Shanghai, China. Atmos. Environ. 2020, 221, 117108. [Google Scholar] [CrossRef]
- Action Plan on Air Pollution Prevention and Control. Available online: http://www.gov.cn/zwgk/2013-09/12/content_2486773.htm (accessed on 13 October 2022). (In Chinese)
- Lu, X.; Zhang, L.; Chen, Y.; Zhou, M.; Zheng, B.; Li, K.; Liu, Y.; Lin, J.; Fu, T.-M.; Zhang, Q. Exploring 2016–2017 Surface Ozone Pollution over China: Source Contributions and Meteorological Influences. Atmos. Chem. Phys. 2019, 19, 8339–8361. [Google Scholar] [CrossRef]
- Gu, Y.; Yan, F.; Xu, J.; Qu, Y.; Gao, W.; He, F.; Liao, H. A Measurement and Model Study on Ozone Characteristics in Marine Air at a Remote Island Station and Its Interaction with Urban Ozone Air Quality in Shanghai, China. Atmos. Chem. Phys. 2020, 20, 14361–14375. [Google Scholar] [CrossRef]
- Li, K.; Jacob, D.J.; Liao, H.; Shen, L.; Zhang, Q.; Bates, K.H. Anthropogenic Drivers of 2013–2017 Trends in Summer Surface Ozone in China. Proc. Natl. Acad. Sci. USA 2019, 116, 422–427. [Google Scholar] [CrossRef] [PubMed]
- Liu, H.; Liu, S.; Xue, B.; Lv, Z.; Meng, Z.; Yang, X.; Xue, T.; Yu, Q.; He, K. Ground-Level Ozone Pollution and Its Health Impacts in China. Atmos. Environ. 2018, 173, 223–230. [Google Scholar] [CrossRef]
- Zhu, B.; Kang, H.; Zhu, T.; Su, J.; Hou, X.; Gao, J. Impact of Shanghai Urban Land Surface Forcing on Downstream City Ozone Chemistry. J. Geophys. Res.-Atmos. 2015, 120, 4340–4351. [Google Scholar] [CrossRef]
- Xie, M.; Liao, J.; Wang, T.; Zhu, K.; Zhuang, B.; Han, Y.; Li, M.; Li, S. Modeling of the Anthropogenic Heat Flux and Its Effect on Regional Meteorology and Air Quality over the Yangtze River Delta Region, China. Atmos. Chem. Phys. 2016, 16, 6071–6089. [Google Scholar] [CrossRef]
- Huszár, P.; Karlický, J.; Belda, M.; Halenka, T.; Pišoft, P. The Impact of Urban Canopy Meteorological Forcing on Summer Photochemistry. Atmos. Environ. 2018, 176, 209–228. [Google Scholar] [CrossRef]
- Huszár, P.; Karlický, J.; Ďoubalová, J.; Šindelářová, K.; Nováková, T.; Belda, M.; Halenka, T.; Žák, M.; Pišoft, P. Urban Canopy Meteorological Forcing and Its Impact on Ozone and PM2.5: Role of Vertical Turbulent Transport. Atmos. Chem. Phys. 2020, 20, 1977–2016. [Google Scholar] [CrossRef]
- Oke, T.R. The Energetic Basis of the Urban Heat Island. Q. J. R. Meteorol. Soc. 1982, 108, 1–24. [Google Scholar] [CrossRef]
- Stutz, J.; Alicke, B.; Ackermann, R.; Geyer, A.; White, A.; Williams, E. Vertical Profiles of NO3, N2O5, O3, and NOx in the Nocturnal Boundary Layer: 1. Observations during the Texas Air Quality Study 2000. J. Geophys. Res. 2004, 109, 2003JD004209. [Google Scholar] [CrossRef]
- Sarrat, C.; Lemonsu, A.; Masson, V.; Guedalia, D. Impact of Urban Heat Island on Regional Atmospheric Pollution. Atmos. Environ. 2006, 40, 1743–1758. [Google Scholar] [CrossRef]
- Ryu, Y.-H.; Baik, J.-J.; Kwak, K.-H.; Kim, S.; Moon, N. Impacts of Urban Land-Surface Forcing on Ozone Air Quality in the Seoul Metropolitan Area. Atmos. Chem. Phys. 2013, 13, 2177–2194. [Google Scholar] [CrossRef]
- Martilli, A. On the Impact of Urban Surface Exchange Parameterisations on Air Quality Simulations: The Athens Case. Atmos. Environ. 2003, 37, 4217–4231. [Google Scholar] [CrossRef]
- Wang, X.; Chen, F.; Wu, Z.; Zhang, M.; Tewari, M.; Guenther, A.; Wiedinmyer, C. Impacts of Weather Conditions Modified by Urban Expansion on Surface Ozone: Comparison between the Pearl River Delta and Yangtze River Delta Regions. Adv. Atmos. Sci. 2009, 26, 962–972. [Google Scholar] [CrossRef]
- Struzewska, J.; Kaminski, J.W. Impact of Urban Parameterization on High Resolution Air Quality Forecast with the GEM—AQ Model. Atmos. Chem. Phys. 2012, 12, 10387–10404. [Google Scholar] [CrossRef]
- Liao, J.; Wang, T.; Jiang, Z.; Zhuang, B.; Xie, M.; Yin, C.; Wang, X.; Zhu, J.; Fu, Y.; Zhang, Y. WRF/Chem Modeling of the Impacts of Urban Expansion on Regional Climate and Air Pollutants in Yangtze River Delta, China. Atmos. Environ. 2015, 106, 204–214. [Google Scholar] [CrossRef]
- Wei, W.; Zhang, H.; Wu, B.; Huang, Y.; Cai, X.; Song, Y.; Li, J. Intermittent Turbulence Contributes to Vertical Dispersion of PM2.5 in the North China Plain: Cases from Tianjin. Atmos. Chem. Phys. 2018, 18, 12953–12967. [Google Scholar] [CrossRef]
- Zhang, J.; Rao, S.T. The Role of Vertical Mixing in the Temporal Evolution of Ground-Level Ozone Concentrations. J. Appl. Meteor. 1999, 38, 1674–1691. [Google Scholar] [CrossRef]
- Zhao, W.; Tang, G.; Yu, H.; Yang, Y.; Wang, Y.; Wang, L.; An, J.; Gao, W.; Hu, B.; Cheng, M.; et al. Evolution of Boundary Layer Ozone in Shijiazhuang, a Suburban Site on the North China Plain. J. Environ. Sci. 2019, 83, 152–160. [Google Scholar] [CrossRef]
- He, G.; Deng, T.; Wu, D.; Wu, C.; Huang, X.; Li, Z.; Yin, C.; Zou, Y.; Song, L.; Ouyang, S.; et al. Characteristics of Boundary Layer Ozone and Its Effect on Surface Ozone Concentration in Shenzhen, China: A Case Study. Sci. Total Environ. 2021, 791, 148044. [Google Scholar] [CrossRef] [PubMed]
- Brown, S.S.; Dubé, W.P.; Tham, Y.J.; Zha, Q.; Xue, L.; Poon, S.; Wang, Z.; Blake, D.R.; Tsui, W.; Parrish, D.D.; et al. Nighttime Chemistry at a High Altitude Site above Hong Kong. J. Geophys. Res.-Atmos. 2016, 121, 2457–2475. [Google Scholar] [CrossRef]
- Prabhakar, G.; Parworth, C.L.; Zhang, X.; Kim, H.; Young, D.E.; Beyersdorf, A.J.; Ziemba, L.D.; Nowak, J.B.; Bertram, T.H.; Faloona, I.C.; et al. Observational Assessment of the Role of Nocturnal Residual-Layer Chemistry in Determining Daytime Surface Particulate Nitrate Concentrations. Atmos. Chem. Phys. 2017, 17, 14747–14770. [Google Scholar] [CrossRef]
- Yang, S.; Yuan, B.; Peng, Y.; Huang, S.; Chen, W.; Hu, W.; Pei, C.; Zhou, J.; Parrish, D.D.; Wang, W.; et al. The Formation and Mitigation of Nitrate Pollution: Comparison between Urban and Suburban Environments. Atmos. Chem. Phys. 2022, 22, 4539–4556. [Google Scholar] [CrossRef]
- He, C.; Lu, X.; Wang, H.; Wang, H.; Li, Y.; He, G.; He, Y.; Wang, Y.; Zhang, Y.; Liu, Y.; et al. The Unexpected High Frequency of Nocturnal Surface Ozone Enhancement Events over China: Characteristics and Mechanisms. Atmos. Chem. Phys. 2022, 22, 15243–15261. [Google Scholar] [CrossRef]
- Wu, Y.; Chen, W.; You, Y.; Xie, Q.; Jia, S.; Wang, X. Quantitative Impacts of Vertical Transport on the Long-Term Trend of Nocturnal Ozone Increase over the Pearl River Delta Region during 2006–2019. Atmos. Chem. Phys. 2023, 23, 453–469. [Google Scholar] [CrossRef]
- Wang, X.M.; Lin, W.S.; Yang, L.M.; Deng, R.R.; Lin, H. A Numerical Study of Influences of Urban Land-Use Change on Ozone Distribution over the Pearl River Delta Region, China. Tellus B 2007, 59, 633. [Google Scholar] [CrossRef]
- Morris, G.A.; Ford, B.; Rappenglück, B.; Thompson, A.M.; Mefferd, A.; Ngan, F.; Lefer, B. An Evaluation of the Interaction of Morning Residual Layer and Afternoon Mixed Layer Ozone in Houston Using Ozonesonde Data. Atmos. Environ. 2010, 44, 4024–4034. [Google Scholar] [CrossRef]
- Ma, Z.; Xu, H.; Meng, W.; Zhang, X.; Xu, J.; Liu, Q.; Wang, Y. Vertical Ozone Characteristics in Urban Boundary Layer in Beijing. Environ. Monit. Assess 2013, 185, 5449–5460. [Google Scholar] [CrossRef]
- Klein, P.M.; Hu, X.-M.; Xue, M. Impacts of Mixing Processes in Nocturnal Atmospheric Boundary Layer on Urban Ozone Concentrations. Bound.-Lay. Meteorol. 2014, 150, 107–130. [Google Scholar] [CrossRef]
- Li, Y.; Zhang, J.; Sailor, D.J.; Ban-Weiss, G.A. Effects of Urbanization on Regional Meteorology and Air Quality in Southern California. Atmos. Chem. Phys. 2019, 19, 4439–4457. [Google Scholar] [CrossRef]
- He, G.; He, C.; Wang, H.; Lu, X.; Pei, C.; Qiu, X.; Liu, C.; Wang, Y.; Liu, N.; Zhang, J.; et al. Nighttime Ozone in the Lower Boundary Layer: Insights from 3-Year Tower-Based Measurements in South China and Regional Air Quality Modeling. Atmos. Chem. Phys. 2023, 23, 13107–13124. [Google Scholar] [CrossRef]
- Zhu, X.; Ma, Z.; Qiu, Y.; Liu, H.; Liu, Q.; Yin, X. An Evaluation of the Interaction of Morning Residual Layer Ozone and Mixing Layer Ozone in Rural Areas of the North China Plain. Atmos. Res. 2020, 236, 104788. [Google Scholar] [CrossRef]
- Lin, C.-H.; Wu, Y.-L.; Lai, C.-H. Ozone Reservoir Layers in a Coastal Environment—A Case Study in Southern Taiwan. Atmos. Chem. Phys. 2010, 10, 4439–4452. [Google Scholar] [CrossRef]
- Sun, Y.; Wang, Y.; Zhang, C. Vertical Observations and Analysis of PM2.5, O3, and NO x at Beijing and Tianjin from Towers during Summer and Autumn 2006. Adv. Atmos. Sci. 2010, 27, 123–136. [Google Scholar] [CrossRef]
- Liu, Y.; Tang, G.; Liu, B.; Zhang, X.; Li, Q.; Hu, Q.; Wang, Y.; Yu, M.; Sun, Y.; Ji, D.; et al. Decadal Changes in Ozone in the Lower Boundary Layer over Beijing, China. Atmos. Environ. 2022, 275, 119018. [Google Scholar] [CrossRef]
- Tang, G.; Zhang, J.; Zhu, X.; Song, T.; Münkel, C.; Hu, B.; Schäfer, K.; Liu, Z.; Zhang, J.; Wang, L.; et al. Mixing Layer Height and Its Implications for Air Pollution over Beijing, China. Atmos. Chem. Phys. 2016, 16, 2459–2475. [Google Scholar] [CrossRef]
- Han, S.; Liu, J.; Hao, T.; Zhang, Y.; Li, P.; Yang, J.; Wang, Q.; Cai, Z.; Yao, Q.; Zhang, M.; et al. Boundary Layer Structure and Scavenging Effect during a Typical Winter Haze-Fog Episode in a Core City of BTH Region, China. Atmos. Environ. 2018, 179, 187–200. [Google Scholar] [CrossRef]
- Li, L.; Lu, C.; Chan, P.-W.; Zhang, X.; Yang, H.-L.; Lan, Z.-J.; Zhang, W.-H.; Liu, Y.-W.; Pan, L.; Zhang, L. Tower Observed Vertical Distribution of PM2.5, O3 and NOx in the Pearl River Delta. Atmos. Environ. 2020, 220, 117083. [Google Scholar] [CrossRef]
- Li, X.-B.; Yuan, B.; Wang, S.; Wang, C.; Lan, J.; Liu, Z.; Song, Y.; He, X.; Huangfu, Y.; Pei, C.; et al. Variations and Sources of Volatile Organic Compounds (VOCs) in Urban Region: Insights from Measurements on a Tall Tower. Atmos. Chem. Phys. 2022, 22, 10567–10587. [Google Scholar] [CrossRef]
- Deng, X.; Li, F.; Li, Y.; Li, J.; Huang, H.; Liu, X. Vertical Distribution Characteristics of PM in the Surface Layer of Guangzhou. Particuology 2015, 20, 3–9. [Google Scholar] [CrossRef]
- Harrison, R.M.; Dall’Osto, M.; Beddows, D.C.S.; Thorpe, A.J.; Bloss, W.J.; Allan, J.D.; Coe, H.; Dorsey, J.R.; Gallagher, M.; Martin, C.; et al. Atmospheric Chemistry and Physics in the Atmosphere of a Developed Megacity (London): An Overview of the REPARTEE Experiment and Its Conclusions. Atmos. Chem. Phys. 2012, 12, 3065–3114. [Google Scholar] [CrossRef]
- Pan, L.; Xu, J.; Tie, X.; Mao, X.; Gao, W.; Chang, L. Long-Term Measurements of Planetary Boundary Layer Height and Interactions with PM2.5 in Shanghai, China. Atmos. Pollut. Res. 2019, 10, 989–996. [Google Scholar] [CrossRef]
- Li, X.-B.; Fan, G.; Lou, S.; Yuan, B.; Wang, X.; Shao, M. Transport and Boundary Layer Interaction Contribution to Extremely High Surface Ozone Levels in Eastern China. Environ. Pollut. 2021, 268, 115804. [Google Scholar] [CrossRef]
- Yin, C.; Xu, J.; Gao, W.; Pan, L.; Gu, Y.; Fu, Q.; Yang, F. Characteristics of Fine Particle Matters at the Top of Shanghai Tower. Atmos. Chem. Phys. 2023, 23, 1329–1343. [Google Scholar] [CrossRef]
- Hersbach, H.; Bell, B.; Berrisford, P.; Biavati, G.; Horányi, A.; Muñoz Sabater, J.; Nicolas, J.; Peubey, C.; Radu, R.; Rozum, I.; et al. ERA5 Hourly Data on Single Levels from 1979 to Present. 2018. Available online: https://cds.climate.copernicus.eu/cdsapp#!/dataset/reanalysis-era5-single-levels?tab=form (accessed on 14 January 2024).
- Seidel, D.J.; Zhang, Y.; Beljaars, A.; Golaz, J.; Jacobson, A.R.; Medeiros, B. Climatology of the Planetary Boundary Layer over the Continental United States and Europe. J. Geophys. Res. 2012, 117, 2012JD018143. [Google Scholar] [CrossRef]
- Kim, S.-W.; Yoon, S.-C.; Won, J.-G.; Choi, S.-C. Ground-Based Remote Sensing Measurements of Aerosol and Ozone in an Urban Area: A Case Study of Mixing Height Evolution and Its Effect on Ground-Level Ozone Concentrations. Atmos. Environ. 2007, 41, 7069–7081. [Google Scholar] [CrossRef]
- Haman, C.L.; Lefer, B.; Morris, G.A. Seasonal Variability in the Diurnal Evolution of the Boundary Layer in a Near-Coastal Urban Environment. J. Atmos. Ocean. Technol. 2012, 29, 697–710. [Google Scholar] [CrossRef]
- Peng, J.; Grimmond, C.S.B.; Fu, X.; Chang, Y.; Zhang, G.; Guo, J.; Tang, C.; Gao, J.; Xu, X.; Tan, J. Ceilometer-Based Analysis of Shanghai’s Boundary Layer Height (under Rain- and Fog-Free Conditions). J. Atmos. Ocean. Technol. 2017, 34, 749–764. [Google Scholar] [CrossRef]
- Kim, K.-Y. Diurnal and Seasonal Variation of Planetary Boundary Layer Height over East Asia and Its Climatic Change as Seen in the ERA-5 Reanalysis Data. SN Appl. Sci. 2022, 4, 39. [Google Scholar] [CrossRef]
- Dias-Júnior, C.Q.; Carneiro, R.G.; Fisch, G.; D’Oliveira, F.A.F.; Sörgel, M.; Botía, S.; Machado, L.A.T.; Wolff, S.; Santos, R.M.N.D.; Pöhlker, C. Intercomparison of Planetary Boundary Layer Heights Using Remote Sensing Retrievals and ERA5 Reanalysis over Central Amazonia. Remote Sens. 2022, 14, 4561. [Google Scholar] [CrossRef]
- Liu, N.; Zhou, S.; Liu, C.; Guo, J. Synoptic Circulation Pattern and Boundary Layer Structure Associated with PM2.5 during Wintertime Haze Pollution Episodes in Shanghai. Atmos. Res. 2019, 228, 186–195. [Google Scholar] [CrossRef]
- Geng, F.; Tie, X.; Xu, J.; Zhou, G.; Peng, L.; Gao, W.; Tang, X.; Zhao, C. Characterizations of Ozone, NOx, and VOCs Measured in Shanghai, China. Atmos. Environ. 2008, 42, 6873–6883. [Google Scholar] [CrossRef]
- Zhang, R.; Lei, W.; Tie, X.; Hess, P. Industrial Emissions Cause Extreme Urban Ozone Diurnal Variability. Proc. Natl. Acad. Sci. USA 2004, 101, 6346–6350. [Google Scholar] [CrossRef] [PubMed]
- Li, M.; Zhang, Q.; Kurokawa, J.; Woo, J.-H.; He, K.; Lu, Z.; Ohara, T.; Song, Y.; Streets, D.G.; Carmichael, G.R.; et al. MIX: A Mosaic Asian Anthropogenic Emission Inventory under the International Collaboration Framework of the MICS-Asia and HTAP. Atmos. Chem. Phys. 2017, 17, 935–963. [Google Scholar] [CrossRef]
- Yin, Q.; Ma, Q.; Lin, W.; Xu, X.; Yao, J. Measurement Report: Long-Term Variations in Surface NOx and SO2; Mixing Ratios from 2006 to 2016 at a Background Site in the Yangtze River Delta Region, China. Atmos. Chem. Phys. 2022, 22, 1015–1033. [Google Scholar] [CrossRef]
- Geng, F.; Tie, X.; Guenther, A.; Li, G.; Cao, J.; Harley, P. Effect of Isoprene Emissions from Major Forests on Ozone Formation in the City of Shanghai, China. Atmos. Chem. Phys. 2011, 11, 10449–10459. [Google Scholar] [CrossRef]
Disclaimer/Publisher’s Note: The statements, opinions and data contained in all publications are solely those of the individual author(s) and contributor(s) and not of MDPI and/or the editor(s). MDPI and/or the editor(s) disclaim responsibility for any injury to people or property resulting from any ideas, methods, instructions or products referred to in the content. |
© 2024 by the authors. Licensee MDPI, Basel, Switzerland. This article is an open access article distributed under the terms and conditions of the Creative Commons Attribution (CC BY) license (https://creativecommons.org/licenses/by/4.0/).

