Article

Nonlinear Calibration and Temperature Sensitivity of Makrofol Solid-State Nuclear Track Detectors for Radon Measurement

STUK—Radiation and Nuclear Safety Authority, Environmental Radiation Surveillance, 00811 Helsinki, Finland
*
Author to whom correspondence should be addressed.
Atmosphere 2024, 15(10), 1179; https://doi.org/10.3390/atmos15101179
Submission received: 9 September 2024 / Revised: 24 September 2024 / Accepted: 27 September 2024 / Published: 30 September 2024

Abstract

:
A key characteristic of a solid-state nuclear track detector (SSNTD) is that as more alpha tracks accumulate on the detector, the likelihood of track overlap will increase, making it difficult to distinguish individual events. This article presents the calibration of an in-house SSNTD using a Makrofol polycarbonate detector and electrochemical etching. The calibration employs a nonlinear log-logistic quantile function, which is nearly linear at low exposures but accounts for the reduced efficiency at high exposures due to overlapping alpha tracks. The function can be fitted to calibration measurements very accurately, eliminating systematic errors previously associated with the method at certain radon exposures. This article explores the uncertainties and detection limits associated with the calibration and outlines methods for their evaluation. Additionally, it includes a preliminary discussion on the method’s sensitivity to temperature.

1. Introduction

Solid-state nuclear track detectors (SSNTDs) offer several advantages for measuring radon in homes and conducting initial radon assessments in workplaces. These detectors are inexpensive, compact, lightweight, and free of fragile components, making them easy to mail to customers. They are particularly well-suited for long-term radon measurements, which determine the average radon concentration over an extended period [1]. In radon assessments, long-term measurements, ideally lasting a year, provide the most reliable method for evaluating long-term radon exposure [2].
Since the 1970s, STUK—the Radiation and Nuclear Safety Authority—has been conducting radon measurements in Finland using SSNTDs, based on an in-house design known as Radonpurkki in Finnish and Radonburken in Swedish. This detector utilized Makrofol plastic and electrochemical etching. The measured response is the number of tracks per unit area of the detector, i.e., track density. In this article, the unit used is tracks per square centimeter (cm−2). During calibration, it was observed that the response of Makrofol is linear at low radon exposures, but at higher exposures, the likelihood of track overlap increases, reducing the detector’s efficiency. This phenomenon has also been reported by López-Coto and Bolívar [3], who suggested fitting a polynomial function to address this issue. However, Miles [4] notes that nonlinearity affects only a very small portion of radon measurements.
At STUK, the calibration was originally performed using a piecewise-defined function: at low track densities, the response was assumed to be linear, while at higher track densities, a polynomial function was used. The calibration functions were designed to be continuous and continuously differentiable across the entire track density range.
When a new, larger-area in-house SSNTD design was introduced in 2016, it was found that the piecewise-defined calibration function produced systematic errors in certain track density ranges. As a result, the calibration method was revised, and the uncertainties associated with the results were re-evaluated to determine the detector-specific uncertainty for long-term radon concentration. The minimum and maximum measurable exposures for the detector were also established. This article presents STUK’s current calibration technique, the updated calibration function, and the method used for estimating the uncertainty budget.
STUK is responsible for regulating radon in workplaces in Finland and issues guidelines on how radon measurements should be conducted. Current regulations require that the initial radon investigation in workplaces use integrated SSNTD measurements lasting at least two months, carried out between September and May. If these measurements indicate radon concentrations exceeding the reference value of 300 Bq·m−3, further detailed assessments with continuous weekly measurements are required [5,6]. However, in many workplaces, indoor air conditions differ from those used in SSNTD calibrations. Pressyanov et al. [7] studied the solubility of radon in Makrofol at different temperatures and found that it varies with temperature. El-Sersy et al. [8] theoretically examined the calibration factor of an SSNTD and suggested that air density, which is influenced by air temperature and humidity, affects the range of alpha particles and, consequently, the calibration factor. Therefore, it became necessary to investigate the extent of measurement errors in workplaces with low indoor temperatures, sometimes below 4 °C. Such environments include meat processing plants, fish factories, and water treatment facilities.

2. Materials and Methods

2.1. SSNTD

The housing material of the SSNTD is electrically conductive polypropylene-based Pre Elec PP 1380 (Premix Group/Premix Oy, Rajamäki, Finland). The cylindrical housing has a diameter of 71 mm and a height of 20 mm, with a total weight of 41 g when ready for use. The Makrofol film (Covestro AG, Leverkusen, Germany), which measures 47 × 55 mm and has rounded edges to fit into the cylindrical housing, is positioned at the bottom of the housing and covered by a 19 µm thick aluminized Mylar MET800B (HIFI Polyester Film Limited, Stevenage, UK), which is held in place by a steel spring. The seam of the container serves as a diffusion barrier to prevent significant amounts of thoron from entering. The cross-interference from thoron (220Rn) for this detector has been measured at an average of 4.3% [9].
The etching times and temperatures have been optimized for Makrofol detectors exposed to radon at 21 °C. Pre-etching without an electric field lasts 75 min, followed by 120 min of etching with an alternating electric field at a frequency of 2 kHz. The etching is performed at a voltage of 720 V and a temperature of 40 °C. The films are removed from the heated cabinet immediately after etching. The etching solution consists of 1240–1244 g/L KOH mixed with 94% ethanol in a 1:1 ratio.
Track imaging is performed using a Leica M60 microscope and a Leica DFC 490 digital camera. Track counting is carried out with the Leica QWin Pro V 3.5.1 software, with parameters optimized for brightness, minimum acceptable track size, and exclusion of areas with defects such as scratches. The area analysed on the Makrofol detectors is 7.57 cm2, divided into 16 fields, each measuring 0.473 cm2. The closest surface of the detector to be analysed is 11 mm from the inner wall of the housing, so there is no significant difference in the track densities of the different fields. If the track density of an individual field deviates significantly (>3 σ) from the average, for instance due to a gas bubble formed during etching, that field is excluded from the final calculation of the average track density.

2.2. Radon Exposures

Radon exposures were conducted at STUK’s radon standard laboratory, which utilizes two 1.6-cubic-meter system for test atmospheres with radon (STAR) chambers operating on a flow-through principle [10]. Radon is generated by radon sources RF 200 and RF 4000, containing 226Ra activities of 200 kBq and 4 MBq, respectively (Eurostandard CZ, Prague, Czech Republic). The radon is transferred from the source to a P12R-6 pressure feed tank, which acts as a mixing chamber (Ecco Finishing AB, Skara, Sweden), using a Watson-Marlow 323 peristaltic pump (Watson-Marlow Fluid Technology Solutions, Falmouth, UK). Compressed air, sourced from the building’s rooftop and humidified with a P-100 on-line humidifier (Cellkraft AB, Stockholm, Sweden), is directed into the mixing chamber. The flow of compressed air is regulated by DPC47 mass flow controllers (Aalborg Instruments & Controls, Inc., Orangeburg, NY, USA). From the mixing chamber, radon-containing humidified air is directed into the radon chamber, where the temperature is regulated by a thermostat, and the air is circulated by a fan. The chamber’s exhaust ventilation is adjusted to maintain a pressure gradient of less than 0.2 Pa across the chamber shell.
The calibration exposures at 21 °C were conducted in two radon chambers: one with a radon concentration of 19,000 Bq·m−3 and the other with approximately 1500 Bq·m−3. Radon concentration in both chambers was monitored using two AlphaGuard radon monitors (Bertin Technologies, Aix-en-Provence, France), which were calibrated traceably to the primary standard of Physikalisch-Technische Bundesanstalt (Braunschweig, Germany). Chamber temperatures were monitored using HygroClip HC2A-S sensors (Rotronic Messgeräte GmbH, Ettlingen, Germany), calibrated at Finland’s national metrology institute, VTT Mikes. Atmospheric pressure was measured with a calibrated Swema 3000md barometer (Swema AB, Farsta, Sweden). A total of 23 different radon exposures were achieved by varying the exposure durations of the detectors in the chambers. The shortest exposure lasted 2 days, while the longest lasted 45 days. Each exposure involved 20 detectors. Additionally, 60 unexposed detectors were processed in the laboratory to determine the detector background.
The exposures at a temperature of 3.2 °C were performed at a radon concentration of approximately 8700 Bq·m−3, with exposure durations of 3, 6, and 14 days. Because the AlphaGuard reference instruments were not calibrated for such low temperatures, an initial 24 h measurement was conducted at 21 °C, after which the chamber temperature was lowered to 3.2 °C. As the radon production from the source remained constant, along with the airflow rate through the flow regulator, the mole fraction of radon gas in the chamber also remained constant. The radon activity concentration was thus determined by accounting for the air density during exposure. Air density itself can be calculated using temperature, air pressure, and absolute humidity measurements.
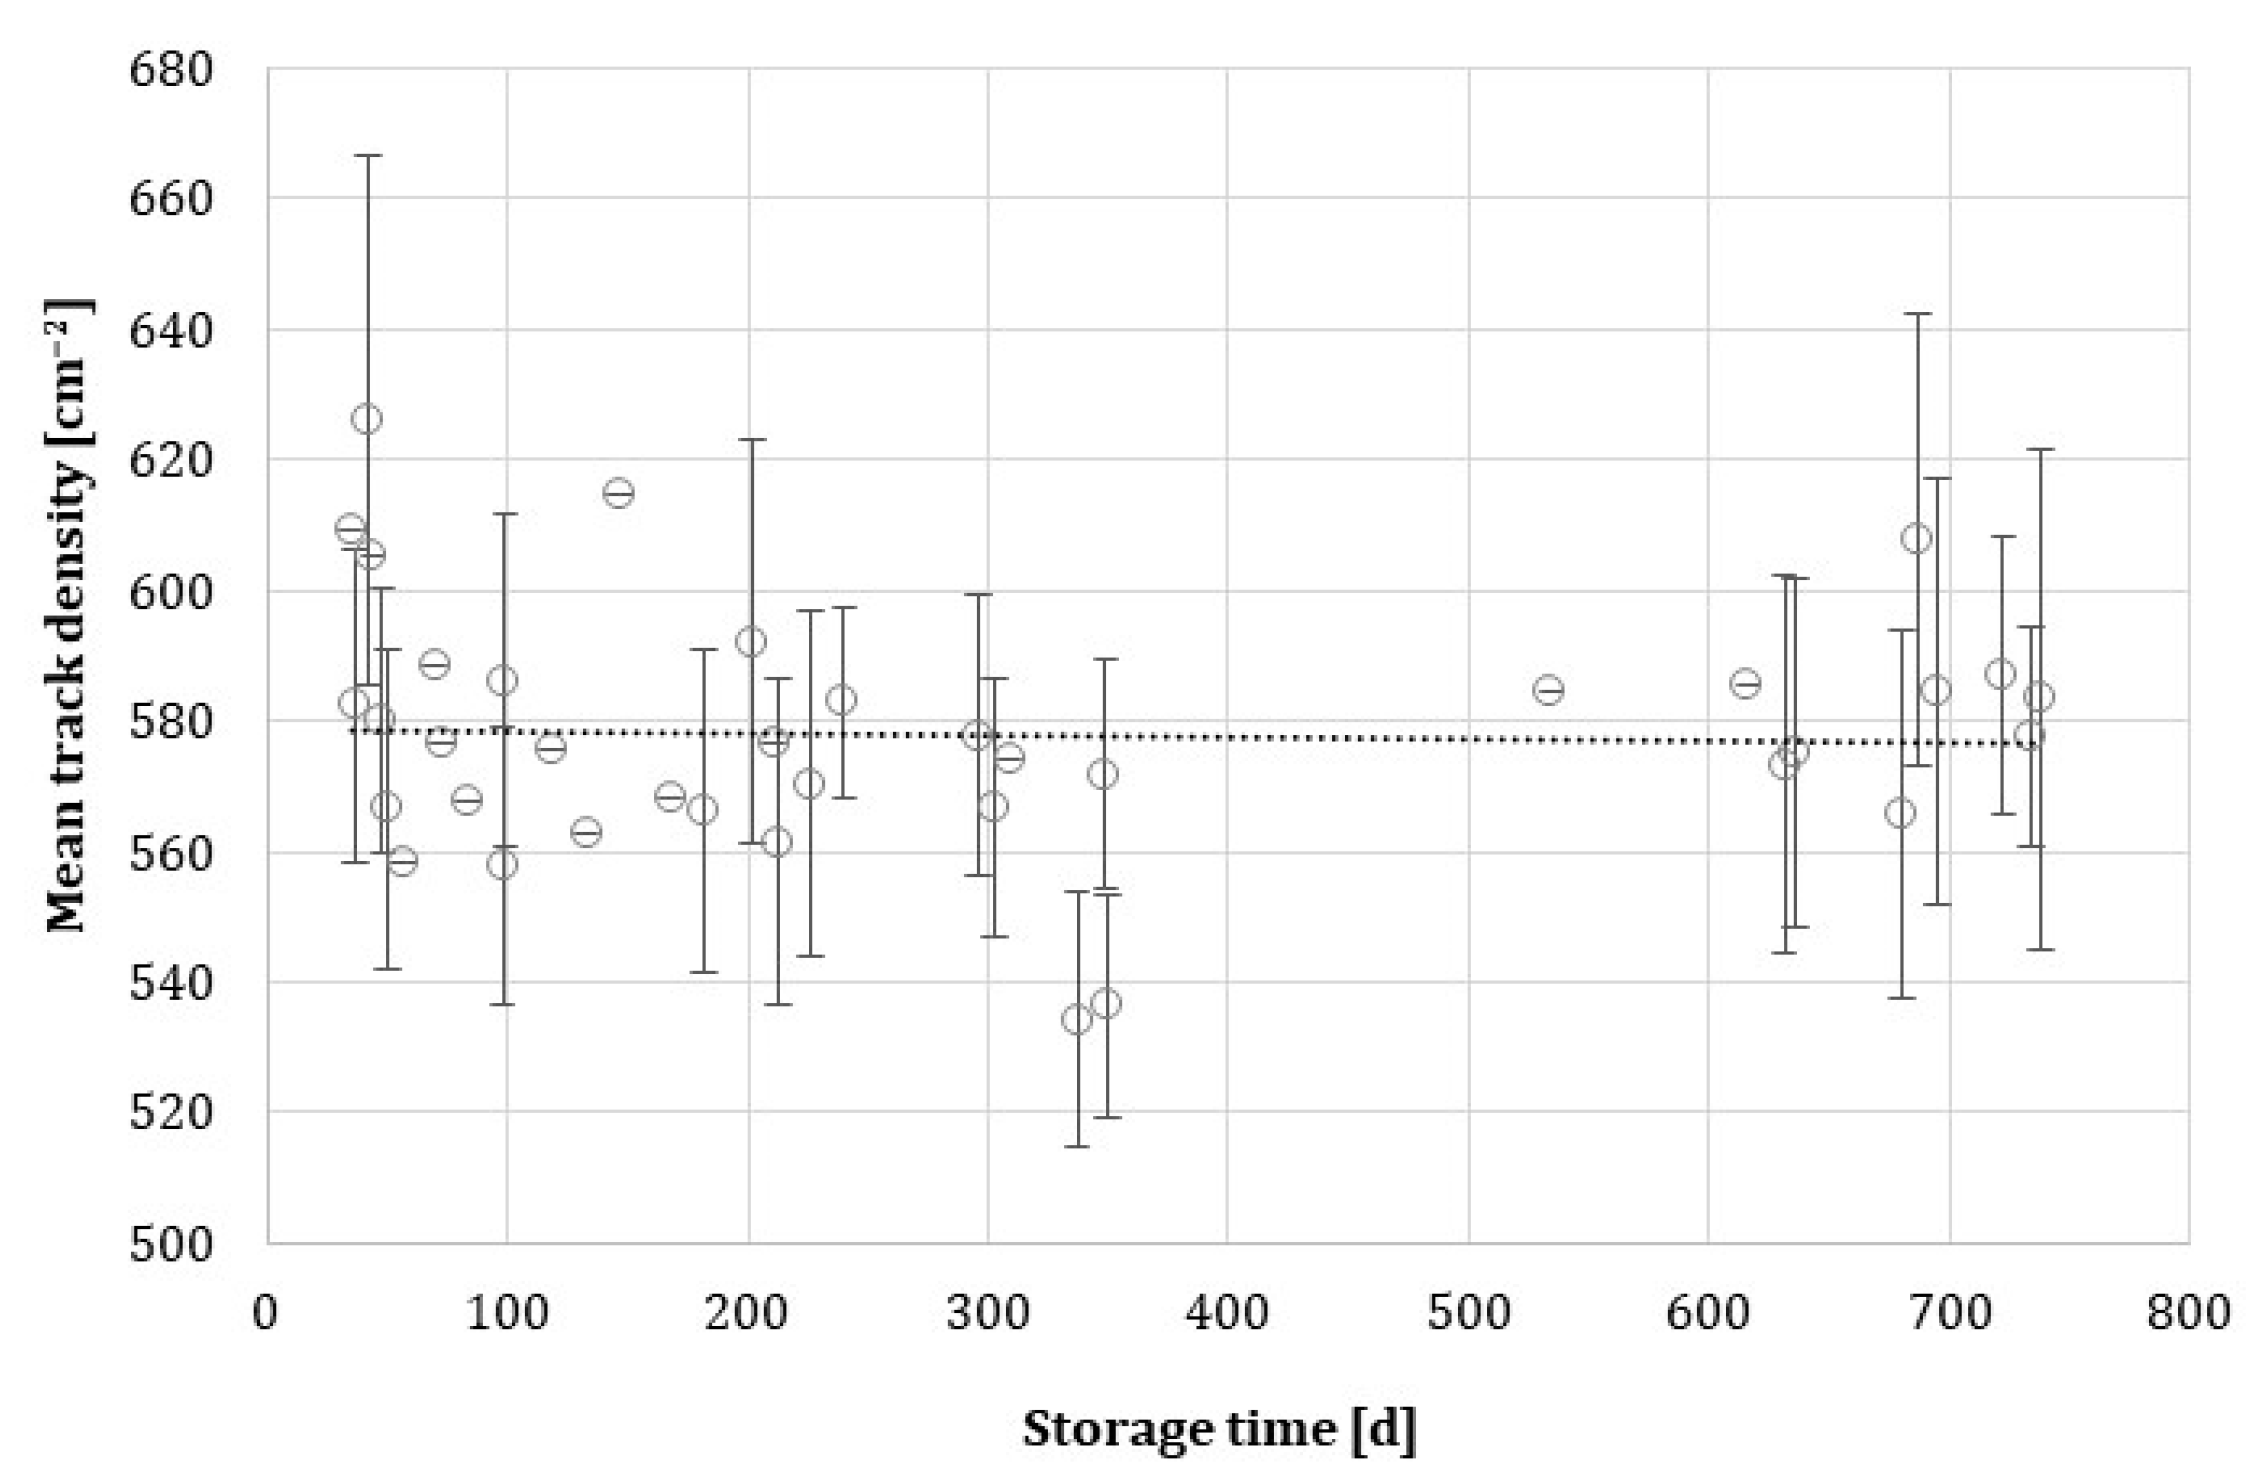
Thermal fading, an undesired phenomenon in long-term radon measurements, must be taken into account [11]. To investigate thermal fading in the Makrofol detectors, a large batch was exposed to 46,100 ± 1400 Bq·d·m−3 (k = 1) and stored in a radon-free atmosphere in airtight, thermally sealed radon-proof plastic bags for varying durations, up to 738 days, before etching and counting.
The calibration presented in this article at 21 °C is based on extensive calibration data from 2020. The exposures conducted to study temperature sensitivity were carried out in the spring of 2024.

2.3. Calibration

SSNTDs register alpha tracks, with the measurable variable being track density (number of tracks per unit area). This density is proportional to the time-integrated radon activity concentration, i.e., radon exposure. The average radon concentration is calculated by dividing the measured radon exposure by the exposure time.
For calibration, the quantile function of the log-logistic distribution (the inverse of the cumulative log-logistic distribution function) was used. Introducing an additional parameter increases the flexibility of the class of distribution functions [12]. The function was expressed in a form that scales with the maximum track density, m. Thus:
E ( d ) = h · m d 1 1 b
where E is the exposure (Bq·d·m−3), d is the net track density (cm−2), h is the half-value exposure at the maximum track density (Bq·d·m−3), m is the maximum track density (cm−2), and b is the shape parameter of the function. The net track density is the gross track density minus the background track density.
The average radon concentration, C, is calculated:
C = E ( d ) t
where t is the exposure time of the detectors.
The quantile function of the log-logistic distribution is nearly linear for small values of d. This can be demonstrated by setting b = −1, which yields:
E d = h · m d 1 1 = h · d m d
For small values of d (i.e., dm), this can be approximated by a linear function:
E d = h d m
The calibration function was fitted using the relative residual for each result, reflecting the deviation between the calibration function’s output and the actual measured exposure. The arithmetic mean of these residuals represents the mean systematic error of the fit, while their standard deviation indicates the standard uncertainty of the fit. To account for both, an optimization parameter was calculated as the sum of the squares of the mean and standard deviation of the residuals. The calibration function was fitted to observed data by minimizing the optimization parameter using the GRG Nonlinear engine in Microsoft Excel’s Solver feature.

2.4. Postal Background and Detection Limits

The magnitude of the background tracks accumulated during the return mailing of the detectors, referred to as the postal background, was estimated by sending 60 detectors to six different addresses across Finland. The delivery and return process for these detectors was conducted similarly to that for regular detectors. The detectors were mailed from STUK to contact persons in airtight, thermally sealed radon-proof bags. Each contact person opened the packages and returned the detectors in a paper envelope without a protective bag in two batches of five detectors each: one batch was sent at the beginning of the week to ensure delivery within the same week, while the other batch was in transit over the weekend. This resulted in 2 return batches from each location, totalling 12 batches.
The decision threshold and detection limit (minimum detectable exposure) were calculated according to standard ISO 11929-3 [13]. As there is no established standard for the maximum measurable exposure, it was determined by setting the maximum acceptable deviation of the results to 8% at the upper end of the measurement range.

2.5. Uncertainty Budget

Several sources of uncertainty are associated with the calculated exposures, including radioactive decay as a stochastic process, variations in detector housing size and material, inconsistencies in film quality, differences in etching solution preparation and conditions, and variability in track imaging. Additionally, the uncertainty in the calibration function is affected by the accuracy of the reference instrument used to determine the exposure of the calibration films. Imperfect fitting of the calibration function can also introduce systematic error.
The uncertainty associated with the gross track density, dg, denoted as u(dg), can be calculated based on the number of accepted fields on the detector and the number of tracks observed, using the following equation:
u d g = n q N q × 0.4734   cm 2 = d g 16 z × 0.4734   cm 2
where nq is the number of tracks in the accepted fields, Nq is the number of accepted fields, and z is the number of omitted fields reported by the software. Uncertainties related to the detector background and postal background are derived from their respective probability distributions.
Track density is reported as an integer by the software, providing a resolution of 1 cm−2. The uncertainty associated with this rectangular distribution is 0.289 cm−2, a value that remains constant across all track densities but has a diminishing impact at higher track densities.
To determine the additional random uncertainty from calibration, we account for both the relative systematic error urel(s) and the standard uncertainty of the fit urel(f), which are retrieved from the calibration process (optimization parameter). The standard uncertainty of the fit, urel(f), includes uncertainty due to the number of tracks on the detector (radioactivity as a stochastic process), u(dg) and u(dbg), as well as other random uncertainty urel(m). We estimate urel(m) by subtracting the standard uncertainty of the mean net track density urel( d ¯ ) from the standard uncertainty of the fit urel(f) obtained from the calibration, using the following equation:
u r e l m = u r e l 2 ( f ) u r e l 2 ( d ¯ )
Additionally, the relative uncertainty of the calibration coefficient of the reference radon measuring instrument, urel(ω), must be considered when calculating exposure. The exposure time (measurement duration) is always expressed as an integer in days, leading to an uncertainty of 0.289 days for all durations.
All the uncertainty components are then propagated into a single equation for calculating the standard uncertainty of the mean radon concentration:
u C = d g 16 z × 0.4734 + u 2 d b g + u 2 d g , r e s d g d b g 2 + u r e l 2 ( s ) + u r e l 2 ( m ) + u r e l 2 ( ω ) + 0.289 t 2 × C
where u(dbg) is the uncertainty of the background (either postal or detector background), u(dg,res) is the uncertainty due to using an integer value for track densities (0.289 cm−2), and t is the measurement duration.

3. Results

3.1. Detector Background

The track density of the background signal from unexposed detectors (detector background) followed a log-logistic distribution with a mean of 2.08 cm−2 and a standard deviation of 0.77 cm−2. The minimum and maximum values were 0.53 and 3.83 cm−2, respectively.

3.2. Track Densities of the Exposed Detectors

In Figure 1, both the simulated detector and the actual photo of the etched detector show that alpha tracks overlap. Only part of the overlapping tracks is circled in the image. Some overlapping tracks can be very difficult to detect, especially when in real exposures the surface areas of the tracks vary.
The track densities from the accepted fields of 20 detectors (approximately 320 fields) in each exposure batch were normally distributed, indicating that the etching process had been consistent. The mean and median track densities for detectors within the same exposure batch were nearly identical, further supporting the idea that the results followed a normal distribution (Table 1). Out of 7360 analysed fields, 36 fields were rejected, accounting for 0.5% of the total. This aligns with the empirical rule, which states that 0.3% of values lie beyond three standard deviations.

3.3. Fitting the Calibration Function

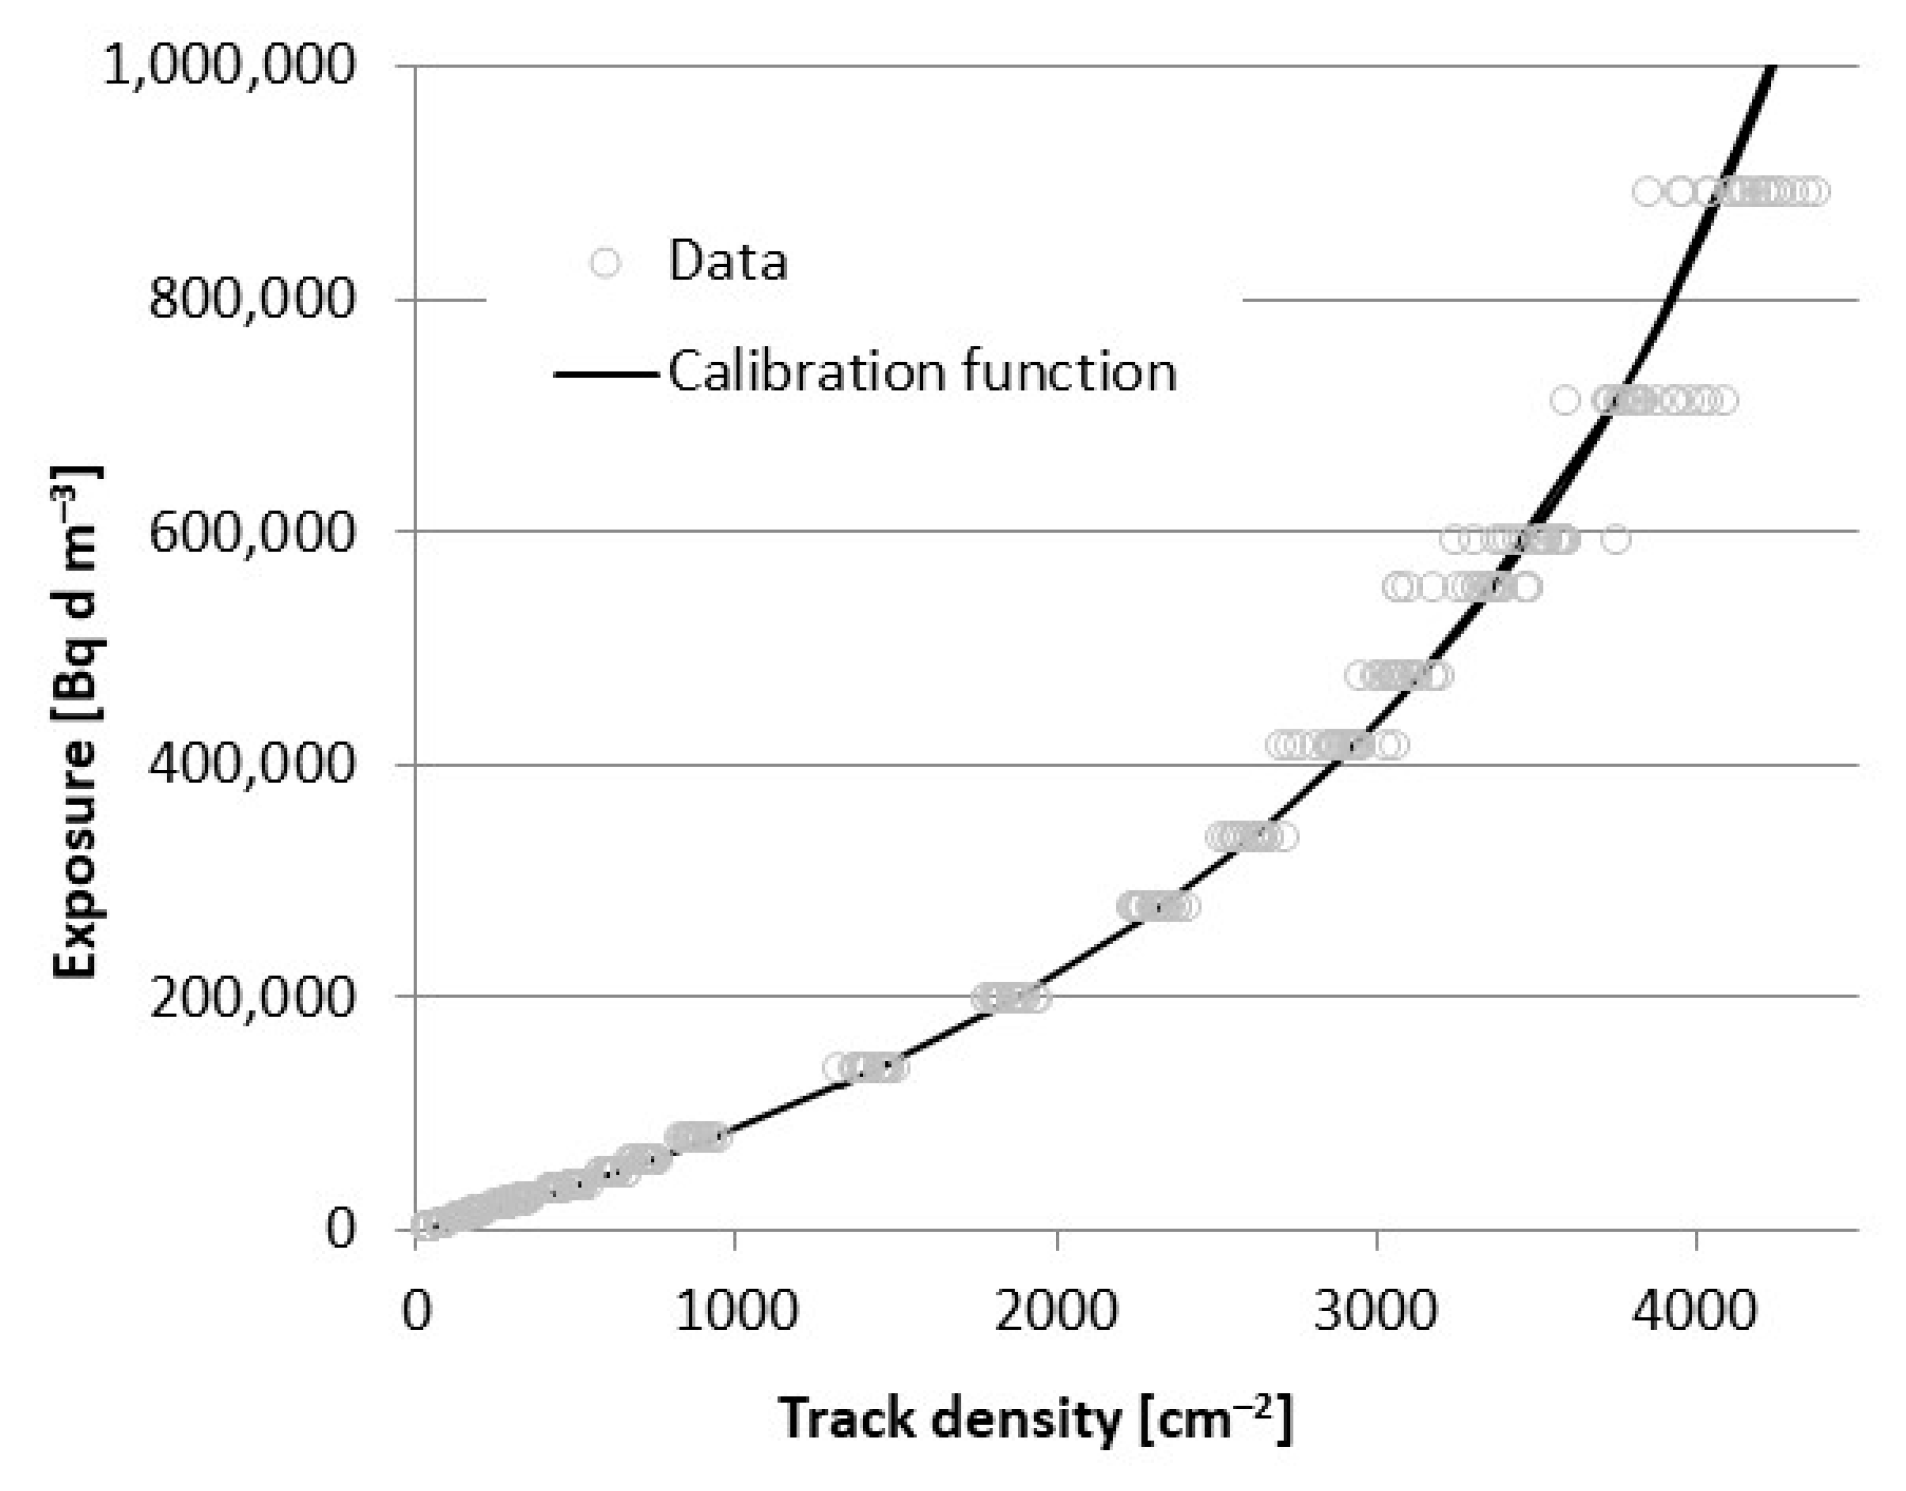
Figure 2 shows that the calibration performs well at track densities up to approximately 3600 cm−2. Beyond this point, the method loses efficiency, with a large change in exposure resulting in only a small change in response (see Section 3.6 for a more detailed description of the selection of the upper limit). Additionally, there is significant overlap in the responses of the two highest exposures. As a result, the calibration function was fitted excluding these two highest exposures. The optimization parameter reached a minimum value of 5.26%, with a mean residual, urel(s), of −0.28% and a standard deviation of the residuals, urel(f), of 5.25%. The calibration parameters were determined to be m = 6335, h = 485,763, and b = −0.9793.
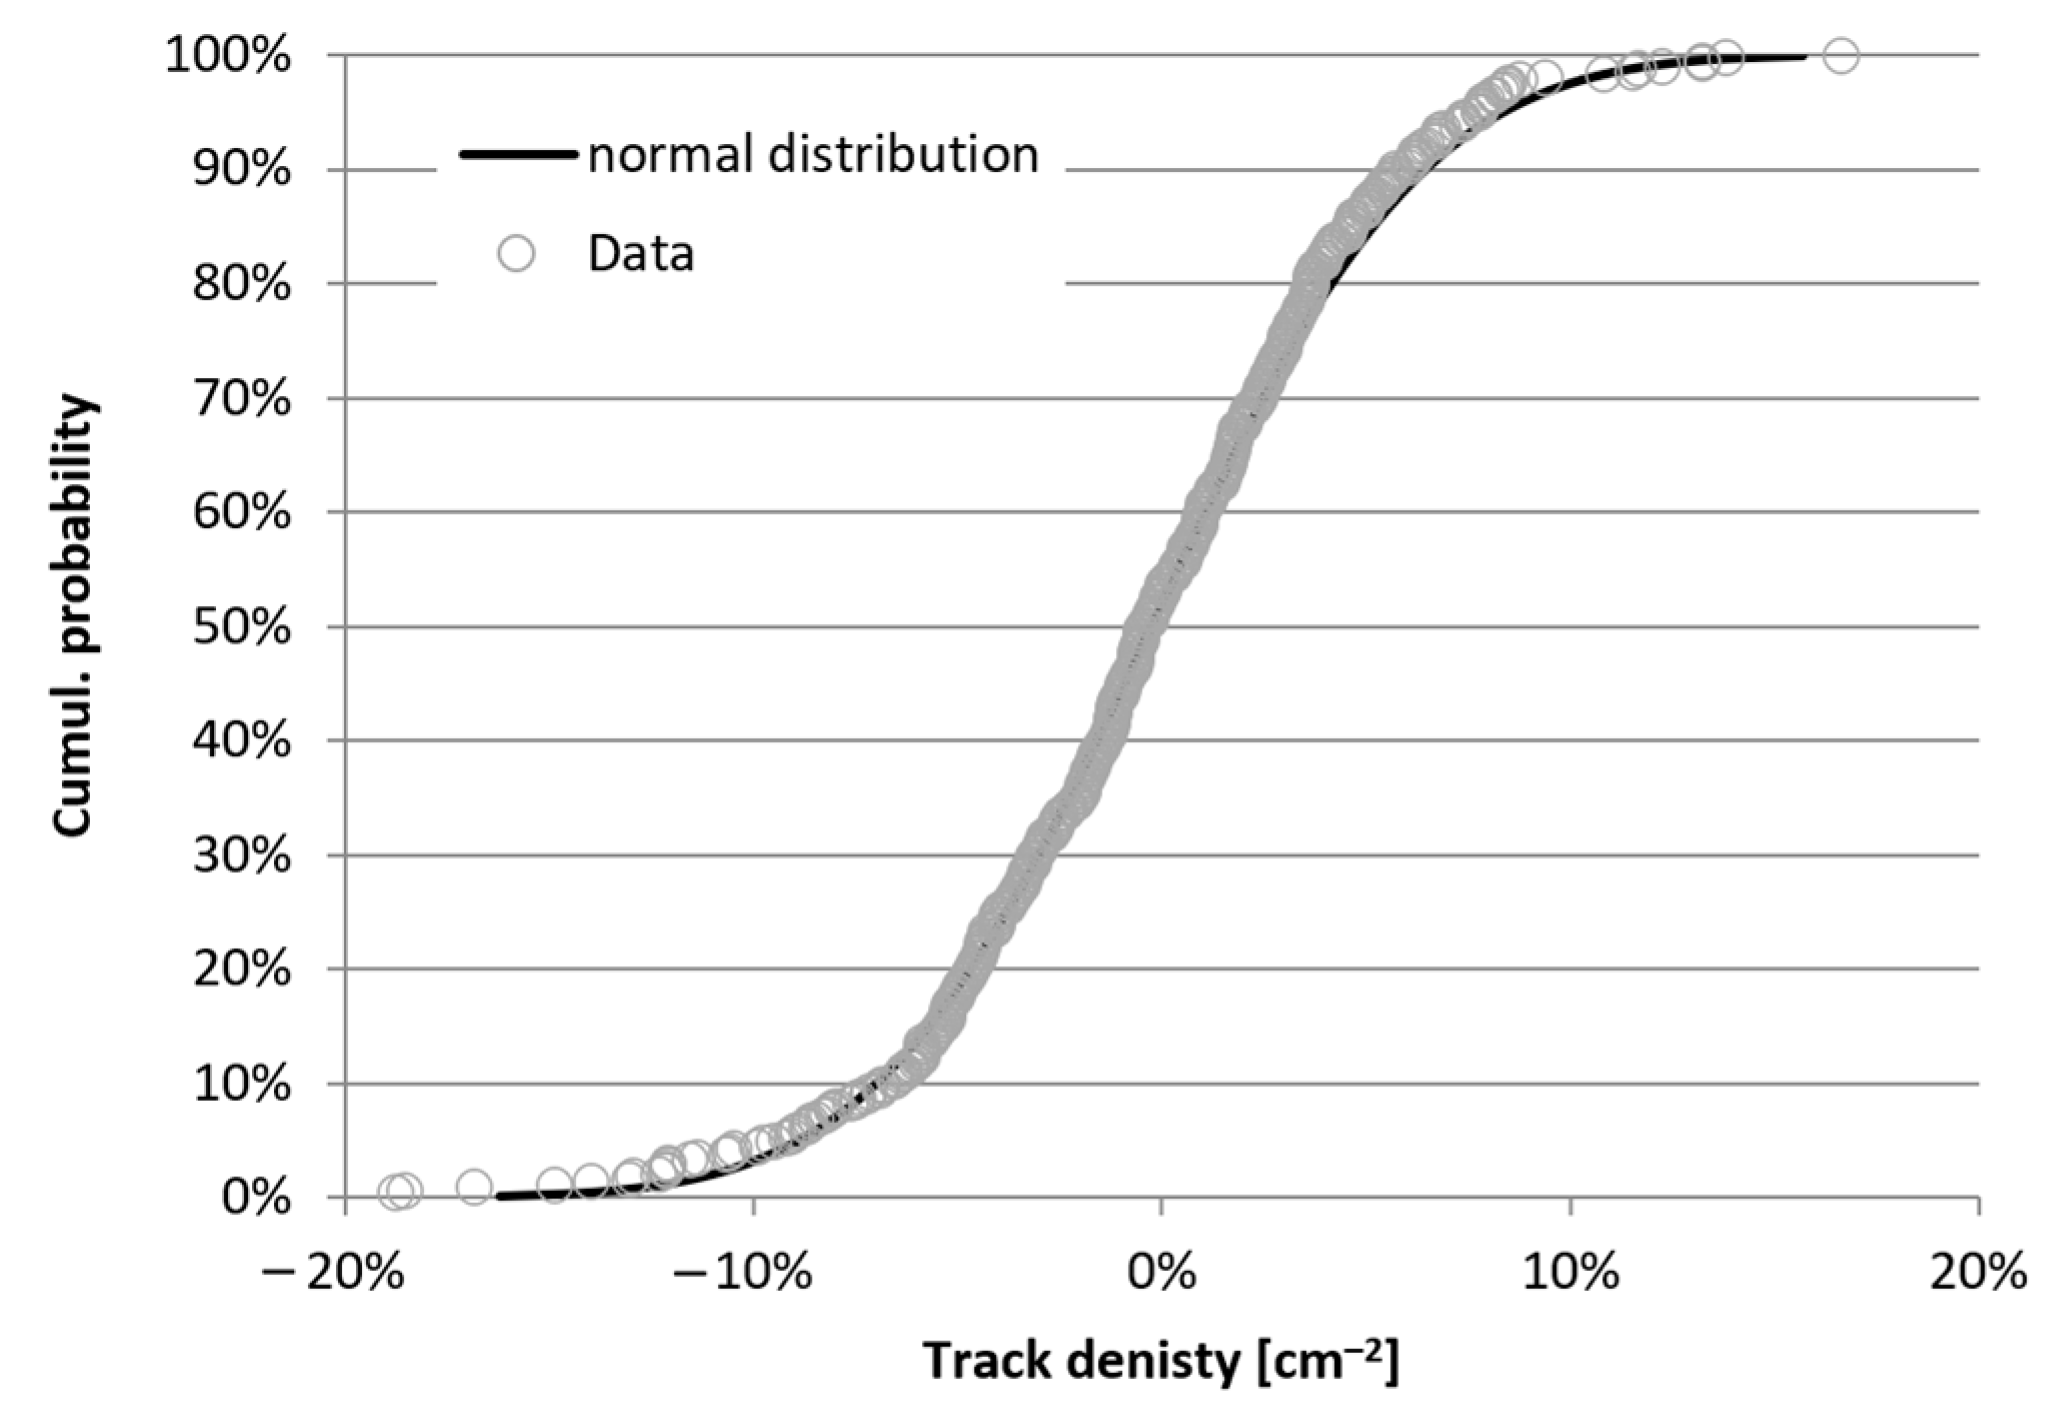
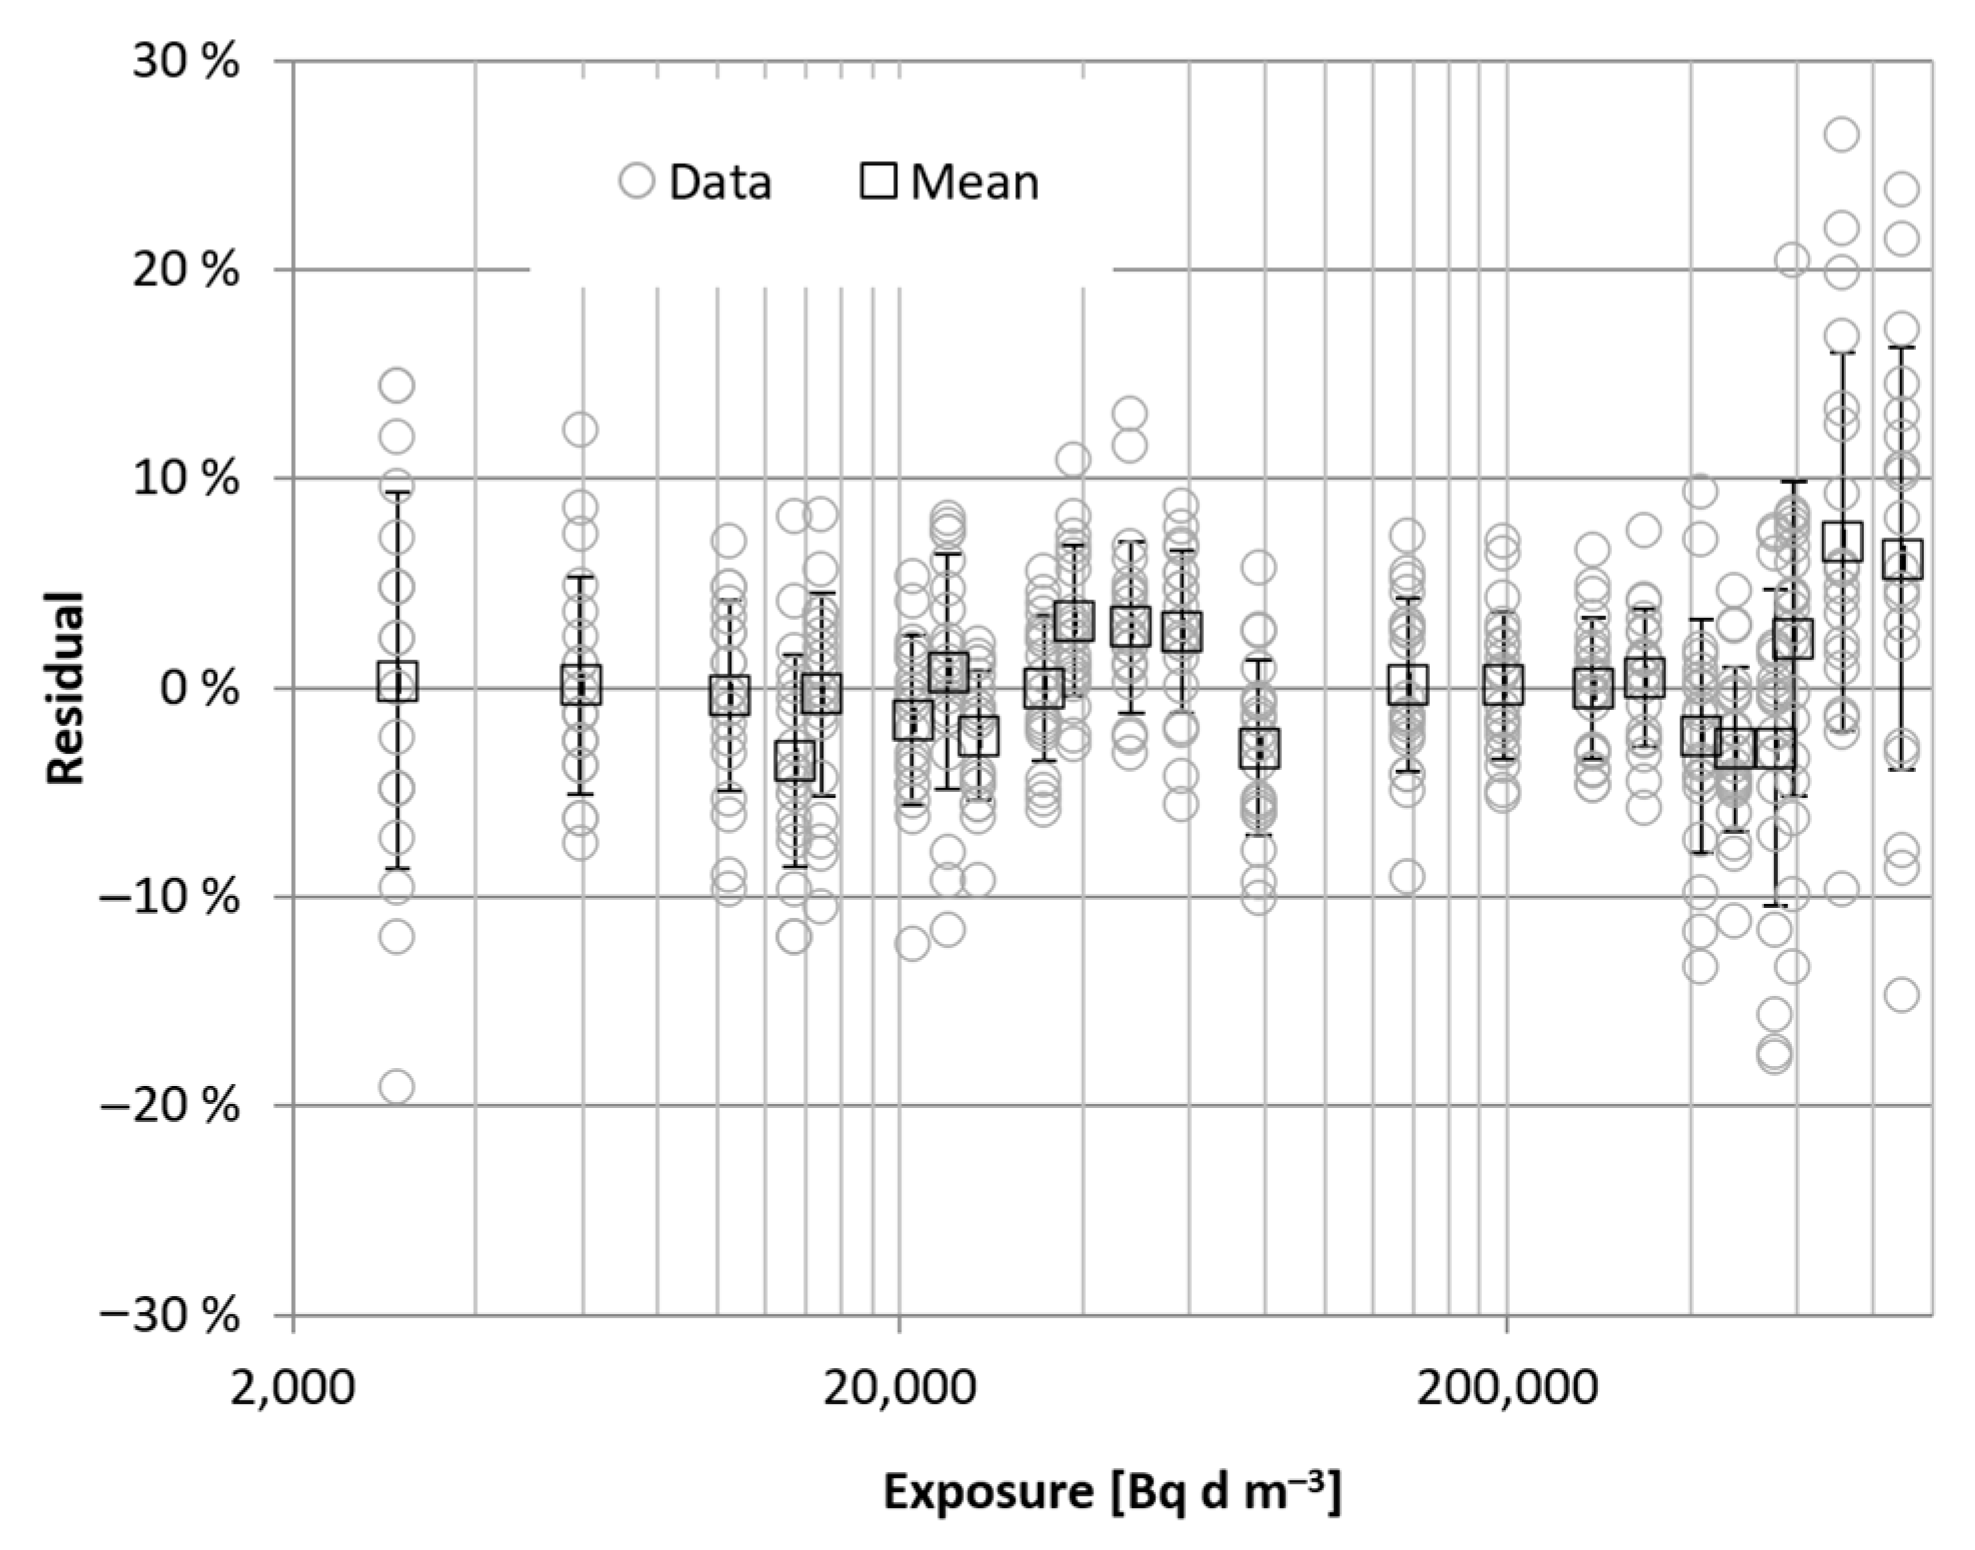
The distribution of relative residuals in the range up to 3600 cm−2 followed a normal distribution, with no obvious tails (Figure 3). There were no regions of track density in the fit where the result calculated with the function did not match the measured result (Figure 4). Significant deviations were observed only in the two highest-exposure batches.

3.4. Calibration at Cold Temperature

The standard deviation of track densities in exposures in cold conditions was comparable to that of films exposed at 21 °C with similar track densities. For example, at the lowest exposure level of 25.9 kBq·d·m−3, the mean track density was 315 cm−2 with a standard deviation of 12 cm−2. In exposures conducted at 21 °C, a mean track density of 320 cm−2 was associated with a standard deviation of 16 cm−2.
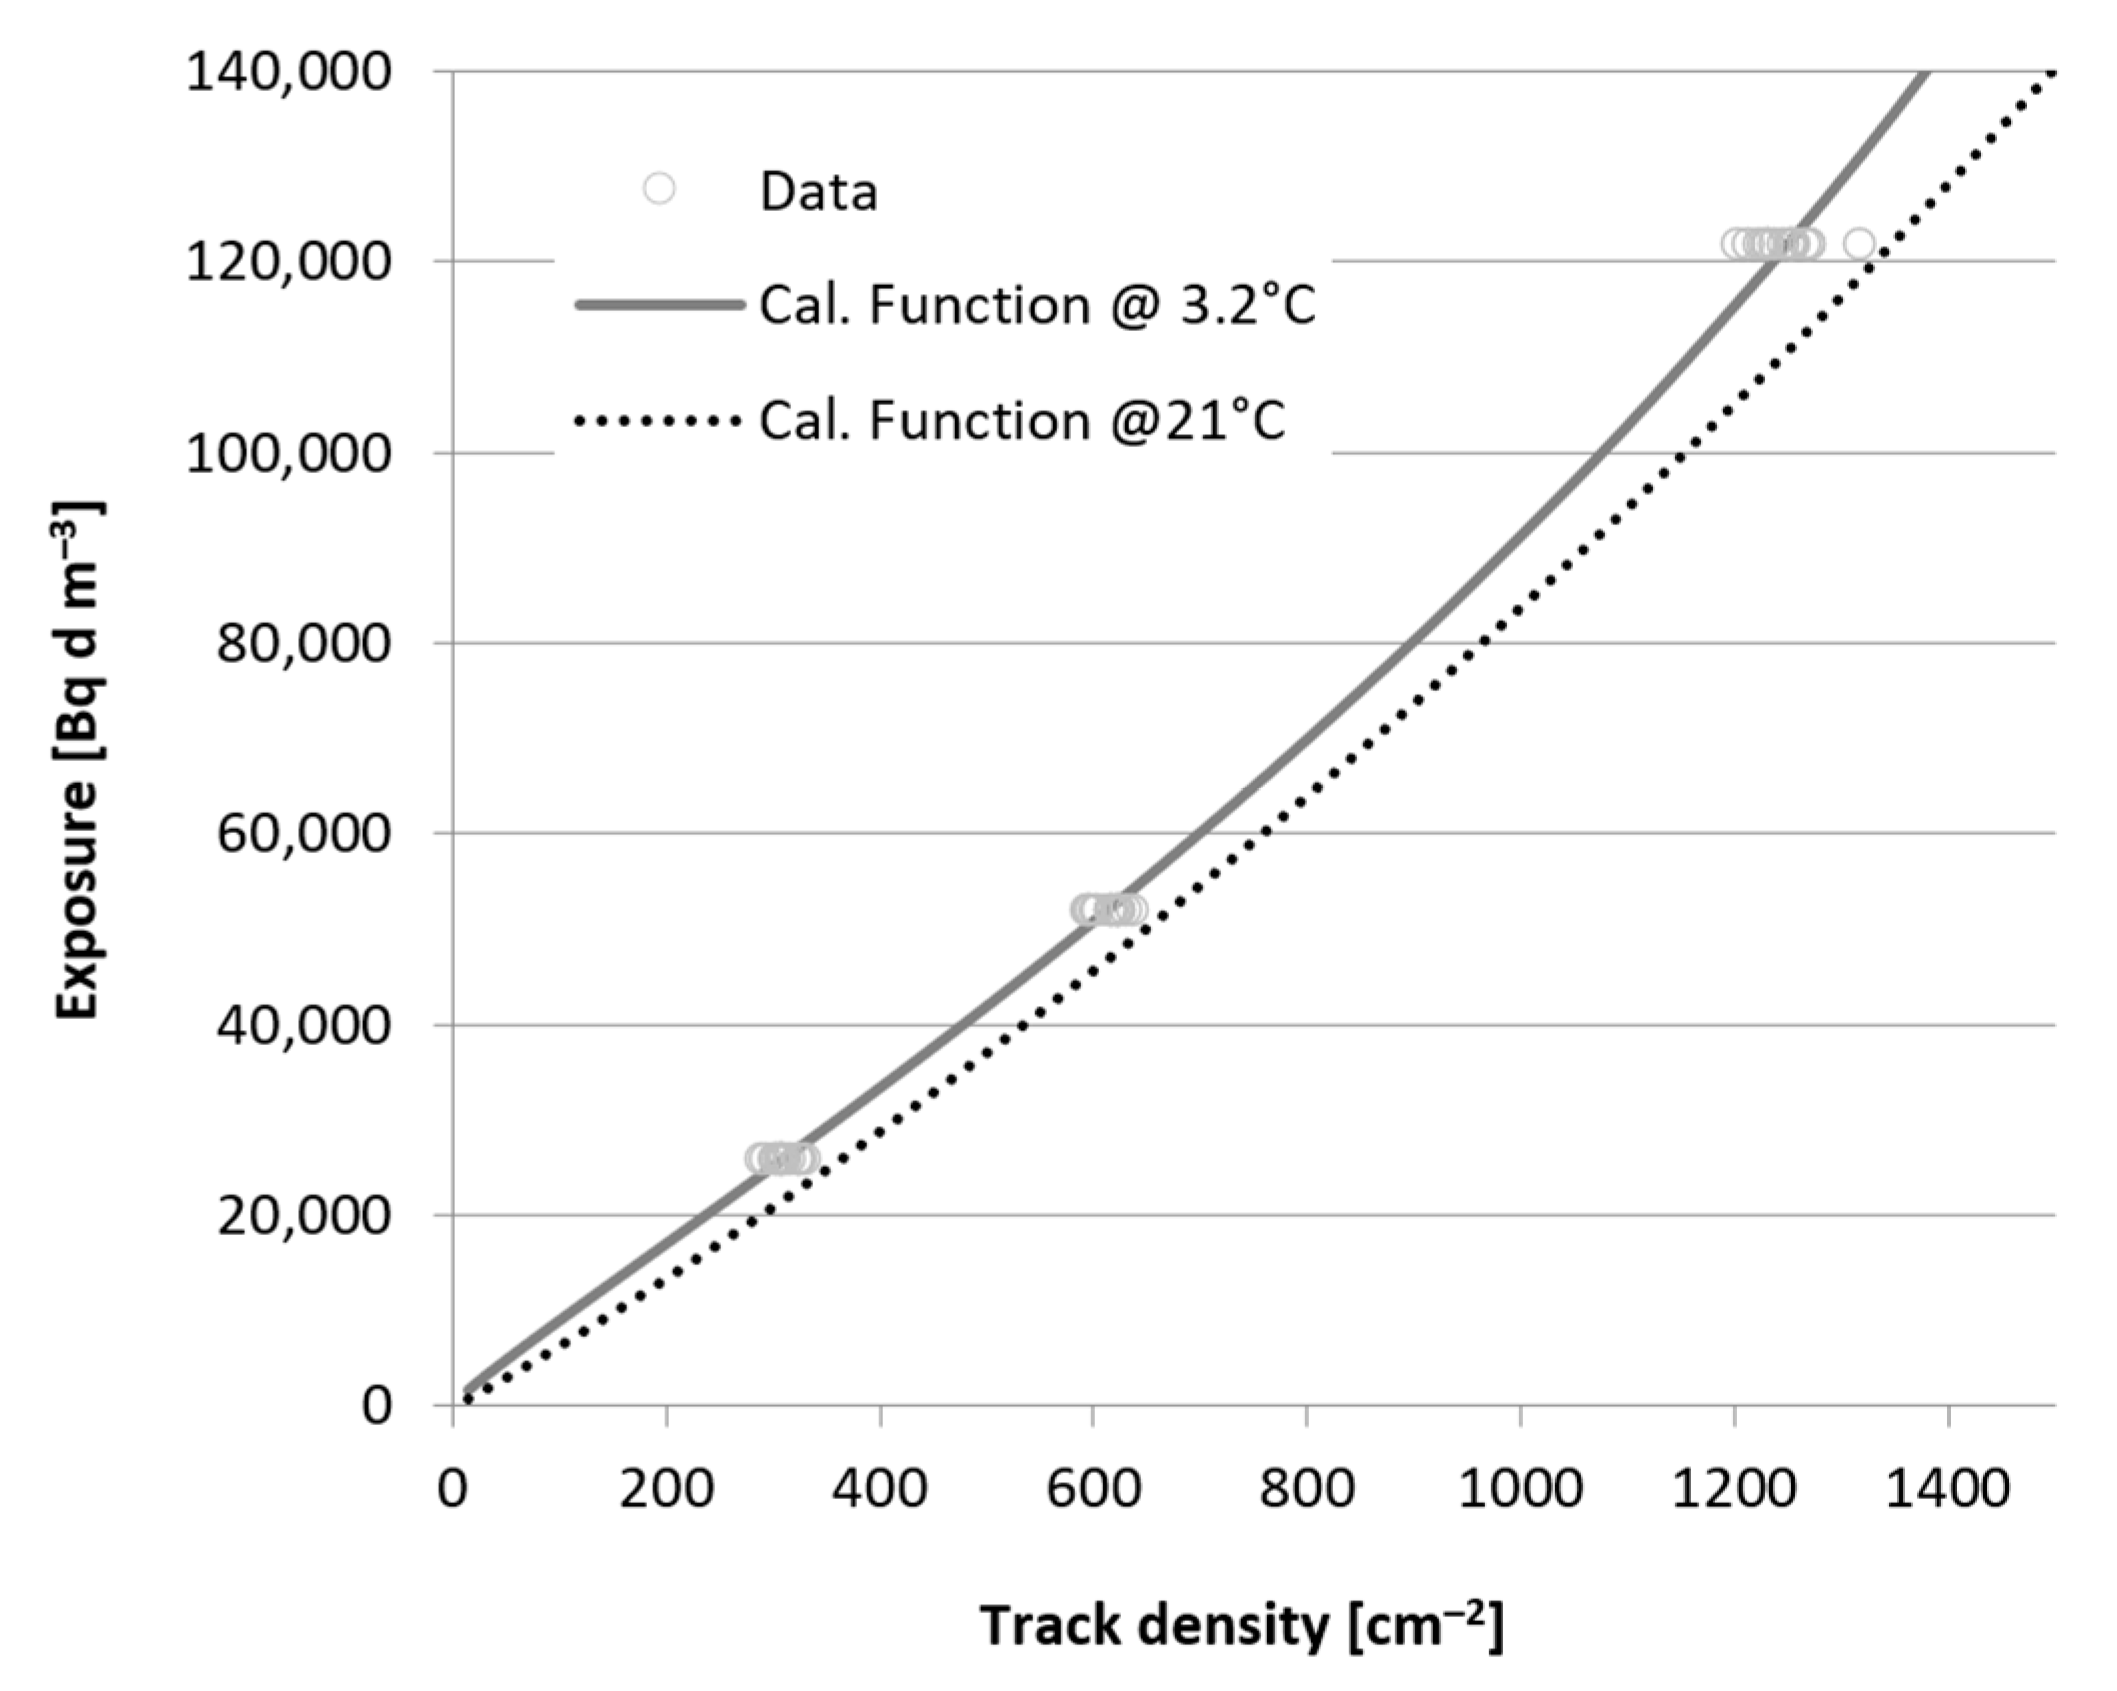
When applying the calibration function fitted to measurements conducted at 21 °C to detectors exposed in cold conditions, the results were significantly lower (Figure 5). Specifically, for the smallest exposure, the result was 16% lower, while for the other two exposures (52.1 and 121 kBq·d·m−3), it was 10% lower. This discrepancy may be attributed to the challenge of fitting a three-parameter function with only three exposure levels.

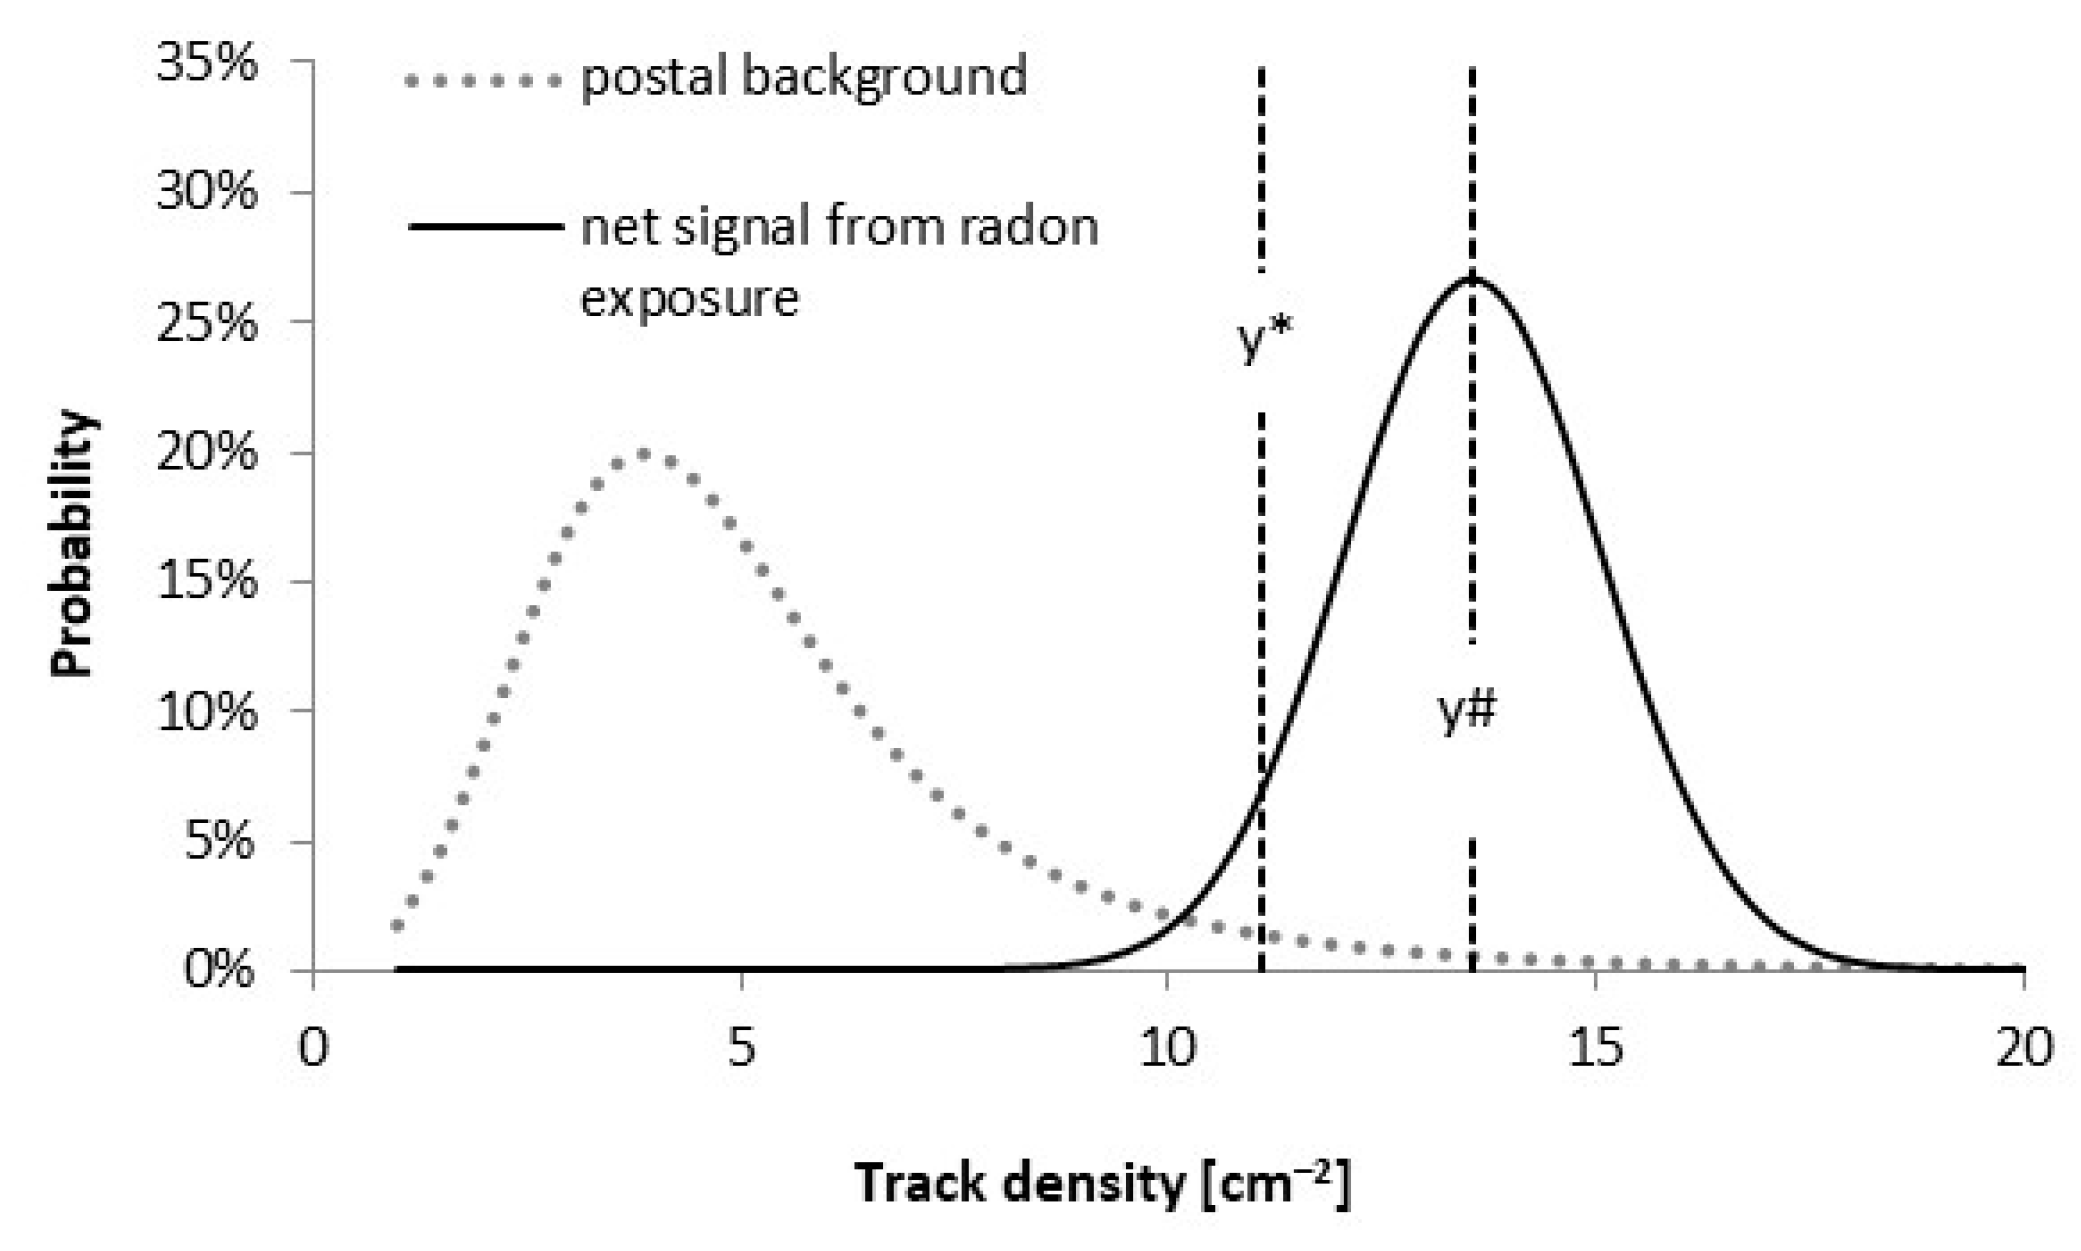
3.5. Postal Background and Minimum Detectable Exposure

The postal background followed a log-logistic distribution, with values ranging from 1.9 to 17 cm−2 (Figure 6). The mean and standard deviation of the postal background were calculated as 5.4 cm−2 and 3.6 cm−2, respectively. It is important to note that this background exposure includes the detector background. While the detector background is used for calibration calculations, the postal background is used for results from mailed detectors and for determining the minimum detectable exposure.
The decision threshold was calculated from the log-logistic distribution using α = 0.05, yielding 11 cm−2. Because the signal from radon exposure follows a normal distribution, the detection limit was calculated using k1−β = 1.645 and through iteration. The variance of the net signal used was derived from the calibration data and the number of tracks at the detection limit. The detection limit was determined to be 13.5 cm−2 (net track density), which corresponds to an exposure of 896 Bq·d·m−3. For a 60-day measurement period, this translates to 15 Bq·m−3 (Figure 6).

3.6. Maximum Detectable Concentration

At low track densities, the relative variation between detectors is highest, decreasing as track density increases and reaching a minimum around 2500 cm−2. Beyond this point, relative variation increases slightly, but the steepness of the calibration function also increases significantly (Table 1, Figure 1). This indicates that variation in the calculated exposure begins to rise sharply as method efficiency decreases. For instance, at a track density of 45 cm−2, a relative variation of 8.3% results in an 8.5% variation in the calculated exposure. At 1000 cm−2, a relative variation of 3.2% leads to a 3.9% variation in the calculated exposure. At a track density of 3600 cm−2, the same variation of 3.2% causes already a 7.9% variation in the calculated exposure. It was determined that this level of variation is acceptable, but anything greater is not. Consequently, the maximum measurable exposure with this method is 626 kBq·h·m−3, which corresponds to a concentration of 10,700 Bq·m−3 over a 60-day measurement period.

3.7. Thermal Fading of Latent Tracks

In total, 360 detectors were etched and counted over a period of 738 days. On average, 10 detectors were counted at a time. No discernible fading was observed (Figure 7).

3.8. Uncertainty of Measurement

The relative systematic error urel(s) was determined to be −0.28%, and the relative standard uncertainty of the fit, urel(f), was 5.25%. The mean track density of the detectors, excluding the two highest exposures, was 1228 cm−2. This corresponds to a mean number of 9299 tracks per film, leading to a mean standard uncertainty of 1.04%. Using Equation 6, we can estimate the additional random relative uncertainty, urel(m), as 5.15%.
The accuracy of the theoretical uncertainty assessment was tested by calculating the exposure and its associated standard uncertainty based on the track density results for each detector used in the calibration with a track density below 3600 cm−2. The uncertainty from the calibration of the reference instrument, urel(ω), was not included in the uncertainty budget because the fit’s uncertainty is independent of the reference instrument’s calibration, as long as the instrument’s response is linear and the measured exposure does not have significant uncertainty due to counting statistics.
The number of computed results that deviated from the measured exposure by more than the standard uncertainty was counted. For normally distributed data, 68% of the results should theoretically fall within the measured standard uncertainty. In our test, 67% of the results matched the measured exposure within their uncertainty, indicating that the uncertainty assessment is sufficiently accurate.
Table 2 summarizes all the calibration parameters and uncertainty components used for the detectors sent to actual measurement sites. The table also includes the relative expanded uncertainties (k = 2) for various concentrations when the measurement duration was 60 days.
For measurements lasting 60 days, the expanded uncertainty is always at least 14%. If the measurement duration is extended, uncertainties decrease, especially when measuring low radon concentrations. For example, a 90-day measurement at a concentration of 60 Bq·m−3 is associated with a relative expanded uncertainty of 18%, whereas the uncertainty for a 60-day measurement is 28%.

4. Discussion

Based on this study, the response of the electrochemically etched Makrofol detector to radon exposure is not linear, even at relatively low track densities, as shown in Figure 1. The track density in Figure 1 corresponds to a radon concentration of 390 Bq·m−3 during a 90-day measurement and already exhibits significant alpha track overlap. Therefore, the assumption that track overlap occurs only at very high track densities [4] does not hold true for the studied detector and etching. The International Standard ISO 11665-4 also incorrectly suggests using a single calibration factor that is valid across the entire rated range in its examples, without mentioning nonlinearity [14].
The method described in this article has successfully participated in several international intercomparisons, with the most recent being one organized by the UK Health Security Agency [15], and another by Germany’s BfS, whose report is expected to be published by the end of 2024. The method has also received accreditation for the “Test of airborne radon (Rn) activity concentration” from the FINAS—Finnish Accreditation Service [16].
Makrofol solid-state nuclear track detectors are somewhat sensitive to temperature, so the effect of temperature on the film’s response needs to be examined more closely. Preliminary estimates suggest that the effect could be up to −16% in cold environments. However, as mentioned earlier, the fit was based on only three exposure levels, which is insufficient for accurately fitting a nonlinear calibration function. In some workplaces, exceptionally high temperatures are also possible (e.g., metal smelters, kitchens, bakeries). Therefore, it would be beneficial to conduct a more detailed temperature calibration for detectors, ensuring that calibration at high temperatures is also well understood.

5. Conclusions

The new calibration function has improved the accuracy of measurements performed with STUK’s SSNTD. The calibration function is also significantly easier to fit than the previously used piecewise-defined function, which had to be continuous and continuously differentiable over its entire range. The new calibration method enabled the calculation of the detection limit according to the standard and the determination of the maximum measurable radon exposure. In a typical 60-day measurement, the rated range is 15–10,700 Bq·m−3, which is suitable for conventional radon measurements in homes, public buildings, and workplaces. The detector is also suitable for the recommended year-long measurements, as no fading of tracks was detected during a 24-month monitoring period. However, in year-long measurements, the maximum measurable concentration is only around 1700 Bq/m3. In most homes, however, this is sufficient.

Author Contributions

Conceptualization, T.T.; methodology, T.T.; validation, T.T., J.-P.L., S.R. and T.O.; formal analysis, T.T.; investigation, T.T.; data curation, J.-P.L., S.R. and T.O.; writing—original draft preparation, T.T.; writing—review and editing, T.T. and J.-P.L.; visualization, T.T., J.-P.L. and S.R.; supervision, T.T. All authors have read and agreed to the published version of the manuscript.

Funding

This research received no external funding.

Institutional Review Board Statement

Not applicable.

Informed Consent Statement

Not applicable.

Data Availability Statement

Raw data are available from the author. The data are not publicly available due to incomplete data compilation and translation.

Conflicts of Interest

The authors declare no conflict of interest.

References

  1. Durrani, S.A. Alpha Particle Etched Track Detectors. In Radon Measurements by Etched Track Detectors; Durrani, S.A., Ilić, R., Eds.; World Scientific Publishing Co. Pte. Ltd.: Singapore, 1997; pp. 75–101. [Google Scholar]
  2. ICRP—The International Commission on Radiological Protection. Radiological Protection against Radon Exposure; ICRP Publication 126; ICRP: Ottawa, ON, Canada, 2014. [Google Scholar]
  3. López-Coto, I.; Bolívar, J.P. A theoretical model for the overlapping effect in solid state nuclear track detectors. Nucl. Instrum. Methods Phys. Res. 2011, A 652, 550–553. [Google Scholar] [CrossRef]
  4. Miles, J.J.H. Calibration and Standardisation of Etched Track Detectors. In Radon Measurements by Etched Track Detectors; Durrani, S.A., Ilić, R., Eds.; World Scientific Publishing Co. Pte. Ltd.: Singapore, 1997; pp. 143–154. [Google Scholar]
  5. STUK—Radiation and Nuclear Safety Authority. Radiation and Nuclear Safety Authority Regulation on Practices that Cause Exposure to Natural Radiation. Regulation STUK S/6/2022; STUK: Helsinki, Finland, 2022; pp. 1–11. Available online: https://www.stuklex.fi/en/maarays/stuk-s-6-2022 (accessed on 5 September 2024).
  6. Turtiainen, T.; Kojo, K.; Laine, J.-P.; Holmgren, O.; Kurttio, P. Improving the assessment of occupational exposure to radon in above-ground workplaces. Radiat. Prot. Dosim. 2021, 196, 44–52. [Google Scholar] [CrossRef] [PubMed]
  7. Pressyanov, D.; Buysse, J.; Poffijn, A.; Van Deynse, A.; Meesen, G. Integrated measurements of 222Rn by absorption in Makrofol. Nucl. Instrum. Methods Phys. Res. 2004, 516, 203–208. [Google Scholar] [CrossRef]
  8. El-Sersy, A.; Mansy, M.; Hussein, A. Effect of environmental conditions on radon concentration—Track density calibration factor of solid-state nuclear track detectors. Pramana 2004, 62, 861–867. [Google Scholar] [CrossRef]
  9. Pressyanov, D.; Mitev, K.; Dimitrova, I.; Georgiev, S.; Dutsov, C.; Michielsen, N.; Bondiguel, S.; Malet, J.; Cassette, P.; Sabot, B.; et al. Report on the Influence of Thoron on Radon Monitors Used in Europe Including (i) Procedures for Checking Their Sensitivity to Thoron, (ii) Recommendations on the Construction of Radon Monitors That Are Not Sensitive to Thoron and (iii) Technical Approaches Aimed at Reducing Thoron-Related Bias in the Radon Signal in Existing Monitor; Sofiiski Universitet Sveti Kliment Ohridski (SUBG): Sofia, Bulgaria, 2020; Available online: http://metroradon.eu/wp-content/uploads/2017/06/D2_accepted.pdf (accessed on 5 September 2024).
  10. IEC 61577-4; International Standard Radiation Protection Instrumentation—Radon and Radon Decay Product Measuring Instruments—Part 4: Equipment for the Production of Reference Atmospheres Containing Radon Isotopes and Their Decay Products (STAR). 1st ed. The International Electrotechnical Commission (IEC): Geneve, Switzerland, 2009.
  11. Durrani, S.A.; Bull, R.K. Solid State Nuclear Track Detection, 1st ed.; Pergamon Press: Exeter, UK, 1987; pp. 96–113. [Google Scholar]
  12. Mateus, A.; Caeiro, F. Improved Shape Parameter Estimation for the Three-Parameter Log-Logistic Distribution. Comput. Math. Methods 2022, 2022, 8400130. [Google Scholar] [CrossRef]
  13. ISO 11929-3; Determination of the Characteristic Limits (Decision Threshold, Detection Limit and Limits of the Coverage Interval) for Measurements of Ionizing Radiation—Fundamentals and Application—Part 3: Applications to Unfolding Methods. 2nd ed. ISO: Geneva, Switzerland, 2019; pp. 1–39.
  14. ISO 11665-4; Measurement of Radioactivity in the Environment—Air: Radon-222—Part 4: Integrated Measurement Method for Determining Average Activity Concentration Using Passive Sampling and Delayed Analysis. 3rd ed. ISO: Geneva, Switzerland, 2021; pp. 1–31.
  15. Miller, C.A. Results of the 2023 Intercomparison of Passive Radon Detectors; Report RCE-DSD-04-2024; UK Health Security Agency: London, UK, 2024; pp. 1–38. Available online: https://www.ukradon.org/cms/assets/gfx/content/resource_5548csd10ddbe86f.pdf (accessed on 6 September 2024).
  16. FINAS—Finnish Accreditation Service. Decision T167/A25/2023. Available online: https://www.finas.fi/Documents/T167_A25_2023.pdf (accessed on 6 September 2024).
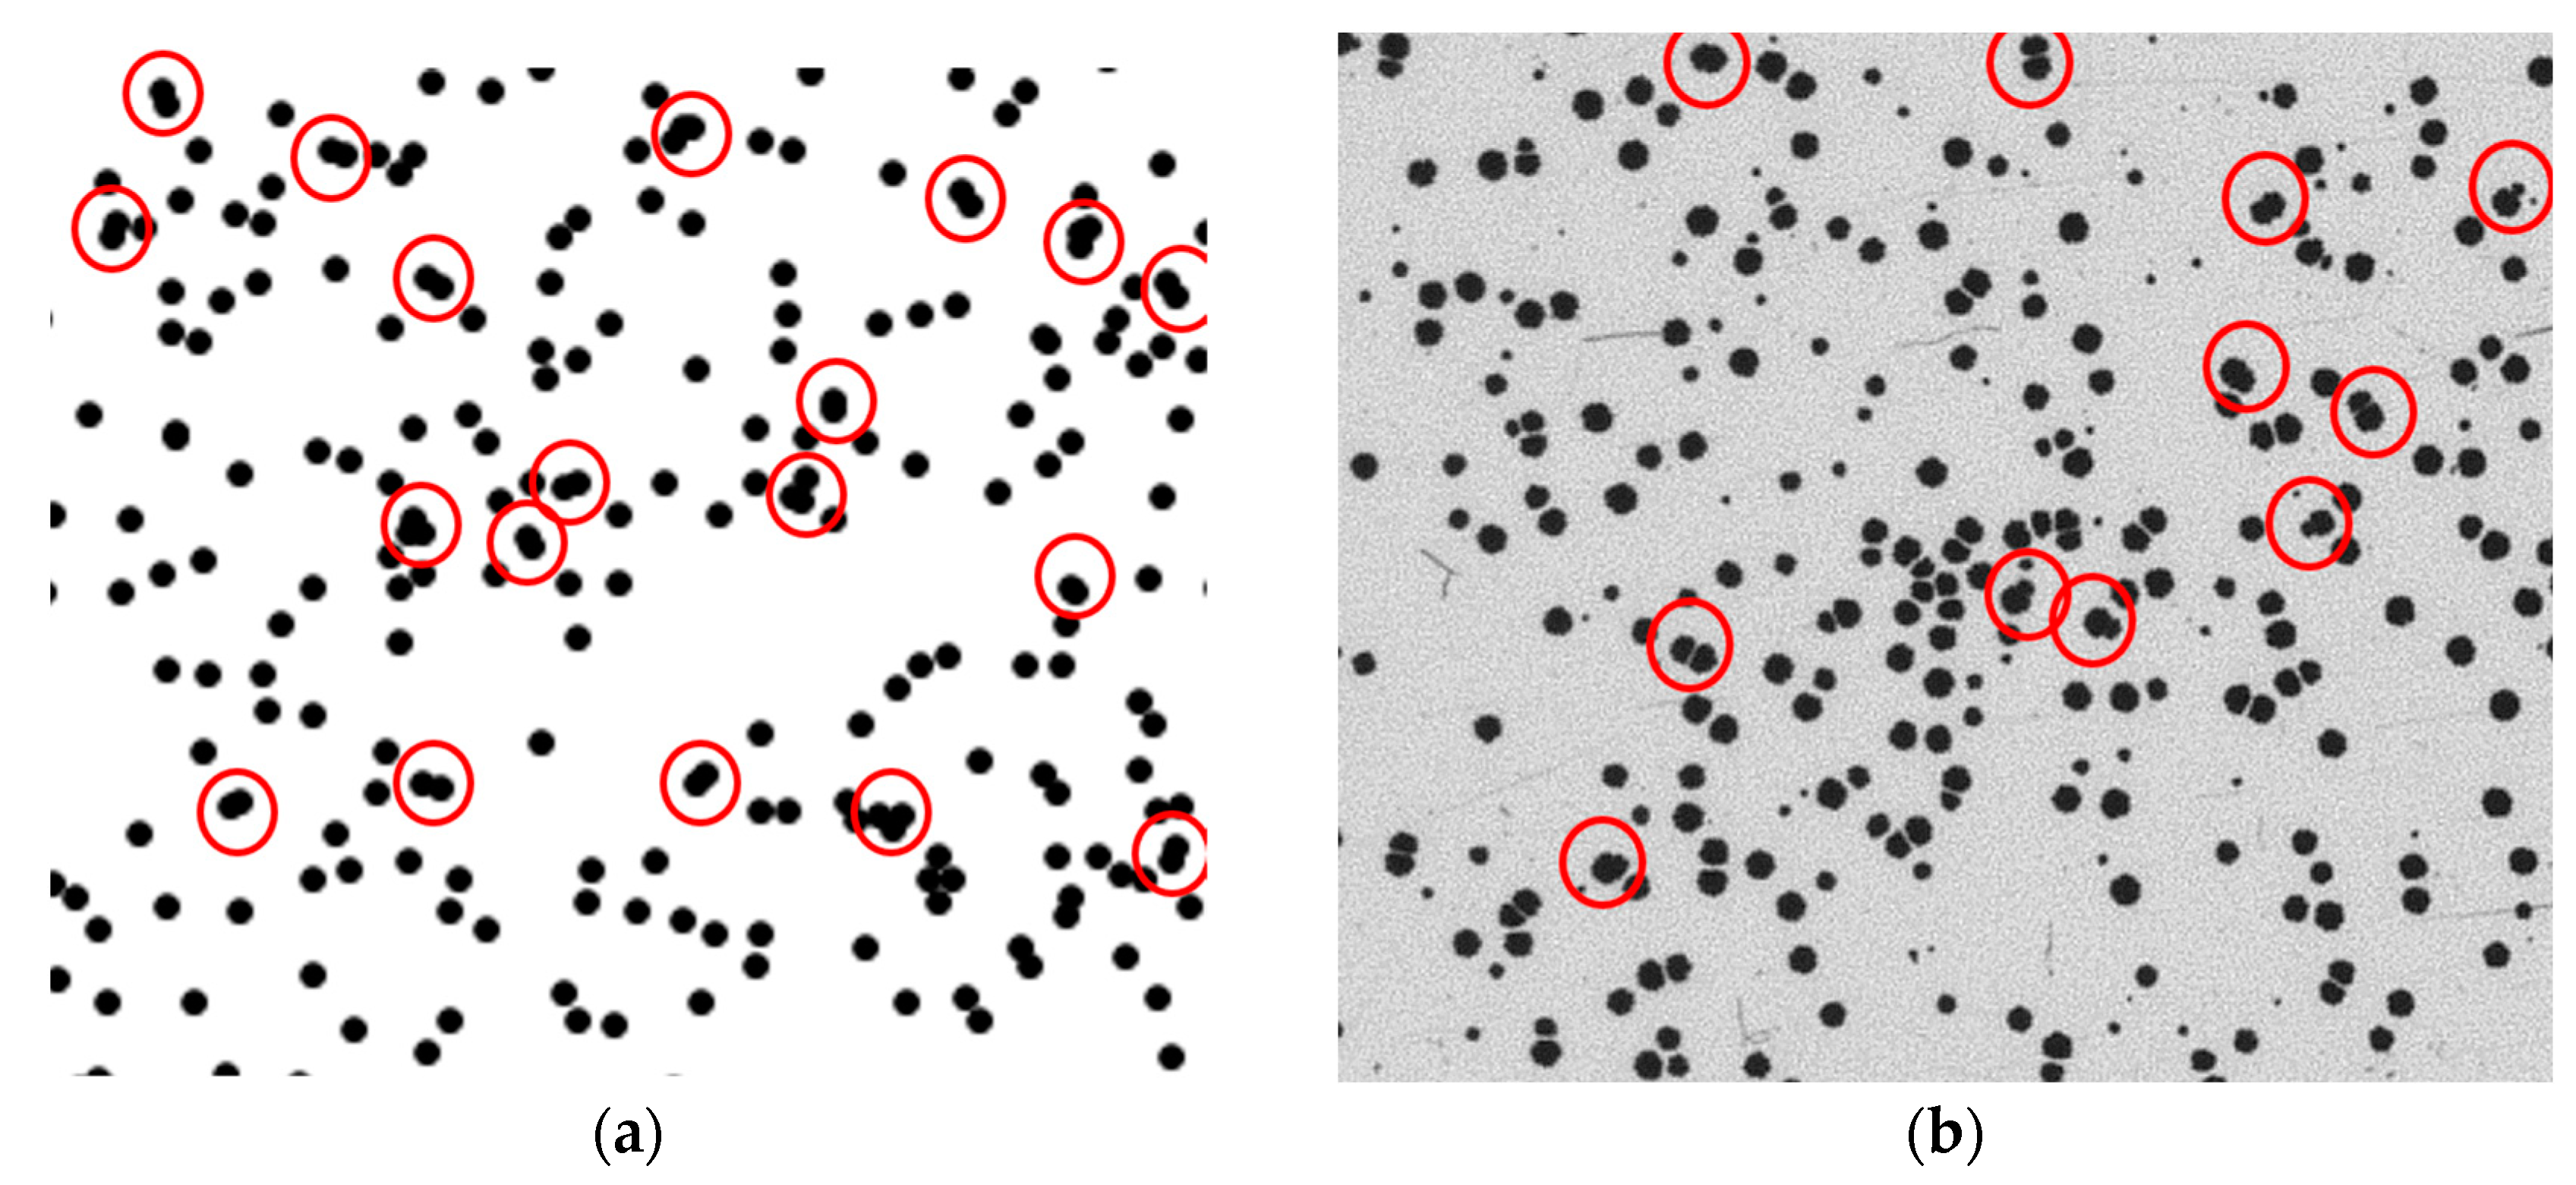
Figure 1. Simulated detector (a) and actual detector (b), both with a track density of approximately 450 cm−2. Overlapping tracks can be observed in the circled areas.
Atmosphere 15 01179 g001
Figure 2. Track densities measured across varying exposure levels with fitted calibration function.
Atmosphere 15 01179 g002
Figure 3. Relative residuals of the calibration (N = 420) excluding the two highest exposures.
Atmosphere 15 01179 g003
Figure 4. Relative residuals (circle) and mean residuals (square) in different exposure batches. The bars represent the standard deviation of residuals for each group batch.
Atmosphere 15 01179 g004
Figure 5. Comparison of the calibrations at 3.2 °C and 21 °C.
Atmosphere 15 01179 g005
Figure 6. Distribution of postal background signal, decision threshold (y*), and detection limit (y#).
Atmosphere 15 01179 g006
Figure 7. Average track densities of detectors exposed in 2021 and stored in a radon-free environment over a period of 738 days. The bars represent the standard deviation of the results if more than 7 detectors were etched and counted in the same batch. The split circles indicate that 7 or fewer detectors were etched simultaneously.
Atmosphere 15 01179 g007
Table 1. Number, mean and median track densities, standard deviations, and coefficients of variation of the detectors in different exposure batches in calibration at 21 °C.
Exposure (Bq·d·m−3)NMean Track Density (cm−2)Median Track Density (cm−2)Standard Deviation (cm−2)Coeff. of Variation (%)
298320454648.3
595920868544.9
10,4602014614664.3
13,4032017917894.9
14,9002020420594.6
20,98720277280113.8
23,98020321322175.2
27,01720348351102.9
34,55820445446143.2
38,66020505503163.1
48,06620615611223.5
58,25420724726243.3
77,95220885888323.6
137,4892014291418453.2
196,9892018551853452.4
276,3742023162319482.1
336,1732026112619491.9
416,2232028922902883.1
474,5802030863080622.0
553,12620298233631254.2
592,10620350735361143.2
711,16820382038301233.2
891,46020416141781363.3
Table 2. Summary of calibration parameters and related uncertainty components, along with examples of expanded uncertainties associated with real-world measurement.
Calibration ParameterValueRadon Concentration in 60-Day Measurement (Bq·m−3)Expanded Uncertainty
m6335 cm−22047%
h485,763 Bq·d·m−33034%
b−0.97936028%
dbg5.4 cm−210019%
u(dbg)3.6 cm−220016%
u(dg,res)0.289 cm−230015%
urel(s)−0.28%
urel(m)5.15%
urel(ω)3.2%
Disclaimer/Publisher’s Note: The statements, opinions and data contained in all publications are solely those of the individual author(s) and contributor(s) and not of MDPI and/or the editor(s). MDPI and/or the editor(s) disclaim responsibility for any injury to people or property resulting from any ideas, methods, instructions or products referred to in the content.