Communication

Investigating the Characteristics of Tropical Cyclone Size in the Western North Pacific from 1981 to 2009

1
Shanghai Marine Meteorological Center, Shanghai 200030, China
2
Shanghai Typhoon Institute of China Meteorological Administration, Shanghai 200030, China
3
Asia-Pacific Typhoon Collaborative Research Center, Shanghai 201306, China
*
Author to whom correspondence should be addressed.
Atmosphere 2023, 14(9), 1468; https://doi.org/10.3390/atmos14091468
Submission received: 17 August 2023 / Revised: 14 September 2023 / Accepted: 19 September 2023 / Published: 21 September 2023

Abstract

:
Tropical cyclone (TC) size is an important parameter for estimating TC risks, such as precipitation distribution, gale-force wind damage, and storm surge. This paper uses the TC size dataset compiled by the Shanghai Typhoon Institute of China Meteorological Administration (STI/CMA) to investigate the interannual, monthly variation in TC size, and the relationships between TC size and intensity in the WNP basin from 1981 to 2009. The results show that the annual mean TC size oscillated within the range of 175–210 km from 1981 to 2002, then decreased following 2003. For the monthly average TC size, there are two peaks in September and October. The TC size, overall, becomes larger with increasing intensity; the samples with an unusually large size are mainly concentrated near a 40 m s−1 intensity. After the TC intensity exceeds 40 m s−1, the number of unusually large size samples gradually decreases. About 60% of the TCs reach their maximum size after reaching the peak intensity, and the average lag time is 8.3 h.

1. Introduction

The tropical cyclone (TC) is one of the most destructive natural disasters on earth [1,2]. China is one of the countries that is most seriously affected by TC, with an average annual economic loss of CNY 24.6 billion and 570 deaths caused by TC disasters [3]. The coastal area of China is an economically developed and densely populated region in China, which concentrates 70% of the large cities and 55% of the national income, and the direct economic losses caused by TCs amount to tens of billions of Chinese yuan annually, and the coastal areas such as Fujian, Guangdong, and Taiwan are the most affected by the frontal landfalls [4,5,6]. Therefore, it is important to accurately predict the intensity, track, and size of TCs.
Accurate forecasts of TC tracks and intensities can greatly reduce the losses caused by TC disasters [7]. The study of TCs involves almost all aspects of atmospheric dynamics, which makes it one of the most complicated research fields in atmospheric sciences [8,9,10]. Over the past 30 years, the forecasts of TC tracks and intensities have been greatly improved by the application of various detection methods and the continuous development of numerical weather prediction models [11,12]. There have been a good number of studies on the size of TCs, since the size data have only appeared in the last decade. TC size, which is understudied, is an important indicator of its impact area, and even if the intensity of TCs is the same, their sizes may still be very different [13]. Previous work has pointed out that the correlation between the intensity and size of TCs is weak [14,15,16,17], and the destructive power caused by TCs at different sizes after landfall is also different. This has a direct impact on the estimation of TC destructive power by frontline forecasters: the overestimation of TC destructive power often leads to unnecessary production stagnation and population evacuation, which indirectly aggravates the economic losses caused by TCs. On the contrary, the underestimation of TC destructive power delays prevention and relief work, which directly leads to huge losses of people’s lives and properties. Therefore, the study of TC size is urgently needed.
Previous studies have noted that the average size of TCs varies greatly over different basins, for instance, the mean size is larger in the western North Pacific (WNP) than in the North Atlantic [18,19]. Knaff et al. used satellite images to study the global distribution of TC size and found that the average TC size is largest in the WNP, while the TCs in the North Atlantic tend to continue to increase in size after reaching maximum intensity [20].
Seasonally, Brand pointed out that [21], based on the radius of the outermost closed isoline (ROCI, defined by Pennington et al. [22]) values of TC size, most small-size TCs in the WNP occur in August, while most large-size TCs occur in October. Liu and Chan used the relative vorticity data from the European Remote-Sensing (ERS) satellite inversion to reach similar conclusions, and pointed out that the average TC sizes are generally larger in November–December than those in July–August [18]. Yuan et al. used the TC size data from the Regional Specialized Meteorological Center of Tokyo (RSMC-Tokyo) for the years 1977–2004 and found that the TC size reaches its maximum value in October [23]. Merrill showed that a TC in the North Atlantic has the smallest size in the summer and the largest size in October [16]. This conclusion was verified by Kimball and Mulekar, who examined a total of 172 TCs in the North Atlantic over a 15-year period [24]. Chen et al. used Multiplatform Tropical Cyclone Surface Wind Analysis (MTCSWA) wind field data to statistically show that a TC over the WNP has two size peaks in August and October [25].
On the interannual scale, based on 4 years of QuikSCAT data, Chan and Yip found that the TC sizes in the WNP basin are biased during El Niño years [26]. In particular, the mean TC size in the WNP was very small in 1999 (a strong La Niña year) [15]. For the North Atlantic basin, Kimball and Mulekar argued that TC sizes are larger in La Niña years [24], and Quiring et al. [27] reached similar conclusions in their study of North Atlantic TCs from 1988 to 2008 using extended best track data [28]. In terms of the inter-decadal scale, Yuan et al., using the best track data from the RSMC-Tokyo, showed that the annual mean size R15 of TCs increased by 52.7 km from 1977 to 2004. However, due to the short history of the TC size dataset, this trend is not statistically significant [23].
In this paper, we use the TC size dataset compiled by the Shanghai Typhoon Institute of China Meteorological Administration (STI/CMA) [29] to investigate the interannual, monthly variation in TC size, and the relationships between TC size and intensity in the WNP basin from 1981 to 2009. The remainder of this paper is structured as follows. Section 2 provides an overview of the TC size dataset. Section 3 presents the results, including interannual and monthly variations in TC size, and the relationship between TC size and intensity. Finally, Section 4 provides a summary.

2. Data

The TC size dataset used in this paper is derived from the satellite analysis of TC size data from the Tropical Cyclone Data Center of the China Meteorological Administration (available online at: https://tcdata.typhoon.org.cn/en/tcsize.html, accessed on 1 August 2023), which is computed from the objective model of TC size in the WNP region constructed on the basis of infrared cloud maps from geostationary satellites developed by Lu et al. [29] in 2017. The satellite inversion of TC size information contains all satellite-captured TCs in the WNP region, defined as the mean azimuth radius of 34 kt surface winds (R34), with a spatial coverage between north of the equator and west of 180° E, and including the South China Sea (SCS). It contains 6-hourly position, intensity, and size information of 718 TCs (13,712 samples) from 1981 to 2009.
The TC intensity data used to analyze the correlation with the size data represent the best track dataset compiled by STI/CMA (available online at: https://tcdata.typhoon.org.cn/en/zjljsjj_zlhq.html, accessed on 1 August 2023). This TC best track dataset covers tropical cyclones that develop over the WNP. The present version of the dataset includes 6-hourly track and intensity analyses, measured since 1949 [30,31].

3. Results

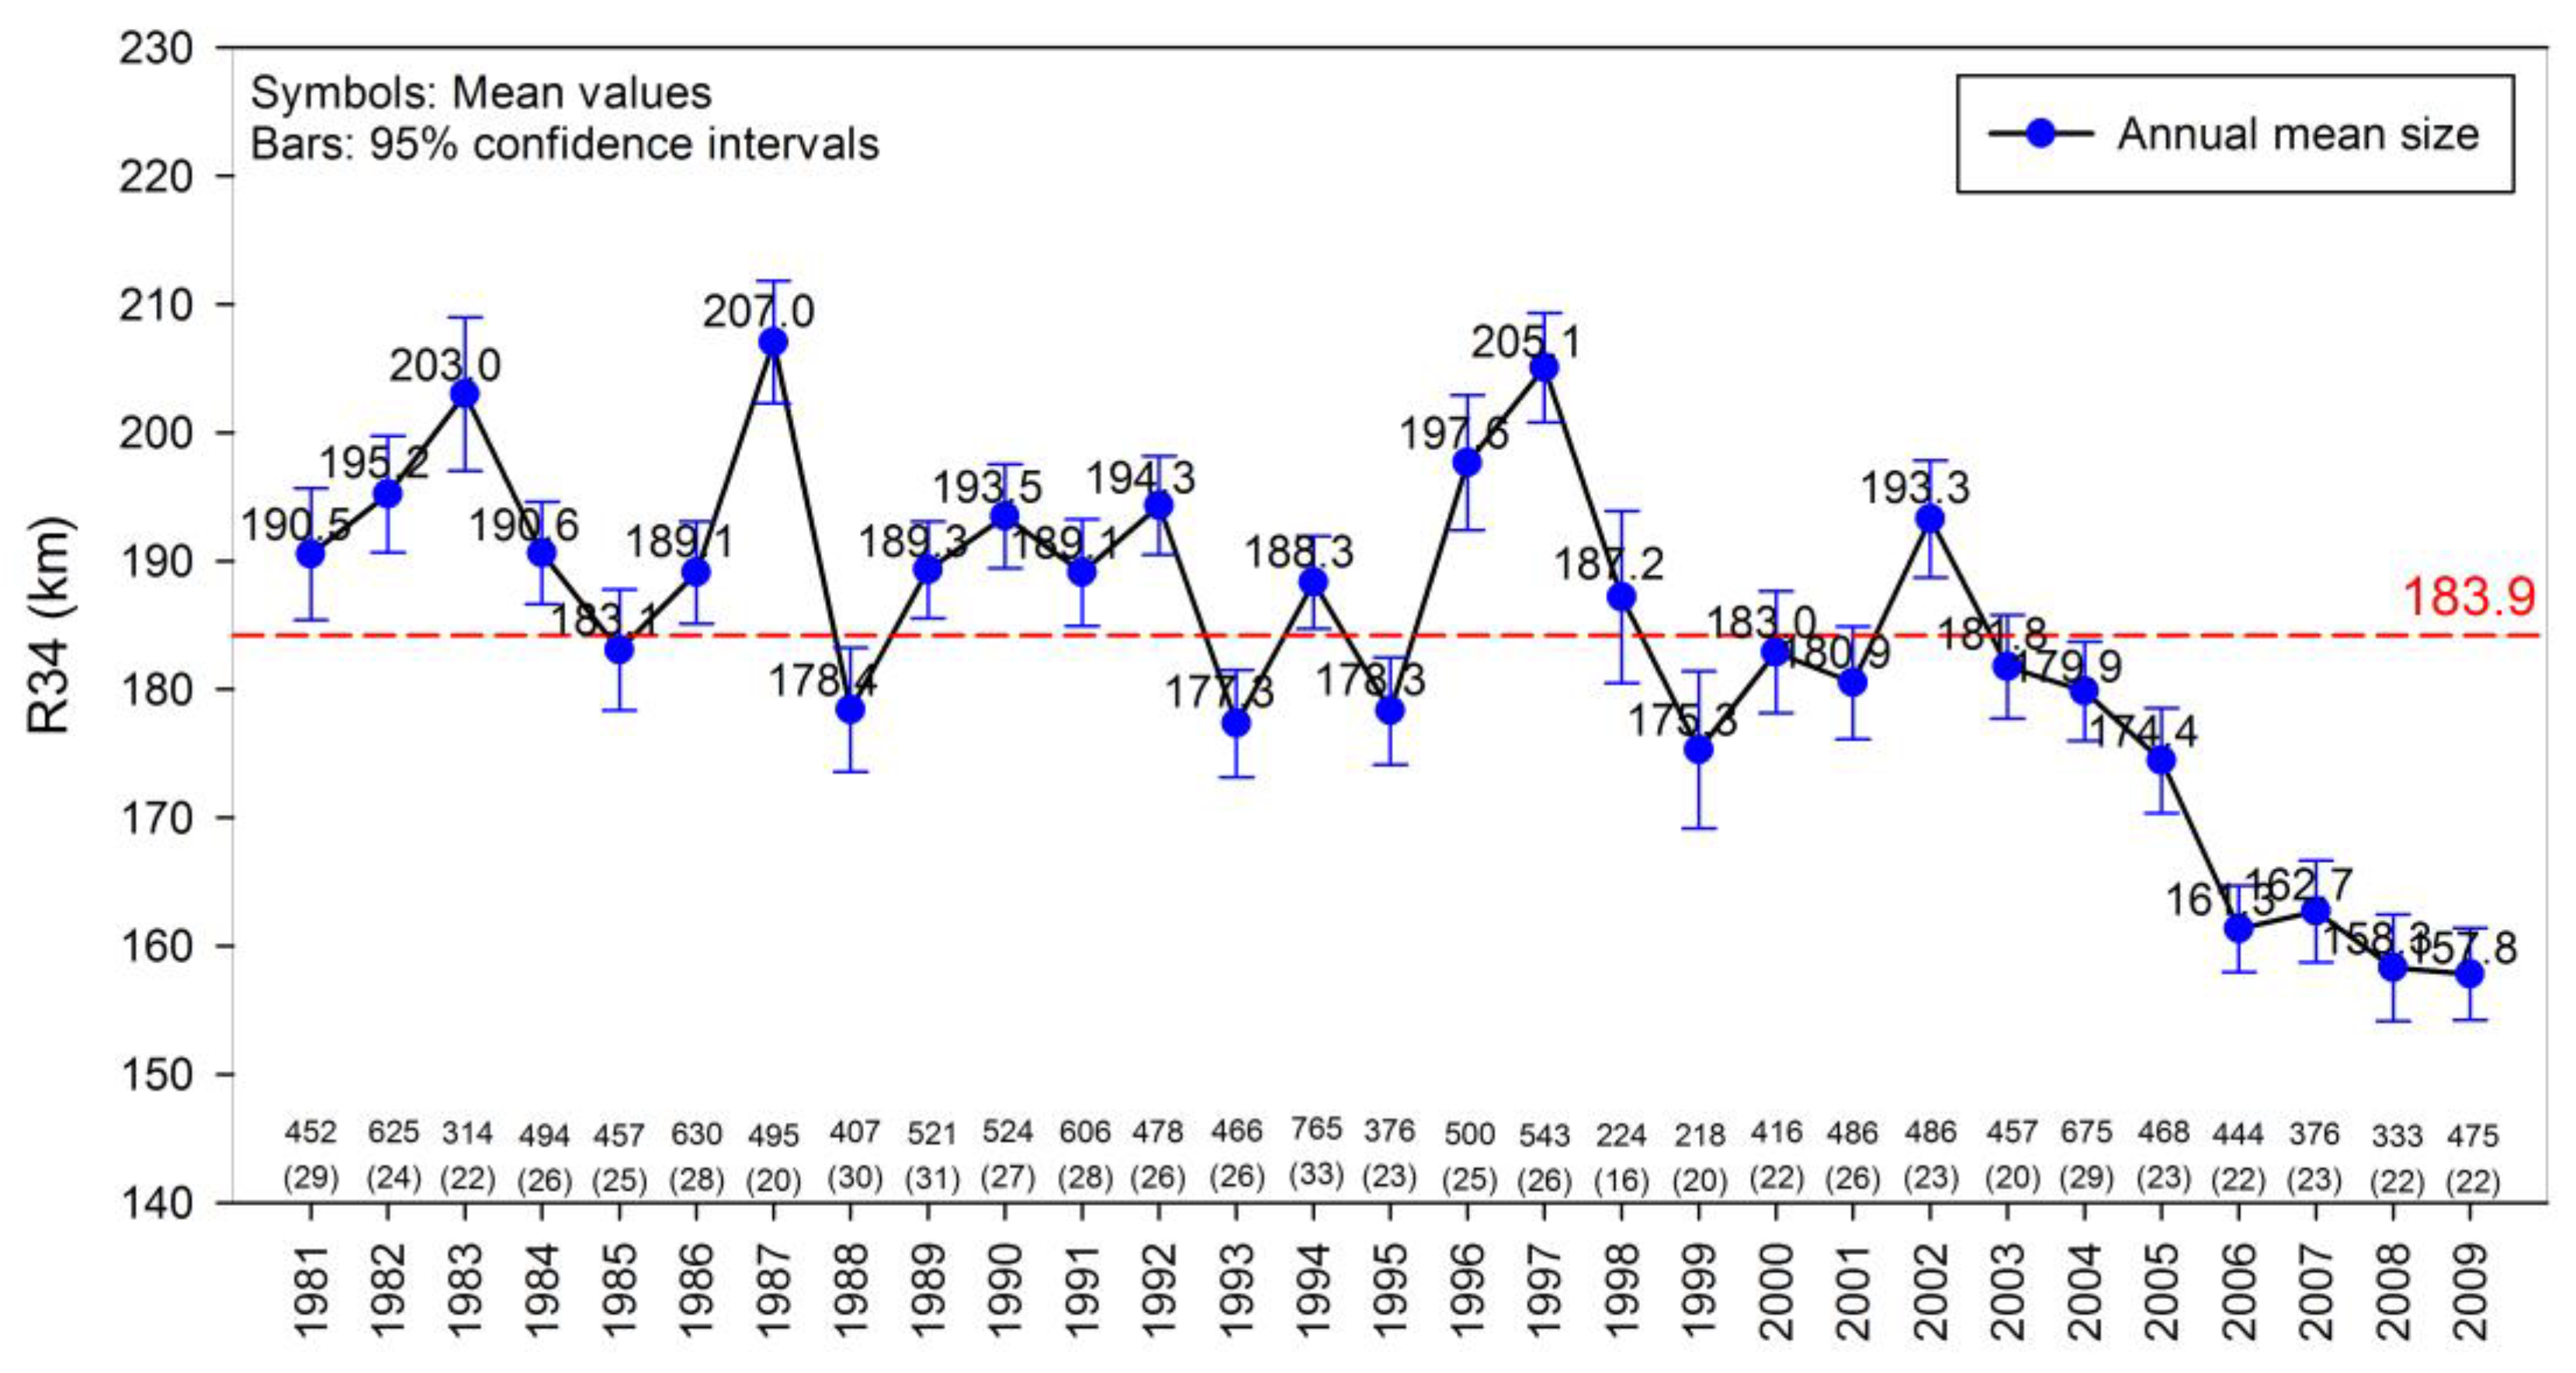
3.1. Interannual Variation

Figure 1 shows the evolution of the annual mean TC size and the 95% confidence interval of all the samples of each year’s TC size from 1981 to 2009. As can be seen in Figure 1, the average TC size of the 13,712 total samples is 183.9 km. Furthermore, prior to 1998, only 1988, 1993, and 1995 had annual mean sizes that were smaller than the mean TC size value of 183.9 km from 1981 to 2009, while, after 1998, only 2002 had an annual mean TC size larger than the overall TC size during the statistical period. Therefore, during the period from 1981 to 2009, there are only three years in which the annual mean TC sizes exceeded 200 km, and these years are 1983, 1987, and 1997, respectively. In addition, the interannual variability in TC sizes over the 29-year period from 1981 to 2009 can be divided into two stages. In the first stage, from 1981 to 2002, the annual mean TC sizes are basically maintained at 175–210 km. In the second stage, starting from 2003, the annual mean TC sizes show a decreasing trend. By 2009, the annual mean TC size in the WNP had decreased to 156.7 km, which is nearly three quarters of that seen in the year of the maximum annual mean TC size occurrence (207.1 km in 1987).

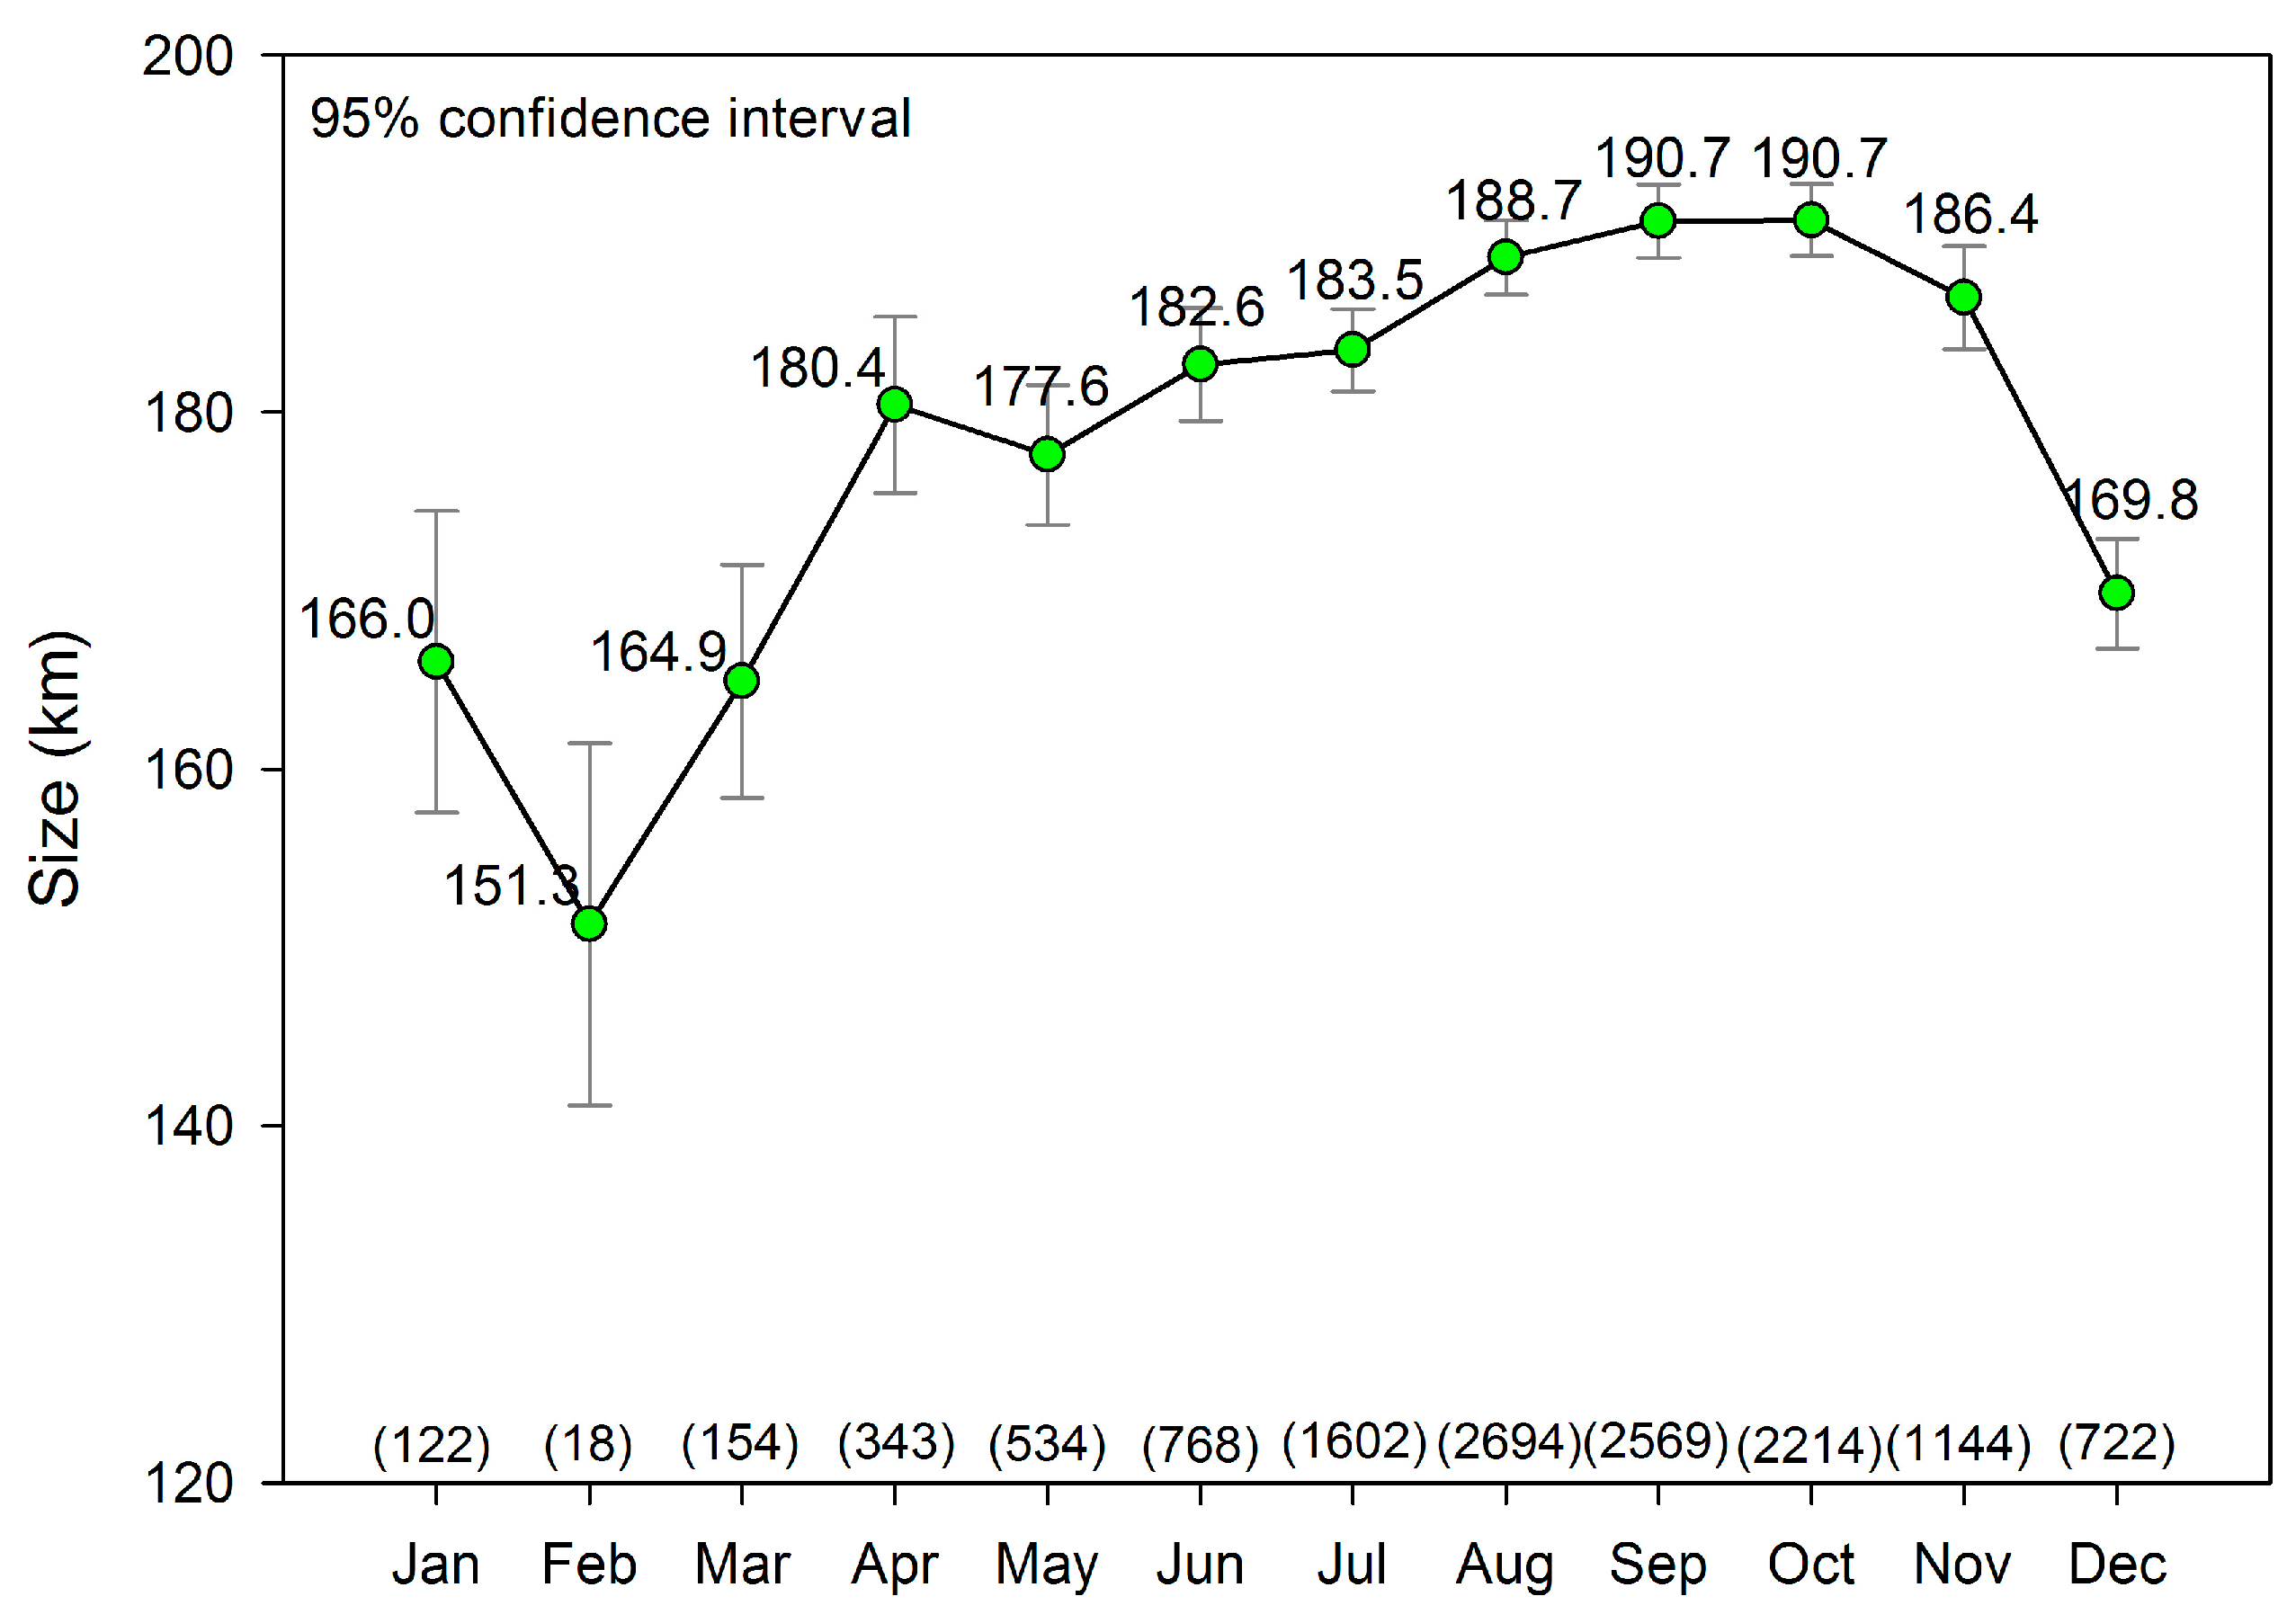
3.2. Monthly Variation

The TC size not only has a very sharp interannual variation characteristic, but TCs also have clear monthly variation. Figure 2 shows the monthly average values of TC size and their 95% confidence intervals, obtained from all samples divided by month. It can be seen that the smallest monthly mean size occurs in February, when the mean value is only 151.4 km, and then the size increases with the following months until it reaches its maximum size in September and October. The mean size reaches 190.8 km in both September and October. Starting from November, the TC size gradually decreases until it reduces to its minimum in February of the following year.

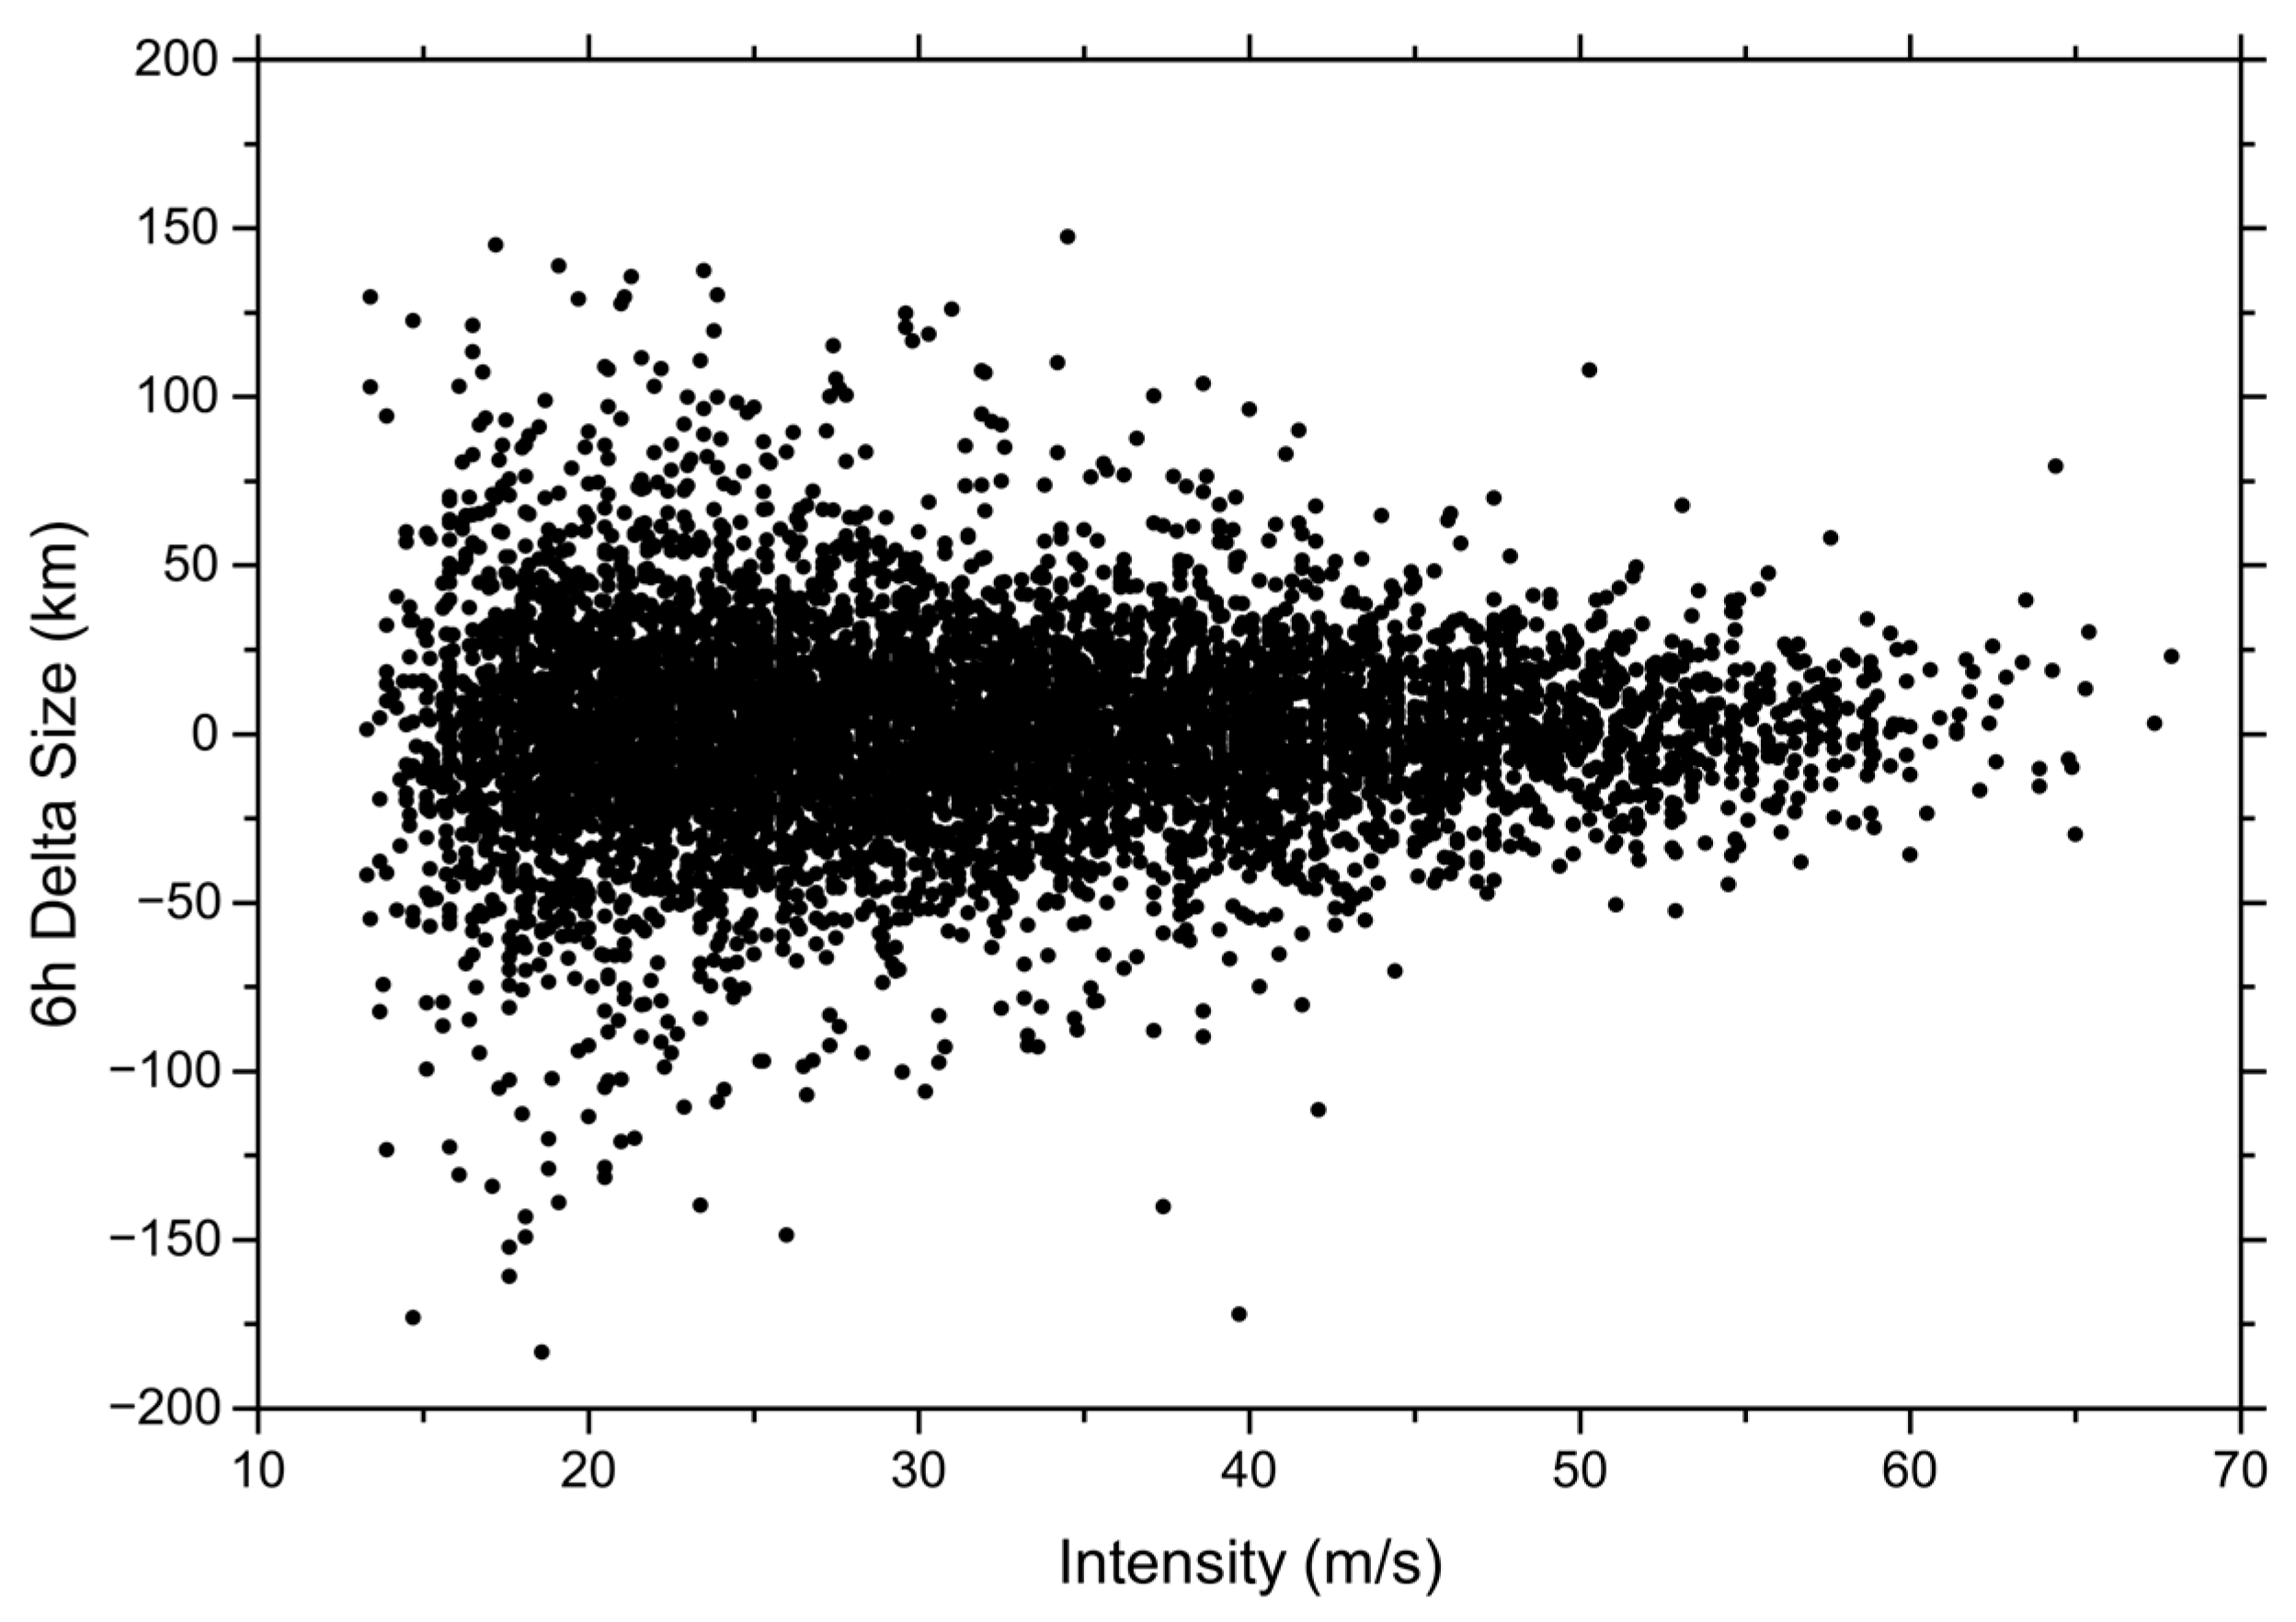
3.3. Relationship between TC Intensity and Size

Previous studies have found a certain relationship between TC intensity and size: e.g., Knaff et al. [19] concluded that there is a positive correlation between TC intensity and size, while Merrill [16] concluded that there is a certain correlation between TC intensity and size, but the correlation coefficient is weak. In this study, a correlation analysis is conducted between the size dataset from Lu et al. [28] and the maximum wind speeds in the TC best track dataset released by STI/CMA. It is found that the correlation coefficient between the TC intensity and size is 0.59 in a total of 13,712 samples from 1981 to 2009 (Figure 3a).
Although the TC size overall becomes larger with increasing intensity from the correlation analysis results, the samples with unusually large sizes are mainly concentrated near the 40 m s−1 intensity. After the TC intensity exceeds 40 m s−1, the number of unusually large size samples gradually decreases. As can be seen in Figure 3a, among the 13,712 samples from 1981 to 2009, the largest value of TC size is 447.5 km, which corresponds to the fourth typhoon of 1985 named Hal, with a maximum wind speed of 40 m s−1. In addition, among the 78 samples with an intensity larger than 60 m s−1, the biggest TC is 310.1 km, while the smallest is 237.4 km, and the mean value of these 78 samples’ size is 274.1 km (Figure 3a). This means that strong TCs do not have the largest size.
In order to further analyze the relationship between TC intensity and size, all 718 TC cases are divided into six categories via their initial intensity according to the National Standard for TC category (GBT19201-2006) issued by the China Meteorological Administration (CMA) [32]: Tropical Depression (TD), 10.8–17.1 m s−1; Tropical Storm (TS), 17.2–24.4 m s−1; Severe Tropical Storm (STS), 24.5–32.6 m s−1; Typhoon (TY), 32.7–41.4 m s−1; Severe Typhoon (STY), 41.5–50.9 m s−1; and Super Typhoon (Super TY), ≥51.0 m s−1.
After adopting the above TC category classification criterion, this paper continues to statistically analyze the relationship between size and intensity during the peak intensity of 718 TC cases, and finds that the overall size and intensity show a positive correlation. Among all 718 TC cases, the maximum size at its peak intensity is 413.4 km, which corresponds to an intensity of 42 m s−1 (Figure 3b).
We further sorted the sizes of 718 TC cases overall, when they reached their peak intensities from large to small, and defined the top (bottom) 25% of the samples as large_size (small_size) TC cases, and the other 50% of TC cases as the normal_size group. Finally, 179, 173, and 366 samples were obtained for large-, small-, and normal-size TCs, respectively. Figure 4a, Figure 4b, and Figure 4c show the geographic distribution of large_size, small_size and normal_size TC cases which are categorized according to their respective peak intensities, respectively. As we can see from Figure 4a–c, the frequencies of occurrence of large_size and small_size TCs under the above category classification criterion are basically the same; both large_size and small_size TCs have the greatest probability of occurrence in the category of TS. However, for the normal_size TC, the largest samples also occur at the TS level. Unlike the other two groups, this group has fewer samples of STY and superTY. Furthermore, the spatial distributions of large_size and small_size TCs are different. This difference is mainly reflected in two points: firstly, large_size TCs rarely occur over pelagic and low-latitude regions; secondly, the probability of large_size TCs occurring over the east of Taiwan and the inshore region of eastern Guangdong Province is higher than that of small_size TCs.
Wu et al. [33,34] reported that the maximum size of the TCs shows a delay after the TC reaches its peak intensity in the WNP basin. We classify all the TC cases into three categories: maximum size reaches after, reaches before, and those coinciding with peak intensity. The numbers of the above three categories are 421, 182, and 99, respectively (Table 1). It can be seen that the quantity of maximum size appearing after the peak intensity is largest (59.9% of the total samples), with a mean lag time of 8.3 h. The percentage of samples where the maximum size occurs before the peak intensity accounts for 25.9% of the total samples, with an average lead time of 9.2 h. The mean relative time for maximum size and peak intensity for all TC cases from 1981 to 2009 is 1.1 h leading. In terms of the geographical distribution of the three types of TCs, the tracks of the first classification of TCs with maximum sizes occurring after peak intensity are more northerly and westerly compared to the tracks of the second classification (Figure 5a,b). In particular, after the TCs arrive in the mid-latitude westerlies region, when the cyclones translate from TCs to extratropical cyclones, the intensity of cyclones is weakening at this time, but the size is often getting bigger. The probability of occurrence of maximum size and peak intensity for the TCs at the same time is relatively low. These TCs are usually concentrated in offshore regions (Figure 5c).
Figure 6 illustrates the relationship between the variation in TC size (6-hour interval) and the corresponding intensity. It can be seen that the TC size variation shows a normal distribution with intensity increasing. TCs with weaker intensity usually have larger size variations, while those with strong intensity do not show much size variation. Basically, the 6-hour size variations in TCs with intensities above 45 m s−1 are almost less than 50 km, except for one sample that reached 77.3 km.

4. Summary

TC size is an important parameter for estimating TC risks, such as precipitation distribution, gale-force wind damage, and storm surge. In this paper, we present the interannual, monthly variation in TC size, and a series of statistical relationships between TC size and intensity in the WNP basin from 1981 to 2009. Below, we summarize the key points on the climatology characterization of TC size and the relationship between TC intensity and size:
(i) From 1981 to 2002, the annual mean TC size oscillated within the range of 175–210 km. However, the annual mean TC sizes showed a decreasing trend since 2003, and by year until 2009, the annual mean TC size was reduced to 156.7 km.
(ii) Statistically, the minimum mean size of TCs in the WNP occurs in February, and then the TC size increases with the following months until it reaches the maximum size in both September and October, which means there are two TC size peaks in September and October for the WNP.
(iii) Although the TC size overall becomes larger with increasing intensity, the samples with unusually large sizes are mainly concentrated near a 40 m s−1 intensity. The largest TC size is 447.5 km, from 1981 to 2009, in the WNP. After the TC intensity exceeds 40 m s−1, the number of unusually large size samples gradually decreases.
(iv) In total, 59.9% of the TCs reach their maximum size after reaching the peak intensity, and the average lag time is 8.3 h. In comparison, the percentage of TCs reaching their maximum size before reaching the peak intensity is 25.9%, with an average lead time of 9.2 h.
(v) TC size variation shows a normal distribution with intensity increasing. TCs with weaker intensity usually have larger size variations, while those with strong intensity do not show much size variation.

Author Contributions

Conceptualization, G.C. and Q.C.; methodology, G.C. and X.L.; software, Q.C.; formal analysis, Q.C.; investigation, G.C.; resources, X.L.; data curation, X.L.; writing—original draft preparation, Q.C.; writing—review and editing, G.C.; visualization, Q.C.; supervision, X.L.; project administration, Q.C.; funding acquisition, Q.C. All authors have read and agreed to the published version of the manuscript.

Funding

This paper was supported by the National Key R&D Program of China (2021YFC3000805).

Institutional Review Board Statement

Not applicable.

Informed Consent Statement

Not applicable.

Data Availability Statement

The STI/CMA tropical cyclone size and best track dataset are available at https://tcdata.typhoon.org.cn/en/tcsize.html and https://tcdata.typhoon.org.cn/en/zjljsjj_sm.html, respectively, accessed on 1 August 2023.

Acknowledgments

Special thanks to Lina Bai for her help with the STI/CMA tropical cyclone best track data, Tim Li for his insights into the analysis of interannual variation of TC size utilized here.

Conflicts of Interest

The authors declare no conflict of interest.

References

  1. Pielke, R.A., Jr.; Gratz, J.; Landsea, C.W.; Collins, D.; Saunders, M.A.; Musulin, R. Normalized hurricane damage in the United States: 1900–2005. Nat. Hazards Rev. 2008, 9, 29–42. [Google Scholar] [CrossRef]
  2. Peduzzi, P.; Chatenoux, B.; Dao, H.; Bono, A.; Herold, C.; Kossin, J.; Mouton, F.; Nordbeck, O. Global trends in tropical cyclone risk. Nat. Clim. Chang. 2012, 2, 289–294. [Google Scholar] [CrossRef]
  3. Chen, L.S.; Meng, Z. Research Progress of Tropical cyclones in China in the past decade. Sci. Atmos. 2001, 25, 588–600. (In Chinese) [Google Scholar]
  4. Chen, Y.; Zhou, J.; Ma, F. Overview of Typhoon landfall research in China. Sci. Meteorol. Sin. 2005, 25, 319–329. (In Chinese) [Google Scholar]
  5. Wen, K. China Climate Festival (Hainan Volume, Guangxi Volume, Guangdong Volume, Fujian Volume, Zhejiang Volume, Jiangsu Volume, Shanghai Volume, Shandong Volume, Hebei Volume, Beijing Volume, Tianjin Volume, Liaoning Volume); China Meteorological Press: Beijing, China, 2006. (In Chinese)
  6. Zhang, W.; Lu, X.; Shao, D.; Ying, M. Tropical Cyclone Yearbook (2001); China Meteorological Press: Beijing, China, 2002. (In Chinese)
  7. Wang, Y.; Wu, C.C. Current understanding of tropical cyclone structure and intensity changes-a review. Meteorol. Atmos. Phys. 2004, 87, 257–278. [Google Scholar] [CrossRef]
  8. Chen, G.; Huang, R. Study on some climatic Issues of Tropical cyclone and typhoon activity in Northwest Pacific. Adv. Earth Sci. 2006, 21, 610–616. (In Chinese) [Google Scholar]
  9. Chen, L.; Xu, X.; Luo, Z.; Wang, J. Introduction to Tropical Cyclone Dynamics; China Meteorological Press: Beijing, China, 2002; pp. 5–6. (In Chinese)
  10. Ren, S.; Liu, Y.; Wu, G. Numerical Experimental study on the interaction between Subtropical High and Typhoon in the Northwest Pacific. J. Meteorol. 2007, 65, 329–340. (In Chinese) [Google Scholar]
  11. Yu, H.; Chen, G.; Zhou, C.; Wong, W.K.; Yang, M.; Xu, Y.; Chen, P.; Wan, R.; Hu, X. Are We Reaching the Limit of Tropical Cyclone Track Predictability in the Western North Pacific? Bull. Am. Meteorol. Soc. 2022, 103, E410–E428. [Google Scholar] [CrossRef]
  12. Landsea, C.W.; Cangialosi, J.P. Have we reached the limits of predictability for tropical cyclone track forecasting? Bull. Am. Meteorol. Soc. 2018, 99, 2237–2243. [Google Scholar] [CrossRef]
  13. Hill, K.A.; Lackmann, G.M. Influence of environmental humidity on tropical cyclone size. Mon. Weather Rev. 2009, 137, 3294–3315. [Google Scholar] [CrossRef]
  14. Chavas, D.R.; Emanuel, K.A. A QuikSCAT climatology of tropical cyclone size. Geophys. Res. Lett. 2010, 37, L18816. [Google Scholar] [CrossRef]
  15. Chan, K.T.F.; Chan, J.C.L. Size and strength of tropical cyclones as inferred from QuikSCAT data. Mon. Weather Rev. 2012, 140, 811–824. [Google Scholar] [CrossRef]
  16. Merrill, R.T. A comparison of large and small tropical cyclones. Mon. Weather Rev. 1984, 112, 1408–1418. [Google Scholar] [CrossRef]
  17. Wang, S.; Toumi, R. On the relationship between hurricane cost and the integrated wind profile. Environ. Res. Lett. 2016, 11, 114005. [Google Scholar] [CrossRef]
  18. Liu, K.S.; Chan, J.C.L. Size of tropical cyclones as inferred from ERS-1 and ERS- 2 data. Mon. Weather Rev. 1999, 127, 2992–3001. [Google Scholar] [CrossRef]
  19. Chavas, D.R.; Lin, N.; Dong, W.; Lin, Y. Observed Tropical Cyclone Size Revisited. J. Clim. 2016, 29, 2923–2939. [Google Scholar] [CrossRef]
  20. Knaff, J.A.; Longmore, S.P.; Molenar, D.A. An objective satellite-based tropical cyclone size climatology. J. Clim. 2014, 27, 455–476. [Google Scholar] [CrossRef]
  21. Brand, S. Very large and very small typhoons of the western North Pacific Ocean. J. Meteorol. Soc. Jpn. 1972, 50, 332–341. [Google Scholar] [CrossRef]
  22. Pennington, J.; DeMaria, M.; Williams, K. Development of a 10-Year Atlantic Basin Tropical Cyclone Wind Structure Climatology. Available online: http://www.bbsr.edu/rpi/research/demaria/demaria4.html (accessed on 17 July 2019).
  23. Yuan, J.; Wang, D.; Wan, Q.; Liu, C. A 28-year climatological analysis of size parameters for Northwestern Pacific tropical cyclones. Adv. Atmos. Sci. 2007, 24, 24–34. [Google Scholar] [CrossRef]
  24. Kimball, S.K.; Mulekar, M.S. A 15-year climatology of North Atlantic tropical cyclones. Part I: Size parameters. J. Clim. 2004, 17, 3555–3575. [Google Scholar] [CrossRef]
  25. Chen, K.X.; Chen, G.H.; Xiang, C.Y.; Li, X.L. Climatic statistical characteristics of tropical cyclone field structure in the Northwest Pacific Ocean based on MTCSWA wind field data. Clim. Environ. Res. 2020, 25, 588–600. (In Chinese) [Google Scholar]
  26. Chan, J.C.L.; Yip, C.K.M. Interannual variations of tropical cyclone size over the western North Pacific. Geophys. Res. Lett. 2003, 30, 2267. [Google Scholar] [CrossRef]
  27. Quiring, S.; Schumacher, A.; Labosier, C.; Zhu, L. Variations in mean annual tropical cyclone size in the Atlantic. J. Geophys. Res. 2011, 116, D09114. [Google Scholar] [CrossRef]
  28. Demuth, J.; DeMaria, M.; Knaff, J.A. Improvement of advanced microwave sounder unit tropical cyclone intensity and size estimation algorithms. J. Appl. Meteorol. Climatol. 2006, 45, 1573–1581. [Google Scholar] [CrossRef]
  29. Lu, X.; Yu, H.; Yang, X.; Li, X. Estimating Tropical Cyclone Size in the Northwestern Pacific from Geostationary Satellite Infrared Images. Remote Sens. 2017, 9, 728. [Google Scholar] [CrossRef]
  30. Ying, M.; Zhang, W.; Yu, H.; Lu, X.; Feng, J.; Fan, Y.; Zhu, Y.; Chen, D. An overview of the China Meteorological Administration tropical cyclone database. J. Atmos. Ocean. Technol. 2014, 31, 287–301. [Google Scholar] [CrossRef]
  31. Lu, X.; Yu, H.; Ying, M.; Zhao, B.; Zhang, S.; Lin, L.; Bai, L.; Wan, R. Western North Pacific tropical cyclone database created by the China Meteorological Administration. Adv. Atmos. Sci. 2021, 38, 690–699. [Google Scholar] [CrossRef]
  32. GB/T 19201-2006; Grade of Tropical Cyclones. China Standards Press: Beijing, China, 2006. (In Chinese)
  33. Wu, L.; Tian, W.; Liu, Q.; Cao, J.; Knaff, J.A. Implications of the observed relationship between tropical cyclone size and intensity over the western North Pacific. J. Clim. 2015, 28, 9501–9506. [Google Scholar] [CrossRef]
  34. Wang, S.; Toumi, R. A historical analysis of the mature stage of tropical cyclones. Int. J. Climatol. 2018, 38, 2490–2505. [Google Scholar] [CrossRef]
Figure 1. Evolution of the annual mean TC size (blue solid circle) and the 95% confidence interval (bars at upper and lower ends of the blue solid circle) of all the samples of each year’s TC size from 1981 to 2009. The red dashed line in the figure indicates the average TC size from 1981 to 2009. The numbers above abscissa are total samples of TC size and number of TCs for each year.
Atmosphere 14 01468 g001
Figure 2. Monthly variation in mean TC size (green solid circle) and the 95% confidence interval (bars at upper and lower ends of the green solid circle) of all the monthly samples.
Atmosphere 14 01468 g002
Figure 3. Relationship between TC intensity and size: (a) scatterplot of intensity and size for all TC samples, (b) scatterplot of intensity and size for a TC at peak intensity.
Atmosphere 14 01468 g003
Figure 4. Geographical distribution of the (a) large size, (b) small size and (c) normal size of TC cases.
Atmosphere 14 01468 g004
Figure 5. Geographic location of maximum size and peak intensity of each TC: (a) maximum size reaches after peak intensity, (b) maximum size reaches before peak intensity, and (c) maximum size coincides with peak intensity. The black solid lines indicate the TC best tracks, red circles indicate the location of maximum size, and blue dots indicate the location of peak intensity.
Atmosphere 14 01468 g005
Figure 6. Scatterplot of TC intensity and size variation.
Atmosphere 14 01468 g006
Table 1. The number, average lag, or lead time of three classifications for maximum size reaches after, reaches before, and those coinciding with peak intensity.
ClassificationNo. of TCsAverage Lag or Lead Time
maximum size reaches after peak intensity421Lag: 8.3 h
maximum size reaches before peak intensity182Lead: 9.2 h
maximum size coincides with peak intensity990 h
Disclaimer/Publisher’s Note: The statements, opinions and data contained in all publications are solely those of the individual author(s) and contributor(s) and not of MDPI and/or the editor(s). MDPI and/or the editor(s) disclaim responsibility for any injury to people or property resulting from any ideas, methods, instructions or products referred to in the content.

