Article

Combined Effects of Heat and Drought Stress on the Growth Process and Yield of Maize (Zea mays L.) in Liaoning Province, China

1
Institute of Atmospheric Environment, China Meteorological Administration, Shenyang 110166, China
2
Key Laboratory of Agrometeorological Disasters, Shenyang 110166, China
*
Authors to whom correspondence should be addressed.
Atmosphere 2023, 14(9), 1397; https://doi.org/10.3390/atmos14091397
Submission received: 28 July 2023 / Revised: 29 August 2023 / Accepted: 31 August 2023 / Published: 4 September 2023
(This article belongs to the Special Issue Impacts of Climate Change and Agro-meteorological Disasters on Crops)

Abstract

:
A method was put forward to identify the combined heat and drought (CHD) events that occurred in summer and affected spring maize in Liaoning province. The spatial and temporal characteristics of CHD and its effects on maize were evaluated based on daily meteorological data at 52 meteorological stations in Liaoning from 1961 to 2020, as well as agricultural data including details of the maize development periods. The effects of CHD on the photosynthetic capacity of maize were evaluated using SIF remote sensing data from 2001 to 2020. The differences in maize photosynthetic capacity in the summers of 2009 and 2018 were compared in detail. The results show that from 1961 to 2020, the occurrence range, frequency, and severity of summer CHD events increased in Liaoning. CHD events were more frequent in June/July, and higher-intensity CHD events were more frequent in July/August. From 1961 to 2020, CHD events occurred in 69% of the years of reduced meteorological yield, and reduced meteorological yield occurred in 41% of the years with CHD events. Maize solar-induced chlorophyll fluorescence (SIF), an index of photosynthesis, was sensitive to temperature (negatively correlated) and precipitation (positively correlated). The CHD events slowed the increasing SIF from the three-leaf stage to the jointing stage, and they stopped the increasing SIF or decreased it at the tasseling–flowering to silking stages. Therefore, maize photosynthesis may be most sensitive to CHD during the flowering to silking stages, and CHD during the silking to milk stages may have the greatest impact on maize yield. Understanding the effects of CHD on maize growth/yield provides a scientific basis for reducing its negative impacts on maize production.

1. Introduction

In recent decades, agricultural production has been affected by adverse climatic conditions and an increasing number of extreme weather events, some of which have led to a significant decline in crop yield and quality and reduced production [1,2,3]. Global climate change results in combinations of abiotic stresses that affect crop growth, among which the combination of heat stress and drought stress is the most common [4,5]. Global climate change has also led to increases in the frequency and severity of droughts and heat waves, which pose great risks to global agricultural production and threaten global food security [6]. The drought and heat events that swept Europe in 2003 resulted in a 30% decline in agricultural production [2]. The heat wave event in western Russia in 2010 caused a serious decline in grain production, and the yield of the wheat belt was less than half that in the previous year [7]. In 2012, heat and drought stress increased the heat sensitivity of maize growing on the Great Plains of the United States, resulting in a 20% decrease in maize yield [3]. In the summer of 2022, the Yangtze River basin suffered the strongest high-temperature and drought event in China since 1961, which affected more than 40,000 km2 of crops and severely affected crop production [8,9]. The global climate is changing from one in which heat and drought rarely occur simultaneously to one where large areas of crops are exposed to both stresses every year [10]. If heat waves are combined with flash or long-term droughts, they have a devastating impact on agriculture and the social economy [11].
Droughts and heat waves are often caused by similar weather circulation anomalies, exacerbated by coupling with soil moisture and atmospheric factors [12]. The frequent occurrence of hot weather affects precipitation, accelerates soil water evaporation, further aggravates the severity of drought, and enhances the drought risk [13,14,15]. Crop yields are reduced when drought and heat stresses occur simultaneously [12,16]. The effect of combined heat and drought (CHD) events may be greater than the sum of the effects of individual events [17,18]. On the one hand, leaf temperature is regulated to limit damage under high temperatures by enhanced transpiration, although this accelerates water deficit and aggravates drought [3]. On the other hand, the reduction in available water means that the ability of crops to regulate temperature through evaporative cooling is limited, so crops become even more vulnerable to damage caused by high temperatures [16]. To resist the combined effects of high temperatures and drought, crops must balance stomatal responses to prevent water loss and overheating [19]. Therefore, the combination of heat and drought stress has more complex effects on crops than either of the single stresses. In the face of frequent extreme weather events combined with high temperatures and drought, new scientific questions are being raised and challenges are being put forward to understand how the combination of heat and drought stresses affects crop growth, how to quantify the impact on crops, and how to improve the adaptation of crops to these new extreme climate conditions.
At present, there are few research studies on the indicators of combined agrometeorological disasters. To date, the superposition and screening method of single disaster indicators has usually been used to identify combined agrometeorological disasters [20,21,22]. There are many indices to identify a single drought, such as the standardized precipitation evocation index (SPEI), Palmer drought severity index (PDSI), crop water deficit index (CWDI), and evaporative demand drought index (EDDI) [23]. The evaporative demand drought index (EDDI), based on atmospheric evaporation demand (E0), was proposed by Hobbins et al. [24] and considers radiative forcing and stratosphere forcing in the evaporation process. It provides continuous information about abnormal evaporation demand in a certain region, and it has the ability to capture drought stress signals at different time scales. For this reason, it is used for drought identification and early warning [25,26]. Compared with other indices, EDDI has obvious advantages in analyzing the temporal variation in drought. The growth of crops is sensitive to temperature changes, especially when we consider thermophilic crops such as maize and rice. When the temperature exceeds a threshold, the crops will be affected or even stop growing [27]. Daily mean temperature or maximum temperature and the duration of high temperature are usually used as indicators of crop heat events.
Maize (Zea mays L.) is the third most important grain in the world, after wheat and rice, because it is one of the most diverse and versatile crops. Maize is grown under a wide range of agricultural conditions [28]. Drought can limit the photosynthesis and stomatal movement of maize, thus affecting its growth and physiological metabolism [29]. Long-term exposure of maize to temperatures above 35 °C is not conducive to growth, and temperatures higher than 40 °C, especially during the flowering and filling stages, seriously affect maize yield [30]. When drought and high temperatures occur simultaneously, the growth and function of maize plants decrease rapidly. These combined stresses intensify the effect on crop morphology and physiological characteristics [31]. Studies have shown that the loss of grain yield caused by drought and heat waves in Europe is twice that of non-grain crops [32]. Under an exceptional drought, maize yield in the United States would have a 78.1% probability of loss risk, especially in the central and southeastern US [33]. CHD stress has reduced the maize yield in Northeast China by 18.75%, and the effect of the combined stresses is greater than that of drought or heat stress alone [34]. Although there are many studies on CHD extreme weather events and their effects on crop yield, few studies have assessed the comprehensive effects of these combined stresses on the growth process of maize. In addition, the effect of these combined stresses on maize plants at different development stages is still unclear. Understanding the effects of combined stresses on the maize growth process will be helpful to improve the resistance of the maize production system to the extreme climate under global warming.
Liaoning Province is one of the important grain production bases in Northeast China. Droughts have occurred in most of the years when maize production was reduced [21]. To better understand how CHD stress affects maize growth, we put forward a method to identify the CHD affecting spring maize in Liaoning, and we evaluated the characteristics of CHD events over the past 60 years and their comprehensive effects on maize growth and yield. Chlorophyll fluorescence parameters can characterize vegetation photosynthesis, and research on this using remote sensing has developed rapidly in recent years. It has been found via satellite remote sensing that solar-induced chlorophyll fluorescence (SIF) is closely related to crop photosynthesis, and it can be used to monitor changes in the physiological state and water stress [35]. We used EDDI to identify maize drought events, daily maximum temperature and its duration threshold to identify maize heat events, and SIF remote sensing data to monitor the effects of CHD on maize physiological processes. We determined the temporal and spatial characteristics and trends in the occurrence of CHD events, and we identified areas and development periods that have been severely affected by CHD. These findings provide a scientific basis for preventing and alleviating the negative effects of CHD events on maize production.

2. Materials and Methods
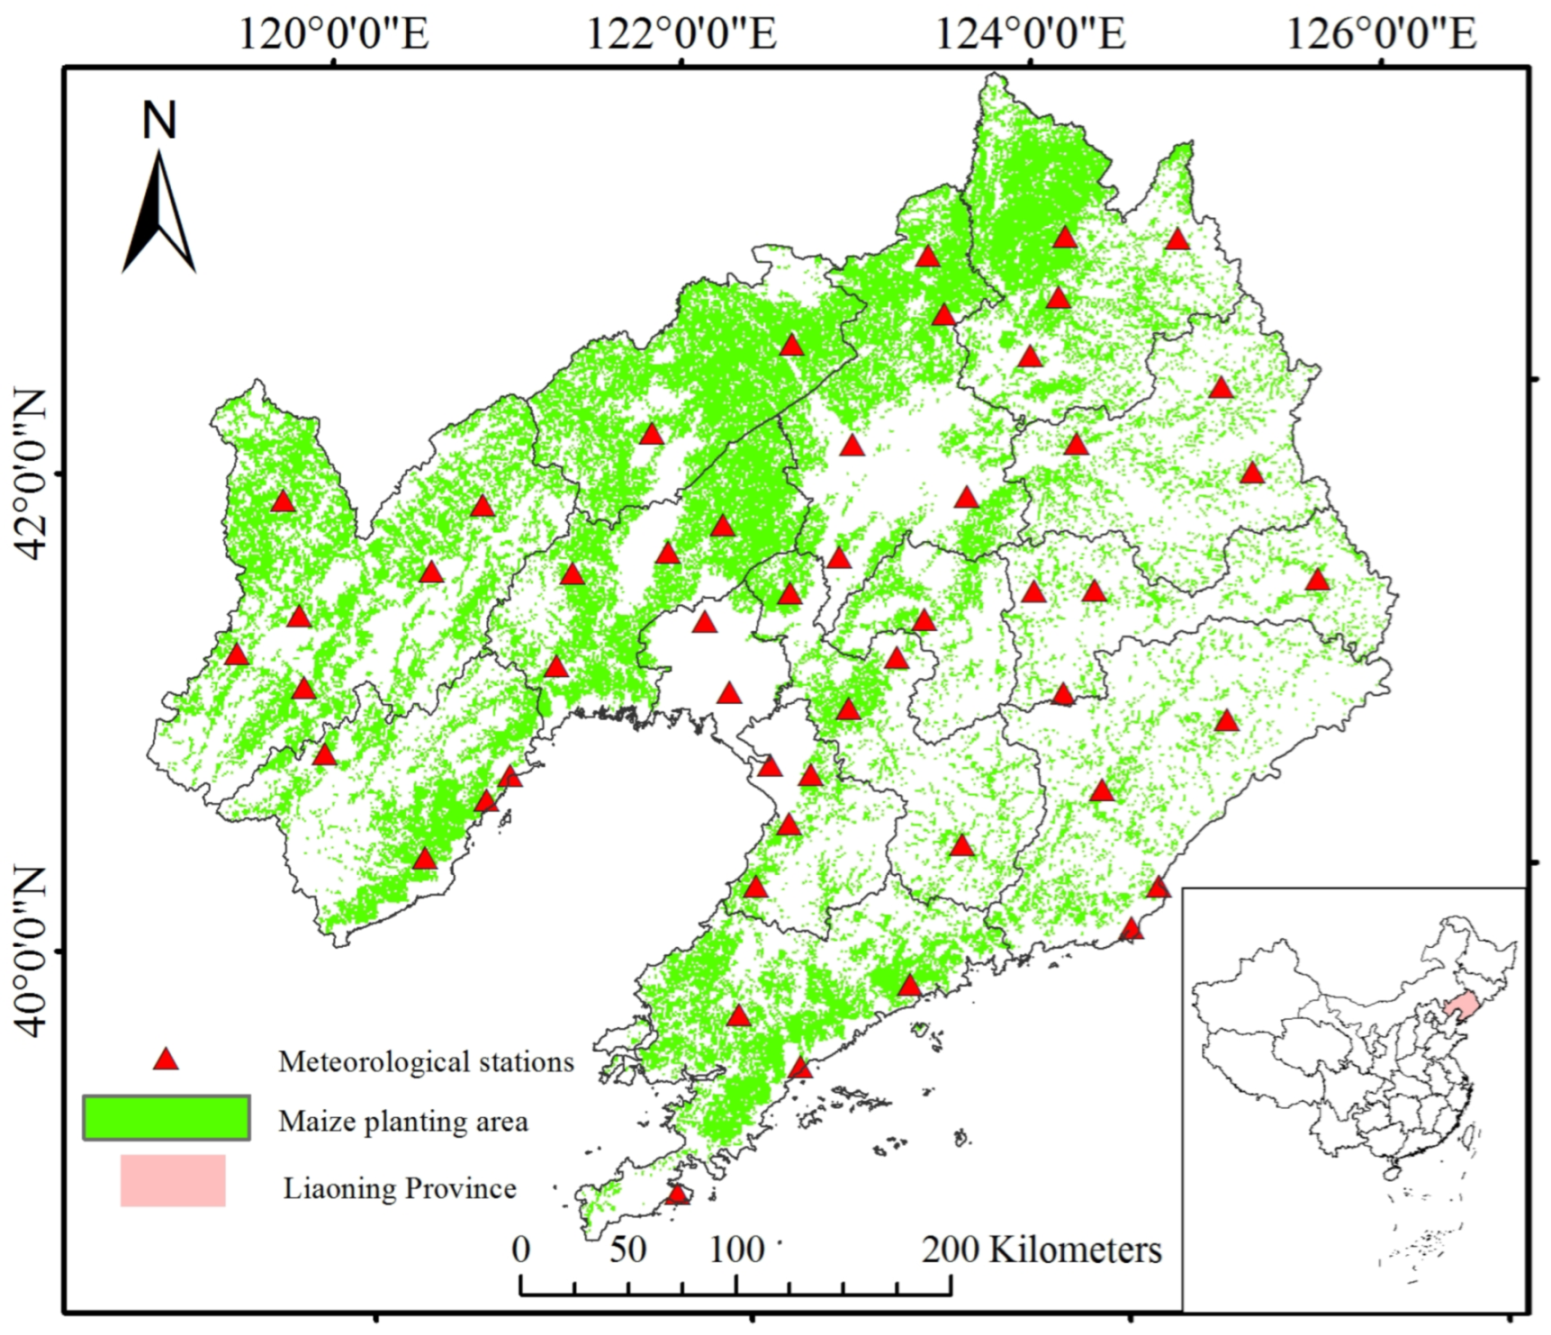
2.1. Materials

Daily meteorological data including average temperature, maximum temperature, and precipitation collected at 52 meteorological stations in Liaoning Province from 1961 to 2020 (Figure 1), as well as agricultural meteorological data including details of the maize development periods, were obtained from the Liaoning Meteorological Bureau. The maize cultivation area and yield data were obtained from the Liaoning Provincial Bureau of Statistics [36].
The solar-induced chlorophyll fluorescence (SIF) data were obtained from the National Tibetan Plateau Data Center (http://data.tpdc.ac.cn/home, accessed on 31 July 2022), with a spatial resolution of 0.05° and a temporal resolution of 8 days [37]. Based on the SIF data from The TROPOspheric Monitoring Instrument (TROPOMI) on the Copernicus Sentinel-5P mission, Chen et al. [27] reconstructed global TROPOMI SIF (RTSIF) over the 2001–2020 period in clear-sky conditions with a high spatio-temporal resolution by using a machine learning method. In this study, ArcGIS software (V9.3, Environmental Systems Research Institute, Inc., Redlands, CA, USA) was used to perform regional extraction, spatial analysis, and mathematical calculations on the RTSIF dataset. We extracted SIF information from the global RTSIF dataset every 8 days during summer (June–August) from 2001 to 2020 in Liaoning Province and its maize-growing areas.

2.2. Methods

2.2.1. Drought Identification Method

The EDDI is obtained by sorting the cumulative value of evaporative demand (E0) in a set time scale, constructing the distribution probability of E0, and normalizing it. The EDDI calculated using the non-parametric method based on ranks can be compared with other standardized indices such as SPEI. E0 is estimated with the Penman–Monteith model. The specific calculation for EDDI is described in detail elsewhere [24,25].
In our study, the daily EDDI of 52 meteorological stations in Liaoning Province from 1961 to 2020 was calculated on a two-week time scale. That is, the daily EDDI represents the drought situation in the past two weeks. The percentile values of EDDI in a time series are used to classify drought categories. The higher the EDDI percentile value, the worse the drought. EDDI percentiles greater than 70% are divided into five drought categories, as follows: slight drought 70–80%, moderate drought 80–90%, severe drought 90–95%, extreme drought 95–98%, and exceptional drought >98% [26].

2.2.2. Method for Identifying Heat Events

The occurrence of high-temperature events is not only related to high temperature intensity but also to duration [27]. According to the local standard of Liaoning Province, “DB21/T 2014–2012 Meteorological disaster definition and classification”, the weather process with a daily maximum temperature greater than or equal to 33 °C and lasting for 3 days or more is defined as high temperature, which is applicable to Liaoning Province [38]. Guo et al. [39] considered that the upper limits of the maximum temperature of spring maize in the seedling stage, vegetative growth stage, vegetative and reproductive development stage, flowering–filling stage, and filling–maturing stage in Northeast China under high-yield conditions were 27 °C, 30 °C, 33 °C, 32 °C, and 30 °C, respectively. The maximum daily temperature of 33 °C was taken as the high-temperature threshold of spring maize with reference to the upper-limit temperature of each growing stage of maize. Therefore, a daily maximum temperature greater than or equal to 33 °C for 3 or more consecutive days was defined as a heat event for Liaoning spring maize.

2.2.3. Identification of CHD Events

The above-mentioned methods were used to identify drought and heat events, respectively. A CHD event was recorded if the meteorological station experienced both a drought and a heat event in one month. The results of EDDI’s drought classification reflect the agricultural drought caused by the combined drought and heat stress. Therefore, we divided the CHD events into five categories, which are the same as EDDI’s classification of five drought categories. If there is no heat event at a meteorological station in one month, it records no CHD. According to the drought classification, the CHD events were divided into five categories, as follows: slight CHD, moderate CHD, severe CHD, extreme CHD, and exceptional CHD.
The heat events and drought events that occurred in summer from 1961 to 2020 at 52 meteorological stations were identified. Heat and drought events that occurred simultaneously at a station in a certain year and month were recorded as CHD events. The CHD events at 52 meteorological stations in the past 60 years were summarized.
The proportion of the number of stations recording CHD events out of the total stations (IOC) in a given period in a year indicated the occurrence range of CHD in the region with regard to temporal variation. The disaster occurrence range was divided into local, regional, and large-scale categories, with corresponding IOC values of ≤0.2, 0.2–0.5 and >0.5, respectively [21,22]. The frequency (P, %) described the spatial characteristics of disasters and was calculated as the proportion of years with a CHD event in a given period out of the total years.

2.2.4. Simulation of Meteorological Yield and Yield Reduction in Maize

Based on the maize per unit yield (dry weight) in Liaoning from 1961 to 2020, a quadratic polynomial was used to simulate the trend in maize yield (decision coefficient R2 = 0.81). The meteorological yield was determined by separating maize per unit yield. Then, the meteorological yield reduction rate, that is, the yield reduction rate caused by meteorological conditions, was calculated as follows:
Yt = −0.1852x2 + 19.448x + 118.81
Yw = YaYt
ΔY = Yw/Yt
where Yt is the maize yield trend (g/m2); x is the year number in a time series (1, 2...); Yw is the meteorological yield (g/m2); Ya is the actual maize yield (g/m2); and ΔY is the yield reduction rate based on meteorological yield (%).

2.2.5. Average Multi-Year Growth Date of Maize

The annual growth period of maize was determined based on 5 climatic zones of Liaoning, namely eastern Liaoning, western Liaoning, southern Liaoning, northern Liaoning and central Liaoning. The long-term mean duration of the maize growth period in different climatic regions of Liaoning was calculated from 1991 to 2020 [21,40]. The average growth periods of maize (three-leaf stage, seven-leaf stage, jointing stage, heading stage, flowering stage, silking stage and milk stage) in June, July, and August in Liaoning Province are shown in Figure A1.

2.2.6. Correlation Analysis and T-Test Analysis

The relationship between the X and Y factors of each pixel was analyzed using Pearson’s correlation analysis method, using the following formula:
r xy = i = 1 n ( x i X ¯ ) ( y i Y ¯ ) i = 1 n ( x i X ¯ ) 2 i = 1 n ( y i Y ¯ ) 2 .
where rxy is the correlation coefficient; n is the time series; xi and yi are the values of X and Y, respectively (X and Y are two factor sequences) in year i; and X ¯ and Y ¯ are the average values of the sequences X and Y, respectively.
The T-test method was used to test the significance of the IOC variation trend. For these analyses, we used IBM SPSS Statistics software (V25, International Business Machines Corporation, Armonk, NY, USA).

3. Results

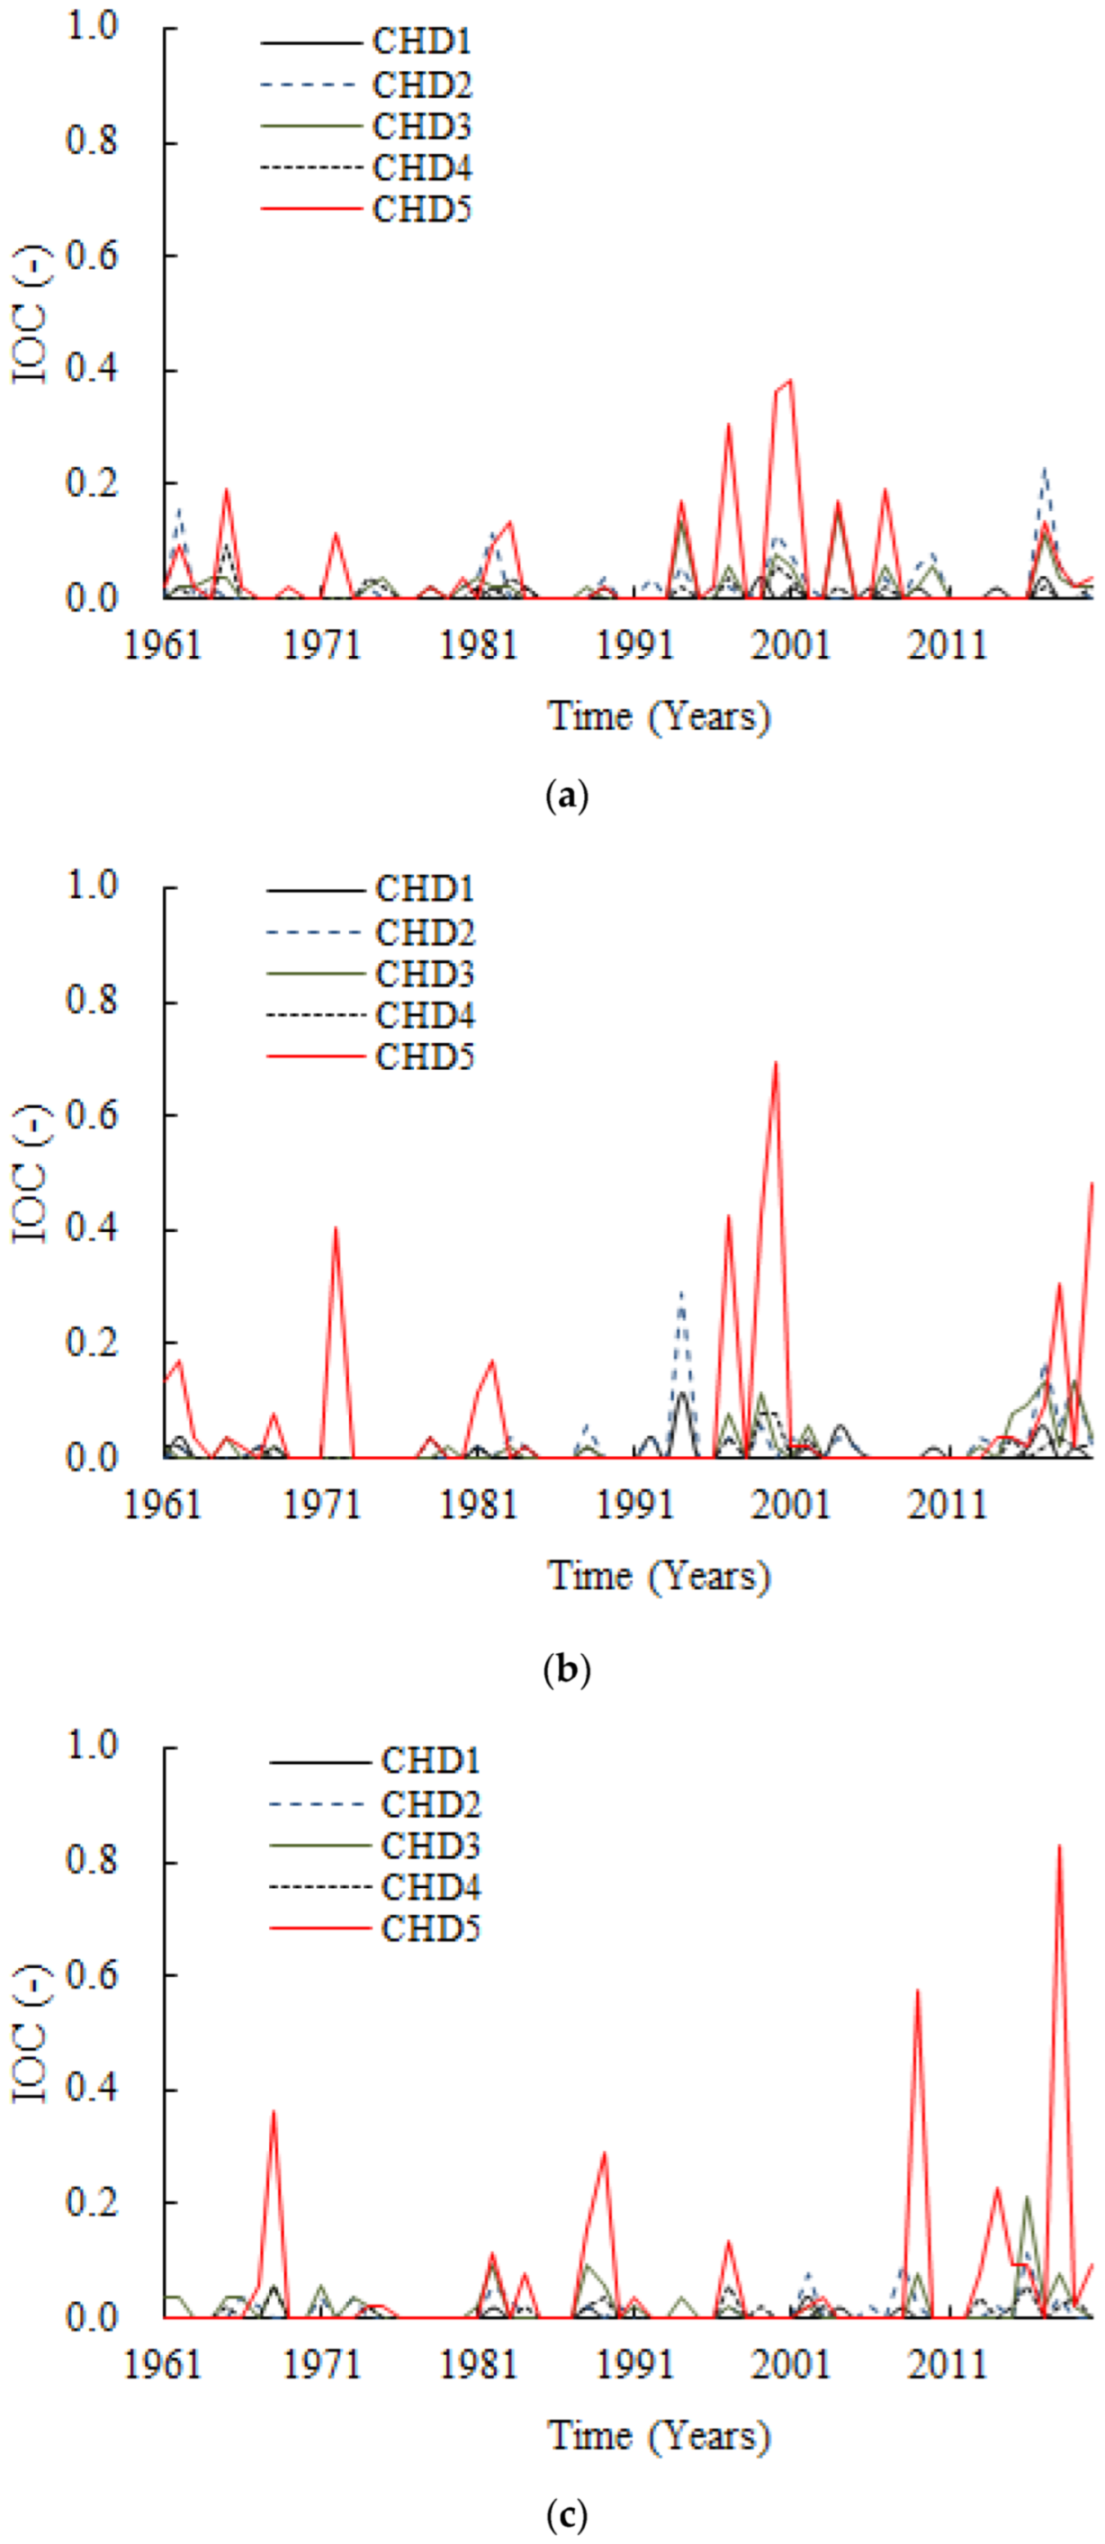
3.1. Temporal and Spatial Characteristics of Combined CHD Events in Summer over 60 Years

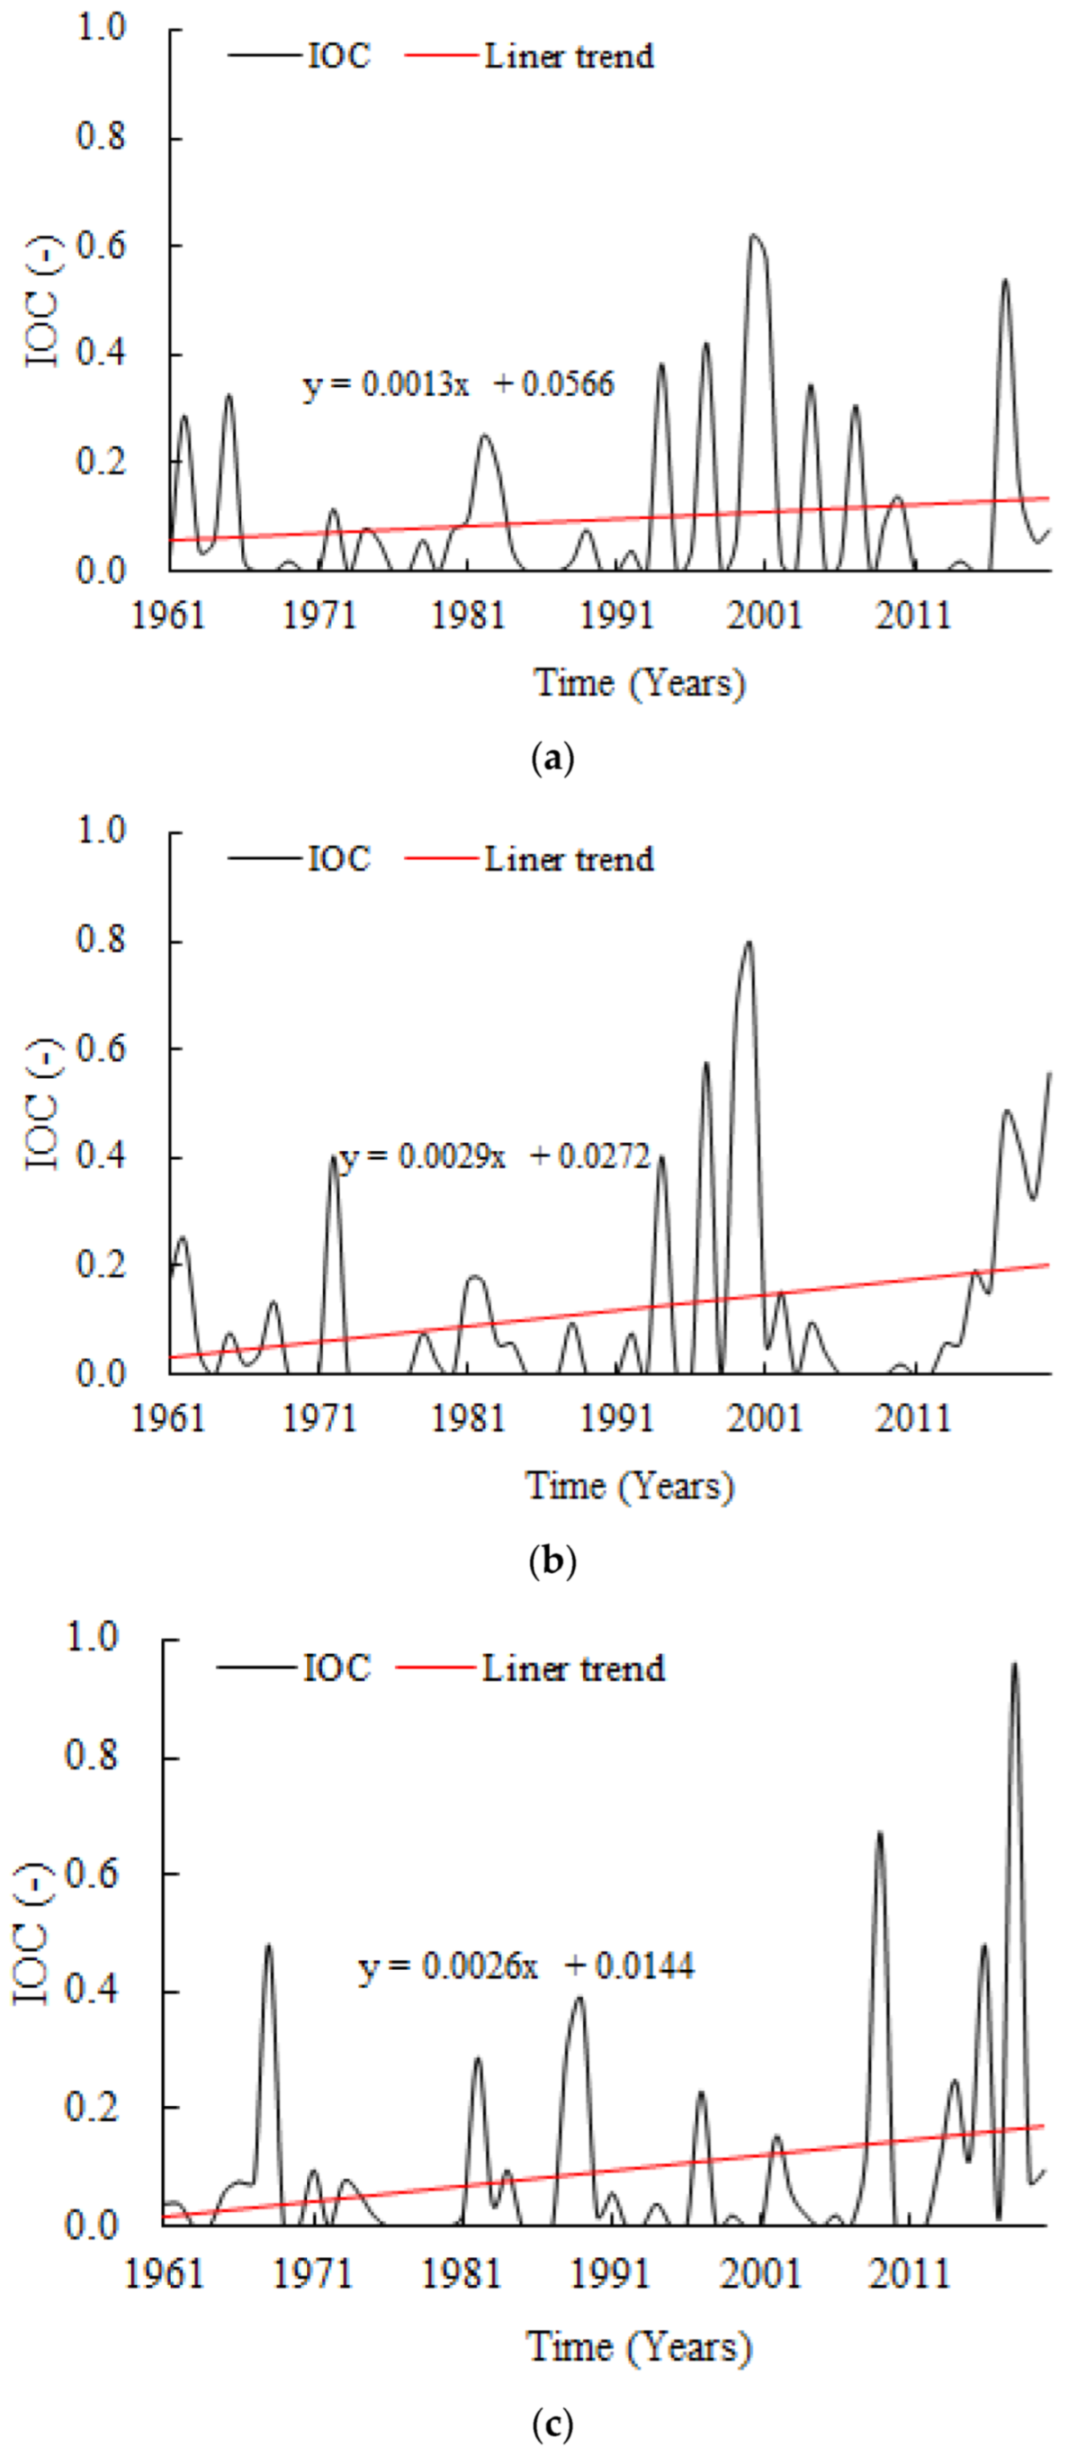
3.1.1. Annual Variation Characteristics

From 1961 to 2020, the IOC values in June, July, and August showed an upward trend. T-test results showed that IOC values in June, July and August all experienced a significantly increasing trend over the past 60 years (at p < 0.05 level). Out of the past 60 years, in June, there were 3 years with large-scale CHD events (IOC > 0.5), 7 years with regional CHD events, 26 years with local CHD events, and a remaining 24 years with no CHD events (Figure 2a). In July, there were 4 years with large-scale CHD events, 6 years with regional CHD events, 23 years with local CHD events, and a remaining 27 years with no CHD events (Figure 2b). In August, there were 2 years with large-scale CHD events, 7 years with regional CHD events, 26 years with local CHD events, and a remaining 25 years with no CHD events (Figure 2c).
Before 1996, there were no large-scale CHD events, only regional or local CHD events. After 1996, there was a range of large-scale CHD events occurring in June, July, and August (Table 1). The average IOC values in June, July, and August during the 60-year period were 0.10, 0.12, and 0.09, respectively. The month with the highest average occurrence range was July, followed by June. Against a background of climate change, the occurrence of CHD events showed an increasing trend in summer (June to August) in Liaoning Province over the 60-year period.
In June, regional CHD events in the exceptional category occurred in 1997, 2000, and 2001, with IOC values of 0.31, 0.37, and 0.38, respectively. Regional CHD events in the moderate category occurred in June 2017, with an IOC value of 0.23. If they occurred, the scale of CHD events was local in June of the other years (Figure 3a).
In July 2000, there was a large-scale CHD event in the exceptional category, with an IOC value of 0.69. In July, regional CHD events in the exceptional category occurred in 1972, 1997, 1999, 2018, and 2020, with IOC values of 0.40, 0.42, 0.42, 0.31, and 0.48, respectively. In July 1994, there was a regional CHD event in the moderate category, with an IOC value of 0.29. If they occurred, the scale of CHD events was local in July of the other years (Figure 3b).
In August 2009 and 2018, there were large-scale CHD events in the exceptional category, with IOC values of 0.58 and 0.83, respectively. In August, regional CHD events in the exceptional category occurred in 1968, 1989, and 2014, with IOC values of 0.37, 0.29, and 0.23, respectively. In August 2021, there was a regional CHD event in the severe category, with an IOC value of 0.21. If they occurred, the scale of CHD events was local in August of the other years (Figure 3c).
The occurrence range of exceptional CHD events was generally wider than that of CHD events in other categories, indicating that maize was likely to suffer from exceptional extreme drought once a CHD event occurred. In June, there were three exceptional CHD events and one moderate CHD event at the regional level, but no large-scale CHD events in other categories. In July, there was one exceptional CHD event at the large scale, five exceptional CHD events at the regional level, and one moderate CHD event at the regional level. In August, there were two exceptional CHD events at the large scale, two exceptional CHD events at the regional level, and one severe CHD event at the regional level. The occurrence range of exceptional CHD events was wider in July and August than in June. The IOC value of exceptional CHD events showed an increasing trend from June to August, indicating that the intensity of CHD events increased under climate change during the 60-year period.

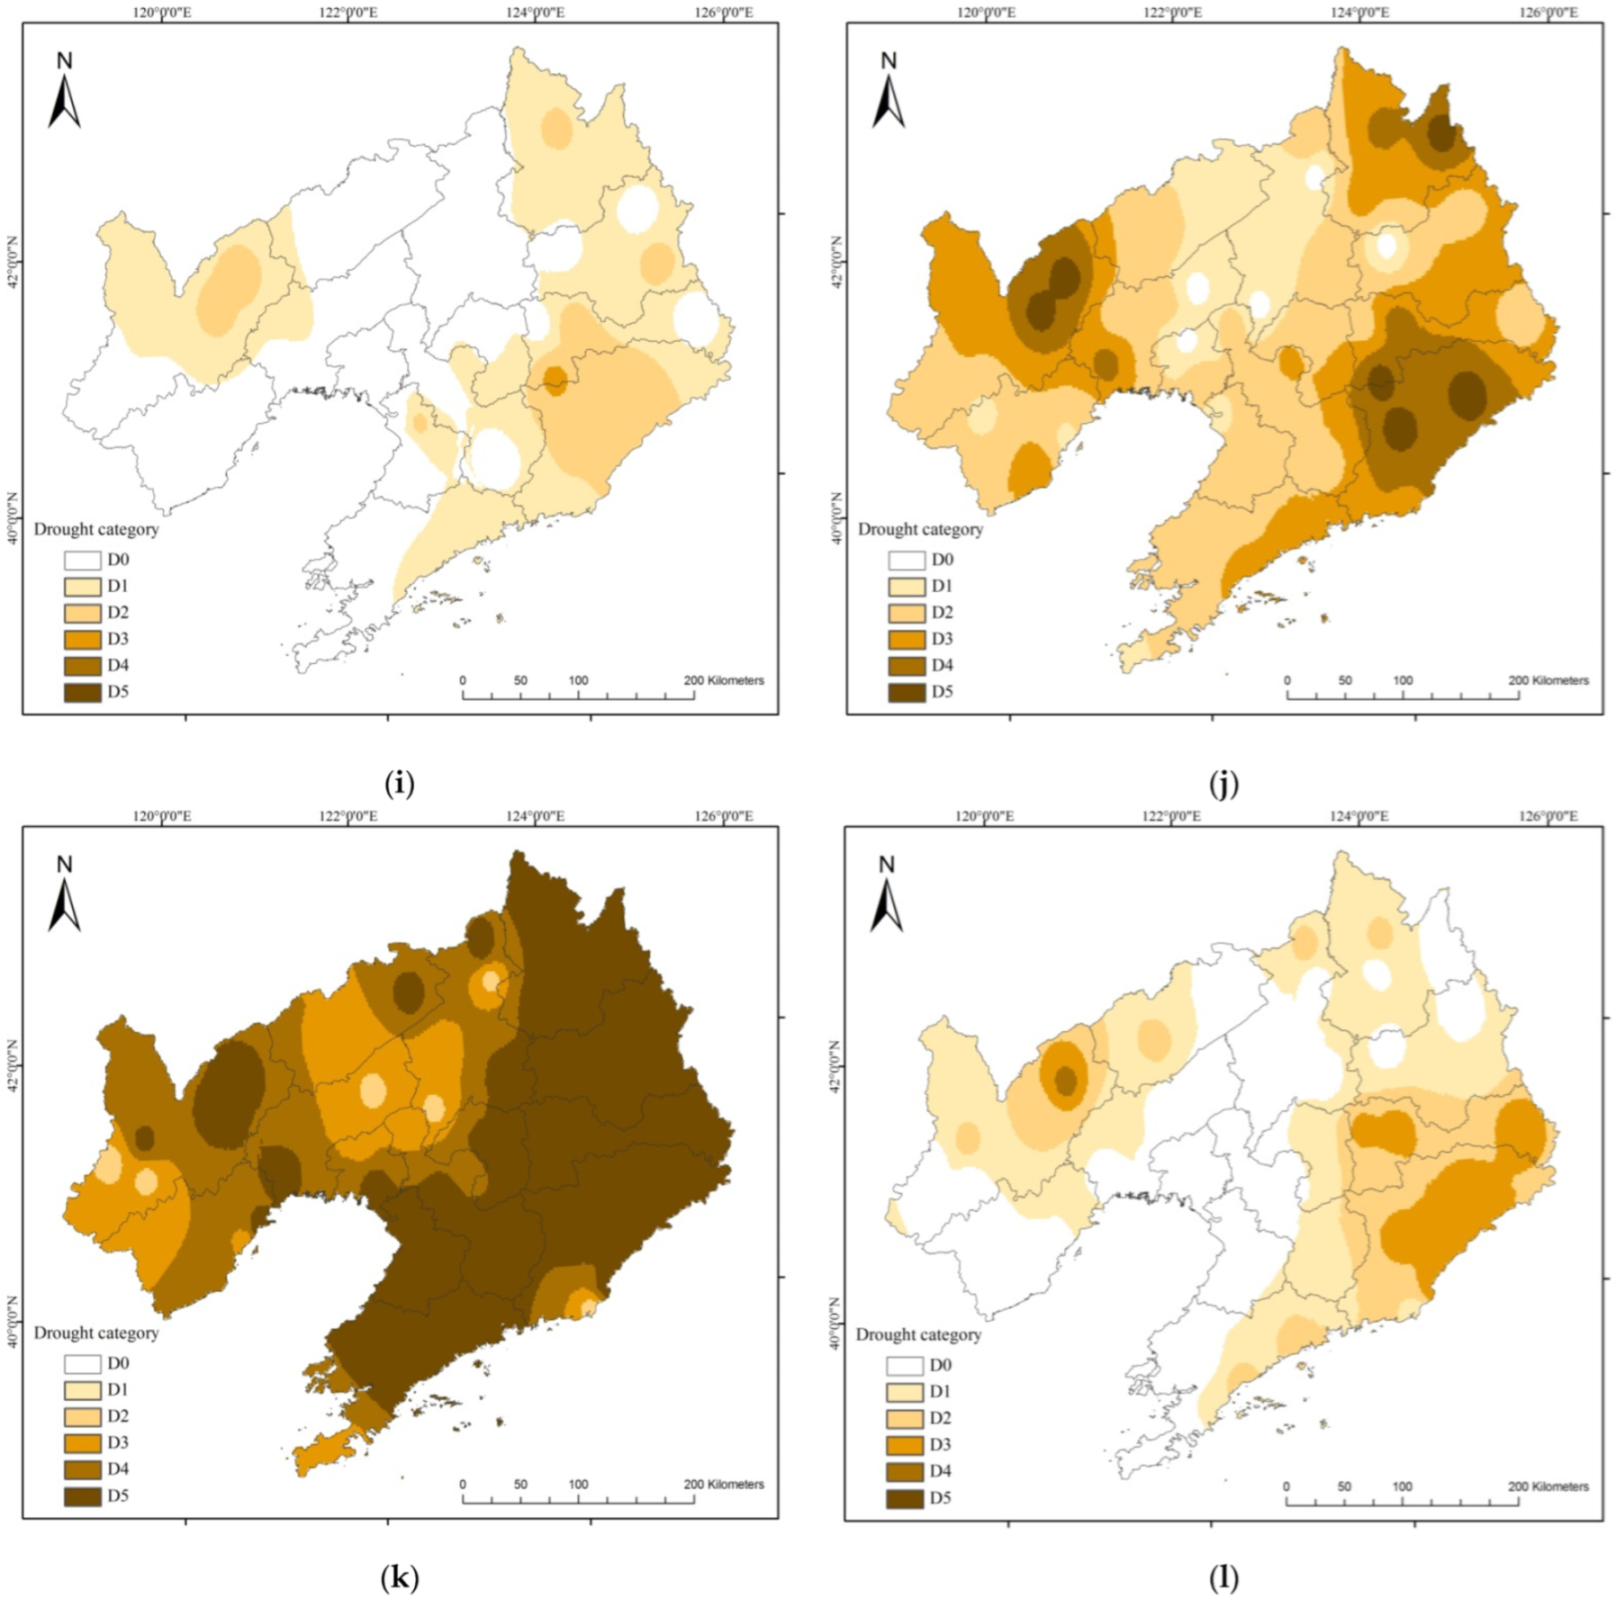
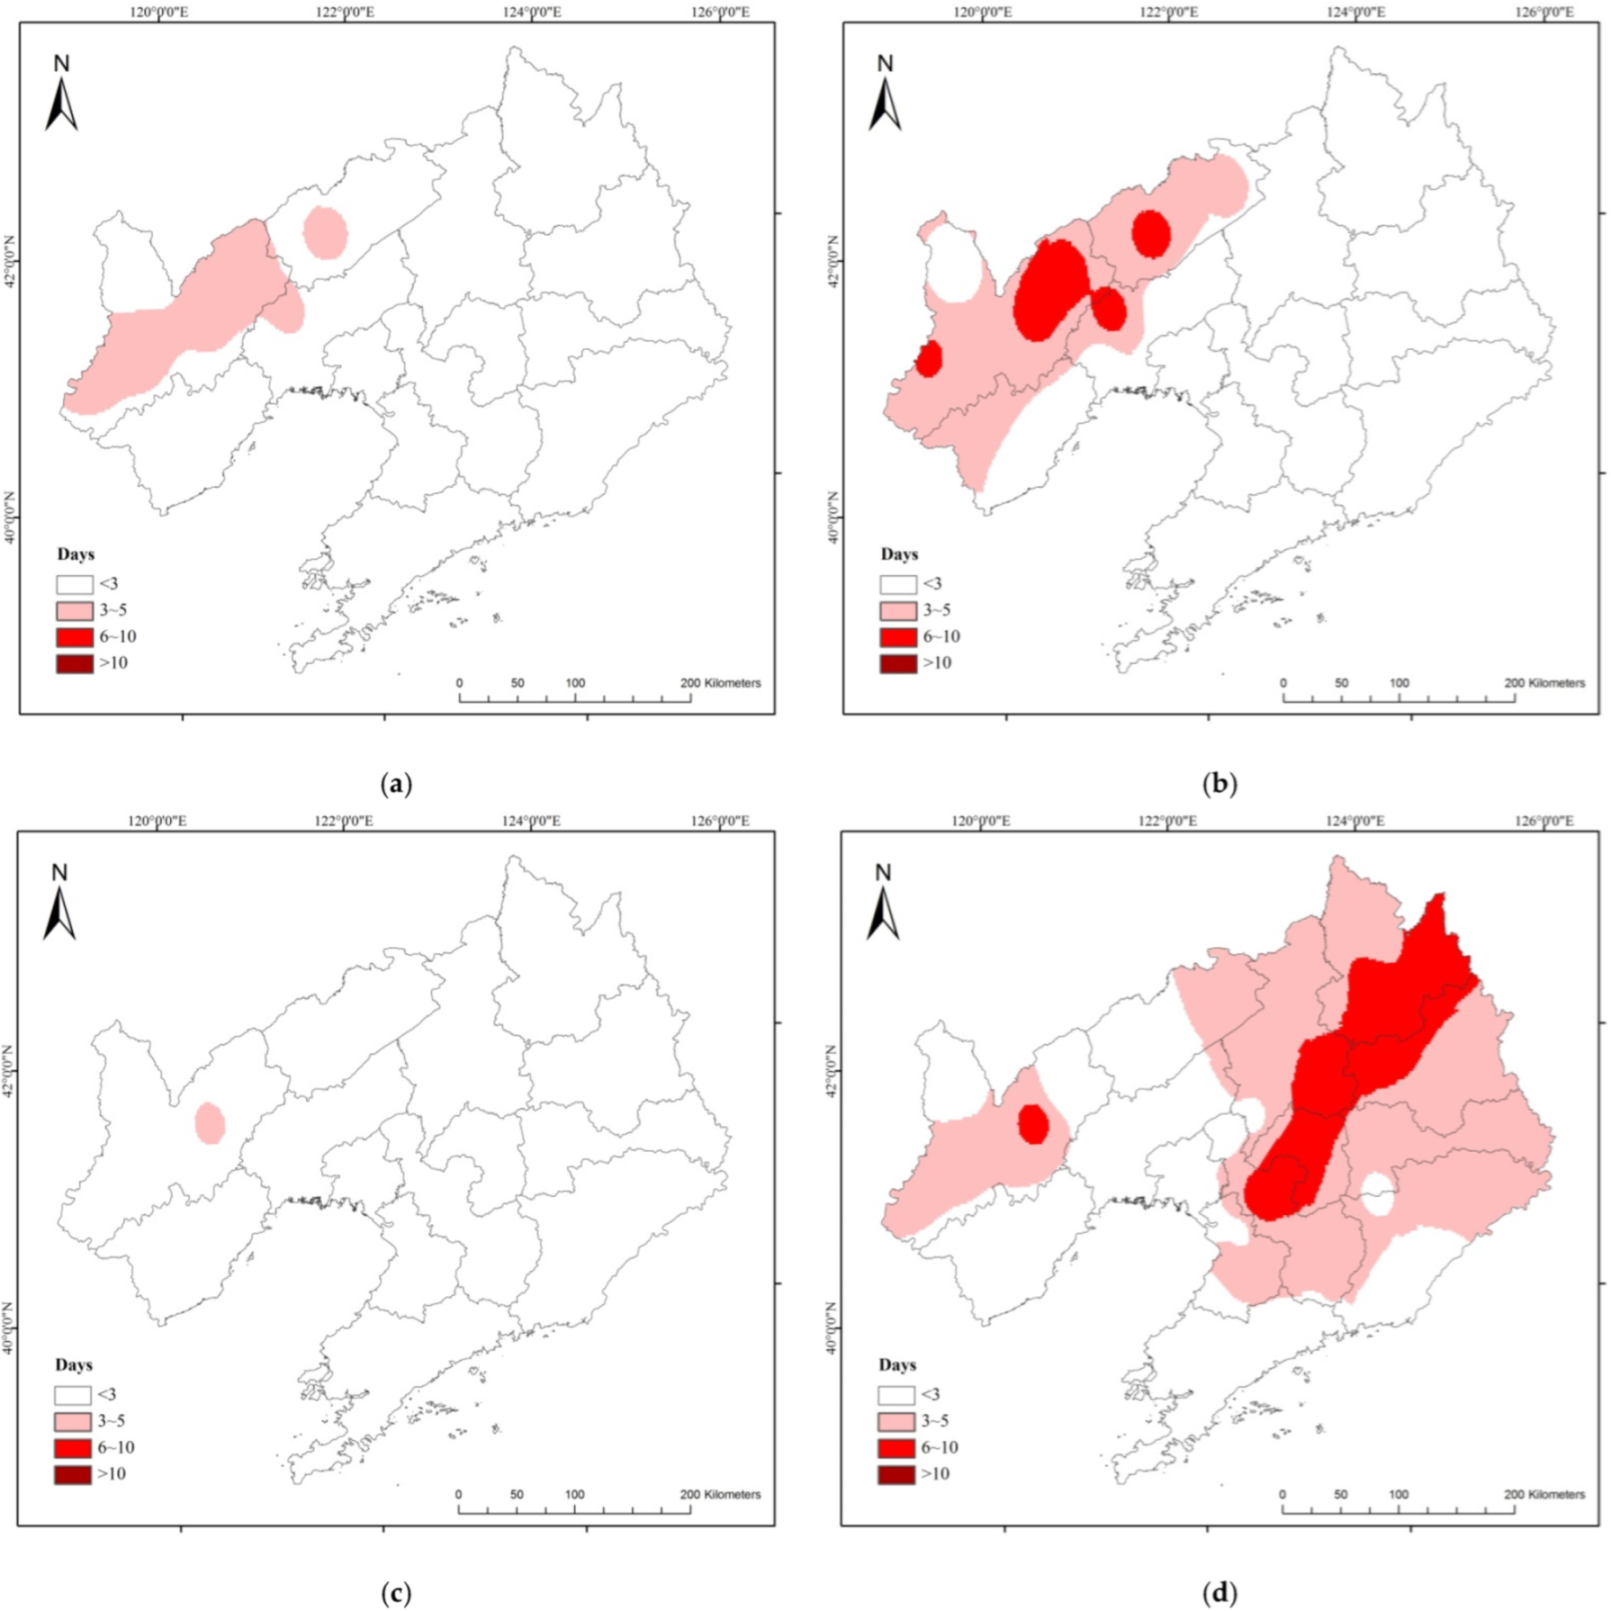
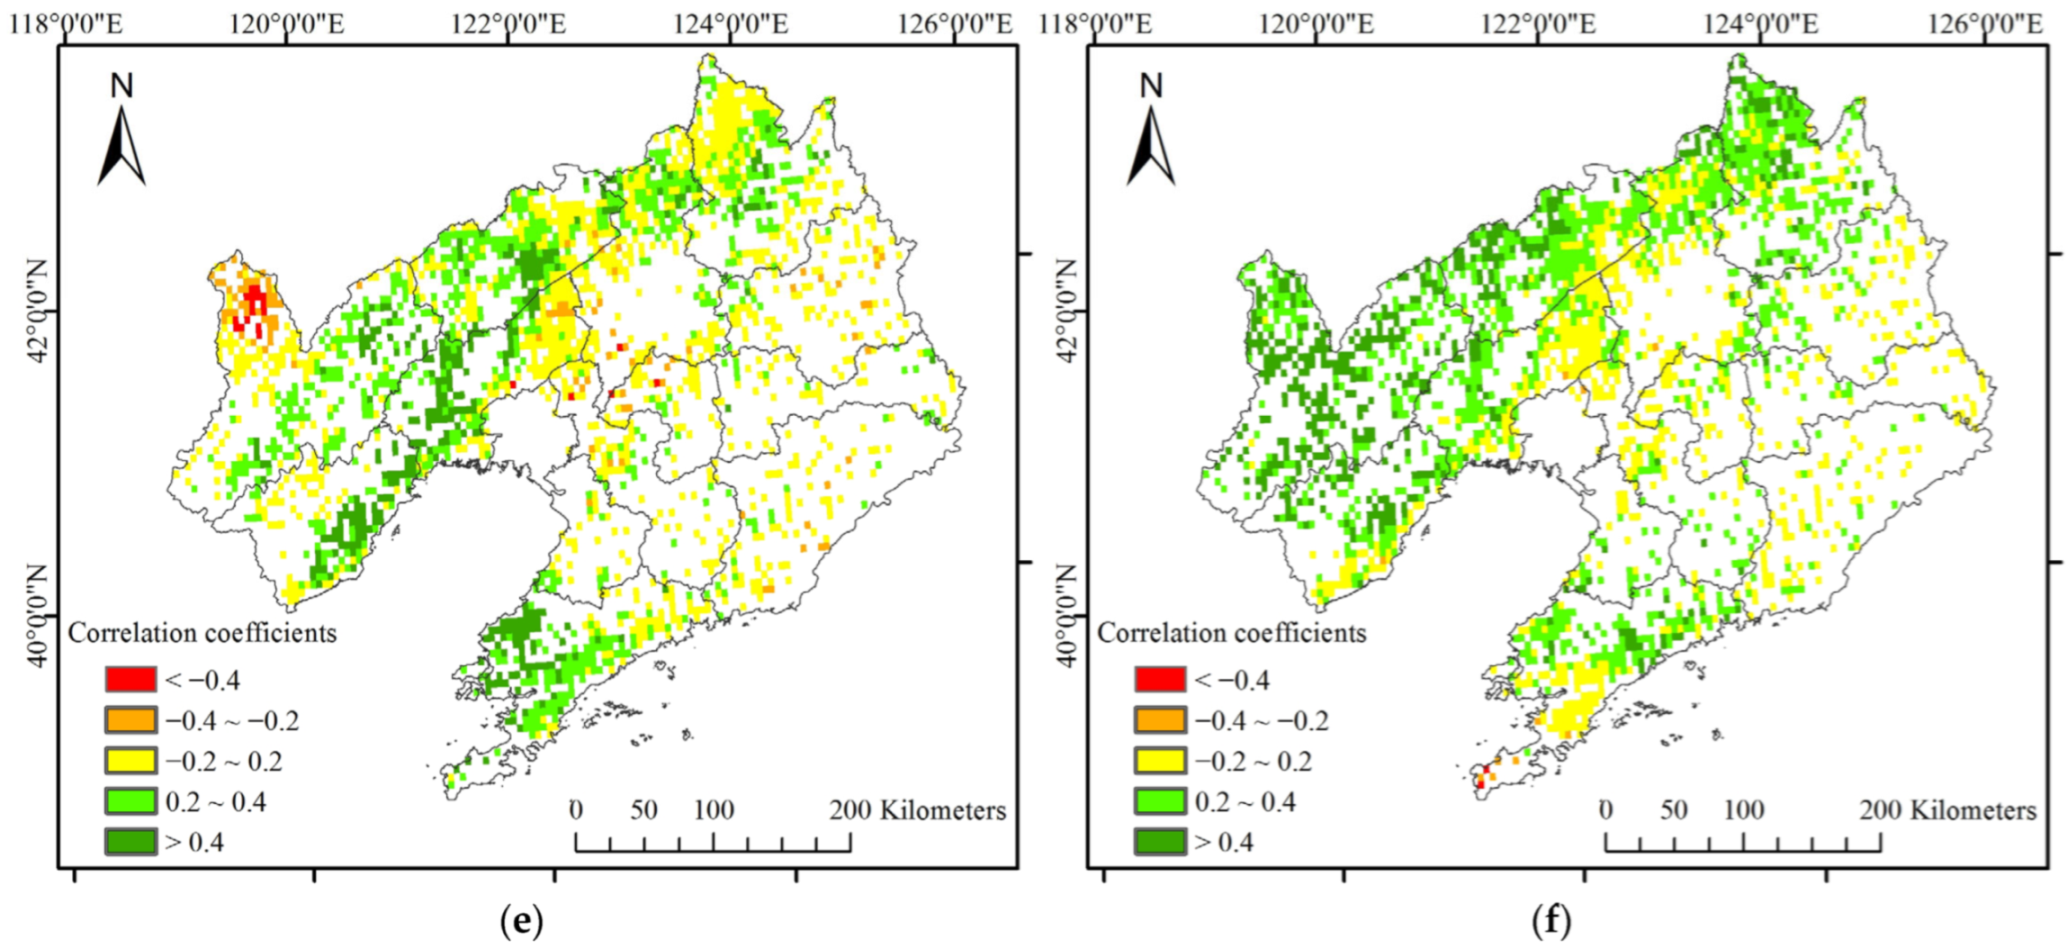
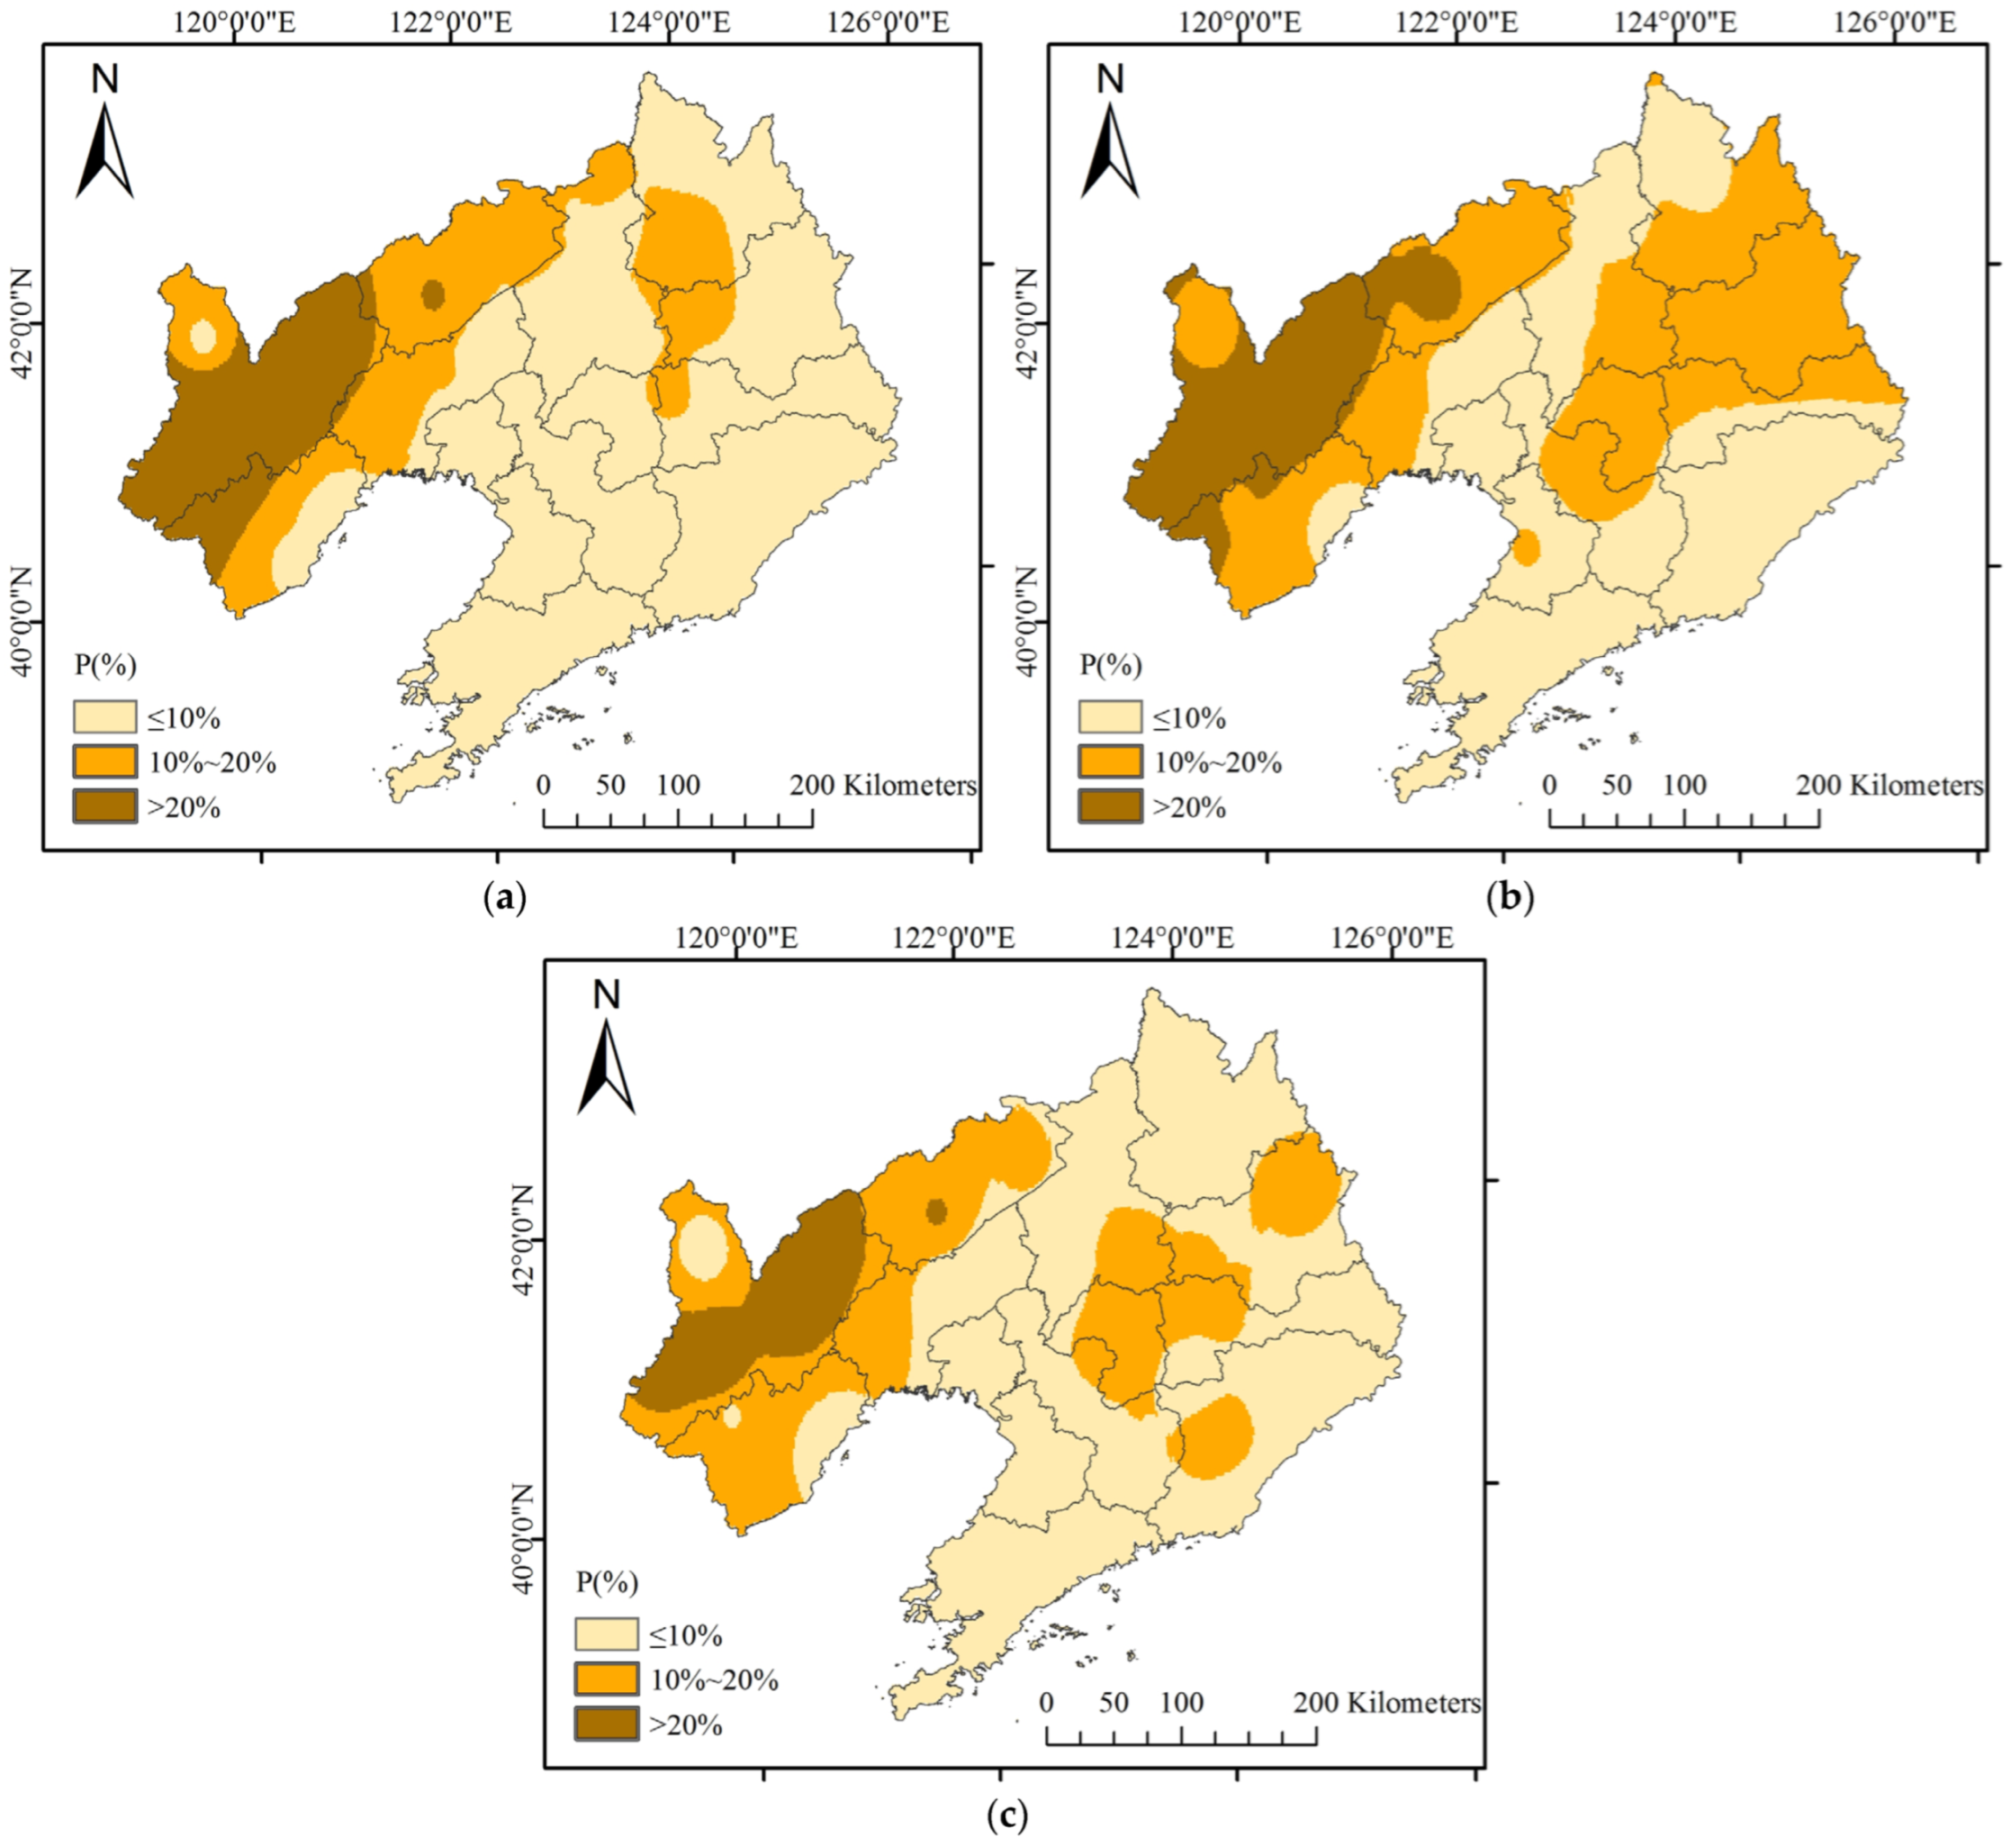
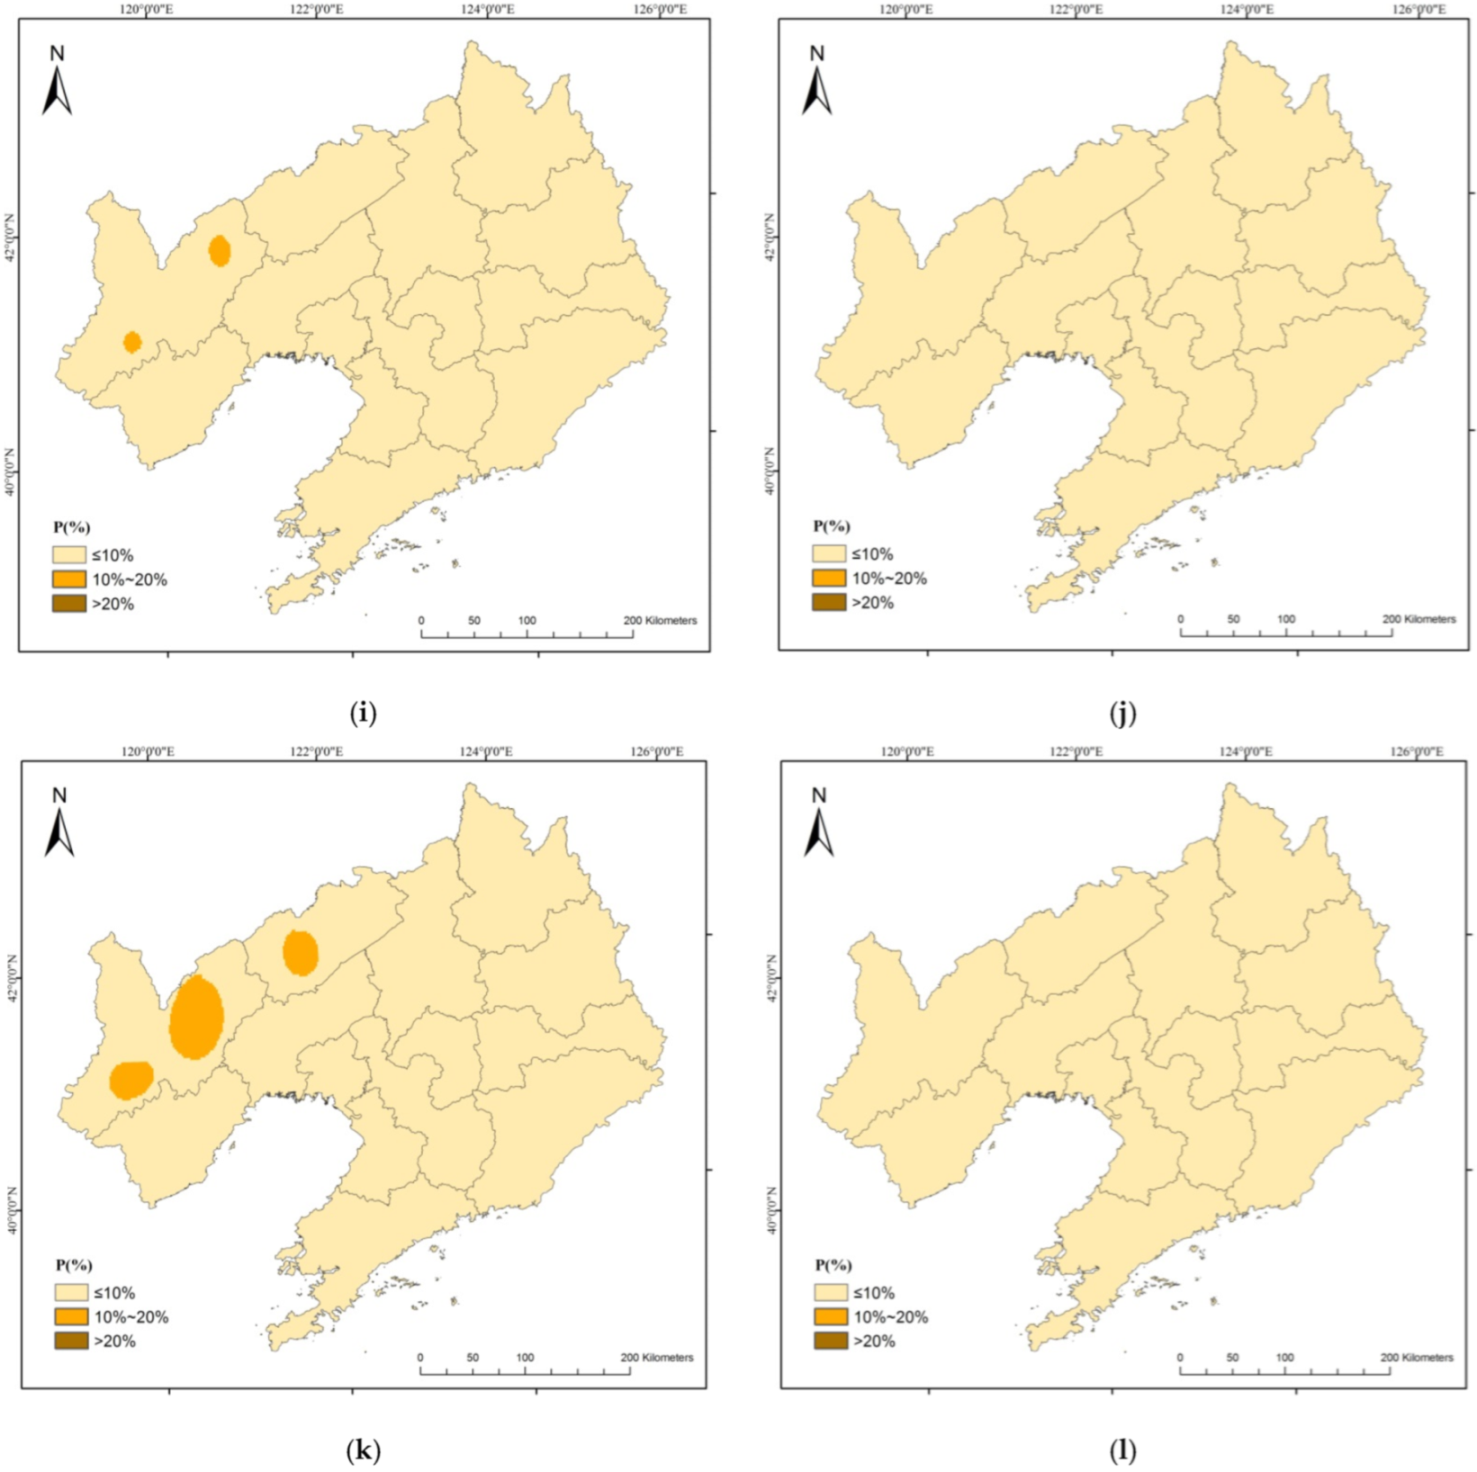
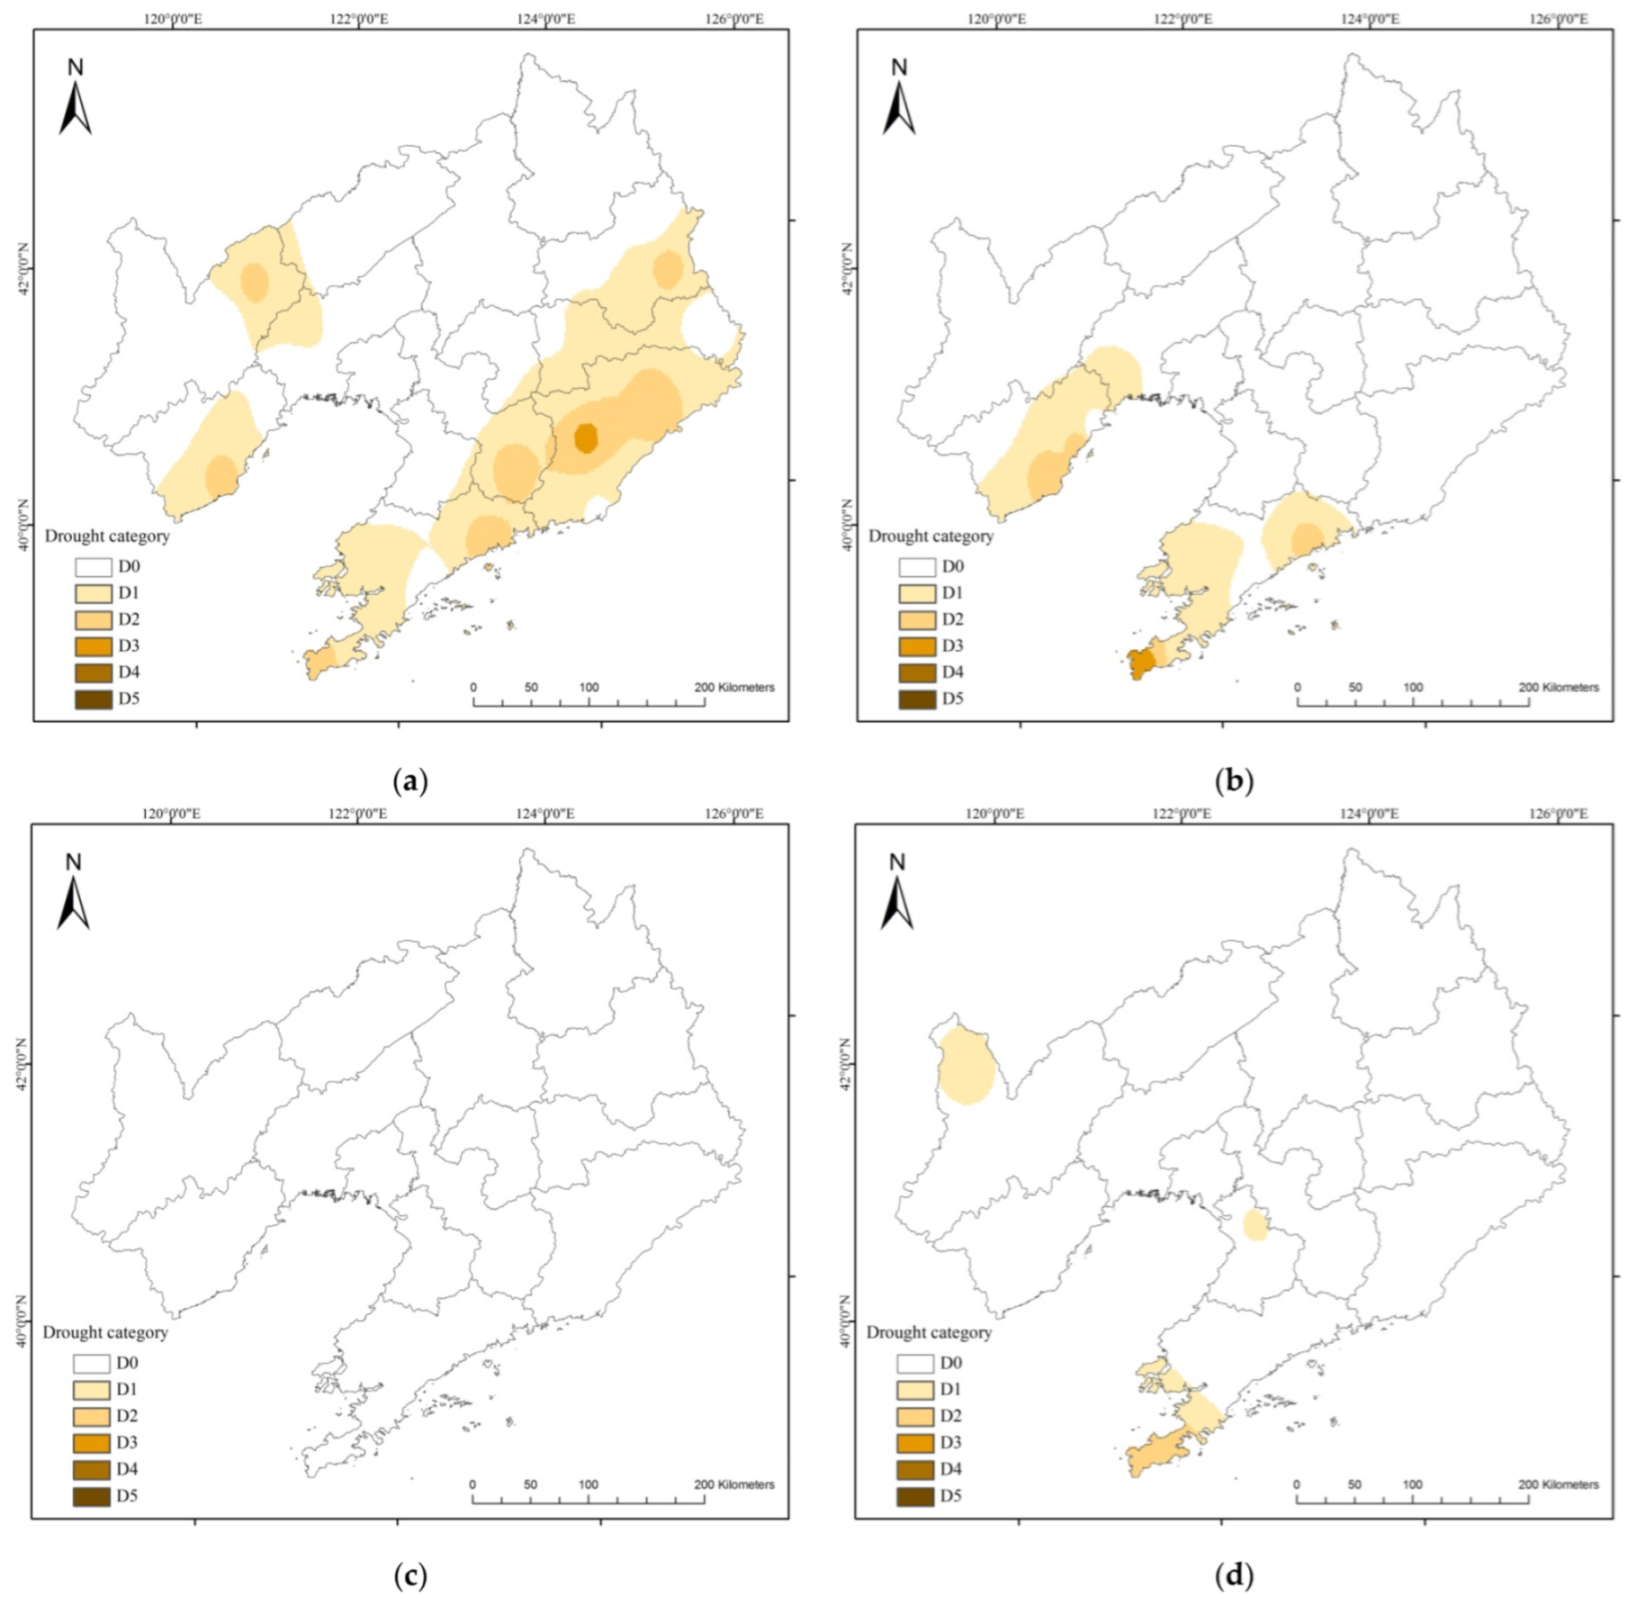
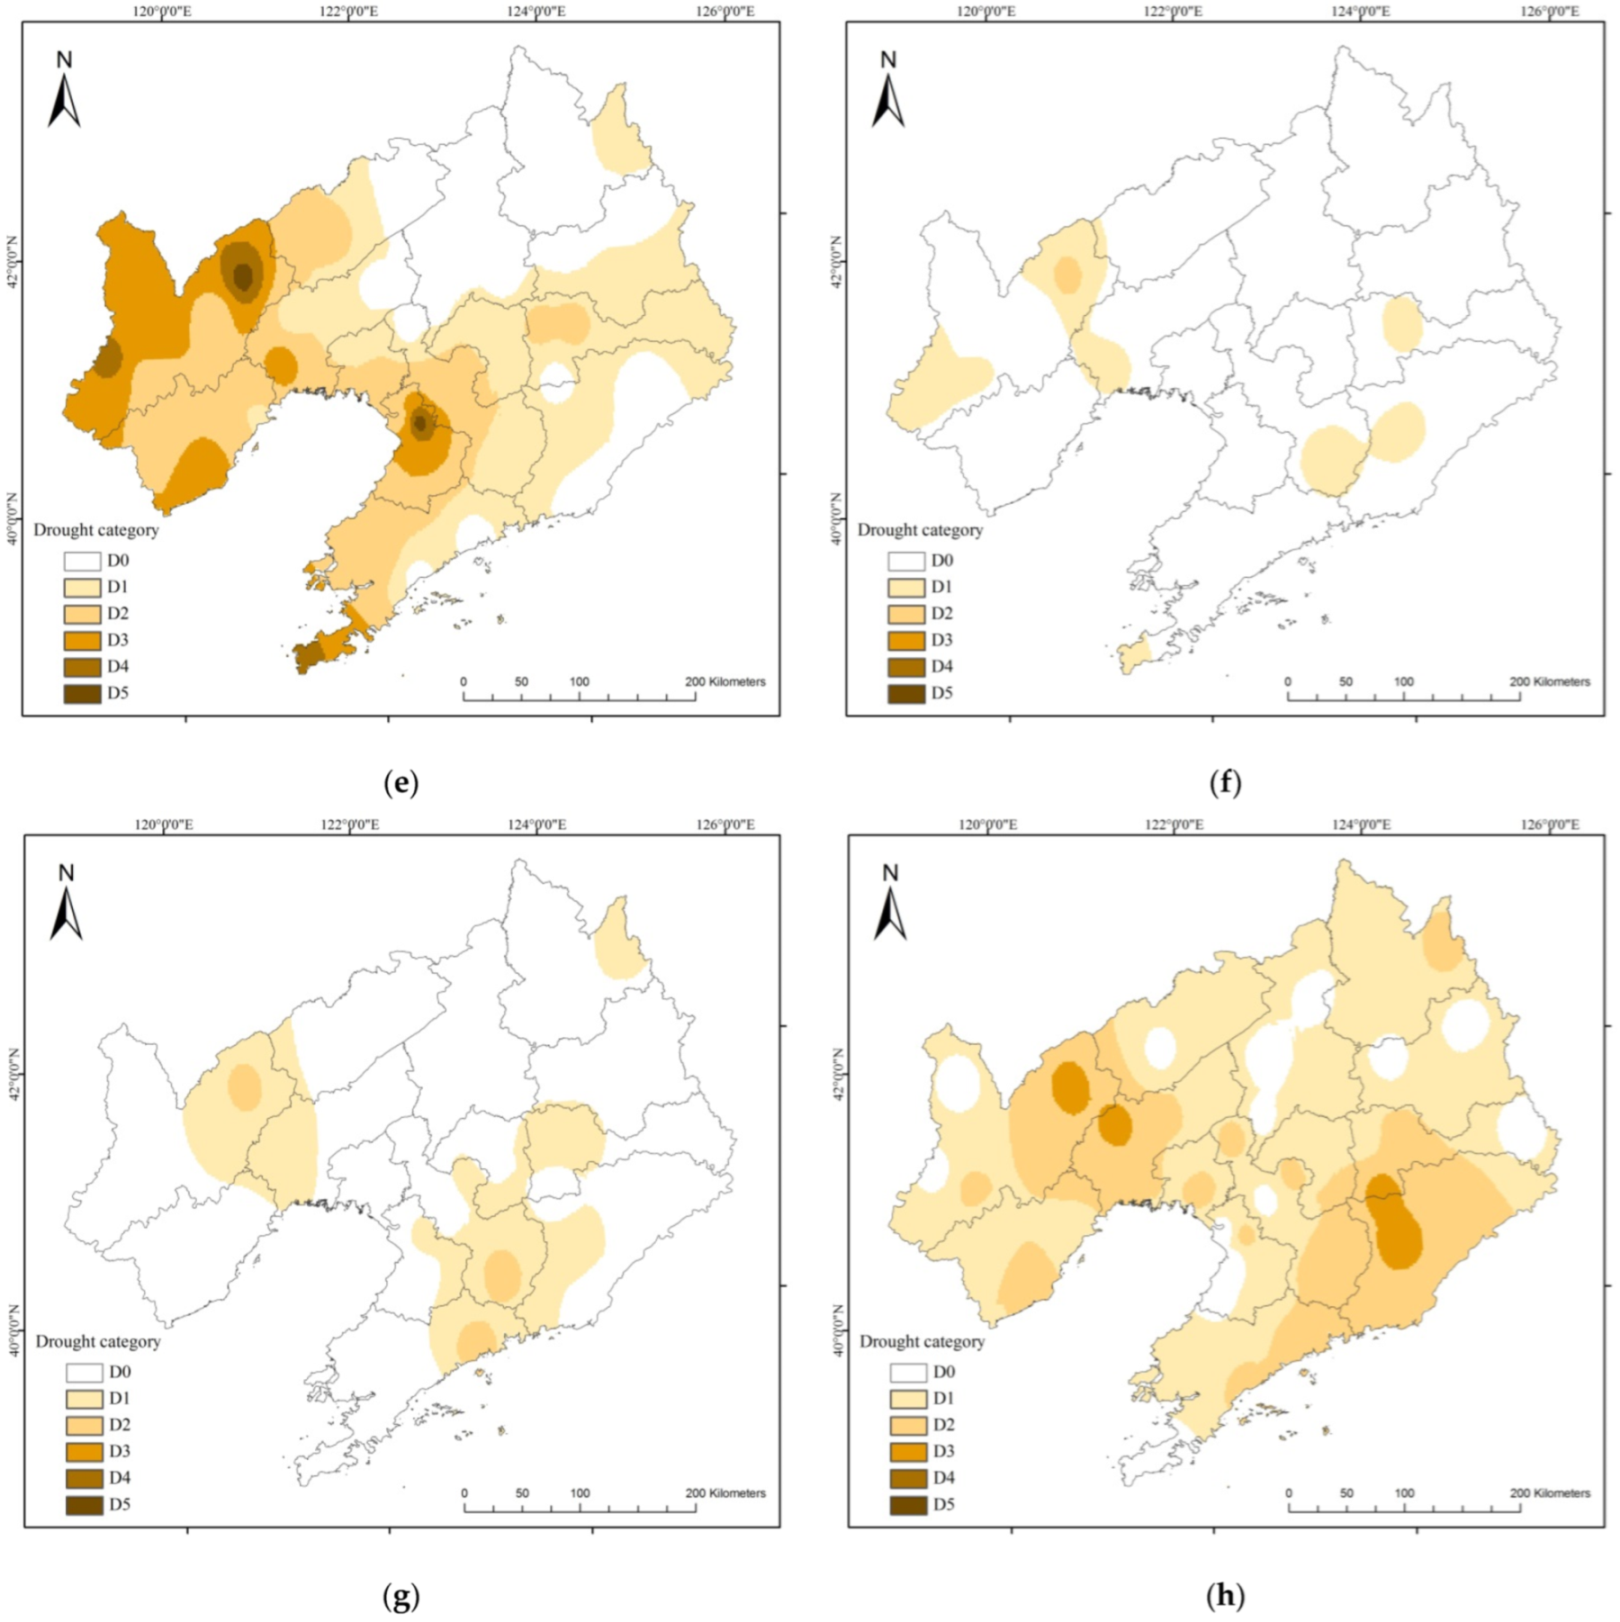
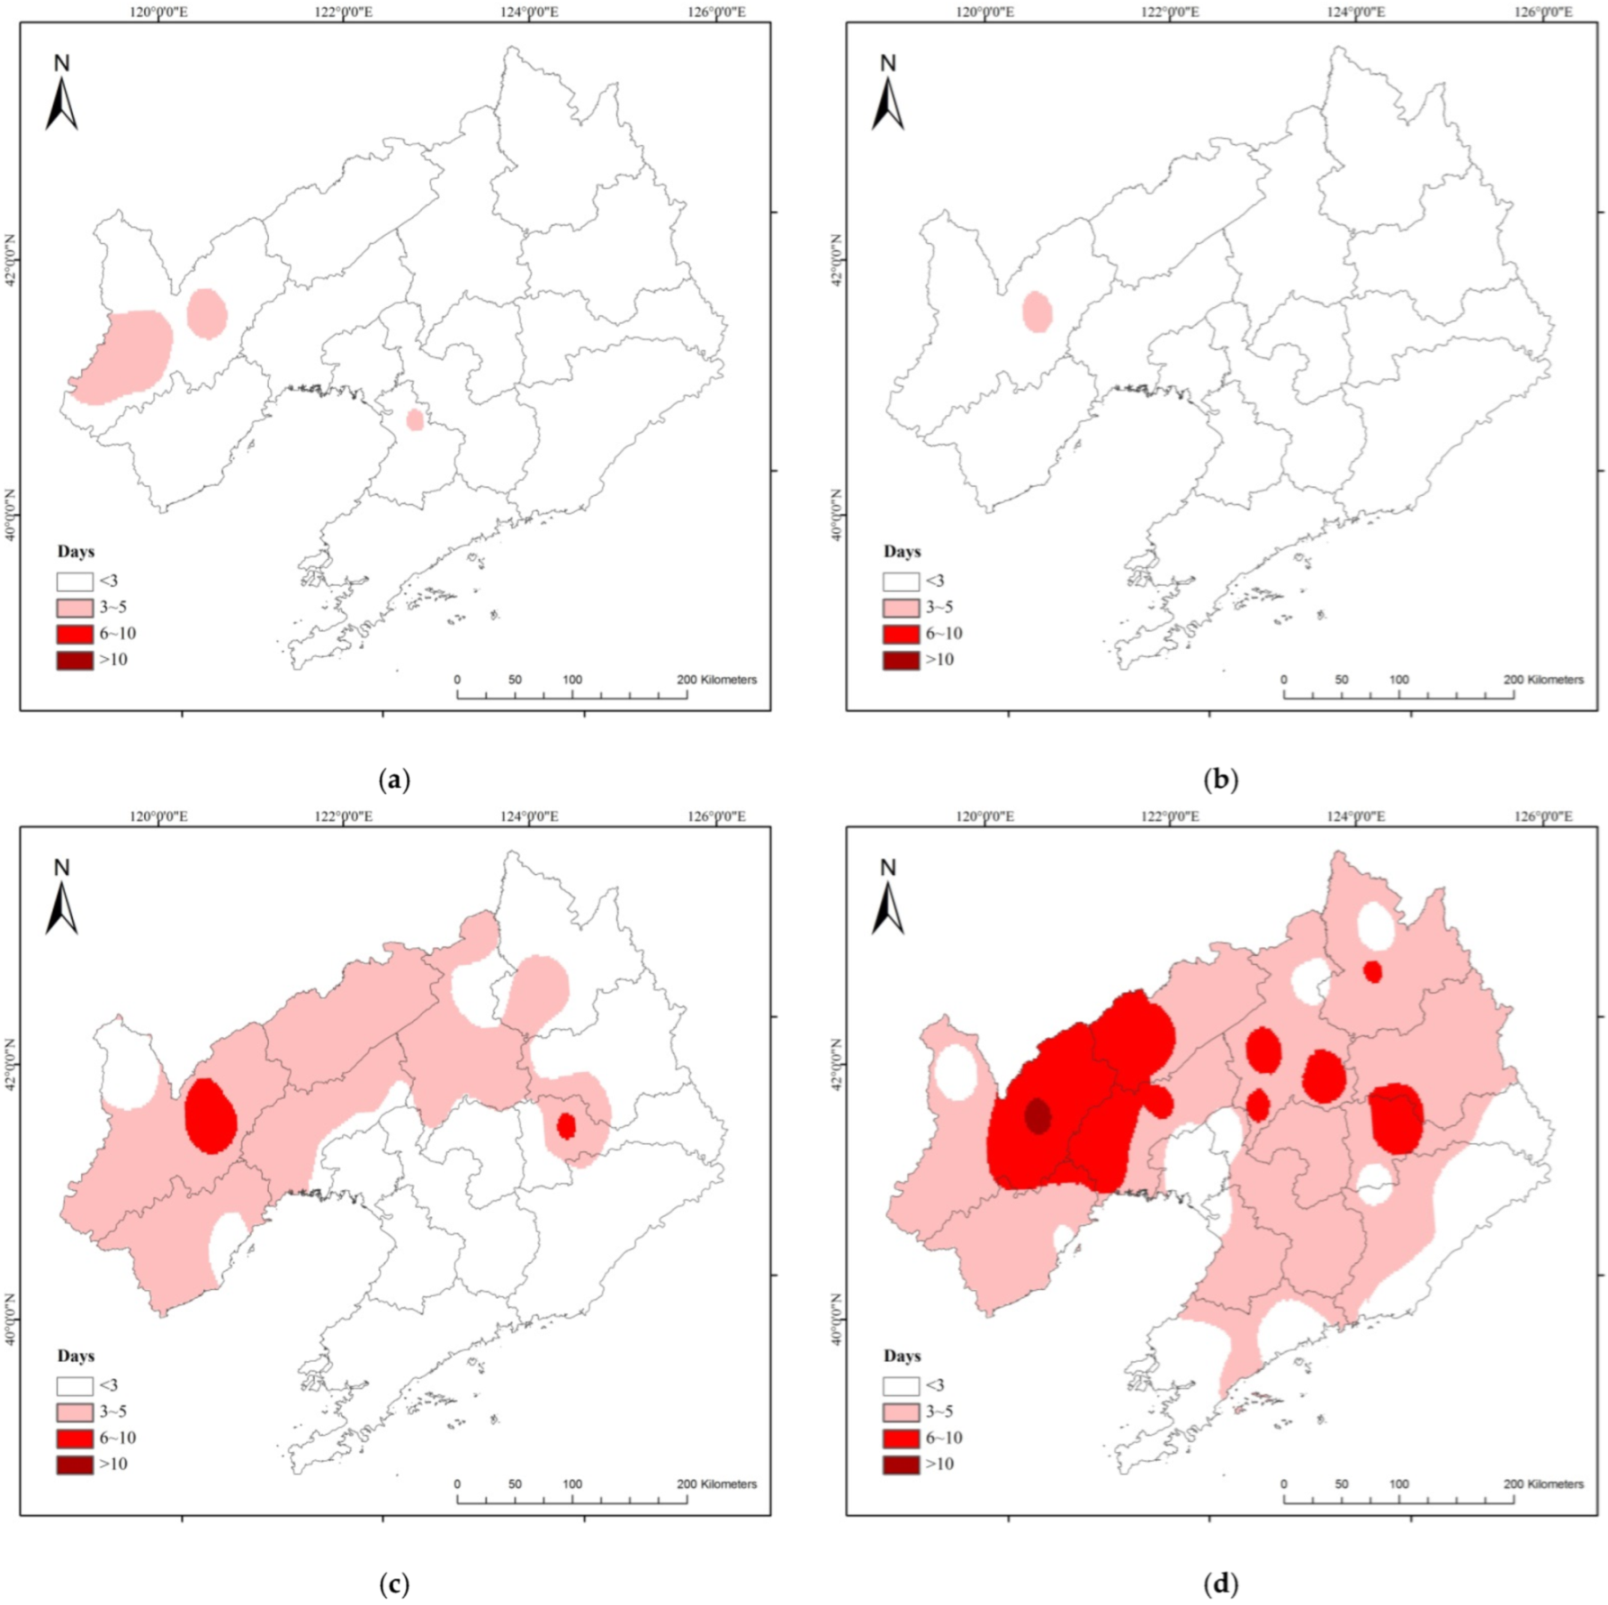
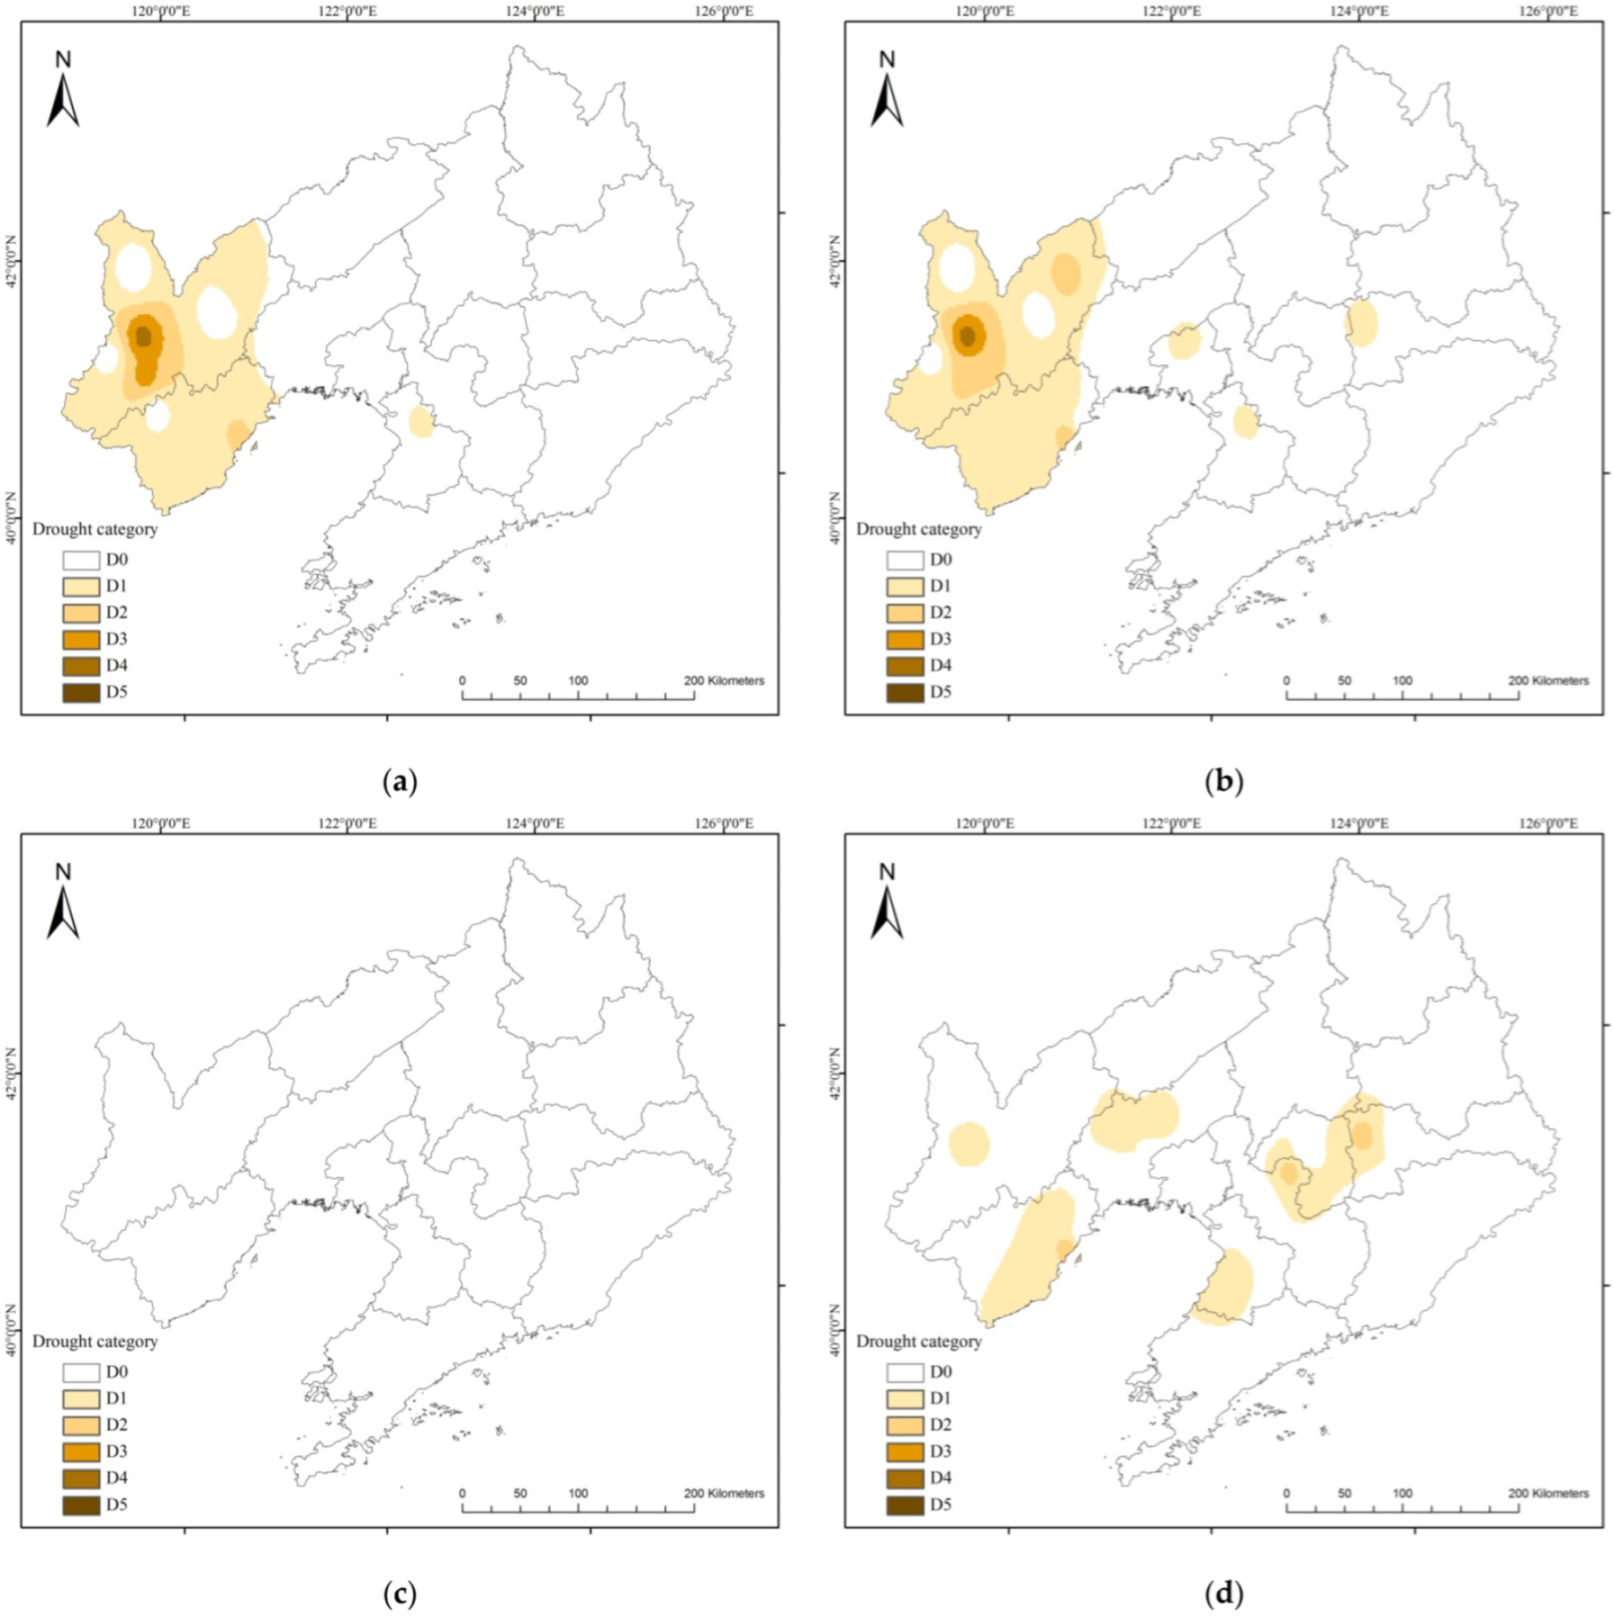
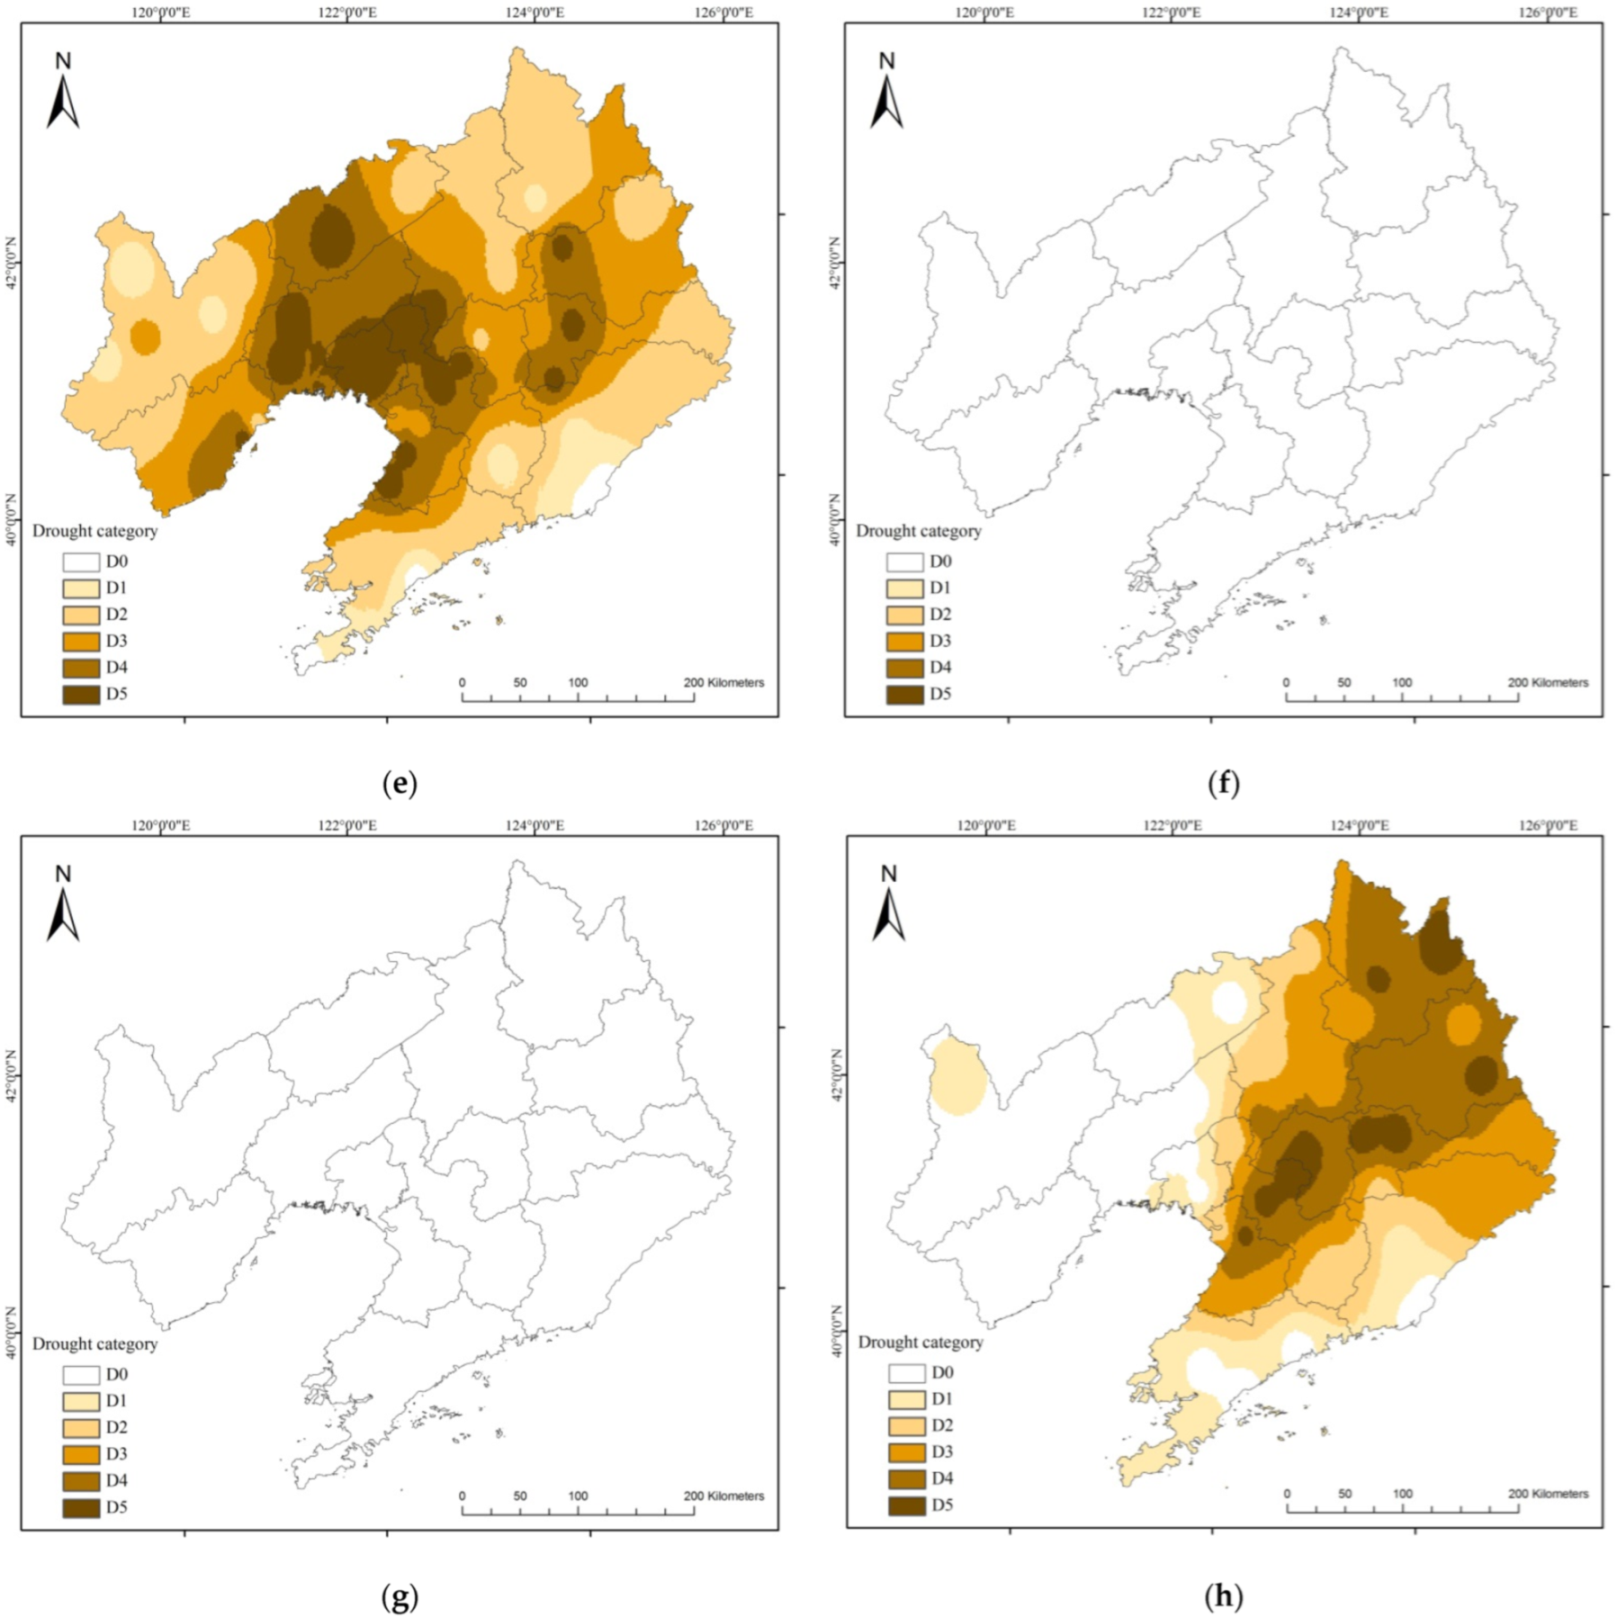
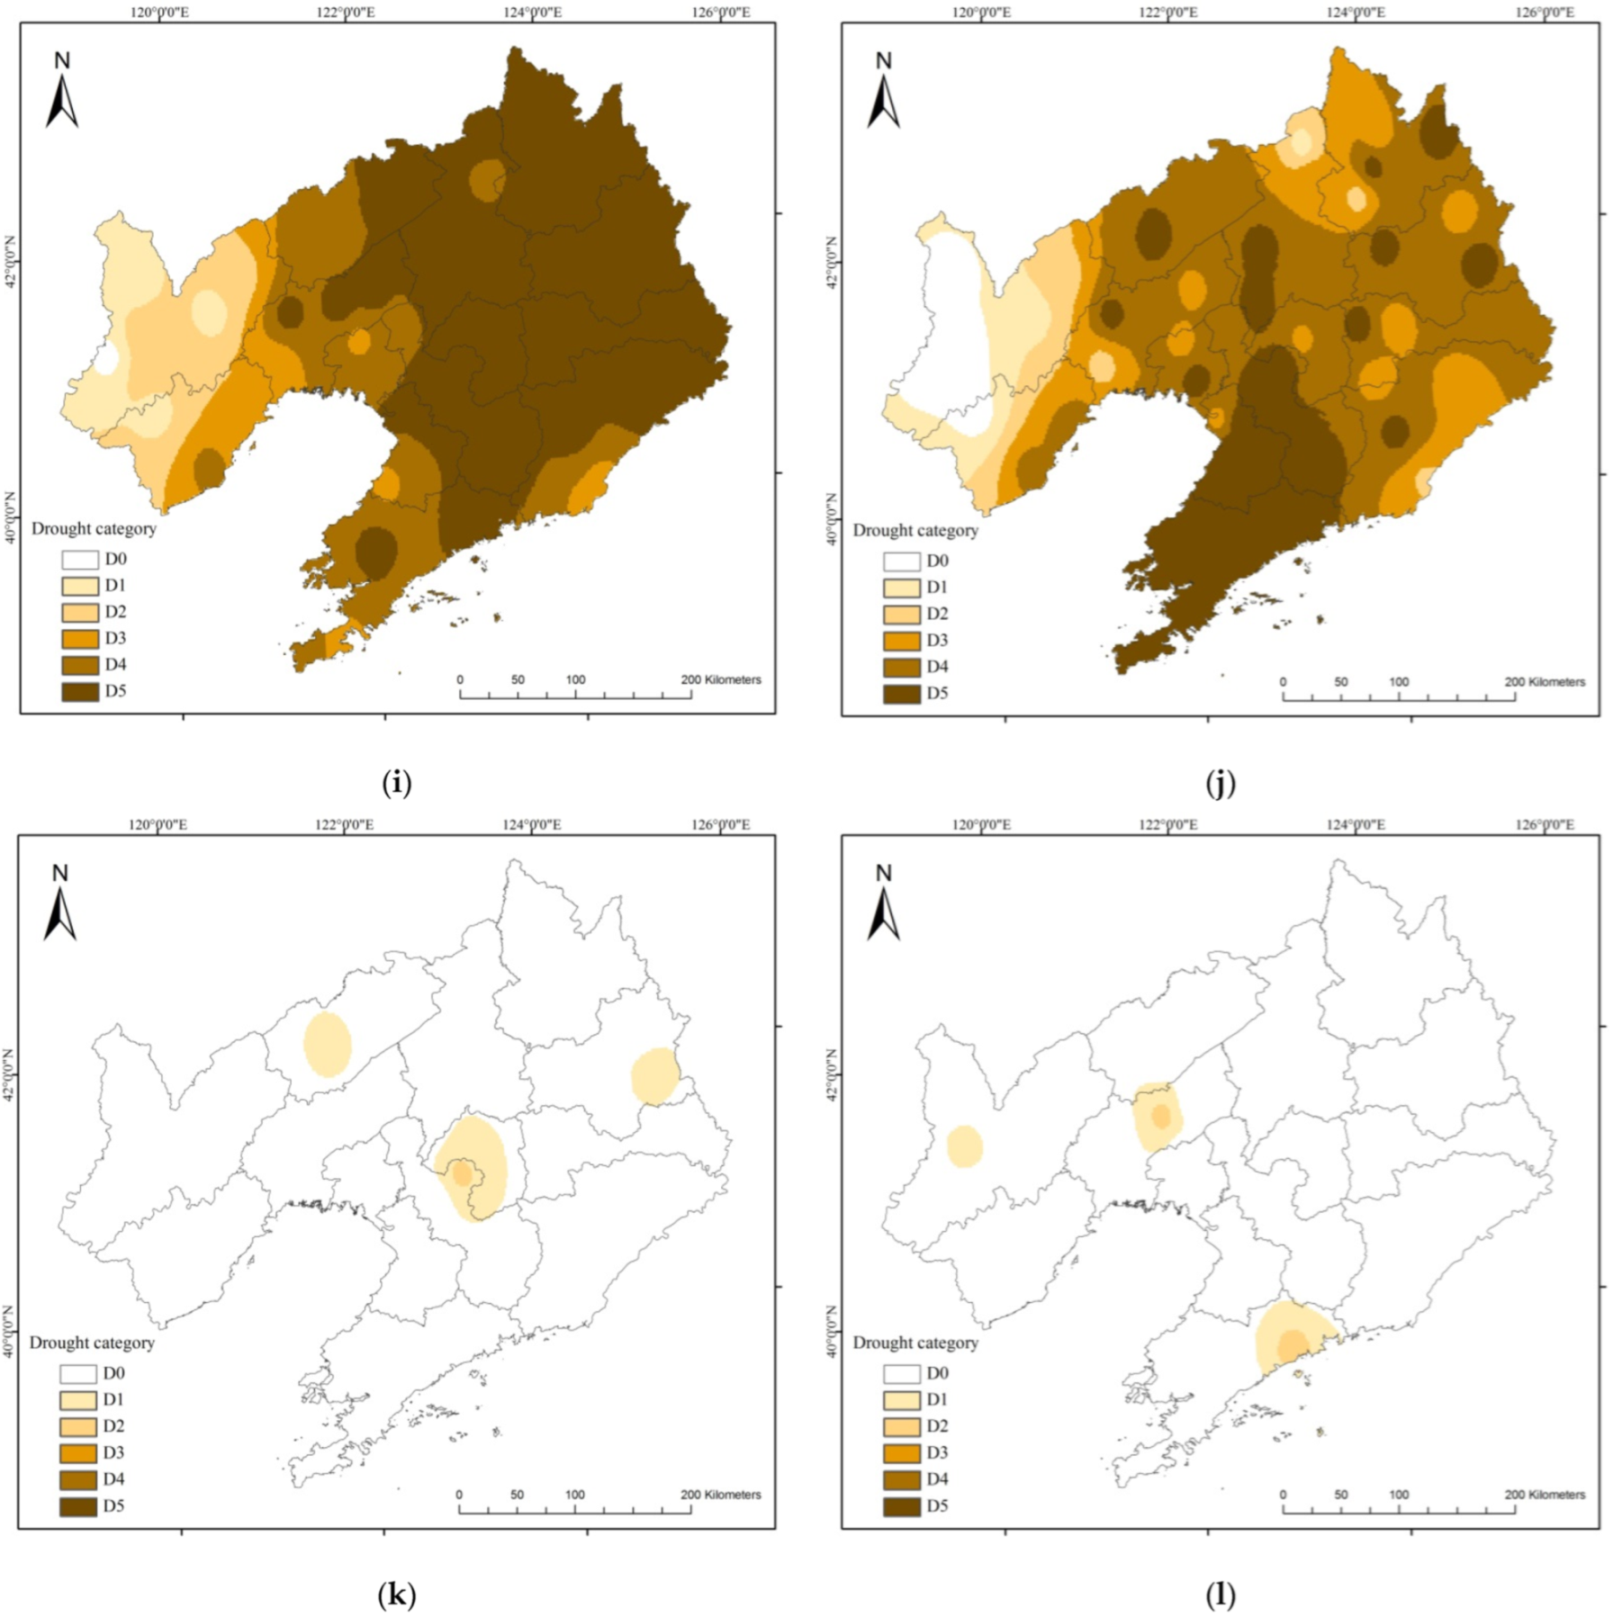
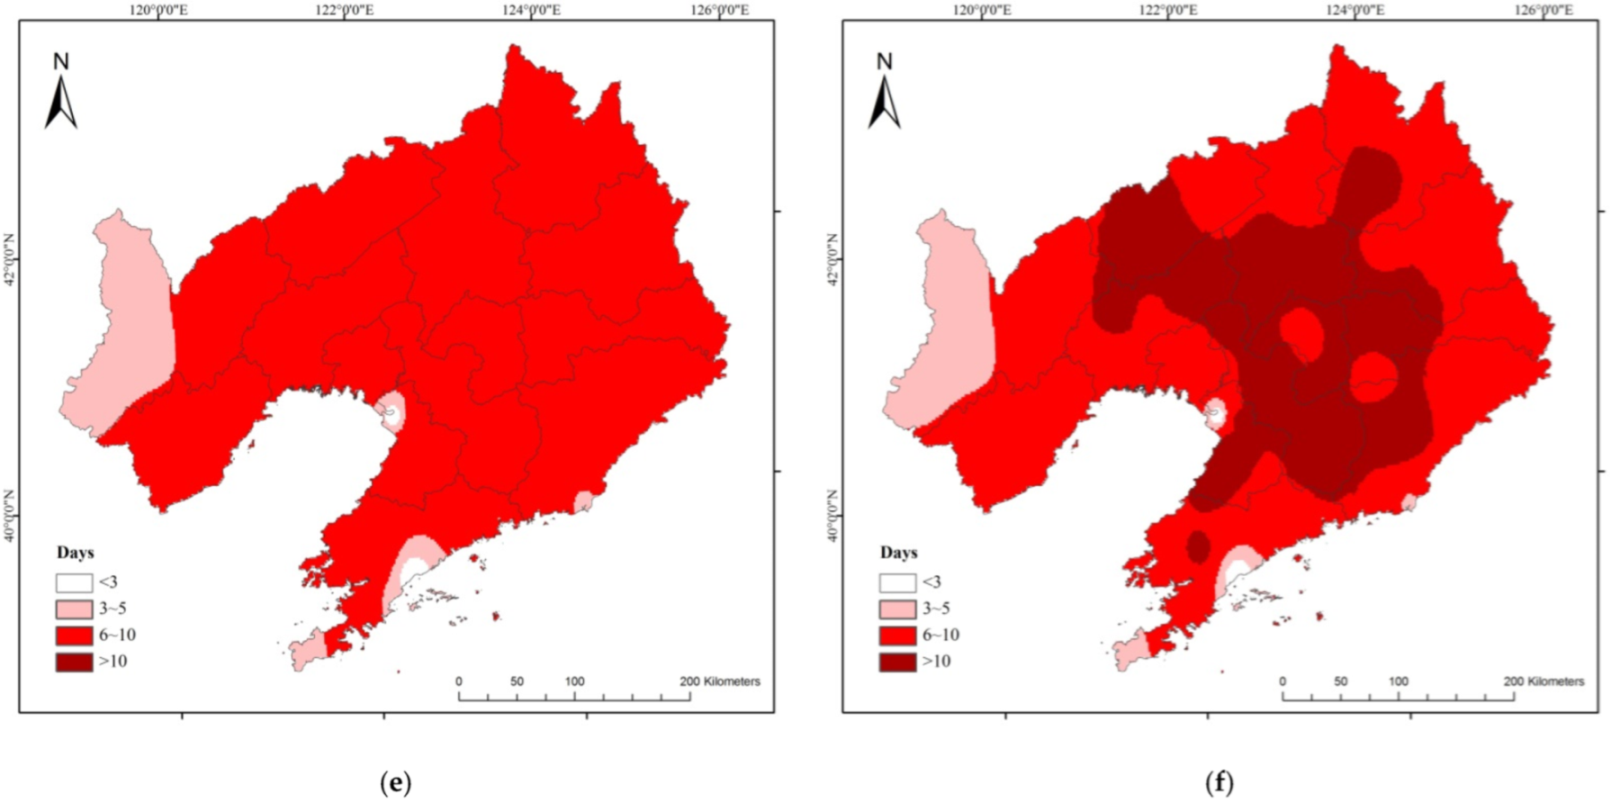
3.1.2. Spatial Distribution Characteristics

In June, during the 60-year period, six sites had a CHD event frequency higher than 20%, 10 sites had a CHD event frequency ranging from 10% to 20%, and the remaining 36 sites had a CHD event frequency lower than or equal to 10% (Figure 4a). For exceptional CHD events, there was one site with a frequency ranging from 10% to 20%. For severe CHD events, there were two sites with a frequency ranging from 10% to 20%. For moderate CHD events, there were four sites with a frequency ranging from 10% to 20%. The frequency in each category at the other sites was low (≤10%) (Figure A2f–j).
In July, during the 60-year period, six sites had a CHD event frequency higher than 20%, 16 sites had a CHD event frequency ranging from 10% to 20%, and the frequency at the other 30 sites was low (≤10%) (Figure 4b). For exceptional CHD events, there were 13 sites with a frequency ranging from 10% to 20%. For severe CHD events, there was one site with a frequency ranging from 10% to 20%. For moderate CHD events, there were two sites with a frequency ranging from 10% to 20%. The frequency of events in each category at the other sites was less than or equal to 10% (Figure A2f–j).
In August, during the 60-year period, 6 sites had a CHD event frequency higher than 20%, 9 sites had a CHD event frequency ranging from 10% to 20%, and the remaining 37 sites had a CHD event frequency lower than or equal to 10% (Figure 4c). For exceptional CHD events, there were 3 sites with the frequency ranging from 10% and 20%, and the frequency of other sites in each category was low (≤10%) (Figure A2k–o).
The sites with a CHD event frequency higher than 20% were distributed in western Liaoning, and the sites with a CHD event frequency ranging from 10% to 20% were mainly distributed in western, central, and eastern Liaoning. The frequency of CHD events in other regions was low. The month with the highest average frequency of CHD events in summer was July, followed by June. The month with the highest intensity of CHD events in summer was July, followed by August. The CHD events were more frequent in June and July, and the higher-intensity CHD events were more frequent in July and August.

3.2. Effects of Summer CHD Events on Maize Photosynthesis and Yield

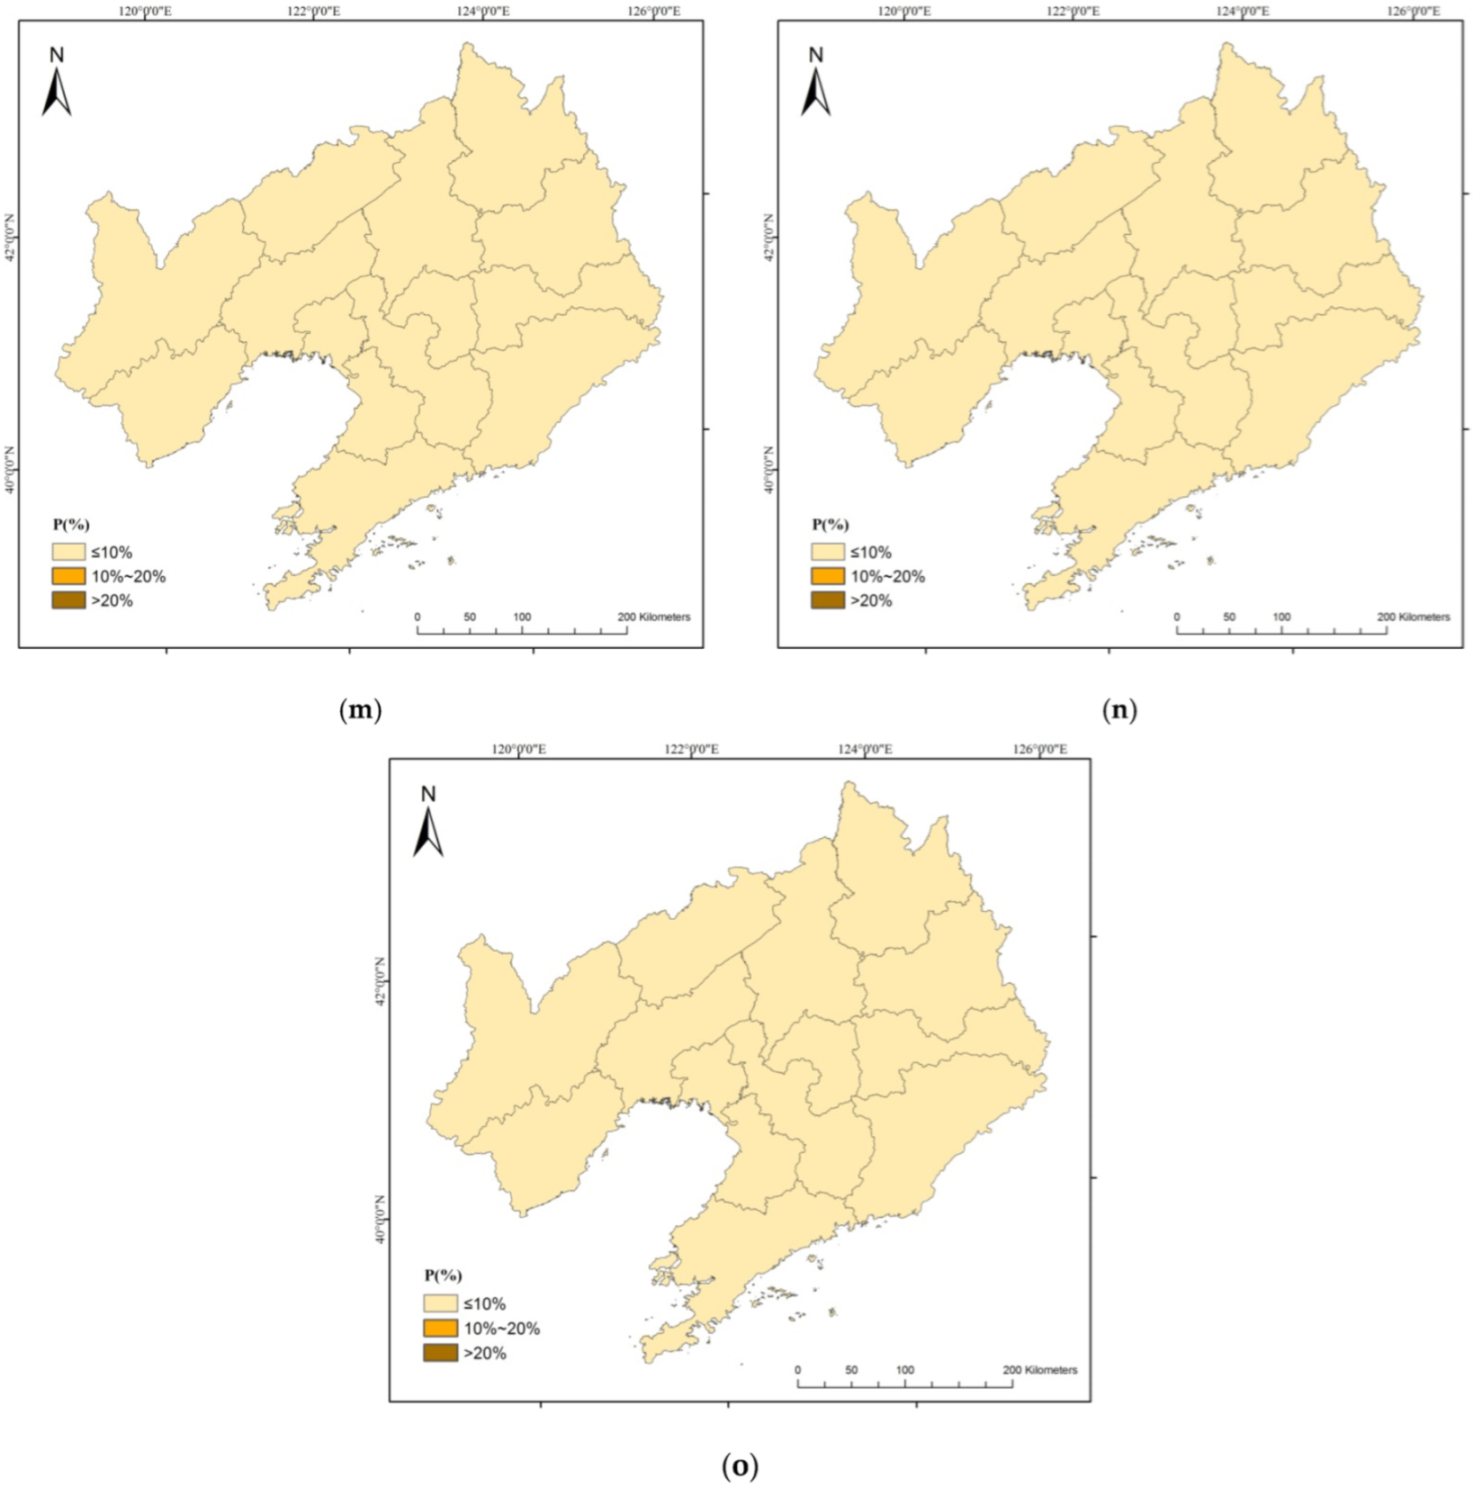
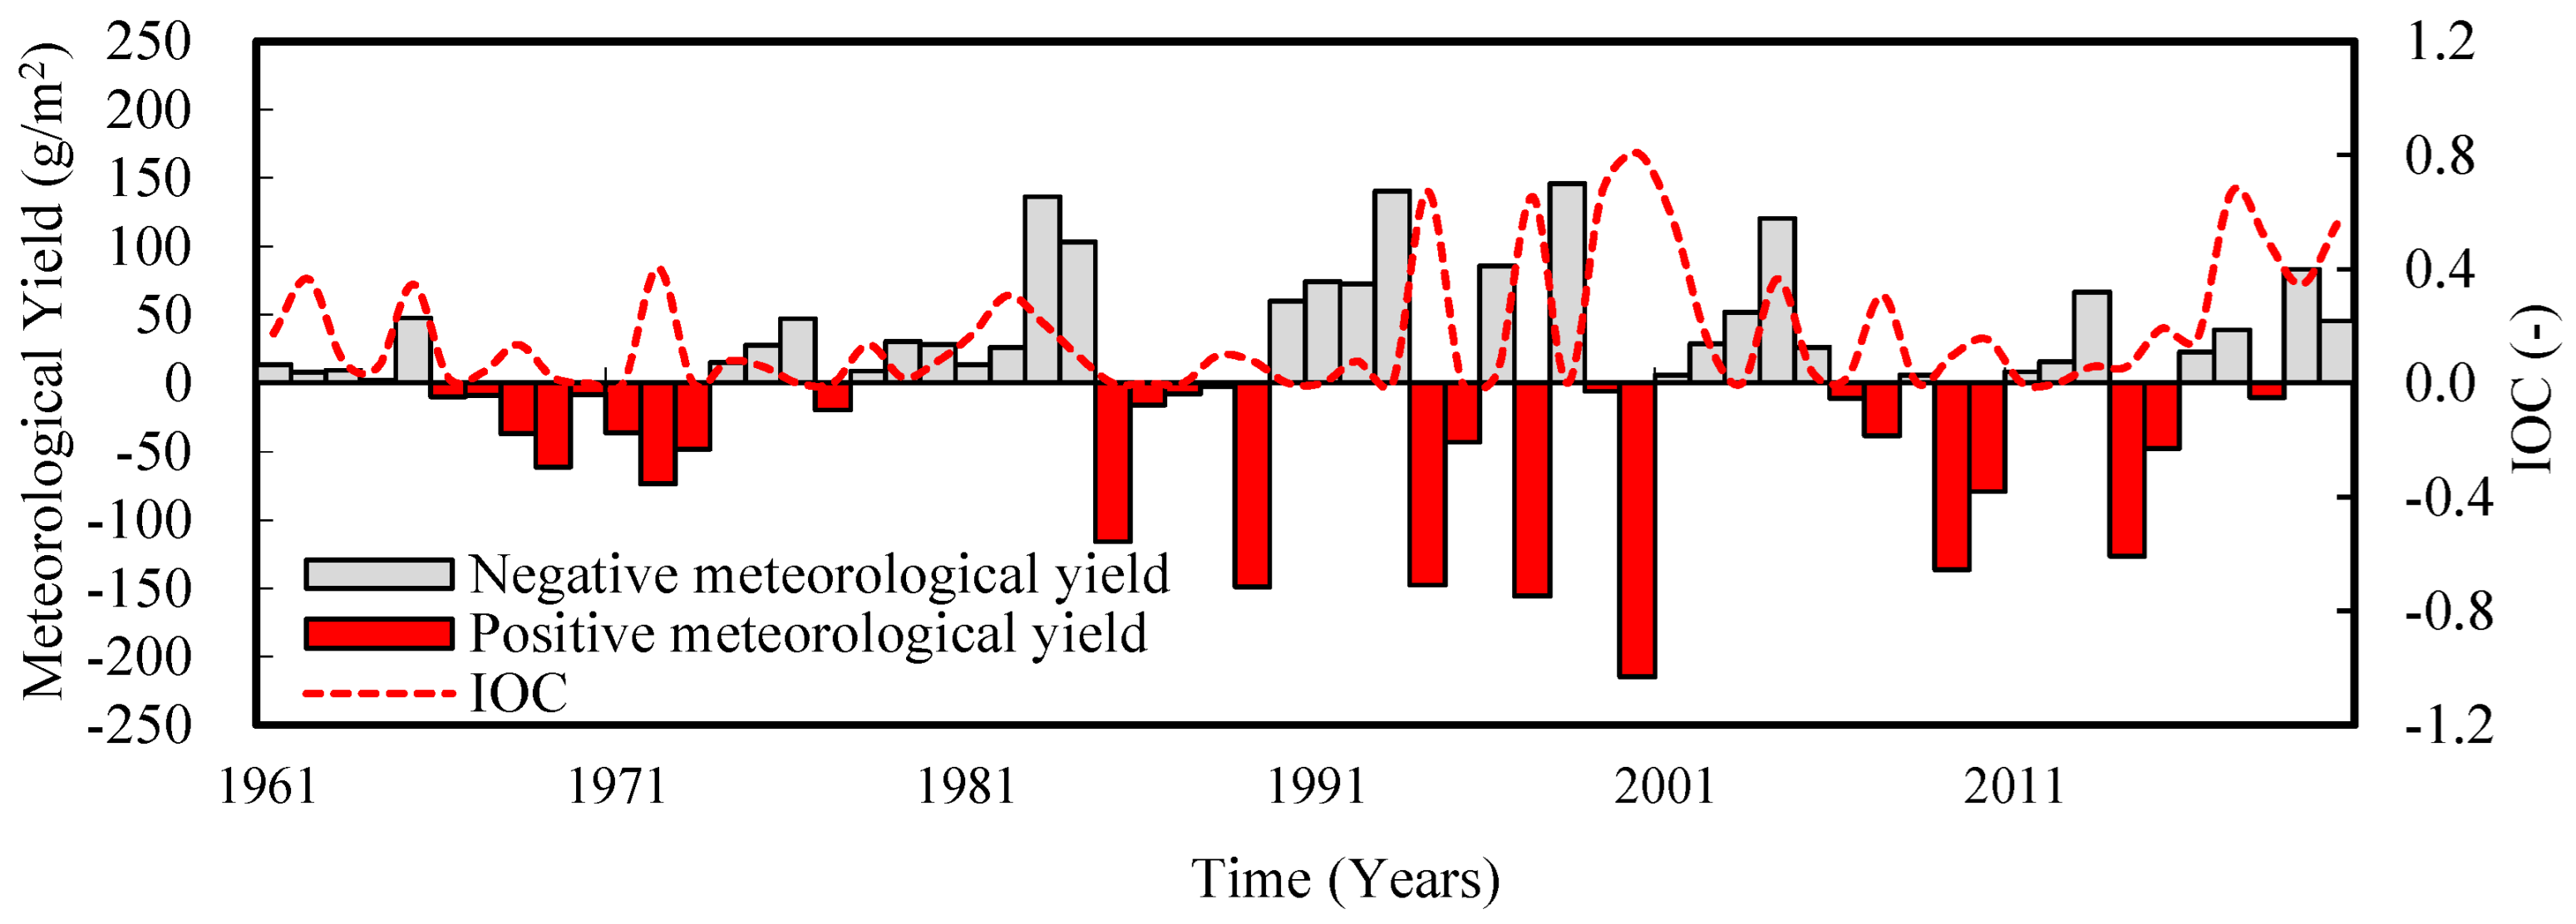
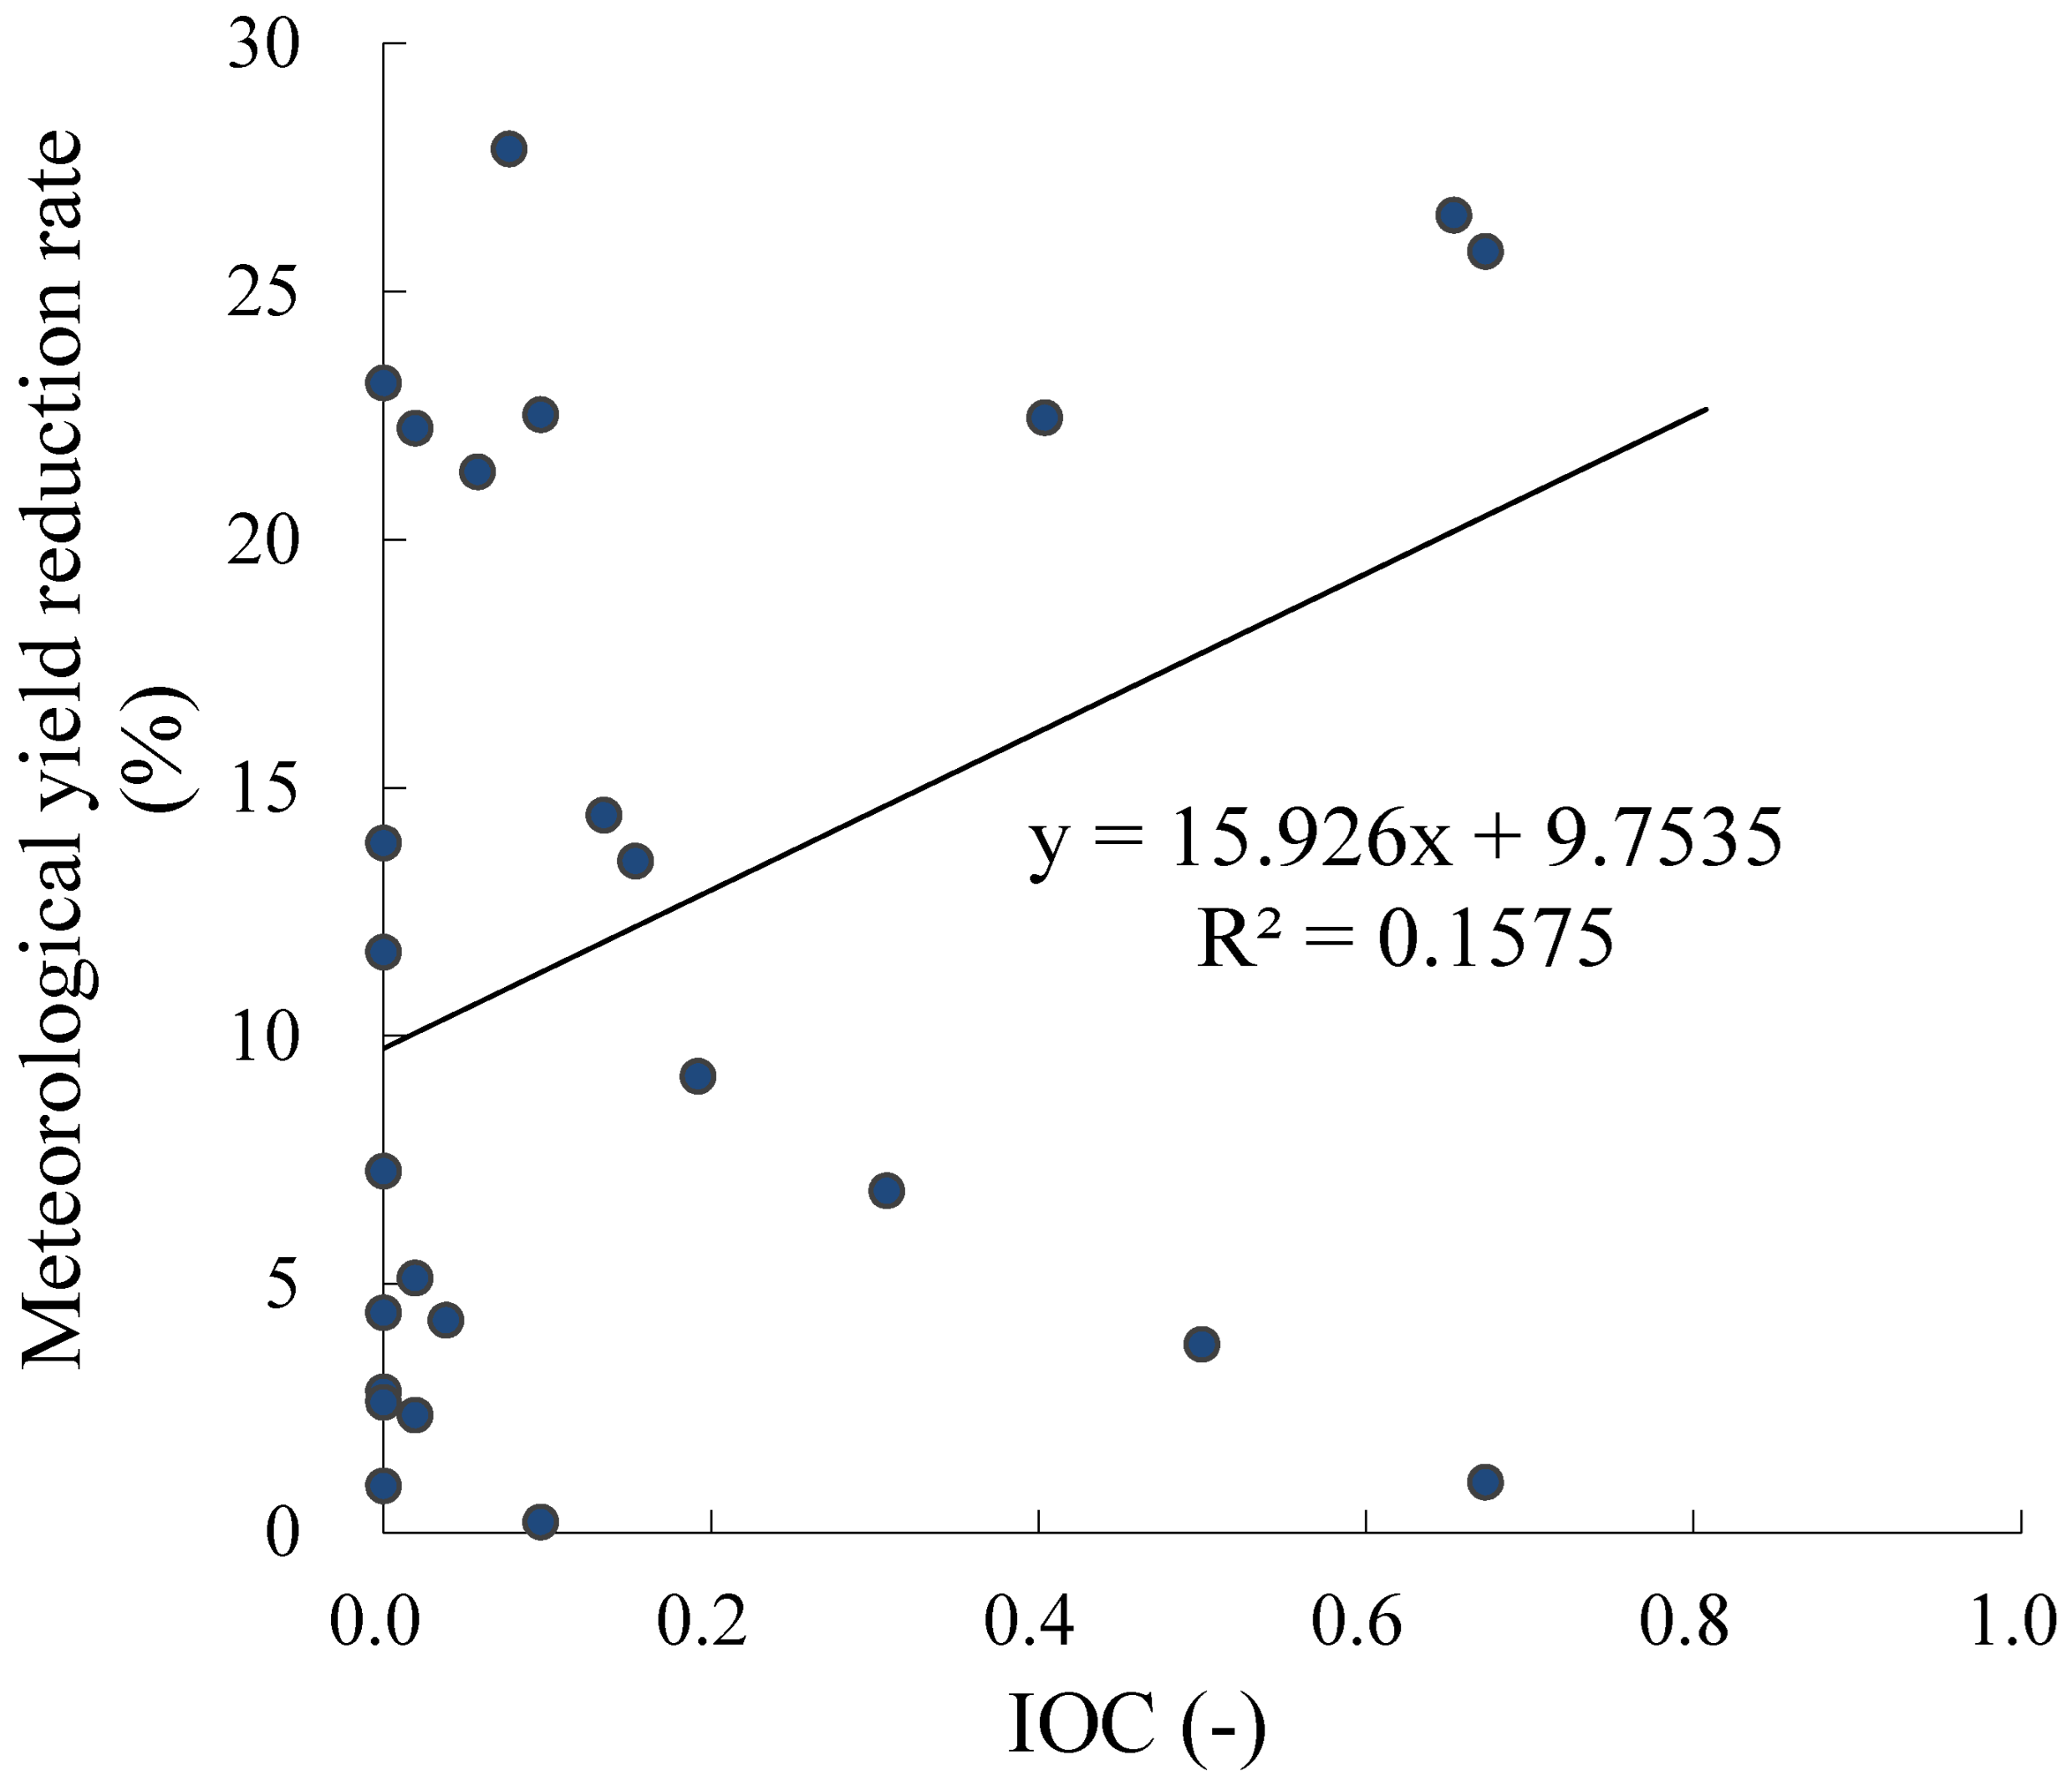
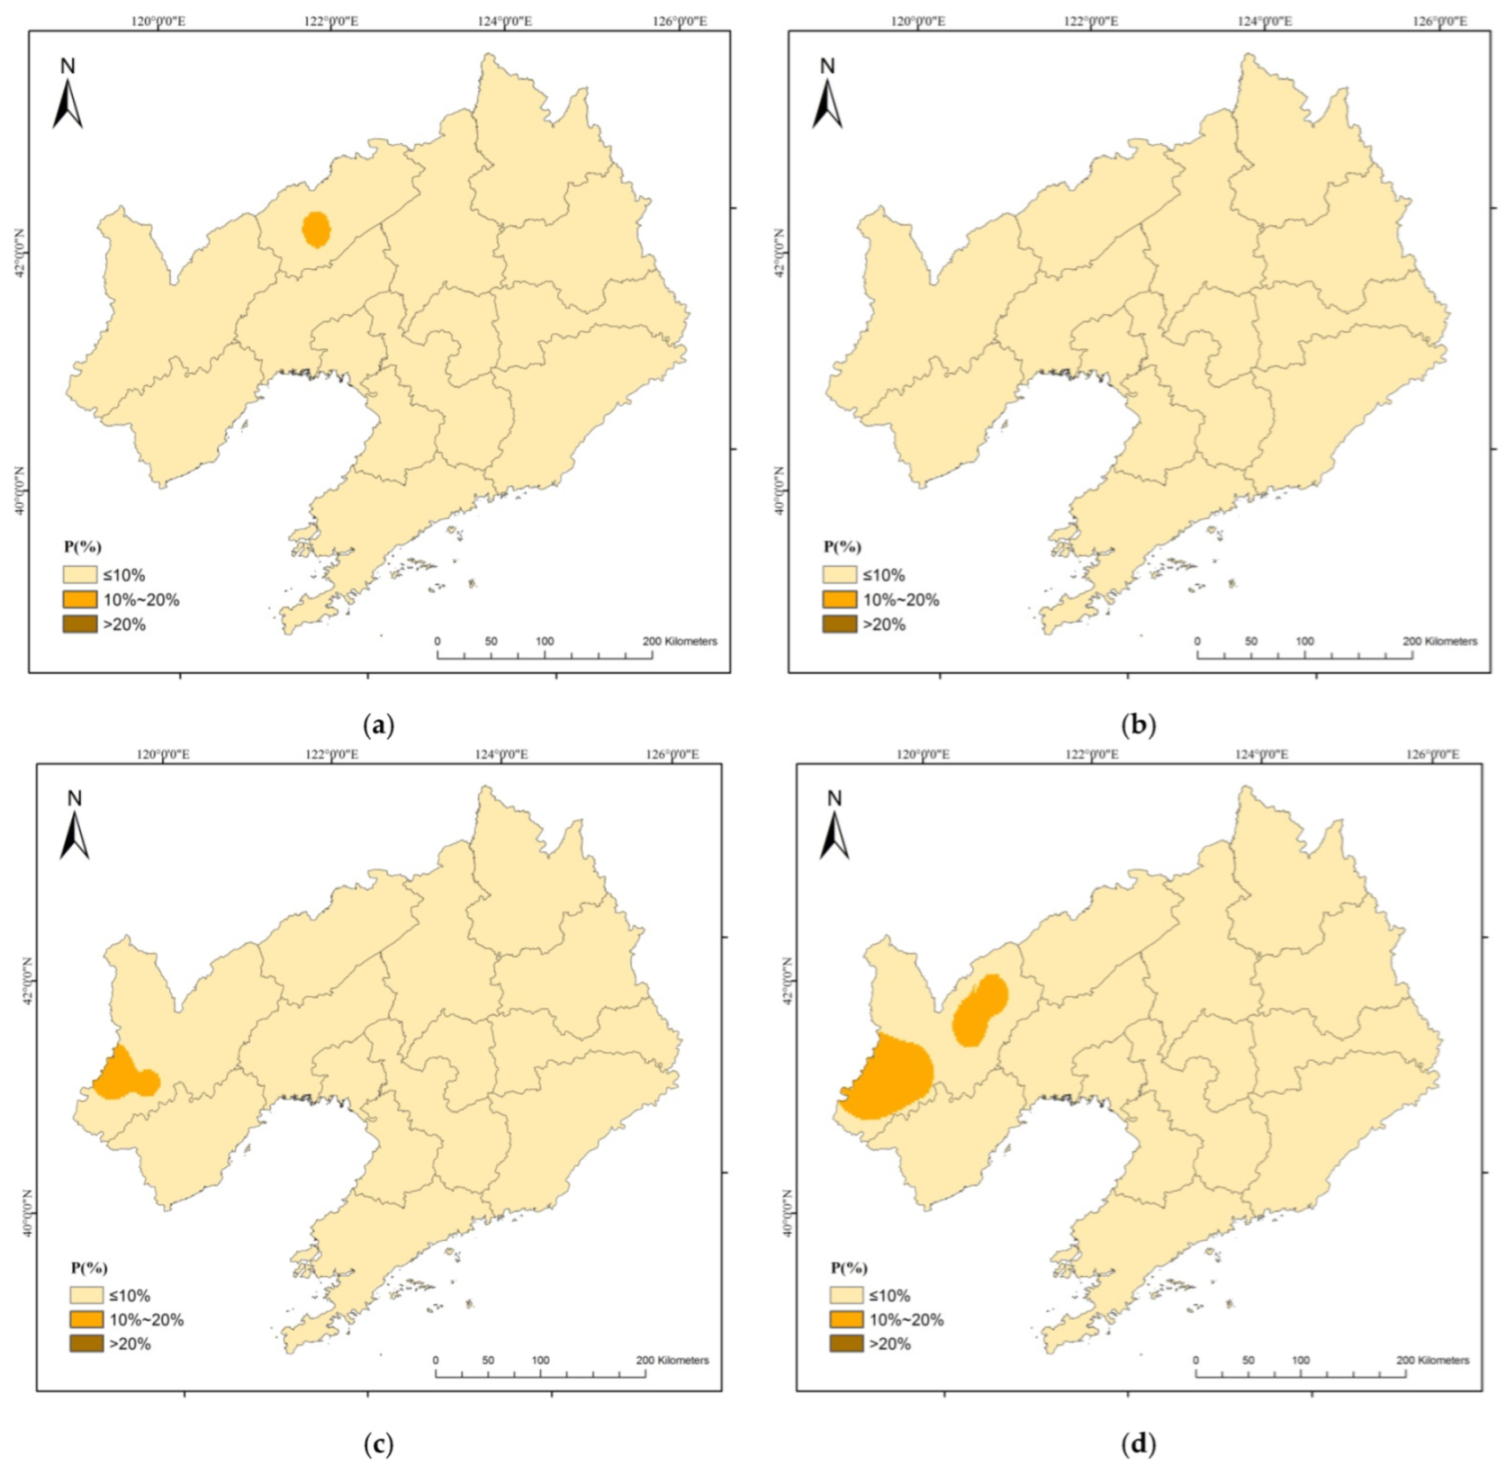
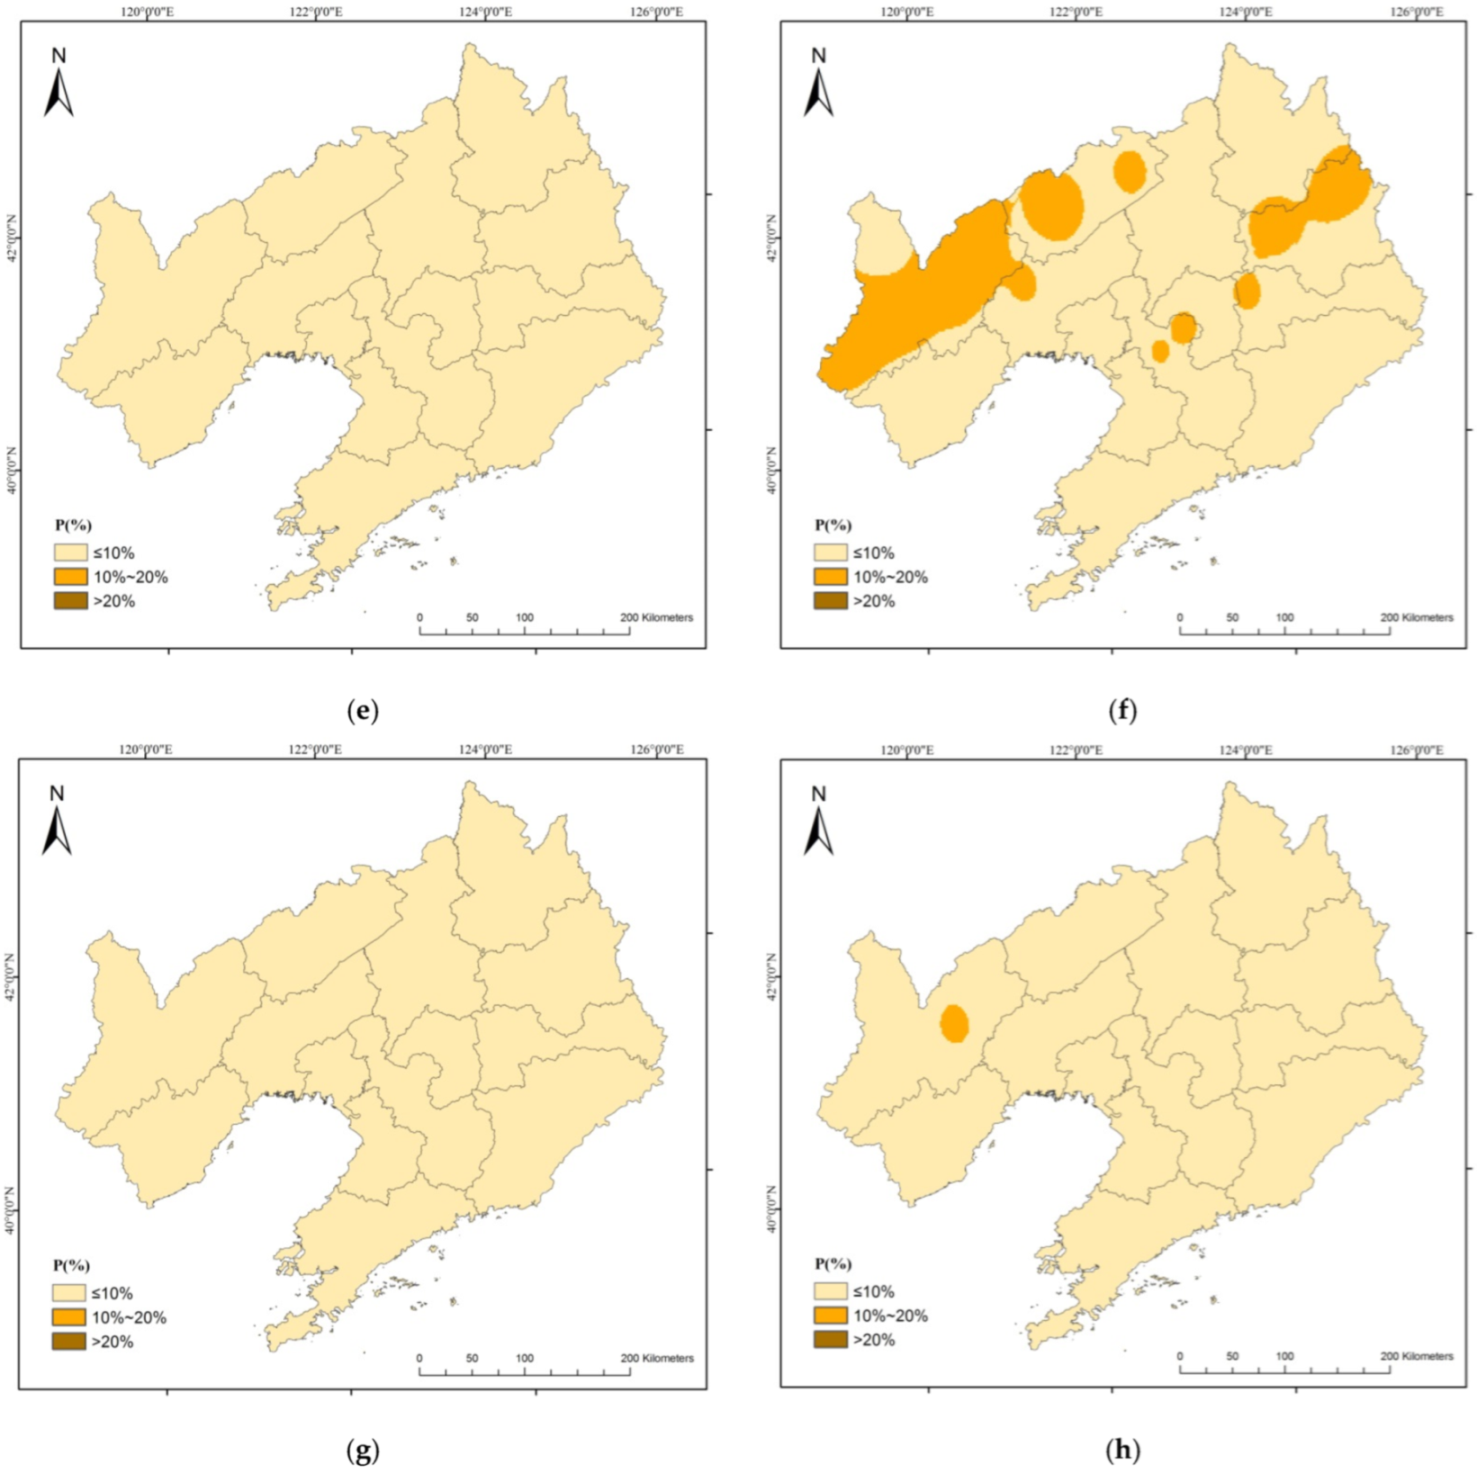
3.2.1. Effects of CHD Events on Maize Yield

The Formula (2) was used to calculate the average annual meteorological yield of maize in Liaoning Province. There were 26 years of reduced meteorological yield in the 60-year period from 1961 to 2020 (Figure 5). There were CHD events in 18 (69%) of the 26 years of reduced meteorological yield, and no CHD events occurred in 8 out of those 26 years. A total of 43 years had CHD events in summer, and the CHD events reduced meteorological yield in 18 of those years (41%). These results indicate that CHD events occurred in most of the years when there was a reduced meteorological yield. Thus, the CHD events did not necessarily result in reduced maize yield; instead, the latter depended on the extent and scope of the event.
Figure 6 shows the relationship between the meteorological yield and the IOC of summer CHD events in the 26 years of reduced meteorological yield. It shows that the larger the range of CHD events, the greater the reduction in meteorological yield. The correlation analysis revealed that Pearson’s correlation coefficient between the IOC of CHD events in summer and the yield reduction rate was 0.398. The range of the occurrence of CHD events significantly affected maize yield, and it explained 15.8% of the reasons for yield reduction. In addition to CHD events, other meteorological disasters such as drought, low temperature, and frost damage occurred in the years of reduced maize production [22].

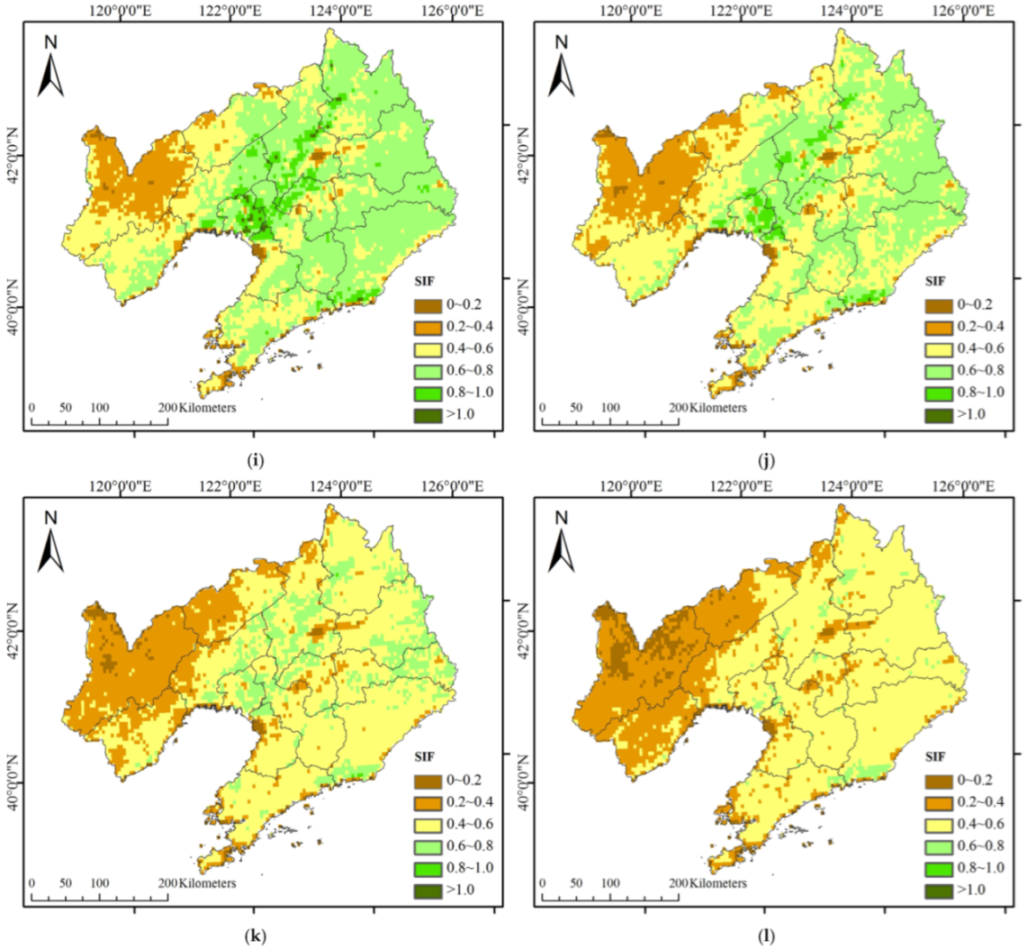
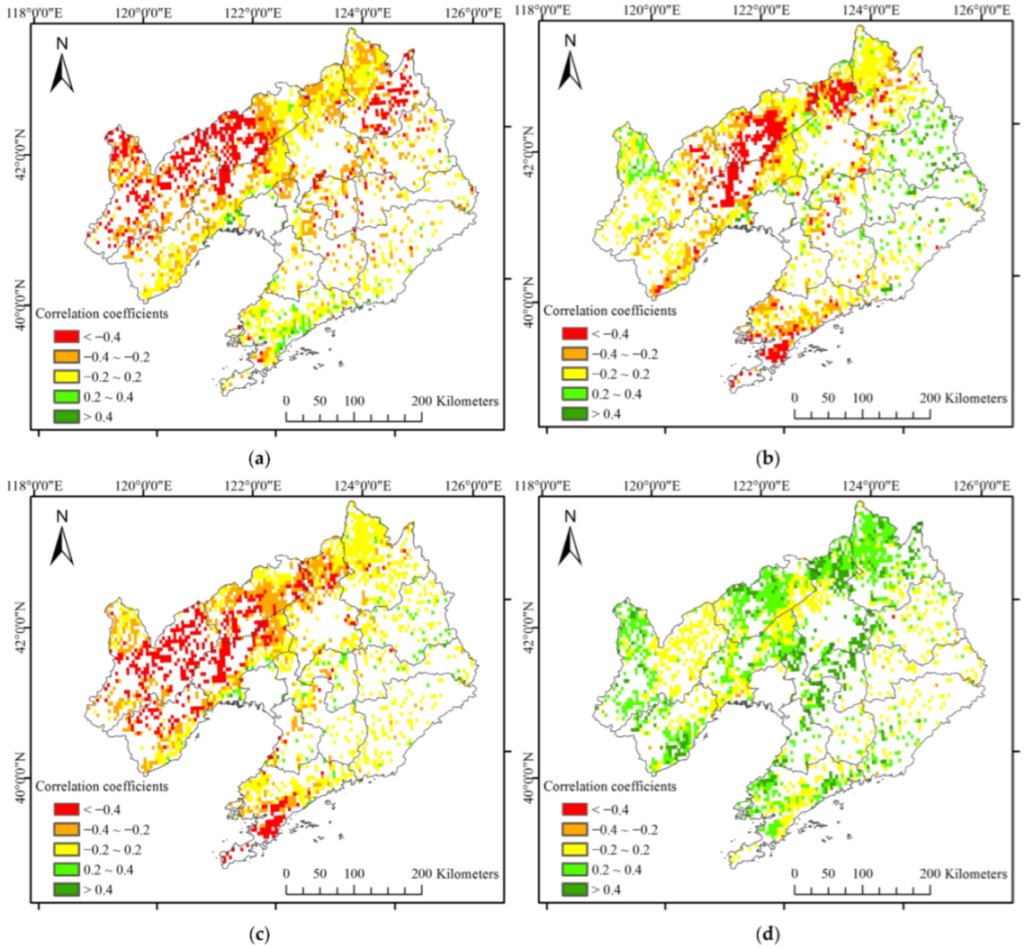
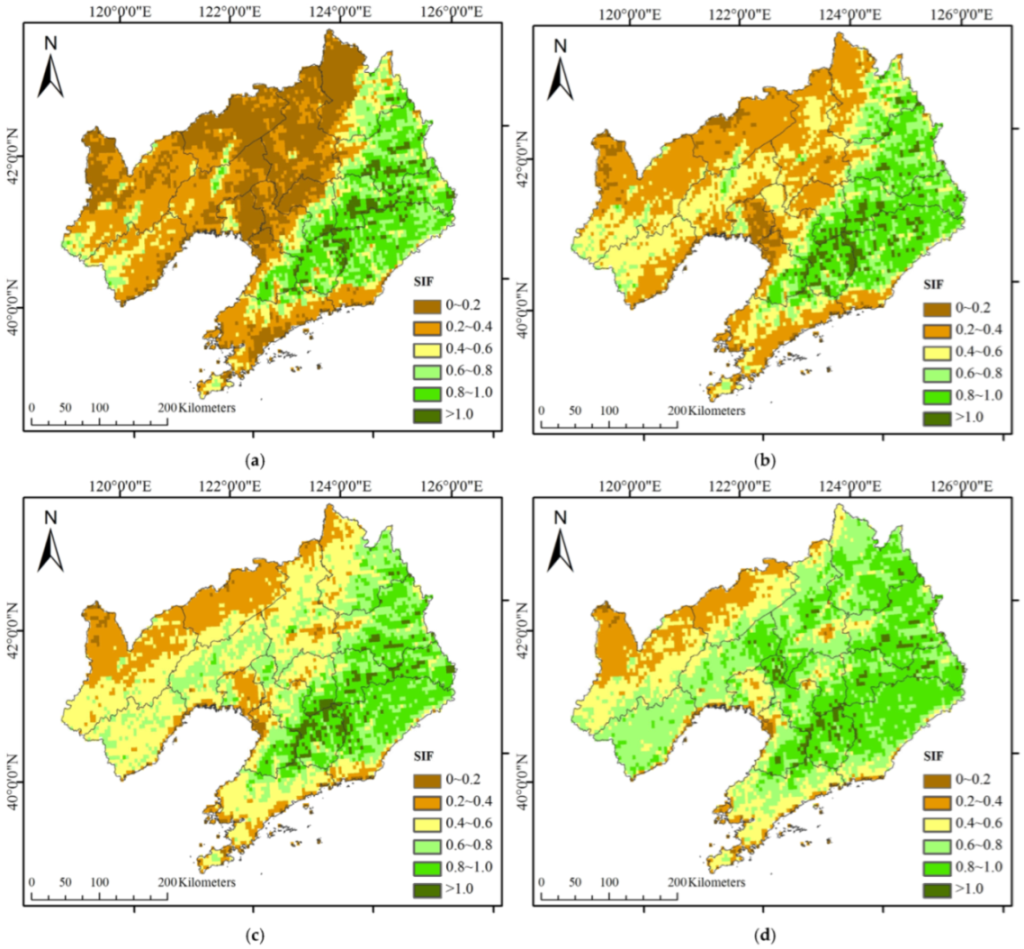
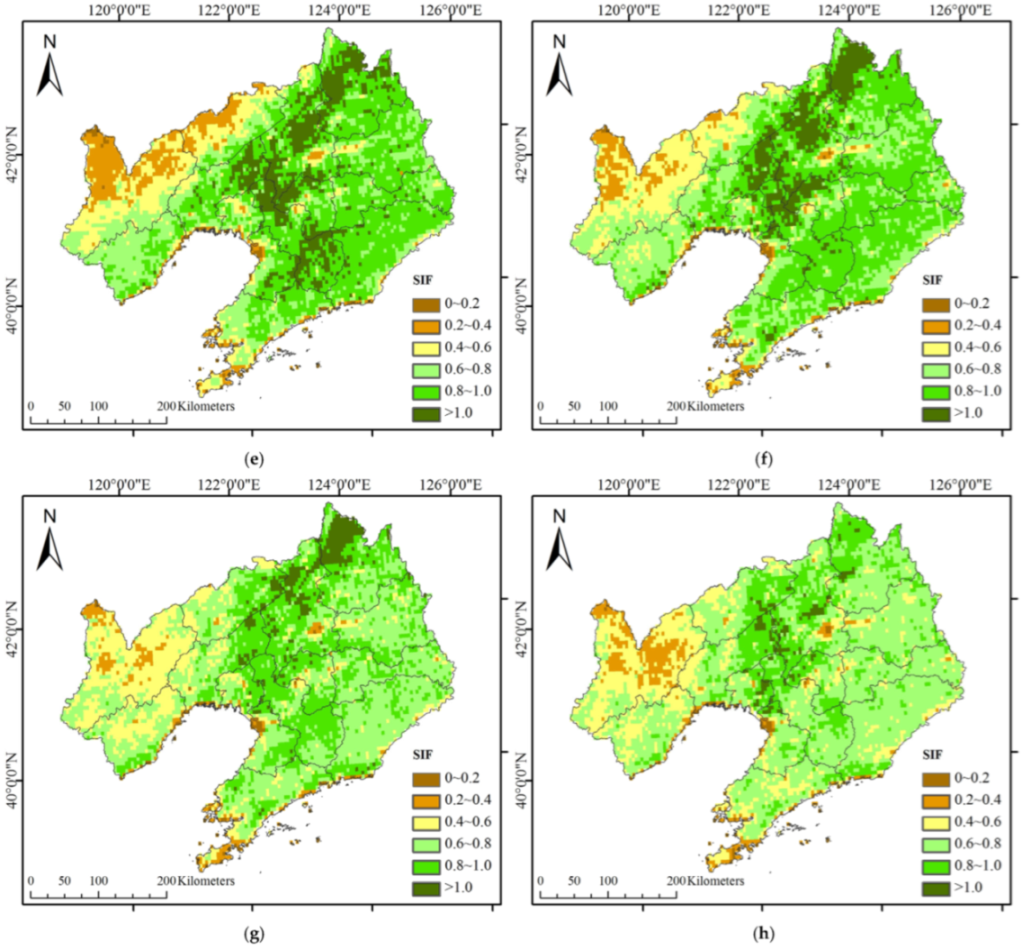
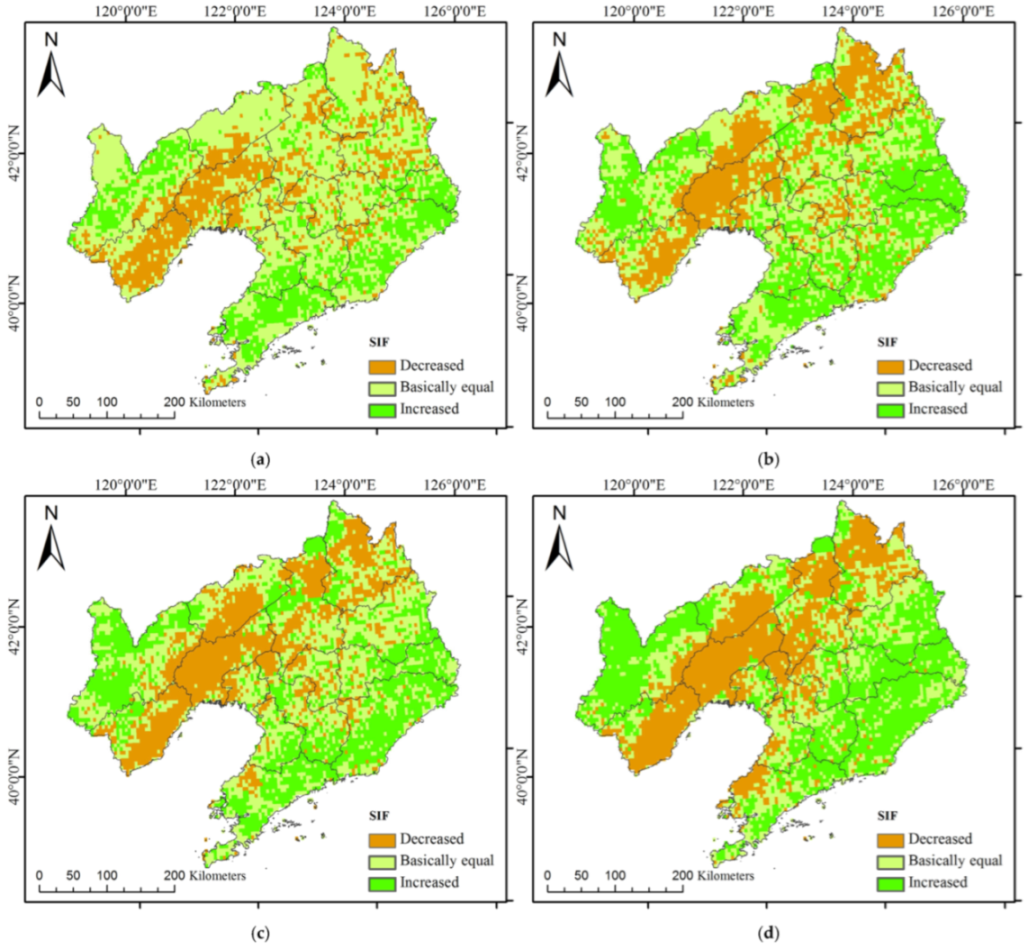
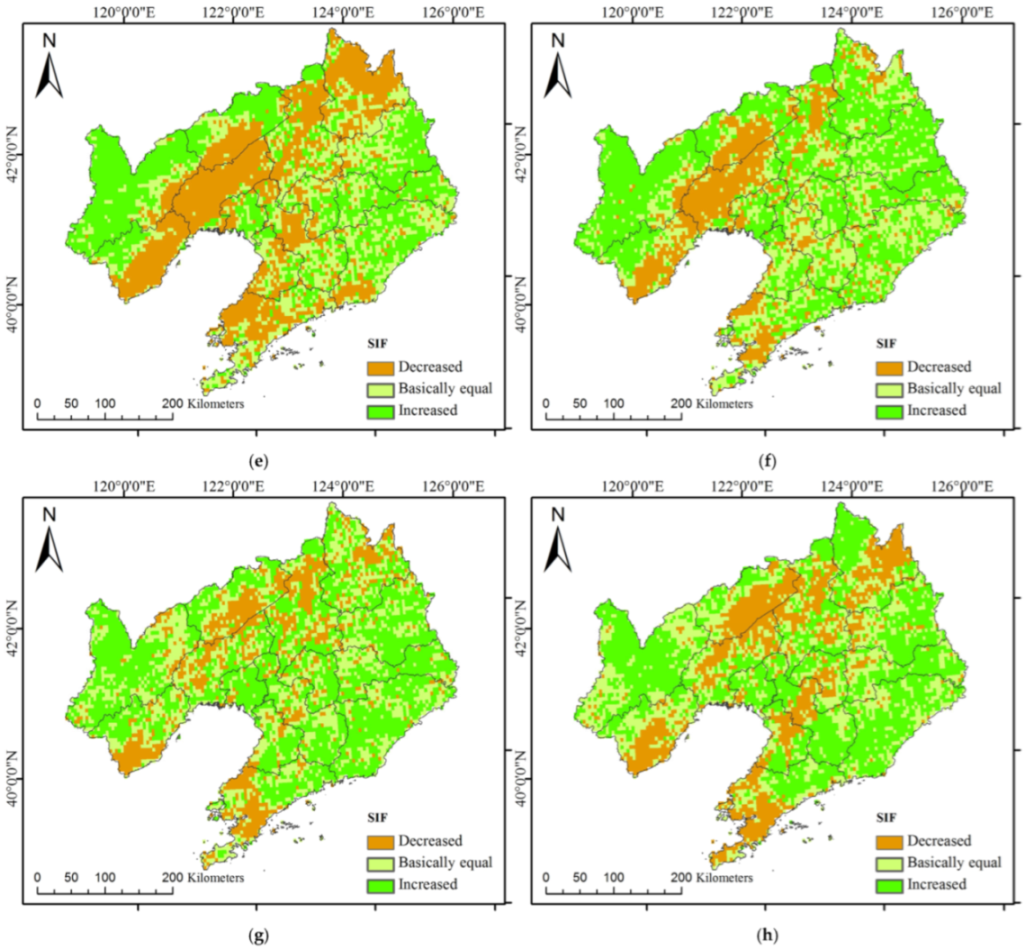
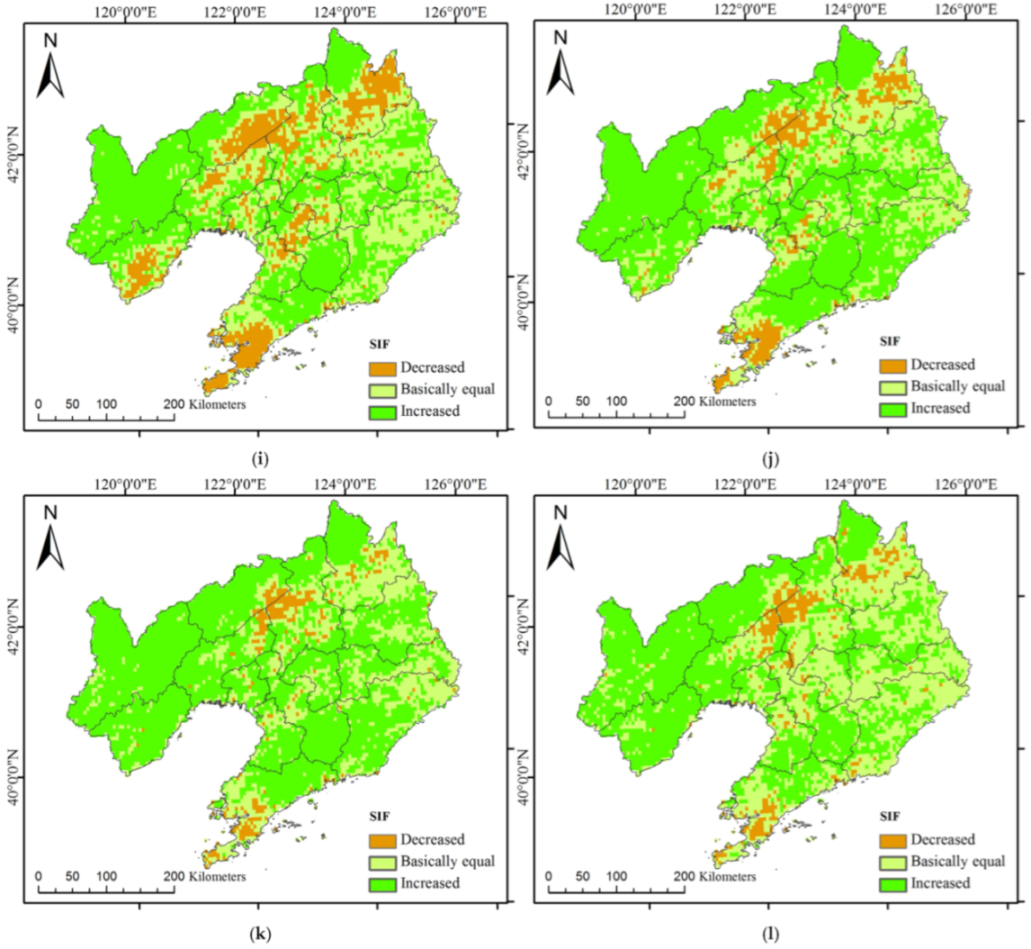
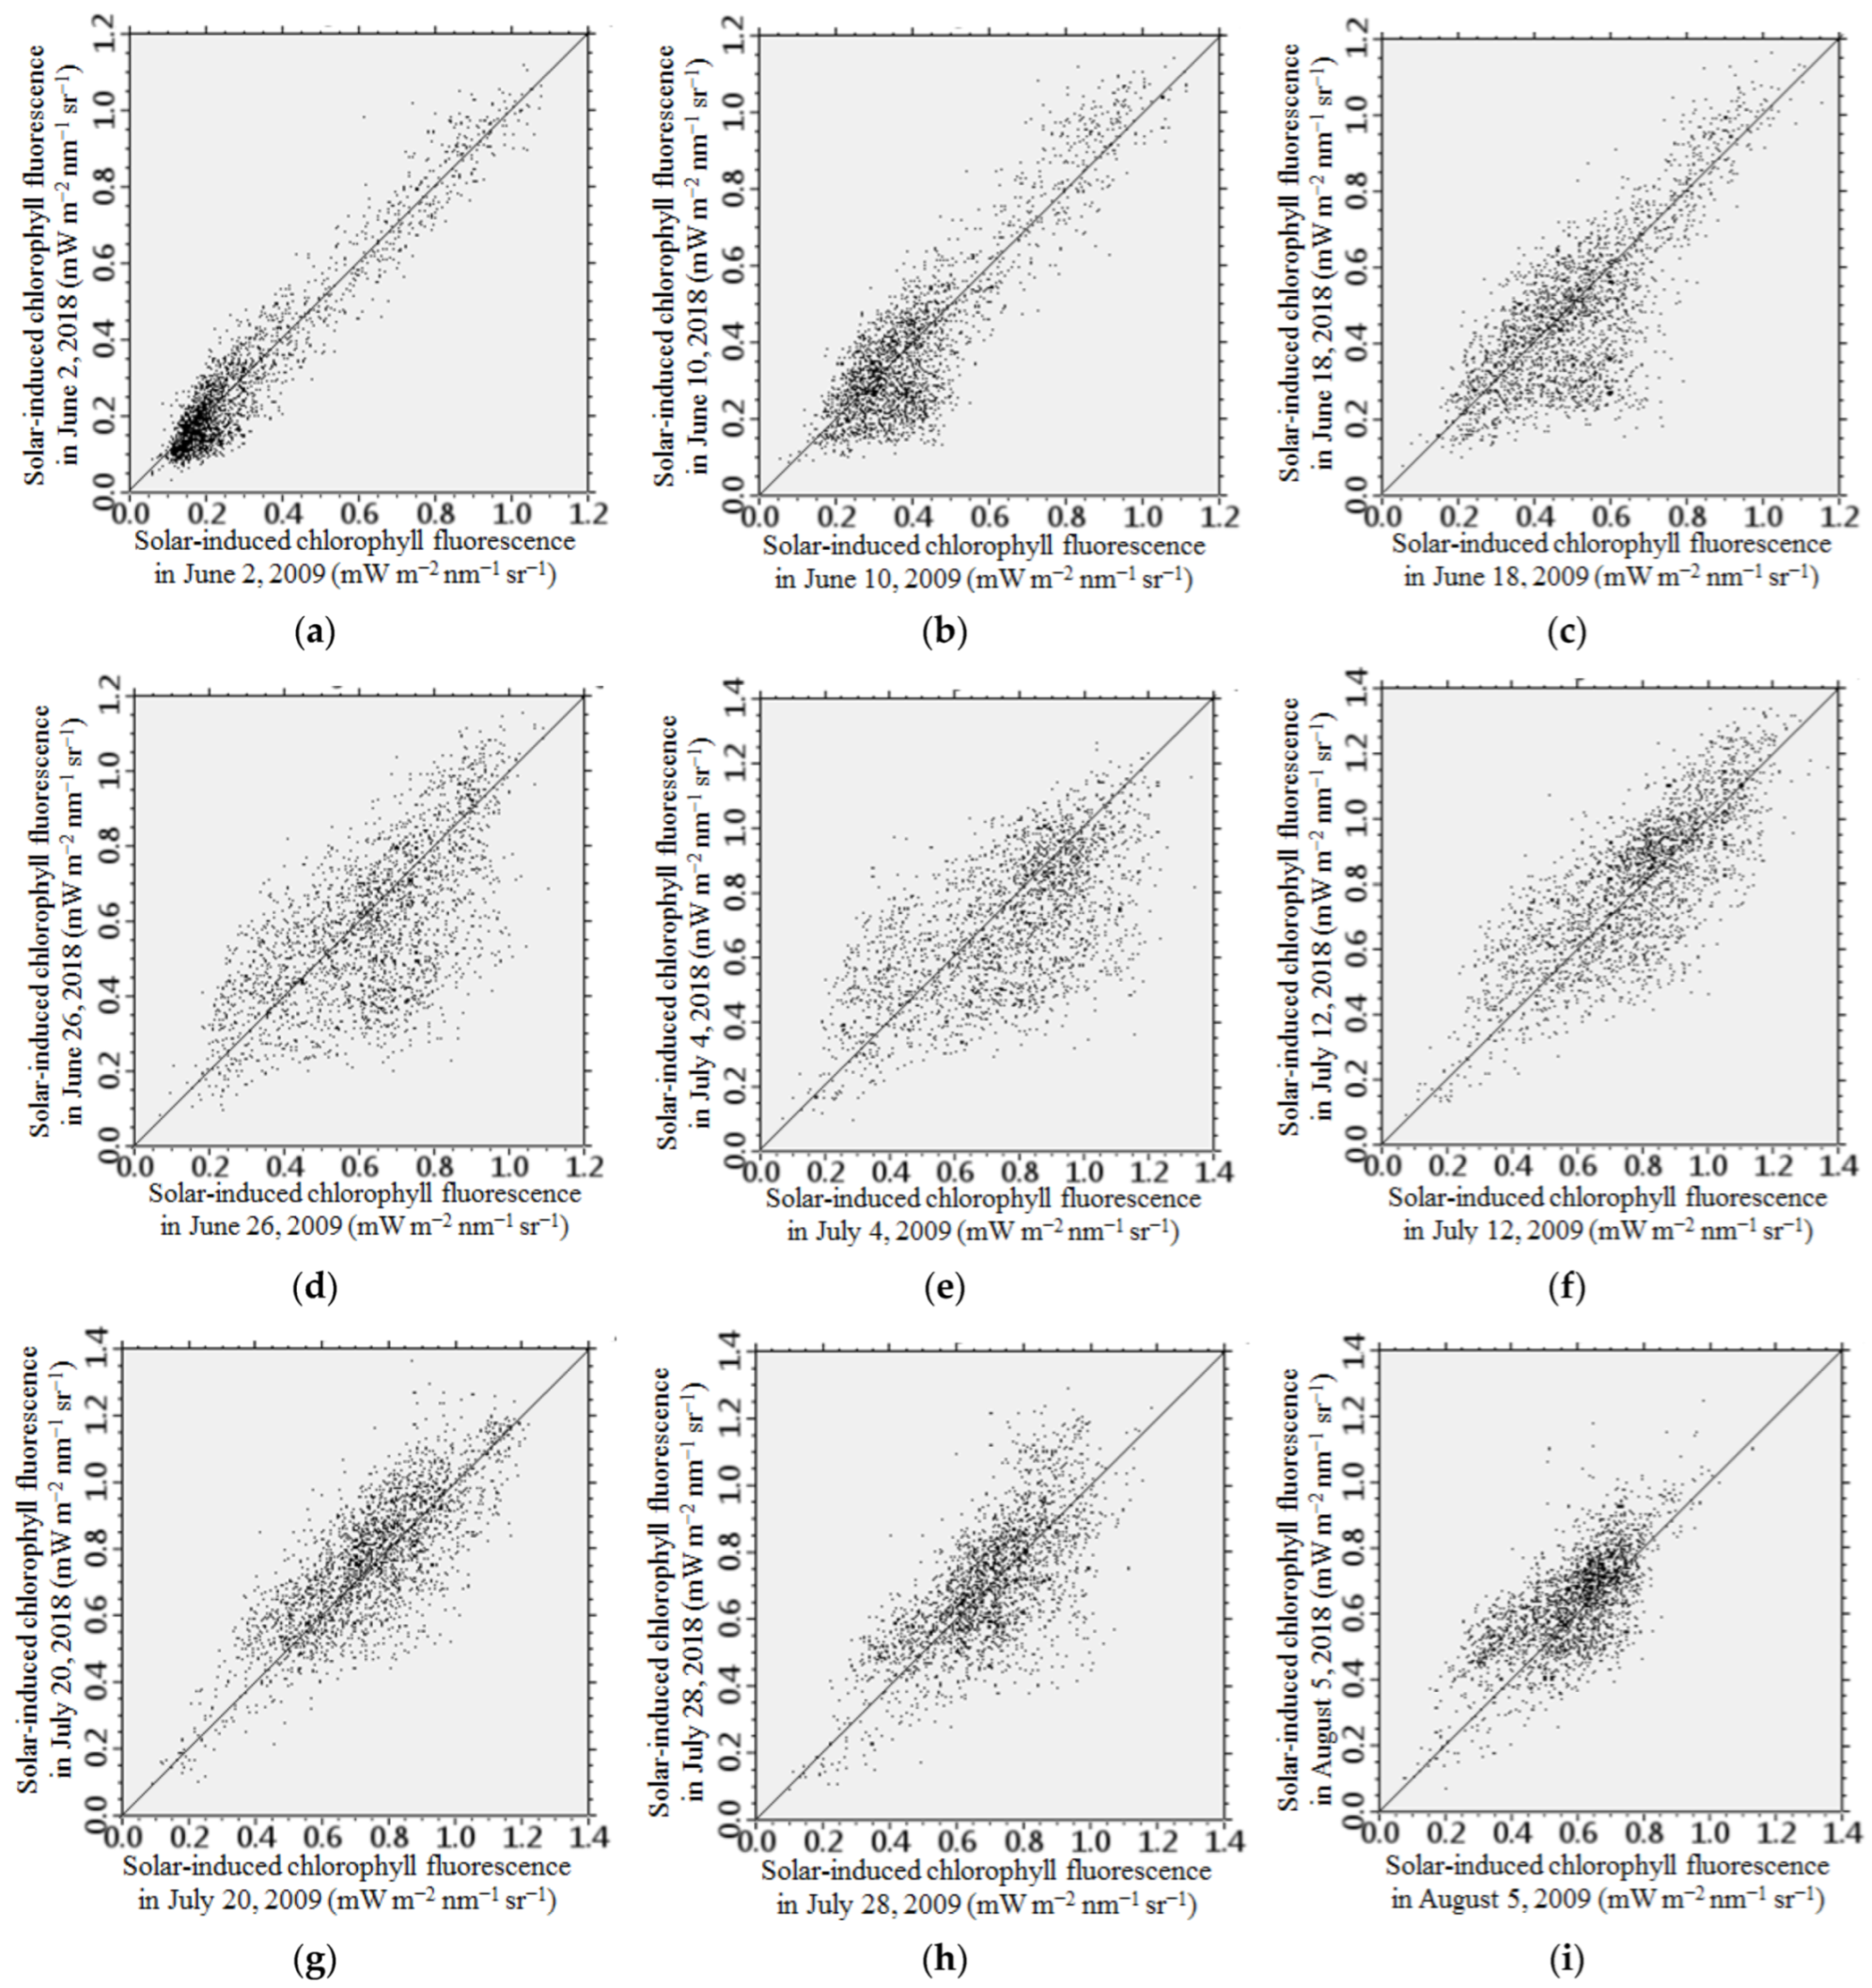
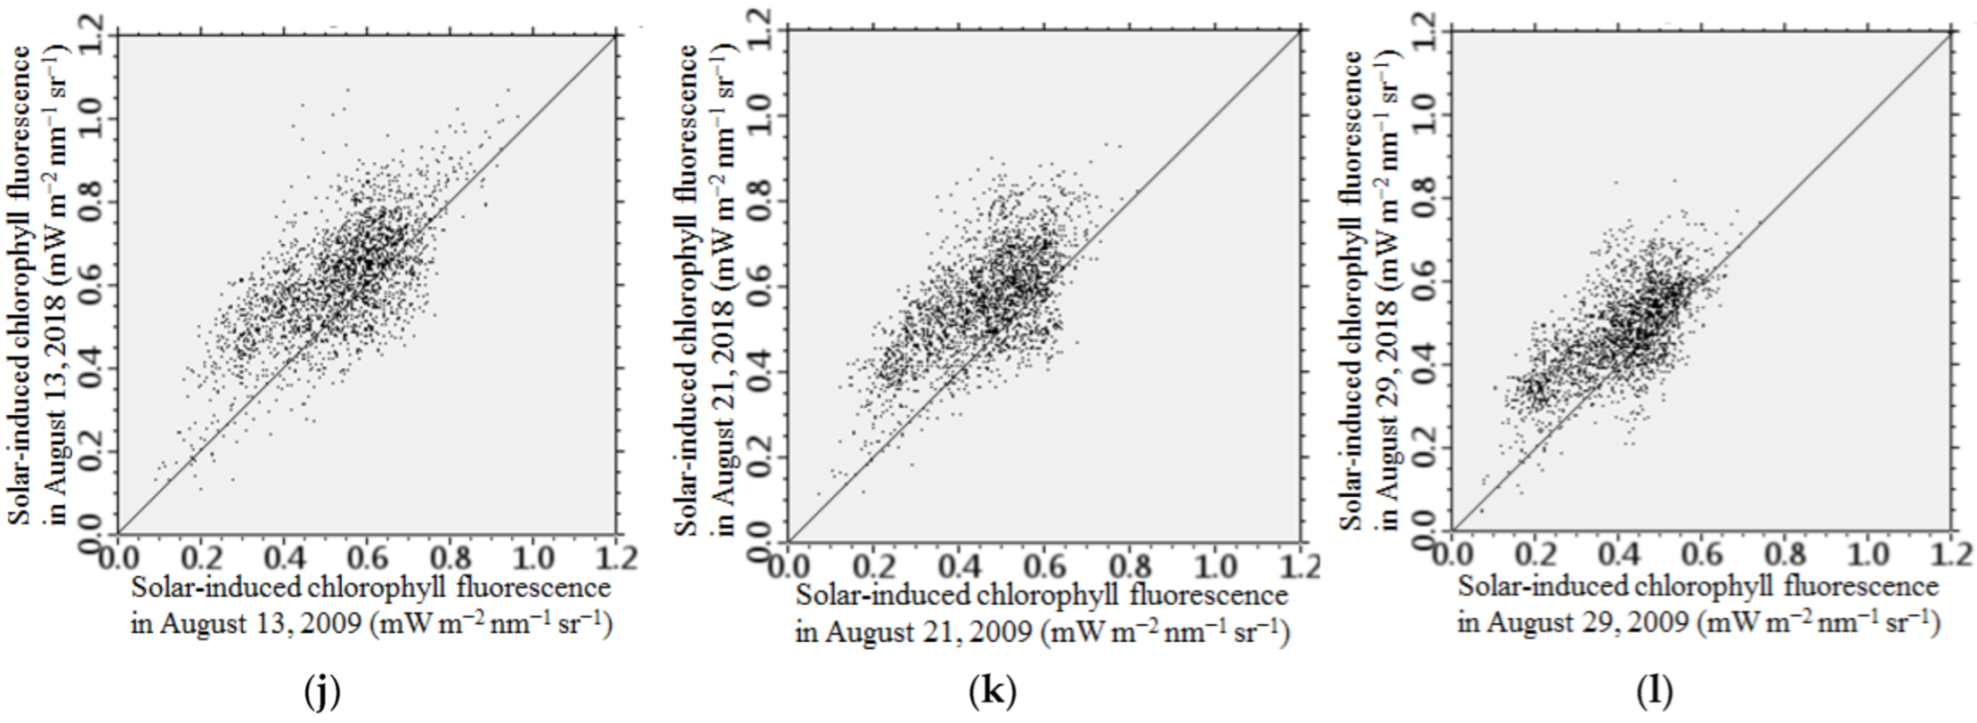
3.2.2. Effects of CHD Events on Maize Photosynthesis

The correlation coefficients between the monthly maximum SIF and monthly mean temperature or monthly precipitation in the maize cultivation areas of Liaoning were calculated for each pixel in June, July, and August from 2001 to 2020. As shown in Figure 7, the correlation coefficients between SIF and temperature or precipitation were high in most maize cultivation areas. There was a negative correlation between SIF and temperature, especially in western Liaoning, and the correlation coefficient was generally lower than −0.4. The largest correlation coefficients in June, July, and August were −0.68, −0.86 and −0.78, respectively, and the average correlation coefficients were −0.23, −0.12, and −0.21, respectively. In summer, in most maize cultivation areas, the higher the temperature, the smaller the SIF value (i.e., the weaker the photosynthetic capacity). SIF was generally positively correlated with precipitation, and the correlation coefficient was generally higher than 0.4. The highest correlation coefficients in June, July, and August were 0.74, 0.65, and 0.77, respectively, and the average correlation coefficients were 0.23, 0.17, and 0.26, respectively. In most maize cultivation areas, the higher the precipitation, the higher the SIF value (i.e., the stronger the photosynthetic capacity). However, there were also some areas where SIF was weakly or inversely correlated with temperature and precipitation. At the pixel scale, SIF was sensitive to temperature and precipitation, and it was especially affected by high temperatures and precipitation. In summer, the photosynthesis of maize in Liaoning was mainly influenced by high temperatures and precipitation. High temperatures inhibited photosynthesis, while precipitation promoted photosynthesis, thus affecting crop yield.

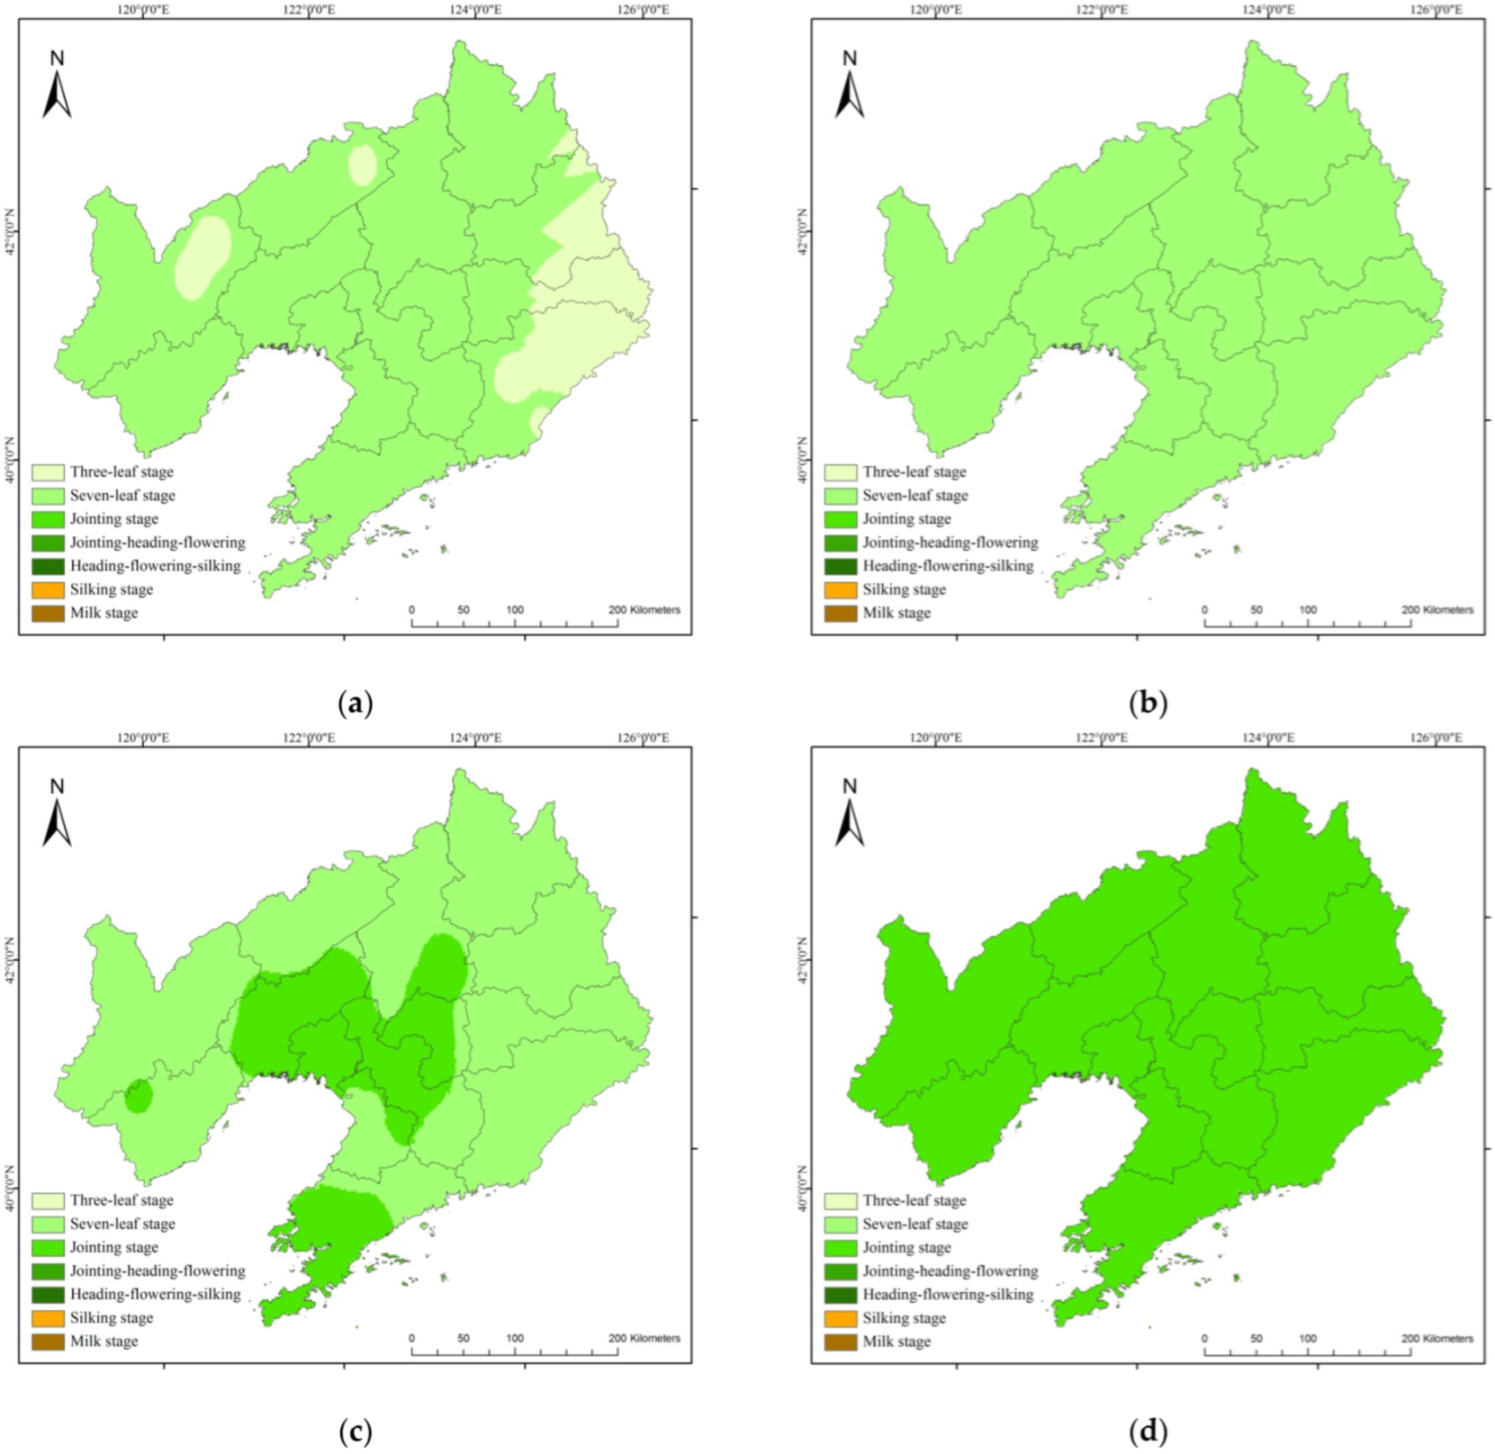
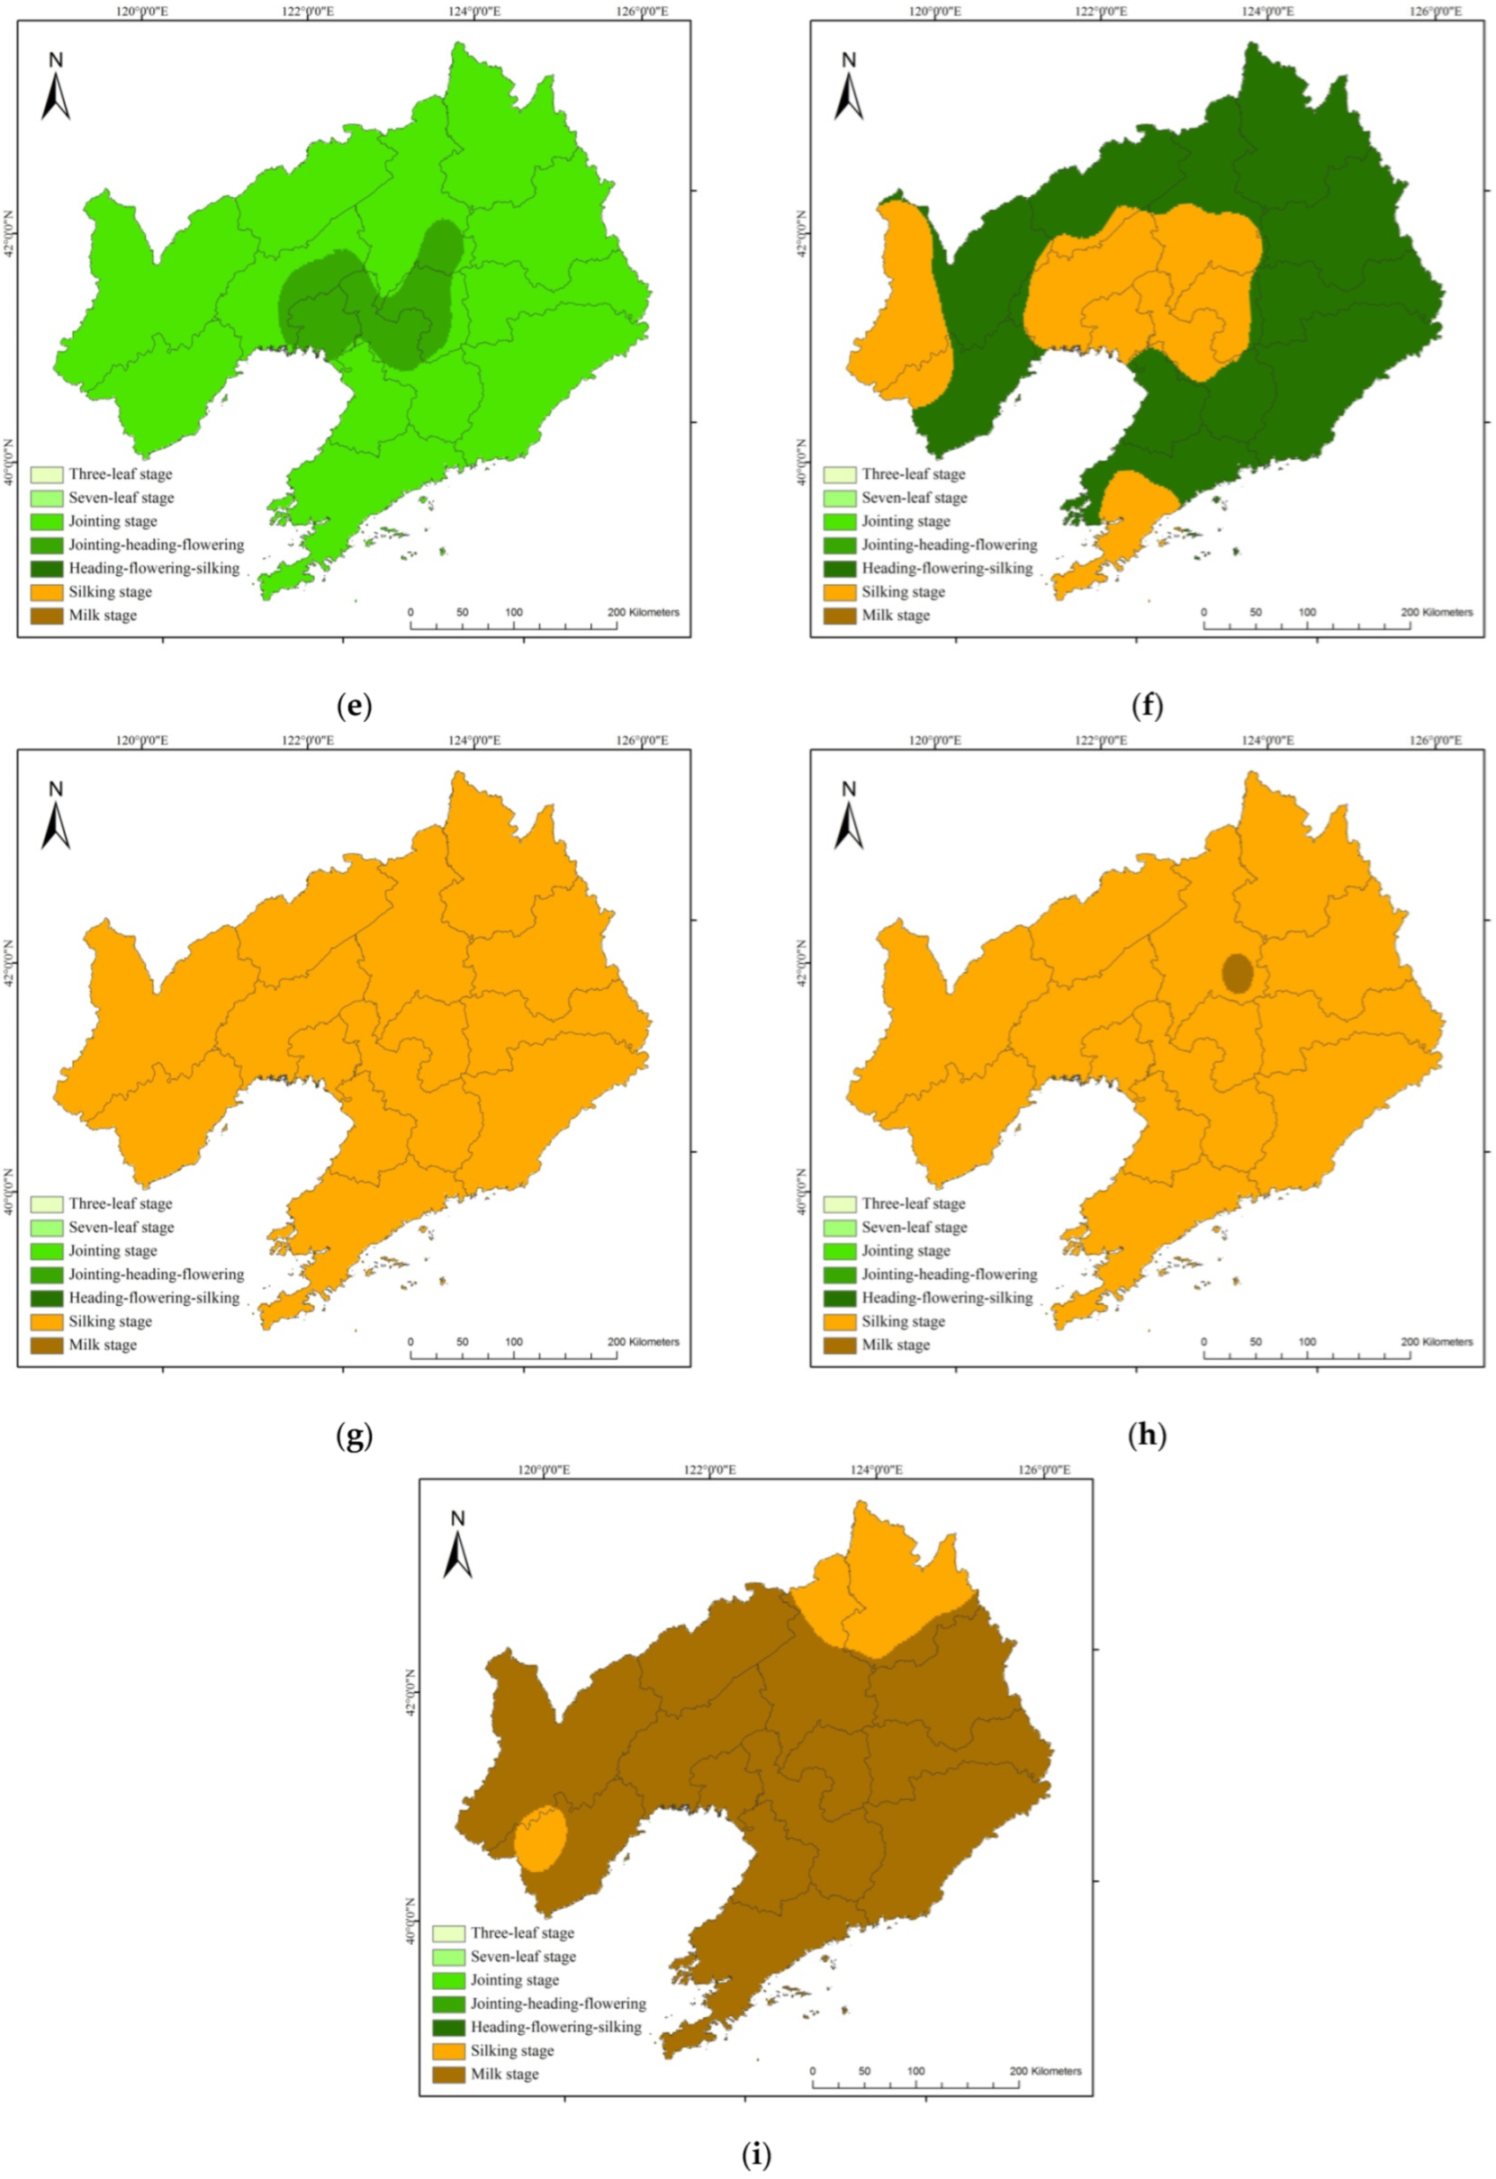
3.3. Effects of CHD Events in Typical Years on the Growth Process of Maize

Because the summers of 2009 and 2018 were typical periods of CHD events, the occurrence and development of CHD events and their effects on maize photosynthesis in these years were analyzed.

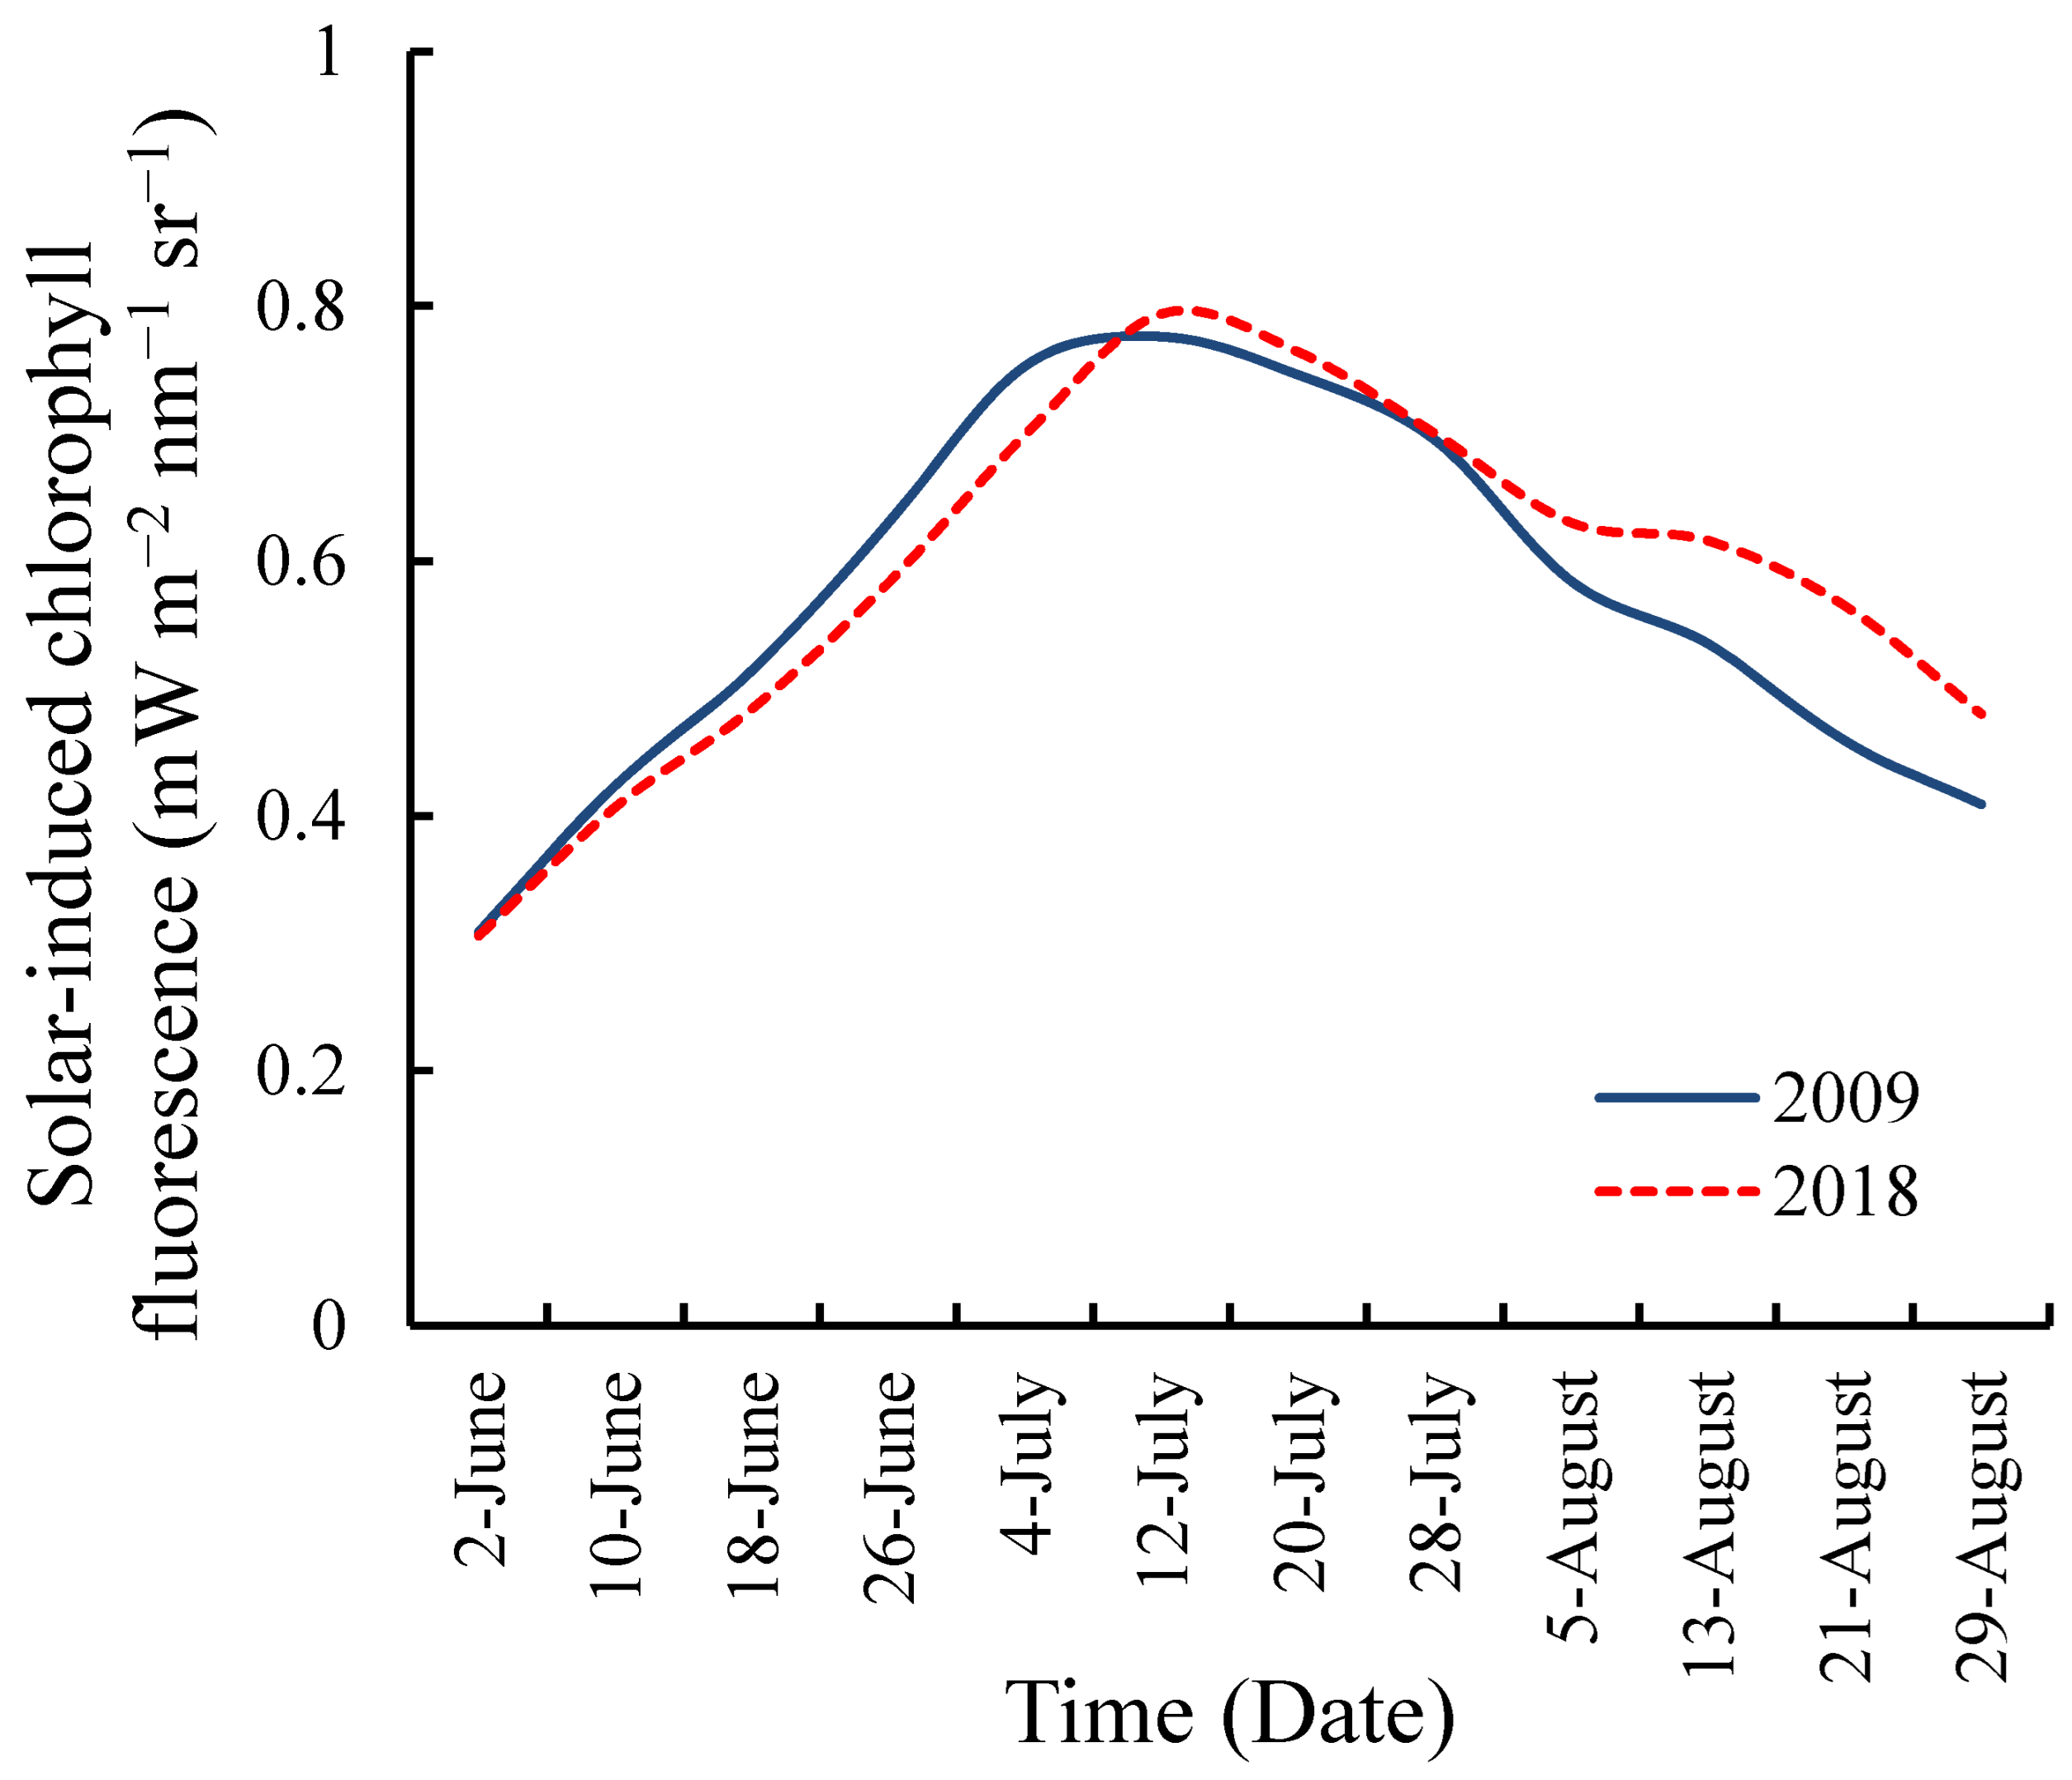
3.3.1. Effects of CHD Event on Maize Growth in 2009

In the first ten days of June 2009, drought affected parts of western, southern, and eastern Liaoning. The impact range and severity were small, the drought ended in the second ten days of June, and only some areas were affected by drought in the last ten days of June (Figure A3a–d). In the last ten days of June, local high-temperature events occurred in western and southern Liaoning, with a small impact range and a short duration of high temperatures (Figure A4a). In early June, maize photosynthesis was strong in eastern Liaoning and the SIF value was high. At that time, maize was generally in the three-leaf to seven-leaf stages, with weak photosynthesis and a low SIF value, with the average SIF ranging from 0.3 to 0.4 mW m−2 nm−1 sr−1 (Figure 8a,b). The SIF value of the maize cultivation area showed a gradually increasing trend, although the increase in the SIF growth rate was slower in some areas of northwest Liaoning (Figure 8c). By the last ten days of June, maize plants had reached the seven-leaf stage to jointing stage in most areas, and the average SIF was approximately 0.6 mW m−2 nm−1 sr−1, which was lower than the value in some areas of western Liaoning (Figure 8d).
In early July, drought affected most areas of Liaoning, but it eased from early to mid-July. The drought expanded at the end July, affecting most areas of Liaoning (Figure A3e–h). However, there were no high-temperature events in July, that is, they were not affected by the CHD, and the impact ranges of severe drought, extreme drought and exceptional drought were small. In the first ten days of July, maize plants were at the jointing stage and were less affected by drought, so photosynthesis increased rapidly. The mean value of SIF in maize cultivation areas reached 0.78, and it was higher than 1.0 mW m−2 nm−1 sr−1 in parts of northern and central Liaoning (Figure 8e,f). In the second and last ten-day periods of July, maize plants were at the jointing to heading stages or flowering to silking stages, and the mean value of SIF was between 0.7 and 0.75 mW m−2 nm−1 sr−1. The photosynthesis of maize in central and western Liaoning was weakened, and the SIF value in some areas was lower than 0.6 mW m−2 nm−1 sr−1 (Figure 8g,h).
In the first ten days of August, high-temperature events occurred in western Liaoning, and the range of influence continued to expand in the second ten days of August (Figure A4b). Most areas of Liaoning were affected by high-temperature events, and the cumulative number of days of high-temperature events was greater in western and central Liaoning (Figure A4c,d). In early and mid-August, most areas of Liaoning were affected by drought, which was more serious than that in July, and most areas experienced extreme drought or exceptional drought. At the end of August, drought still affected some areas of western, northern, eastern, and southern Liaoning, although it had weakened (Figure A3i–l). In early and mid-August, maize plants were at the silking stage, their photosynthesis continued to weaken, and the average SIF ranged from 0.5 to 0.6 mW m−2 nm−1 sr−1. The SIF value was generally lower than 0.6 mW m−2 nm−1 sr−1 in most areas of western and southern Liaoning that were seriously affected by CHD events, while the SIF values in most areas of central and eastern Liaoning ranged from 0.6 to 0.8 mW m−2 nm−1 sr−1 (Figure 8i,j). In mid-August, because of the impact of the widespread CHD event and the fact that maize plants were approaching the end of their growth, the photosynthesis of maize was weak in most areas, and the average SIF was between 0.4 and 0.5 mW m−2 nm−1 sr−1 (Figure 8k). By the end of August, maize plants in most areas were at the milk ripening stage, and the mean SIF was approximately 0.4 mW m−2 nm−1 sr−1, or lower than 0.4 mW m−2 nm−1 sr−1 in western Liaoning (Figure 8l).

3.3.2. Impact of CHD Event on Maize Growth in 2018

In the first ten days of June 2018, some areas of western Liaoning were affected by light drought. The drought ended in the second ten-day period of June, and it only affected some areas in the last ten days of June (Figure A5a–d). A local high-temperature event occurred in western Liaoning in early June (Figure A6a), and its influence range and duration increased in late June (Figure A6b). The range and severity of drought in Liaoning in June 2018 were small, but the range of high-temperature events was larger than that in the same period of 2009. Similar to the same period of 2009, in early June, maize was at the seedling stage, photosynthesis was weak, and the average SIF was 0.3–0.4 mW m−2 nm−1 sr−1 (Figure 9). In mid- to late June, affected by the CHD event, the SIF of maize increased slowly in western, northern, and central Liaoning, and it was significantly lower than that in the same period of 2009 (Figure 10a–d). At that time, the mean SIF value ranged from 0.5 to 0.6 mW m−2 nm−1 sr−1 (Figure 9).
Drought affected most areas of Liaoning in early July, and it ended during the first or second ten-day period in July (Figure A5e–g). In the last ten-day period of July, high-temperature events occurred in northern and central Liaoning, and they lasted for a long time in some parts of northern and central Liaoning (Figure A6d). In late July, drought occurred and developed rapidly under the influence of precipitation deficit and local high-temperature events. Drought affected most areas of central, eastern, northern, and southern Liaoning, and it was more serious than that in the same period of 2009 (Figure A5h). In early July, because of the continuous impact of CHD and drought, the SIF in western, northern, and southern Liaoning was lower than that in the same period of 2009, with an average value of 0.7 mW m−2 nm−1 sr−1 (Figure 10e). Maize photosynthesis recovered well in early and mid-July, with the mean SIF reaching 0.8 mW m−2 nm−1 sr−1, and the SIF of maize in most areas of Liaoning was higher than that in the same period of 2009 (Figure 9 and Figure 10f,g). In mid-to-late July, the mean SIF of maize ranged from 0.7 to 0.77 mW m−2 nm−1 sr−1, and photosynthesis was weakened in western, northern, and central Liaoning, but the SIF value in most regions was higher than that in the same period of 2009 (Figure 10h).
In early August, the high-temperature events continued to develop and expanded to cover almost the whole province (Figure A6e). From the first ten-day period to the second ten-day period of August, there were more than ten cumulative days of high-temperature events in most areas of western, central, and eastern Liaoning (Figure A6f). In early August, because of the combined effect of heat waves and water deficit, the droughts in most areas of Liaoning were in the severe, extreme, and exceptional categories (Figure 5i,j). In the second ten-day period of August, there was more rainfall, and the droughts gradually eased. In late August, the drought was relieved and ended (Figure A5k,l). A large-scale CHD event occurred from late July to mid-August, resulting in decreased maize photosynthesis in most areas in early August, especially in areas of western and northern Liaoning. Despite this CHD event, the SIF was generally higher than that in the same period of 2009, with the average SIF ranging from 0.62 to 0.63 mW m−2 nm−1 sr−1 (Figure 9 and Figure 10i,j). In mid-August, maize plants were mostly at the silking stage and their photosynthesis was weakened. The average SIF was between 0.5 and 0.6 mW m−2 nm−1 sr−1, which was significantly higher than that in the same period in 2009 (Figure 9 and Figure 10k). In late August, the mean SIF of maize was 0.48 mW m−2 nm−1 sr−1, which was higher than that in the same period in 2009 in most areas (Figure 10l). The CHD events in early August 2018 were more serious than those in the same period in 2009, but the impact of CHD events largely ended in mid-to-late August. In mid-August 2009, maize SIF was seriously affected by the CHD event, and at the end of August, the drought continued in most areas of western, northern, eastern, and southern Liaoning. Therefore, the damage to maize photosynthesis was more serious in 2009 than in 2018.

4. Discussion

Authors should discuss the results and how they can be interpreted from the perspective of previous studies and of the working hypotheses. The findings and their implications should be discussed in the broadest context possible. Future research directions may also be highlighted.

4.1. Identification of CHD Events of Maize in Liaoning Province

Maize is a thermophilous C4 plant, and temperature plays an important role in its growth and development. However, temperatures outside of the suitable range inhibit maize metabolism and photosynthesis [41]. The suitable temperature range for different varieties of maize differs among regions. Usually, the average daily temperature or maximum daily temperature and the duration of high temperatures are used as the main indicators for identification of high-temperature events in maize. Some studies have suggested that the appropriate temperature range for maize growth is 25 °C to 31 °C [42]. Labell et al. [43] found that when the daily maximum temperature is greater than 30 °C, the maize yield decreases by 1.7% for every 1 °C increase in accumulated temperature. Under high-temperature conditions of 3–5 °C above 33 °C during the flowering stage, the proportion of high-vitality pollen decreased by 23.1% [44]. The development period from June to August covers the seedling, jointing, tasseling, and milk stages, and it is the key development period of spring maize. Considering the upper temperature limit for each growth period of maize under high-yield conditions and the historical extreme temperatures, this paper defined a daily maximum temperature of 33 °C or above for 3 or more consecutive days as a high-temperature event for spring maize in Liaoning.
Liu et al. [25] identified the maize drought in Liaoning during 1961–2018 with EDDI, and they compared the results with those of four drought indexes: the compound index of meteorological drought (CI), the standardized precipitation index (SPI), the comprehensive monitoring index of meteorological drought (MCI) and the standardized precipitation–evapotranspiration index (SPEI). The results showed that, compared with other drought indices, SPI and SPEI were generally consistent with the drought years determined by EDDI, but there were slight differences in the categorization of the drought categories [25]. The reason is that the five indexes have different mechanisms for identifying droughts. CI, SPI and SPEI can better reflect the influence of precipitation deficit on drought, while EDDI and MCI have obvious advantages in identifying drought caused by high evapotranspiration. EDDI has often been used to identify flash drought caused by heat waves or precipitation deficits [23], and it is more sensitive than other indices to the occurrence and persistence of abnormal evaporative demand. A CHD event in summer is usually caused by a heat wave or a lack of water. Therefore, it was reliable and suitable to use EDDI to identify CHD events for maize in Liaoning.
In this study, the 2-week EDDI was used to monitor maize drought dynamics in Liaoning, and the drought category results were combined with the areas affected by high-temperature events to provide the CHD event level. The direct impact of CHD on maize was reflected in the drought category, while the EDDI reflected the occurrence and persistence of abnormal evaporation demand, which was often caused by high temperatures and insufficient precipitation. Therefore, the drought category results of EDDI indicate the level of influence of CHD events on maize.

4.2. Sensitivity of Maize Growth and Development to CHD

It is generally considered that CHD has a greater effect on maize than single drought or high-temperature events. The characteristics of the maize responses to drought and high-temperature stress differ depending on the developmental stage. Maize plants are more sensitive to CHD at the reproductive and grain-filling stages than at the vegetative growth stage [45,46]. Lv et al. [47] concluded that the effect of CHD on maize chlorophyll content and photosynthesis was greater than the effect of each single stress. According to Li et al. [48], CHD had a stronger impact on the yield and photosynthetic characteristics of summer maize at the heading stage than at other developmental stages. Li et al. [49] concluded that high temperatures at the filling stage had a greater impact on maize grain quality than high temperatures at the flowering stage. Li et al. [34] found that the yield loss of maize in Northeast China caused by CHD was higher than the yield loss caused by each single stress.
This study found that in June 2009 and June 2018, spring maize was affected by CHD events that occurred at the three-leaf to seven-leaf to jointing stages. The rate of increase in SIF slowed down in some areas, but photosynthesis still showed a significant increasing trend with maize growth. The SIF values were slightly lower in June 2018 than in June 2009 (Figure 11a–d). In early July 2009 and 2018, most areas of Liaoning were affected by drought, which eased or ended in the first or second ten-day period of July. In the first ten-day period of July, maize plants were at the jointing stage, growing vigorously, with photosynthesis increasing rapidly, and the maximum SIF reached 1.4 mW m−2 nm−1 sr−1 (Figure 11e,f). In mid-July, maize plants were generally at the jointing, heading, and flowering stages, and the SIF was basically the same in July 2009 and July 2018 (Figure 11g). In late July, maize plants were at the heading, flowering, and silking stages, during which CHD events occurred in most areas in 2018 and drought was widespread in 2009. Under drought stress or CHD stress, maize photosynthesis was inhibited, and SIF decreased and/or the growth rate slowed (Figure 11h). After the tasseling stage, the leaves began to age, and their resistance to drought and high temperatures was weakened. At this stage, drought or CHD events resulted in the inhibition of photosynthesis and a gradual and significant decrease in SIF.
Large-scale CHD events occurred in mid-to-late August in 2009 and from late July to mid-August in 2018. The maize SIF in early August was slightly higher in 2018 than in 2009 (Figure 11i,j), and that in mid-to-late August was significantly higher in 2018 than in 2009 (Figure 11k,l). As the leaves aged, the maize SIF in August showed a decreasing trend. In 2009, the CHD event mainly occurred during the silking to milk stages of maize growth (mid-to-late August), photosynthesis was seriously damaged, and SIF was seriously reduced and did not recover readily. The CHD event in August 2018 mainly occurred at the silking stage of maize growth (early and mid-August), and although photosynthesis was inhibited to a certain extent, the SIF value was generally higher than that in the same period of 2009. Thus, maize photosynthesis may be more sensitive to CHD events during the flowering to silking stages. The meteorological yield reduction rates in 2009 and 2018 were 22.5% and 3.8%, respectively; that is, the maize yield reduction was more serious in 2009 than in 2018. This provides further evidence that CHD events during the silking to milk stages have a greater impact on maize yield than CHD events during other growth stages.

5. Conclusions

This section is not mandatory but can be added to the manuscript if the discussion is unusually long or complex.

5.1. Temporal and Spatial Characteristics and Development Trend of Maize CHD in Liaoning Province

From 1961 to 2020, the occurrence range, frequency, and severity of summer CHD events in Liaoning showed an increasing trend. There were no large-scale CHD events before 1996, only regional or local CHD events. Large-scale CHD events occurred only after 1996. The CHD events were more frequent in June and July, and higher-intensity CHD events were more frequent in July and August. The highest frequency of CHD events was in western Liaoning. According to previous studies, the occurrence range of drought in multi-growth stages of maize has shown an increasing trend in Liaoning, while other types of combined disasters such as combined drought and chilling damage, combined drought and frost damage, and combined chilling and frost damage have shown a decreasing trend [21]. The IPCC Sixth Assessment Report noted that the probability of extreme events such as the combination of heat waves and droughts will increase worldwide under global warming [50]. Therefore, under the influence of a warm and dry climate and frequent extreme climate events, the effects of CHD disasters on maize will be frequent and intensified.

5.2. Effects of CHD on Maize Growth and Yield in Liaoning Province

Because the summers of 2009 and 2018 were typical periods of CHD events, the occurrence and development of CHD events and their effects on maize photosynthesis were analyzed. The results showed that drought or CHD events inhibited maize photosynthesis and reduced SIF and/or the growth rate. Under CHD stress, the rate of increase in maize SIF slowed down from the three-leaf to jointing stages, and the SIF values stopped increasing or seriously decreased from the tasseling to flowering to silking stages. Thus, maize photosynthesis may be more sensitive to CHD events from the heading, flowering, to silking stages than at other stages, and CHD events during the silking to milk stages may have a greater impact on maize yield than CHD events at other growth stages.
From 1961 to 2020, CHD events occurred in 69% of the years of reduced meteorological yield, and reduced meteorological yield occurred in 41% of the years with CHD events. Thus, CHD events occurred in most of the years of reduced meteorological yield. Maize yield was not necessarily decreased by CHD events; instead, the former depended on the extent and scope of the events. It is difficult to isolate the independent effects of CHD events on maize yield, and further studies should focus on the effects of individual CHD components. In the summers of 2001–2020, SIF was most sensitive to temperature and precipitation, and maize photosynthesis was mainly influenced by high temperatures and precipitation. High temperatures inhibited photosynthesis, and precipitation promoted photosynthesis, thus affecting crop yield. Hence, SIF can be used to monitor the effects of CHD events on maize growth.

Author Contributions

W.Y. and R.J. wrote the main manuscript text; J.W. and R.F. collected and analyzed the data; and N.M. and N.C. contributed to the revision of the manuscript. All authors have read and agreed to the published version of the manuscript.

Funding

This research was funded by the Application of Basic Research Plan of Liaoning Province (2023JH2/101300090), the Project of People’s Livelihood Technology Plan of Liaoning Province (2021JH2/10200024) and the Natural Science Foundation of Liaoning Province (2023-MS-042).

Institutional Review Board Statement

Not applicable.

Informed Consent Statement

Not applicable.

Data Availability Statement

The data on maize area and yield were from the Liaoning Provincial Bureau of Statistics (http://tjj.ln.gov.cn/tjsj/sjcx/ndsj/, accessed on 1 July 2022). The SIF dataset was provided by the National Tibetan Plateau Data Center (http://data.tpdc.ac.cn/home, accessed on 31 July 2022).

Conflicts of Interest

The authors declare no conflict of interest.

Appendix A

Figure A1. Average growth periods of maize in Liaoning Province in each ten-day period in June, July, and August ((a): first ten-day period in June, (b): second ten-day period in June, (c): last ten-day period in June, (d): first ten-day period in July, (e): second ten-day period in July, (f): last ten-day period in July, (g): first ten-day period in August, (h): second ten-day period in August, (i): last ten-day period in August).
Atmosphere 14 01397 g0a1aAtmosphere 14 01397 g0a1b
Figure A2. Spatial distribution of the frequency of CHD events in different categories in three summer months ((a): June CHD5, (b): June CHD4, (c): June CHD3, (d): June CHD2, (e): June CHD1, (f): July CHD5, (g): July CHD4, (h): July CHD3, (i): July CHD2, (j): July CHD1, (k): August CHD5, (l): August CHD4, (m): August CHD3, (n): August CHD2, (o): August CHD1; CHD1: slight, CHD2: moderate, CHD3: severe, CHD4: extreme, CHD5: exceptional).
Atmosphere 14 01397 g0a2aAtmosphere 14 01397 g0a2bAtmosphere 14 01397 g0a2cAtmosphere 14 01397 g0a2d
Figure A3. Drought category changes in summer 2009 ((a): 2 June, (b): 10 June, (c): 18 June, (d): 26 June, (e): 4 July, (f): 12 July, (g): 20 July, (h): 28 July, (i): 5 August, (j): 13 August, (k): 21 August, (l): 29 August; D0: no drought; D1: slight drought; D2: moderate drought; D3: severe drought; D4: extreme drought; D5: exceptional drought).
Atmosphere 14 01397 g0a3aAtmosphere 14 01397 g0a3bAtmosphere 14 01397 g0a3c
Figure A4. Cumulative days of high-temperature events in summer 2009 ((a): 26 June; (b): 5 August; (c): 13 August; (d): 21 August).
Atmosphere 14 01397 g0a4
Figure A5. Drought category changes in summer 2018 ((a): 2 June, (b): 10 June, (c):18 June, (d): 26 June, (e): 4 July, (f): 12 July, (g): 20 July, (h): 28 July, (i): 5 August, (j): 13 August, (k): 21 August, (l): 29 August; D0: no drought; D1: slight drought; D2: moderate drought; D3: severe drought; D4: extreme drought; D5: exceptional drought).
Atmosphere 14 01397 g0a5aAtmosphere 14 01397 g0a5bAtmosphere 14 01397 g0a5c
Figure A6. Cumulative days of high-temperature events in summer 2018 ((a): 2 June; (b): 26 June; (c): 12 July; (d): 28 July (e): 5 August; (f): 13 August).
Atmosphere 14 01397 g0a6aAtmosphere 14 01397 g0a6b

References

  1. Ceglar, A.; Toreti, A. Seasonal climate forecast can inform the European agricultural sector well in advance of harvesting. npj Clim. Atmos. Sci. 2021, 4, 42. [Google Scholar] [CrossRef]
  2. Ciais, P.; Reichstein, M.; Viovy, N.; Granier, A.; Ogee, J.; Allard, V.; Aubinet, M.; Buchmann, N.; Bernhofer, C.; Carrara, A.; et al. Europe-wide reduction in primary productivity caused by the heat and drought in 2003. Nature 2005, 437, 529–533. [Google Scholar] [CrossRef] [PubMed]
  3. Lesk, C.; Anderson, W.; Rigden, A.; Coast, O.; Jägermeyr, J.; McDermid, S.; Davis, K.F.; Konar, M. Compound heat and moisture extreme impacts on global crop yields under climate change. Nat. Rev. Earth Environ. 2022, 3, 872–889. [Google Scholar] [CrossRef]
  4. Hussain, H.A.; Saddam, H.; Abdul, K.; Umair, A.; Anjum, S.A.; Shengnan, M.; Longchang, W. Chilling and drought stresses in crop plants: Implications, cross talk, and potential management opportunities. Front. Plant Sci. 2018, 9, 393–414. [Google Scholar] [CrossRef] [PubMed]
  5. Ostmeyer, T.; Parker, N.; Jaenisch, B.; Alkotami, L.; Bustamante, C.; Jagadish, K.S. Impacts of heat, drought, and their interaction with nutrients on physiology, grain yield, and quality in field crops. Plant Physiol. Rep. 2020, 25, 549–568. [Google Scholar] [CrossRef]
  6. Li, Y.; Guan, K.; Peng, B.; Franz, T.E.; Wardlow, B.; Pan, M. Quantifying irrigation cooling benefits to maize yield in the US Midwest. Glob. Change Biol. 2020, 26, 3065–3078. [Google Scholar] [CrossRef]
  7. Christian, J.I.; Basara, J.B.; Hunt, E.D.; Otkin, J.A.; Xiao, X. Flash drought development and cascading impacts associated with the 2010 Russian heatwave. Environ. Res. Lett. 2020, 15, 094078. [Google Scholar] [CrossRef]
  8. Xia, J.; Chen, J.; She, D. Impacts and countermeasures of extreme drought in the Yangtze River Basin in 2022. J. Hydraul. Eng. 2022, 53, 1143–1153. [Google Scholar]
  9. Liu, X.; Yuan, X.; Ma, F.; Xia, J. The increasing risk of energy droughts for hydropower in the Yangtze River basin. J. Hydrol. 2023, 621, 129589. [Google Scholar] [CrossRef]
  10. Lesk, C.; Anderson, W. Decadal variability modulates trends in concurrent heat and drought over global croplands. Environ. Res. Lett. 2021, 16, 055024. [Google Scholar] [CrossRef]
  11. Cohen, I.; Zandalinas, S.I.; Huck, C.; Fritschi, F.B.; Mittler, R. Meta-analysis of drought and heat stress combination impact on crop yield and yield components. Physiol. Plant. 2021, 171, 66–76. [Google Scholar] [CrossRef]
  12. He, Y.; Fang, J.; Shi, P. Substantial increase of compound droughts and heatwaves in wheat growing seasons worldwide. Int. J. Climatol. 2022, 42, 5038–5054. [Google Scholar] [CrossRef]
  13. Zhang, Q.; Yao, Y.; Wang, Y.; Wang, S.; Wang, J.; Yang, J.; Wang, J.; Li, Y.; Shang, J.; Li, W. Characteristics of drought in southern china under climatic warming, the risk, and countermeasures for prevention and control. Theor. Appl. Climatol. 2018, 136, 1157–1173. [Google Scholar] [CrossRef]
  14. Ren, Y.; Yue, P.; Zhang, Q.; Liu, X. Influence of land surface aridification on regional monsoon precipitation in East Asian summer monsoon transition zone. Theor. Appl. Climatol. 2021, 144, 93–102. [Google Scholar] [CrossRef]
  15. Wu, T.; Li, B.; Lian, L.; Zhu, Y.; Chen, Y. Assessment of the combined risk of drought and high-temperature heat wave events in the North China Plain during summer. Remote Sens. 2022, 14, 4588. [Google Scholar] [CrossRef]
  16. Luan, X.; Bommarco, R.; Scaini, A.; Vico, G. Combined heat and drought suppress rainfed maize and soybean yields and modify irrigation benefits in the USA. Environ. Res. Lett. 2021, 16, 064023. [Google Scholar] [CrossRef]
  17. Ray, D.K.; Gerber, J.S.; Macdonald, G.K.; West, P.C. Climate variation explains a third of global crop yield variability. Nat. Commun. 2015, 6, 5989. [Google Scholar] [CrossRef] [PubMed]
  18. Widmann, C.M.A.M.; Widmann, M.; Bevacqua, E.; Loon, A.F.V.; Maraun, D.; Vrac, M. Soil moisture drought in Europe: A compound event of precipitation and potential evapotranspiration on multiple time scales. J. Hydrometeorol. 2018, 19, 1255–1271. [Google Scholar]
  19. Dikšaitytė, A.; Viršilė, A.; Žaltauskaitė, J.; Januškaitienė, I.; Praspaliauskas, M.; Pedišius, N. Do plants respond and recover from a combination of drought and heatwave in the same manner under adequate and deprived soil nutrient conditions? Plant Sci. 2020, 291, 110333. [Google Scholar] [CrossRef] [PubMed]
  20. Jiang, L.; Lv, J.; Qu, H.; Yang, X.; Ji, T.; Li, X.; Zhang, X.; Wang, M.; Wang, P. Effect of hybrid occurrence of cold damage and drought on maize yield in heilongjiang province. J. Catastrophology 2019, 34, 6–13. [Google Scholar]
  21. Yu, W.; Ji, R.; Li, Z.; Liu, D.; Feng, R.; Wu, J.; Zhang, Y. Identification and characteristics of multiple agrometeorological disaster of maize in Liaoning Province, China. Chin. J. Appl. Ecol. 2021, 32, 241–251. [Google Scholar]
  22. Ji, R.; Yu, W.; Feng, R.; Wu, J.; Zhang, Y. Identification and characteristics of combined agrometeorological disasters caused by low temperature in a rice growing region in Liaoning Province, China. Sci. Rep. 2021, 11, 9968. [Google Scholar] [CrossRef] [PubMed]
  23. Ji, R.; Yu, W.; Feng, R.; Wu, J.; Mi, N.; Zhang, Y. Advance in effect mechanism and evolution of flash drought on crop growth process. Chin. J. Ecol. Available online: http://kns.cnki.net/kcms/detail/21.1148.Q.20221228.1500.005.html (accessed on 29 December 2022).
  24. Hobbins, M.T.; Andrew, W.; Mcevoy, D.J.; Huntington, J.L.; Charles, M.; Martha, A.; Christopher, H. The Evaporative Demand Drought Index. Part I: Linking Drought Evolution to Variations in Evaporative Demand. J. Hydrometeorol. 2016, 17, 1745–1761. [Google Scholar] [CrossRef]
  25. Liu, D.; Ji, R.; Chen, P.; Zhang, W.; Li, J. Application of evaporative demand drought index (EDDI) in drought identification of Liaoning Province, China. Chin. J. Appl. Ecol. 2020, 31, 3480–3488. [Google Scholar]
  26. Parker, T.; Gallant, A.; Hobbins, M.; Hoffmann, D. Flash drought in Australia and its relationship to evaporative demand. Environ. Res. Lett. 2021, 16, 064033. [Google Scholar] [CrossRef]
  27. Zhao, H.; Wang, R.; Shang, Y.; Wang, H.; Zhang, K.; Zhao, F.; Qi, Y.; Chen, F. Progress and perspectives in studies on responses and thresholds of major food crops to high temperature and drought stress. J. Arid. Meteorol. 2016, 34, 1–12. [Google Scholar]
  28. Dash, A.P.; Lenka, D.; Tripathy, S.K.; Swain, D.; Lenka, D. Character association and path analysis of grain yield and its components in Maize (Zea mays L.) under heat stress. Int. J. Curr. Microbiol. Appl. Sci. 2020, 9, 2750–2758. [Google Scholar] [CrossRef]
  29. Yang, X.; Lu, M.; Wang, Y.; Wang, Y.; Liu, Z.; Chen, S. Response mechanism of plants to drought stress. Horticulturae 2021, 7, 50. [Google Scholar] [CrossRef]
  30. Noor, J.J.; Vinayan, M.T.; Umar, S.; Devi, P.; Iqbal, M.; Seetharam, K.; Zaidi, P.H. Morpho-physiological traits associated with heat stress tolerance in tropical maize (Zea mays L.) at reproductive stage. Aust. J. Crop Sci. 2019, 13, 536–545. [Google Scholar] [CrossRef]
  31. Yan, Z.; Liu, D.; Jia, X.; Yang, Q.; Chen, Y.; Dong, P.; Wang, Q. Maize Tassel Development, Physiological Traits and Yield Under Heat and Drought Stress During Flowering Stage. Sci. Agric. Sin. 2021, 54, 3592–3608. [Google Scholar]
  32. Brás, T.A.; Seixas, J.; Carvalhais, N.; Jgermeyr, J. Severity of drought and heatwave crop losses tripled over the last five decades in Europe. Environ. Res. Lett. 2021, 16, 065012. [Google Scholar] [CrossRef]
  33. Leng, G. Maize yield loss risk under droughts in observations and crop models in the United States. Environ. Res. 2021, 16, 024016. [Google Scholar] [CrossRef]
  34. Li, E.; Zhao, J.; Pullens, J.W.M.; Yang, X. The compound effects of drought and high temperature stresses will be the main constraints on maize yield in Northeast China. Sci. Total Environ. 2022, 812, 152461. [Google Scholar] [CrossRef] [PubMed]
  35. Zhang, Z.; Xiao, Y.; Gou, W.; Cui, J. Study on drought monitoring and spatiotemporal change in Henan Province based on sun/solar-induced chlorophyll fluorescence remote sensing. J. Agric. Big Data 2023, 5, 76–86. [Google Scholar]
  36. Liaoning Provincial Bureau of Statistics, Survey Office of National Bureau of Statistics in Liaoning. Liaoning Statistical Yearbook 2022; China Statistics Press: Beijing, China, 2012; pp. 300–350. [Google Scholar]
  37. Chen, X.; Huang, Y.; Nie, C.; Zhang, S.; Wang, G.; Chen, S.; Chen, Z. Global High-Resolution (8 Days, 0.05°) Solar-Induced Fluorescence Dataset (2001–2020); National Tibetan Plateau Data Center: Tibetan Plateau, China, 2022. [Google Scholar] [CrossRef]
  38. Liaoning Meteorological Bureau. DB21/T 2014–2012 Meteorological Disaster Definition and Classification; Liaoning Administration for Market Regulation: Shenyang, China, 2012; pp. 1–2. [Google Scholar]
  39. Guo, J.; Zhuang, L.; Chen, Y. Study on forecasting methods of corn heat index in Northeastern China (I)—Heat index and corn yield. J. Catastrophology 2009, 24, 6–10. [Google Scholar]
  40. Ji, R. Meteorological Service Handbook of Grain Crops in Liaoning Province; Liaoning Science and Technology Publishing House: Shenyang, China, 2022; pp. 86–92. [Google Scholar]
  41. Qi, Y.; Zhang, Q.; Hu, S.; Wang, R.; Yang, Y.; Lei, J.; Wang, H.; Zhao, H.; Chu, C.; Jin, R. Response of photosynthetic parameters to leaf temperature of spring maize under drought stress. J. Arid. Meteorol. 2023, 41, 215–222. [Google Scholar]
  42. Cao, Y.; Feng, X.; Li, L.; Lu, J. Temporal and spatial variation of spring corn in Liaoning Province under climate change. Acta Ecol. Sin. 2021, 41, 1092–1105. [Google Scholar]
  43. Labell, D.B.; Torney, A.; Field, C.B. Climate extremes in California agriculture. Clim. Change 2011, 109, 355–363. [Google Scholar] [CrossRef]
  44. Huo, Z.; Zhang, H.; Li, C.; Kong, R.; Jiang, M. Review on high temperature heat damage of maize in China. J. Appl. Meteorol. Sci. 2023, 34, 1–14. [Google Scholar]
  45. Zandalinas, S.I.; Mittler, R.; Balfagon, D.; Arbona, V.; Gomez-Cadenas, A. Plant adaptations to the combination of drought and high temperatures. Physiol. Plant. 2018, 162, 2–12. [Google Scholar] [CrossRef] [PubMed]
  46. Cai, F.; Zhang, Y.; Mi, N.; Ming, H.; Zhang, S.; Zhang, H.; Zhao, X. Maize (Zea mays L.) physiological responses to drought and rewatering, and the associations with water stress degree. Agric. Water Manag. 2020, 241, 106379. [Google Scholar] [CrossRef]
  47. Lv, M.; Hu, X.; Fan, X.; Ru, C. Effects of combined stress of high temperature and droughtat jointing stage on summer maize growth and development. Agric. Res. Arid. Areas 2022, 40, 82–89. [Google Scholar]
  48. Li, X.; Shao, J.; Yu, W.; Liu, P.; Zhao, B.; Zhang, J.; Ren, B. Combined effects of high temperature and drought on yield and photosynthetic characteristics of summer maize. Sci. Agric. Sin. 2022, 55, 3516–3529. [Google Scholar]
  49. Li, W.; Wang, C.; Fang, W.; Liu, Z. Effects of high temperature at different stages on kernel quality and starch pasting properties of Maize. J. Maize Sci. 2017, 25, 82–86. [Google Scholar]
  50. IPCC. Climate Change 2021: The Physical Science Basis [EB/OL]. 2021. Available online: https://www.ipcc.ch/report/sixth-assessment-report-working-group-i/ (accessed on 23 November 2022).
Figure 1. Distribution of 52 meteorological stations and maize cultivation areas in Liaoning Province, China.
Atmosphere 14 01397 g001
Figure 2. IOC (number of stations recording combined heat and drought events out of total stations) in three summer months over a 60-year period ((a): June, (b): July, (c): August).
Atmosphere 14 01397 g002
Figure 3. IOC (proportion of stations recording combined heat and drought (CHD) events out of total stations) over 60 years, with CHD events classified into six categories (CHD0: no drought; CHD1: slight, CHD2: moderate, CHD3: severe, CHD4: extreme, CHD5: exceptional). (a): June, (b): July, (c): August.
Atmosphere 14 01397 g003
Figure 4. Spatial distribution of the frequency of CHD events in three summer months ((a): June, (b): July, (c): August) over a 60-year period.
Atmosphere 14 01397 g004
Figure 5. The annual average meteorological yield and the IOC of CHD events in Liaoning over a 60-year period.
Atmosphere 14 01397 g005
Figure 6. Relationship between IOC of CHD events and yield reduction rate in years when meteorological yield reduction occurred.
Atmosphere 14 01397 g006
Figure 7. Correlation coefficients between SIF and temperature or precipitation in maize cultivation areas in Liaoning from 2001 to 2020 ((a): SIF and temperature in June; (b): SIF and temperature in July; (c): SIF and temperature in August; (d): SIF and precipitation in June; (e): SIF and precipitation in July; (f): SIF and precipitation in August).
Atmosphere 14 01397 g007aAtmosphere 14 01397 g007b
Figure 8. Composite 8-day SIF values in summer 2009 ((a): 2 June; (b): 10 June; (c): 18 June; (d): 26 June; (e): 4 July; (f): 12 July; (g): 20 July; (h): 28 July; (i): 5 August; (j): 13 August; (k): 21 August; (l): 29 August).
Atmosphere 14 01397 g008aAtmosphere 14 01397 g008bAtmosphere 14 01397 g008c
Figure 9. Average values of 8-day composite SIF of maize cultivation areas in summer 2009 and summer 2018.
Atmosphere 14 01397 g009
Figure 10. Differences in 8-day composite SIF values between summer 2018 and summer 2009 ((a): 2 June; (b): 10 June; (c): 18 June; (d): 26 June; (e): 4 July; (f): 12 July; (g): 20 July; (h): 28 July; (i): 5 August; (j): 13 August; (k): 21 August; (l): 29 August).
Atmosphere 14 01397 g010aAtmosphere 14 01397 g010bAtmosphere 14 01397 g010c
Figure 11. Comparison of 8-day SIF values in maize cultivation areas between summer 2009 and summer 2018.(a) in 2 June 2009 and 2018 (b) in 10 June 2009 and 2018 (c) in 18 June 2009 and 2018 (d) in 26 June 2009 and 2018 (e) in 4 July 2009 and 2018 (f) in 12 July 2009 and 2018 (g) in 20 July 2009 and 2018 (h) in 28 July 2009 and 2018 (i) in 5 August 2009 and 2018 (j) in 13 August 2009 and 2018 (k) in 21 August 2009 and 2018 (l) in 29 August 2009 and 2018.
Atmosphere 14 01397 g011aAtmosphere 14 01397 g011b
Table 1. Years in which large-scale and regional CHD events occurred in Liaoning Province, China.
TypeLarge-ScaleRegional
June2000, 2001, 20171962, 1965, 1982, 1994, 1997, 2004, 2007
July1997, 1999, 2000, 20201962, 1972, 1994, 2017, 2018, 2019
August2009, 20181968, 1982, 1988, 1989, 1997, 2014, 2016
Disclaimer/Publisher’s Note: The statements, opinions and data contained in all publications are solely those of the individual author(s) and contributor(s) and not of MDPI and/or the editor(s). MDPI and/or the editor(s) disclaim responsibility for any injury to people or property resulting from any ideas, methods, instructions or products referred to in the content.

