Abstract
Co-occurring extreme heat, drought, and moisture events are increasing under global warming and pose serious threats to ecosystem and food security. However, how to effectively link compound agrometeorological disasters (CADs) with climate change has not been well assessed. In this study, we focus on the comprehensive influence of large-scale climate factors on CADs rather than extreme meteorological elements. The results indicate that there are two main CADs of spring maize in Shenyang, Northeast China (NEC), including concurrent drought and cold damage (DC) and drought in multiple growth periods (MD). The related circulation anomalies at mid–high latitudes are identified as four patterns, namely, the Northeast Asia Low (NEAL) and Ural High (UH) patterns affecting DC, the Baikal High and Okhotsk Low (BHOL), and the Northeast Asia High (NEAH) patterns leading to MD. The vertical profile and water vapor transport anomalies further demonstrate the influence mechanism of large-scale circulation on compound heat–moisture stresses. This study highlights the role of atmospheric circulation, which can provide effective predictors for these synergistic agrometeorological disasters.
1. Introduction
Weather and climate extremes have been increasing globally in intensity, duration, and frequency with climate change [1,2,3]. Under this background, crops can be consequently affected by compound agrometeorological disasters (CADs), namely, heat and moisture stress co-occurring or occurring successively during growing seasons, which has more severe damage on crop yield than a single species [4,5,6,7]. Northeast China (NEC) is an important maize production base in China, and maize here often is affected by agrometeorological disasters such as heat stress (e.g., delayed cold damage and frost damage) and moisture stress (e.g., drought and waterlogging) [8,9]. The aggravation of extreme climate events in NEC has increase the frequency of CADs [6,10]. Therefore, it is necessary to critically understand the atmospheric mechanisms of CADs and provide early hints to reduce potential impacts on the society and ecosystem.
The growing season of maize in NEC spans from May to September, and each period is quite sensitive to changes in temperature and moisture conditions. In spring and summer, the temperature and precipitation in NEC have inhomogeneous spatial–temporal distribution and seasonal variations [11]. Abnormal atmospheric circulation is the direct cause of CADs. NEC is located at mid–high latitudes, and weather and climate anomalies are mainly affected by circulation factors such as westerlies, subtropical highs, northeast cold vortexes (NECVs), and atmospheric teleconnections [12,13,14]. Low-temperature events are usually accompanied by a strengthening Siberian High and fast-moving height ridge [15]. The occurrence of high temperature in NEC is closely related to local abnormal deep anti-cyclones, which also inhibit precipitation [16]. An NECV is an important system that causes severe convective weather in NEC, such as cold spells, continuous rain, and floods [15,17,18,19]. Blocking high is another important system at mid–high latitudes that interacts with other circulation anomalies, leading to abnormal weather and climate in East Asia [20]. In recent years, the coupling of precipitation and temperature extremes in NEC have been more and more frequent [6,21]. There are many studies that have analyzed the circulation features of compound extreme weather and climate events. For example, sea surface temperature (SST) anomalies in the North Atlantic can affect the local circulation through the Eurasian teleconnection and the Silk Road pattern, thus triggering interdecadal changes of drought and high-temperature events in NEC [22]. However, less attention has been paid to the atmospheric background of CADs, which tend to differ in intensity and duration.
It was found that the occurrence range of CADs in Liaoning was more frequent than that of individual agrometeorological disasters in most years in recent decades [23,24]. Furthermore, the combined effect of CADs is greater than the sum of the effects on crops when the disasters occur alone [9]. Agrometeorological disasters can occur at different growing stages, such as cold damage in spring and drought in summer, and the mutual damage to crop physiological processes can be superimposed [25,26,27,28]. The combination of drought and high temperature is more general [6,9,29]. During drought, the sensible heat is greater than the latent heat, which leads to an increase in surface temperature and in turn reduces the soil moisture and exacerbates drought [30,31]. This annual variation in hydro-thermal conditions may be related to the internal variability of the atmosphere, such as El Nino–Southern Oscillation (ENSO), resulting in yield losses and agrometeorological disasters in many parts of the world [11,29]. Nonetheless, the above studies are mostly based on statistical models indicating the robustness of these results. In addition, climate variability can be modulated by several factors, but the corresponding circulation pattern is relatively certain. Therefore, this paper tries to skip the influence of meteorological elements such as temperature and precipitation and focus on the role of atmospheric circulation factors, which can also be linked to internal climate variability (such as ENSO) and provide more credible evidence.
The objective of this study is to provide a detailed large-scale circulation analysis for CADs on spring maize in NEC and improve understanding of CAD predictability. The rest of paper is organized as follows. Section 2 introduces the data sets and methods used in this study. In Section 3, the characteristics of the CADs in the study area and the related large-scale circulations are presented. The associated atmospheric circulation patterns are discussed. Conclusions appear in Section 4.
2. Materials and Methods
2.1. Data
Due to the large area in NEC, the spatial–temporal distribution of temperature and precipitation is particularly uneven. Moreover, precipitation can vary greatly between seasons, with less precipitation in spring and a considerable drought risk throughout the spring maize growing season [32,33]. Therefore, this study is based on Liaoning province (Lat: 38°43′ N–43°26′ N, Lon: 118°53′ E–125°46′ E) (Figure 1), where the climate characteristics are relatively consistent and the risk of drought is larger, making it representative for NEC under global warming. The annual average temperature and rainfall here are 8.5 °C and 656 mm, respectively. Liaoning grows rain-fed spring maize, which covered an area of 2,724,190 ha in 2021 (https://data.stats.gov.cn, accessed on 15 January 2023). The growth periods of spring maize are divided into 5 stages: May (seedling—three-leaf stage), June (three-leaf—jointing stage), July (jointing—silking stage), August (silking—milk stage), September (milk—mature stage). Considering the seasonal consistency and for the convenience of research, the study period was divided into 4 phases, which are May–June, July–August, and September.
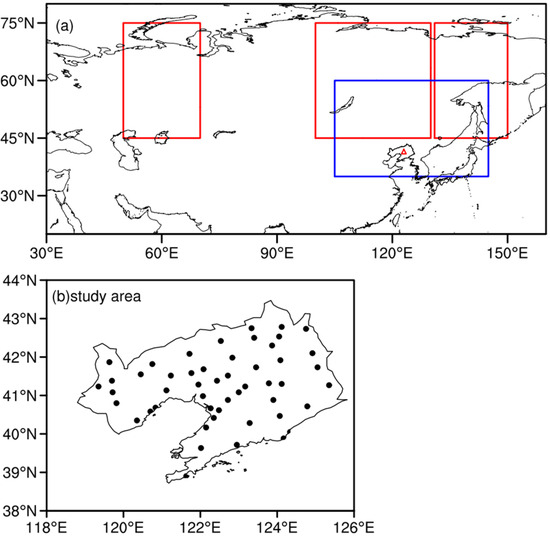
Figure 1.
Regions of low-frequency oscillations at mid–high latitudes (a), red rectangles for blocking high and blue rectangle for NECV and (b) distribution of 50 meteorological stations in the study area, Liaoning Province.
The daily temperature and precipitation observation data of 50 meteorological stations in NEC from April to September for 1961–2021 were provided by the National Climate Center of the China Meteorological Administration. The data of maize yield were derived from the Liaoning Provincial Bureau and the Liaoning Provincial Statistical Yearbook (https://data.stats.gov.cn, accessed on 15 January 2023).
The circulation analysis was based on the monthly atmospheric reanalysis data, with a horizontal resolution of 2.5° × 2.5°, released by the National Centers for Environmental Prediction (NCEP)–National Center for Atmospheric Research (NCAR) reanalysis dataset [34]. Variables including geopotential height, meridional and zonal wind, air temperature, specific humidity, daily precipitation, vertical velocity, and surface-level pressure were used, covering the period of 1961–2021 (https://psl.noaa.gov/data/gridded/data.ncep.reanalysis.html, accessed on 15 January 2023).
2.2. Method
In this paper, composite analysis, correlation analysis, and a logistic regression model are carried out. All observed anomalies are computed relative to the climatology of 1961–2021. In order to eliminate the influence of global warming, the linear trend is removed from all data.
Agrometeorological disasters are identified on basis of the recommended national standards, which can be referred to in Yu et al. (2021) [23]. Compound agrometeorological disasters (CADs) are defined as two or more types of agrometeorological disasters occurring concurrently or alternately during the growing season of spring maize in the same area or the same type of agrometeorological disasters being encountered in two or more different growing periods, with priority given to the situation of more complex disasters. The occurrence range is characterized as the ratio of the affected station. The annual reduction in agrometeorological yield of maize () is calculated using a quadratic polynomial method as follows:
where, is the trend yield, is the time series, is the agrometeorological yield, is the actual yield, and is the yield reduction rate.
According to the definition of CADs and observations, there mainly are five types of CADs of spring maize in NEC resulting in seriously reduced yield ( is higher than 10%). They are drought in multiple periods (MD), drought + frost, drought + cold damage (DC), cold damage + frost, and drought + frost + cold damage. Among them, the occurrence frequency of MD is the highest, followed by DC. In recent decades, DC mainly occurred before the 1990s, with the occurrence range of MD expanding after the 1990s. Therefore, this paper mainly analyzes DC and MD.
Water vapor transport is calculated as follows [35]:
where, represent zonal wind and meridional wind components, respectively, and represent zonal and meridional water vapor flux, respectively. is the acceleration of gravity, taking 9.8 m/s−2. is the lower boundary pressure, and is the upper boundary pressure, which is above 300 hPa in the real atmosphere. The water vapor content is pretty small, so is taken as 300 hPa when calculating the integrated water vapor flux of the whole layer. The vector represents the atmospheric wind speed of each isobaric surface, and is for specific humidity.
Liaoning Province is located at the mid-high latitudes. Therefore, the circulation classification in this study mainly identifies the mid-high-latitudes circulation systems that play a leading role in disasters. We emphatically focus on the anomalous circulation over the areas the blocking high and the NECV are frequently active at mid-high latitudes (Figure 1). The climatic locations where blocking highs occur include Ural Mountain (45°–75° N, 50°–70° E), Lake Baikal (45°–75° N, 100°–130° E) and Sea of Okhotsk (45°–75° N, 131°–150° E) [36]. The active area of NECV is mainly concentrated in Northeast Asia (35°–60° N, 105°–145° E) [37]. In addition, since this paper studies the interannual variation of agrometeorological disasters and related circulation, the number of research samples is small, so we adopt the method of objective identification. Firstly, the years of CAD in maize growth process were obtained and the large-scale circulation characteristics with significant influence were identified. Then, according to the height anomalies of the key areas, the dominant circulation patterns were classified.
3. Results and Discussion
3.1. Classification of CADs of Spring Maize in Liaoning Province
Based on Yu et al.’s (2021) [23] research, we further analyzed agricultural data from 2018–2021 and obtained severe MD that happened in 2018. The results show that the frequency and range of CADs in most years in Liaoning Province were larger than those of single agrometeorological disasters from 1961 to 2021. The CAD with the largest frequency was MD, followed by DC, and our research mainly analyzes these two. During the study period, the occurrence range of MD showed an expanding trend, whereas other types showed a decreasing trend. The related atmospheric circulation anomaly over key areas during the five growth stages are shown in Table 1. The dominant circulation patterns corresponding to different CADs are as follows.

Table 1.
Classification of dominant circulation patterns for the CAD years.
3.2. Related Atmospheric Circulation Patterns of DC
3.2.1. Northeast Asia Low (NEAL) Pattern
The composite atmospheric circulation anomalies in a NEAL-type year of DC are shown as Figure 2. The results show that when DC occurs, the seasonal transformation of circulation is not obvious and the vortex anomalies in NEC are maintained in spring and summer. From May to August there are no obvious positive anomalies in the height field over NEC, whereas the negative anomalies are solid. The northeastern airflow of the vortex anomalies is enhanced with poor water vapor condition. In summer, there is a jet core over NEC and the westerly jet is southerly. The position of the jet stream is consistent with the southern edge of the negative anomaly, which is also in good consistency with this abnormal circulation situation once the NECV is formed. Liaoning is affected by abnormal northwesterly airflow, causing cold air to move further south. Meanwhile, the anomalous subtropical high over the Pacific is weak, resulting in a cooling process and less precipitation in Liaoning.
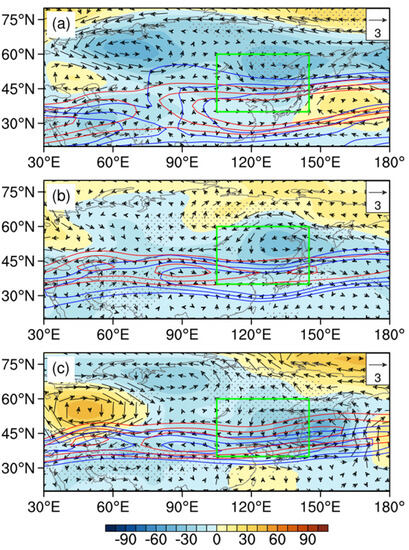
Figure 2.
Composite anomalies of 500 hPa geopotential height (shading, unit: gpm) and wind field (vector, unit: m/s) in May–June, July–August, and September (a–c, respectively) with respect to the 1961–2021 climatology for NEAL years of DC, the zonal wind (20, 25 m/s) of the climate state (solid red line), and abnormal years (solid blue line), represented by the contours. The green rectangles represent the regions low-frequency oscillations significantly occur. The black dots indicate that the anomalies are significant at the 90% confidence level.
3.2.2. Ural High (UH) Pattern
The blocking systems at mid–high latitudes occur frequently in spring and summer, with a long duration, and rarely in autumn, with a short duration. There is a significant negative correlation between the blocking activities near the Ural Mountains (40°–70° N, 30°–80° E) and the summer precipitation in NEC, as shown in Figure 3. The blocking anomalies corresponding to DC mainly occur over the Ural Mountains area, which is beneficial to the formation of blocking high. There are obvious seasonal changes in the activities of blocking in UH-type years. The high-pressure anomalies over the Ural Mountains are maintained in Europe for a long time after the male stage (July). The blocking situation downstream is gradually strengthened, which is beneficial for the formation a two−blocking situation, which is maintained until the milking stage (September). Due to the influence of high pressure, the cold air in Liaoning is intense, and the northerly airflow leads to less precipitation.
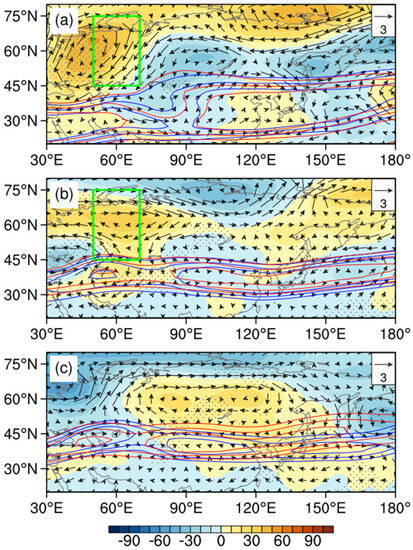
Figure 3.
Composite anomalies of 500 hPa geopotential height (shading, unit: gpm) and wind field (vector, unit: m/s) in May–June, July–August, and September (a–c, respectively) with respect to the 1961–2021 climatology UH years of DC, the zonal wind (20, 25 m/s) of the climate state (solid red line), and abnormal years (solid blue line), represented by the contours. The green rectangles represent the regions low-frequency oscillations significantly occur. The black dots indicate that the anomalies are significant at the 90% confidence level.
3.3. Related Atmospheric Circulation Patterns of MD
Under the background of climate warming, NEC is becoming warmer and drier. As a result, maize yield in this area is projected to decrease with increasing vapor pressure deficits, flash droughts, and hot events exceeding the optimum temperature for spring maize (28–32 °C). Therefore, the risk of MD in Liaoning is multiplied. The circulation classification of multi-developmental drought years is beneficial to improving the prediction ability of CADs, and the results are as follows:
3.3.1. Baikal High and Okhotsk Low (BHOL) Pattern
An NECV is not an isolated weather system; its activities are influenced by and interact with upstream and downstream systems [18,38]. Under the blocking situation, anti-cyclones and cyclones in westerlies can coexist for a long time. As shown in Figure 4, there is an obvious abnormal anticyclone in the south of Lake Baikal in spring and the cyclonic anomalies over eastern NEC are relatively strong. The location of the cyclonic anomalies is beneficial to the eastward movement of the East Asian trough and the precipitation area. NEC is mainly controlled by the northwestern airflow in front of the ridge, with less water vapor transport to Liaoning, which results in drought. In spring and summer, the West Pacific subtropical high in the middle troposphere is southeastward and the intensity is weak. In midsummer, there are anticyclonic anomalies over NEC and cyclonic anomalies near Lake Baikal; however, the intensity is relatively modest. The meridional circulation is more evident in May–June, which is conducive to the southward movement of cold air and the development of cyclone anomalies in NEC. Meanwhile, it is beneficial to maintain and strengthen the downstream anomalous cold vortex over the Sea of Okhotsk, cooperating with the high-pressure anomalies over Lake Baikal upstream [39].
Figure 4.
Composite anomalies of 500 hPa geopotential height (shading, unit: gpm) and wind field (vector, unit: m/s) in May–June, July–August, and September (a–c, respectively) with respect to the 1961–2021 climatology BHOL years of MD, the zonal wind (20, 25 m/s) of the climate state (solid red line), and abnormal years (solid blue line), represented by the contours. The green rectangles represent the regions low-frequency oscillations significantly occur. The black dots indicate that the anomalies are significant at the 90% confidence level.
3.3.2. Northeast Asia High (NEAH) Pattern
The composite circulation for NEAH-type years shows that the drought in NEC lasts for a long time in spring and summer, which could be mainly caused by the long-lasting abnormal anticyclonic circulation over the sea in Okhotsk. As shown in Figure 5, the anomaly center is located at 130°–150° E, which is beneficial to the formation of Okhotsk Sea blocking. The East Asia summer monsoon is weaker than the climatology state and the West Pacific subtropical high is persistently southeastward. Consequently, the water vapor from the Pacific Ocean is blocked. NEC is controlled by ridges for the entire growth periods. The strong sinking movement and insufficient water vapor result in decreased precipitation. Moreover, the abnormal blocking in Eurasia is constantly weak after the seeding stage (May). The strong zonal circulation and infrequent cold air activities leads to higher temperatures and less precipitation in Liaoning, which trigger the MD.
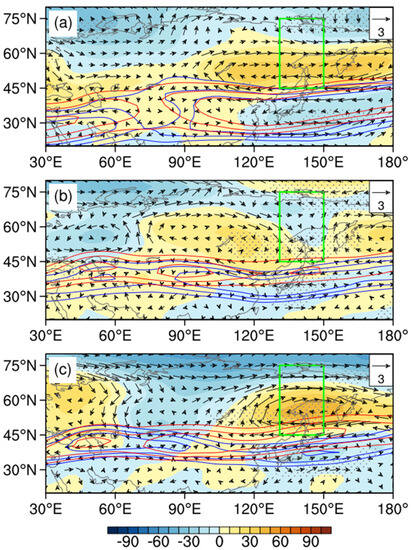
Figure 5.
Composite anomalies of 500 hPa geopotential height (shading, unit: gpm) and wind field (vector, unit: m/s) in May–June, July–August, and September (a–c, respectively) with respect to the 1961–2021 climatology NEAH years of MD, the zonal wind (20, 25 m/s) of the climate state (solid red line), and abnormal years (solid blue line), represented by the contours. The green rectangles represent the regions low-frequency oscillations significantly occur. The black dots indicate that the anomalies are significant at the 90% confidence level.
3.4. Roles of Atmospheric Low-Frequency Oscillations
The above analysis shows that the circulation anomalies in middle and high latitudes, especially anticyclonic anomalies, may not directly influence the weather and climate in NEC but rather through its interaction with other weather systems (such as subtropical high and NECV). Therefore, to further discuss the influence of key atmospheric circulation factors on CADs, based on the key areas that maintain atmospheric low-frequency oscillations at mid–high latitude and significantly correlate with CADs (please refer to Figure 1, Figure 2, Figure 3, Figure 4 and Figure 5), we defined several climate indices (for NEAL, BHOL, UH, and NEAH, respectively) to facilitate the analysis as follows:
where H500 represents the geopotential height at 500 hPa and the overbars denote the area average. All indexes are standardized.
3.4.1. Influence of Anomalous Cyclone
An NECV is an essential weather system triggering precipitation in Northeast Asia. NEAL-type circulation is beneficial to the formation of NECVs (Figure 6a). The northward movement of circulation anomalies may also lead to the northward movement of cold vortexes or troughs. As a result, NEC is controlled by anomalous northwest airflow, along with the stable southward WPSH, leads to a lack of sufficient water vapor there. The distribution of regressed precipitation in the spring shows that the drought in the jointing period (July–August) is more severe (Figure 6b). Meanwhile, the 2 m temperature for the entire growth period is low (Figure 6c). Therefore, the CAD caused by the NEAL circulation is drought in spring combined with low-temperature chilling injury.
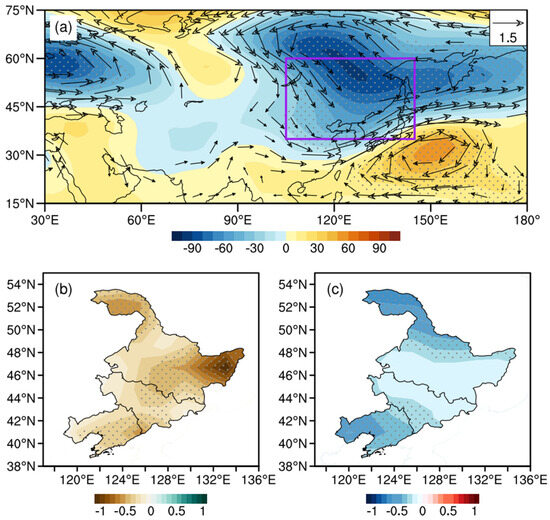
Figure 6.
The distributions of anomalous geopotential height (shading, gpm) and wind field (vector, unit: m/s) at 500 hPa (a), precipitation in July–August (shading, unit: mm) (b), and 2 m temperature (shading, unit: °C) (c) regressed onto the NEAL index. The purple rectangle represents the region low-frequency oscillations significantly occur. The black dots indicate that the anomalies are significant at the 90% confidence level.
The BHOL circulation corresponds to the eastward movement of the cyclonic anomaly center, which is located over the North Pacific Ocean and accompanied by strong blocking near Lake Baikal. The characteristics of the wave train circulation in this area are notably significant. There is a low-pressure center in the Ural Mountains and the WPSH is eastward (Figure 7a), which is inconducive to the development of the East Asian summer monsoon. It is warmer in the northwest area of NEC, with less rainfall (Liaoning), whereas it is cooler in the eastern area of NEC (Figure 7b,c). Compared with the NEAL type, this circulation pattern has a longer duration of decreased precipitation, and the temperature is high in the west and low in the east.
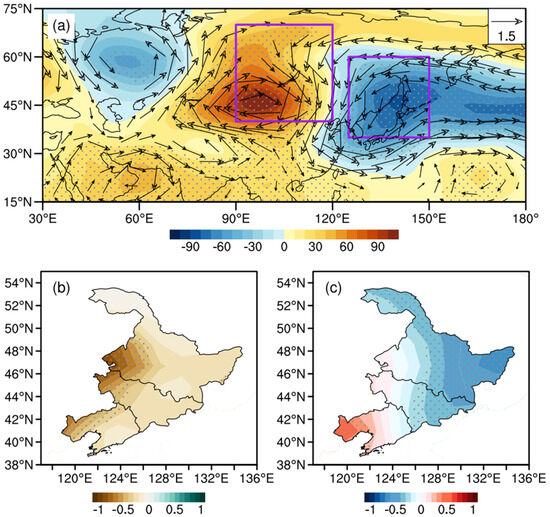
Figure 7.
The distributions of anomalous geopotential height (shading, gpm) and wind field (vector, unit: m/s) at 500 hPa (a), precipitation in May–September (shading, unit: mm) (b), and 2 m temperature (shading, unit: °C) (c) regressed onto the BHOL index. The purple rectangle represents the region low-frequency oscillations significantly occur. The black dots indicate that the anomalies are significant at the 90% confidence level.
3.4.2. Influence of Abnormal Anticyclone
Based on the atmospheric oscillations with superior influence at mid–high latitudes and the circulation patterns analyzed above, the effect of abnormal anticyclones over the Ural Mountains (UH type) and Northeast Asia (NEAH type) on the temperature and precipitation in NEC are studied. Figure 8a shows the circulation in the whole growing season (May–September) regressed on the UH index. The upstream anticyclonic anomaly over the Ural Mountains is strong, corresponding to a continuous quasi-stationary wave pattern. There is a low-pressure anomaly around Lake Baikal and a weak high-pressure anomaly over NEC. Liaoning is regulated by the anomalous easterly airflow. As a result, precipitation is decreased in the southeastern area of NEC (Figure 8b), whereas the temperature is low in the western area and high in the eastern area of NEC (Figure 8c). The low temperature in Liaoning exceeds the 90% confidence level. Therefore, the anticyclonic anomalies over the Ural Mountains are beneficial to the DC in the southern part of NEC.
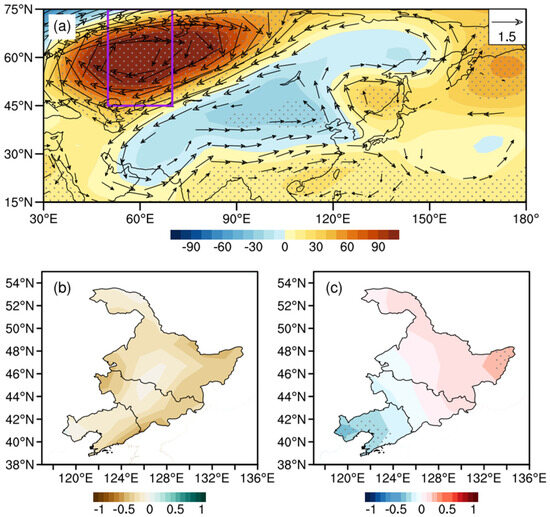
Figure 8.
The distributions of anomalous geopotential height (shading, gpm) and wind field (vector, unit: m/s) at 500 hPa (a), precipitation in May–September (shading, unit: mm) (b), and 2 m temperature (shading, unit: °C) (c) regressed onto the UH index. The purple rectangle represents the region low-frequency oscillations significantly occur. The black dots indicate that the anomalies are significant at the 90% confidence level.
The anomalous anticyclone over the Okhotsk Sea is also an important system that affects the weather and climate in NEC. The variations in its position and intensity are closely related to the seasonal alterations of atmospheric circulation over East Asia. As can be seen from Figure 9a, NEC is mainly controlled by anticyclonic anomalies, which is beneficial to the formation of Okhotsk Sea blocking. The anomalous easterlies at the bottom of high pressure can cause the southward movement of westerly jets, which also facilitates droughts in NEC (Figure 9b). With the development of geopotential height ridge over the Okhotsk Sea, a wide range of positive temperature anomalies have also appeared in NEC (Figure 9c).
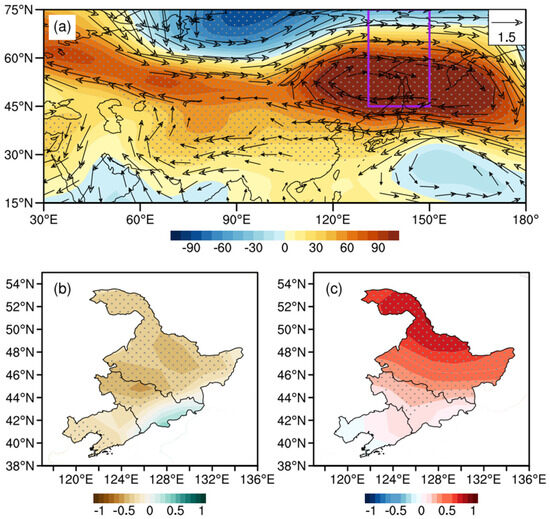
Figure 9.
The distributions of anomalous geopotential height (shading, gpm) and wind field (vector, unit: m/s) at 500 hPa (a), precipitation in May–September (shading, unit: mm) (b), and 2 m temperature (shading, unit: °C) (c) regressed onto the NEAH index. The purple rectangle represents the region low-frequency oscillations significantly occur. The black dots indicate that the anomalies are significant at the 90% confidence.
3.4.3. Analysis of Physical Mechanisms
In the above discussion, we address the linear relationship between CADs and the anomalous atmospheric circulation characterized by westerly wave train patterns. The question arises as to how these atmospheric circulation anomalies affect CADs. Figure 10 presents the geopotential height and temperature profiles for different circulation patterns. For cyclonic oscillation, there are cold centers over the cyclonic anomalies (Figure 10a,b,e,f) and the height trough is followed by a temperature trough. The isotherm around 35° N is dense, with a steep temperature gradient (Figure 10a,b). The cold core structure is one of the main characteristics of the NECV. The vertical profiles of the temperature and geopotential height field show that the circulation pattern is beneficial to the occurrence of the NECV. The isotherm around 200 hPa is the densest, indicating the development of the cold vortex is more obvious in the upper layer. The zonal profile shows that the low value is centered near 300 hPa, and the whole layer is almost controlled by negative anomalies, indicating that the system of the NEAL type is deep (Figure 10a,e). However, the periphery of the negative anomaly center (40°–50° N, 120°–130° E) is controlled by sinking airflow. The meridional range of the colonic anomalies corresponding to the BHOL type is large, inclining from west to east. The downward flow on the west side is enhanced (Figure 10b). On the other hand, the vertical profiles corresponding to high-pressure anomalies are quite different. There are negative anomalies to the east and north of 50° N for the UH type, and there is weak subsidence movement over NEC with a cold center at the lower level (Figure 10c,g), leading to DC events. However, NEC in the NEAH type is controlled by an anomalous high-pressure system. There are robust positive temperature anomalies and convergence near the surface, which is beneficial to the occurrence of drought and high-temperature events (Figure 10d,h).
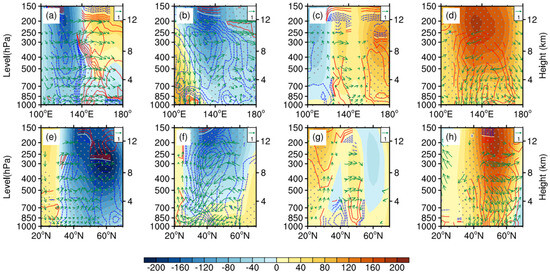
Figure 10.
Profile of geopotential height (shading, gpm), temperature (contour, solid red lines for positive and dashed blue lines for negative, unit: °C), and vertical velocity (vector, unit: Pa/h) along 110°–140° E (a–d) and 30°–50° N (e–h) at 500 hpa regressed onto the indexes of NEAL (a,e), BHOL (b,f), UH (c,g), and NEAH (d,h).
Anomalous water vapor transport can better demonstrate the influence of different circulation patterns on precipitation in Liaoning Province. The results show that, under the influence of NEAL-type circulation, water vapor enters Shandong Peninsula from the east but does not reach NEC despite there being anomalous anticyclone and water vapor divergence over Liaoning Province (Figure 11a). The BHOL circulation corresponds to NEC being in front of the anomalous trough and at the back of the ridge, and the robust anticyclonic anomalies in Inner Mongolia lead to the strong divergence of water vapor over NEC, whereas strong cyclonic anomalies exist near the Okhotsk Sea, which leads to the water vapor convergence and increased precipitation there (Figure 11b). Therefore, these two circulation patterns are not conducive to precipitation in Liaoning. The composite water vapor transport flux anomaly for two kinds of abnormal anticyclone years shows that there is obvious water vapor divergence in NEC (Figure 11c,d). In addition, NEC is controlled by the northwest airflow in front of the ridge, which is not conducive to the transport of warm and humid air from the south. The water vapor mainly converges on the Korean peninsula, leading to an increase in precipitation there.
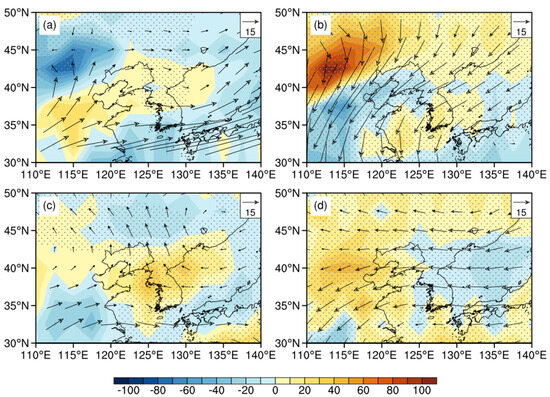
Figure 11.
The vertically integrated water vapor flux (vector, unit: kg·m−1·s−1) and its divergence (shading, unit: 10−4 kg·m−2·s−1) regressed onto the indexes of NEAL (a), BHOL (b), UH (c), and NEAH (d).
Using the maize yield and several meteorological datasets, we show that co-occurring hot and dry events have consistent negative effects on spring maize yield in Liaoning Province. There have been growing discussions on the relationship between large-scale meteorological factors and crop yield [40,41]. For example, Ribeiro et al. (2020) [5] found that the likelihood of crop loss increases with the severity of the compound dry and hot conditions based on the copula method. Shuai et al. (2015) [42] analyzed the maize yield variability and ENSO. To further overcome drawbacks related to assessing climate indicators of CADs, our study takes into account the complicated interaction of climate factors by analyzing the circulation features and provides reliable indicators of CADs.
We also acknowledge some limitations of the CAD identification method in our study. Although the results all passed the significance test, the sample size was small. Therefore, numerical experiments are needed to verify this relationship in future studies. When selecting the composite year, one of the indicators is that the meteorological yield reduction rate ( is higher than 5%. Furthermore, the multiple regression of two circulation indexes corresponding to two CADs on from 1961 to 2019 were calculated. We found significant relationships between NEAL, UH, and maize yield (r = 0.23, p < 0.05). However, the relationship between MD and yield is not significant. This may be attributed to the fact that crop yield is a combined outcome, manual intervention on drought can be carried out, and the factors influencing yield are complex. To verify the reliability of the results, we present the results of circulation patterns, precipitation, and accumulated temperature for the growing season for the years 1972 and 2000. The was 23% and 35.7% and the circulation patterns were NEAL and NEAH, respectively. The results show that the circulation patterns directly effect precipitation and temperature, which leads to yield loss. In addition, this study presents the effect of large-scale climate factors on CADs on an interannual timescale. Although under the background of climate warming, the main factors affecting the production of spring maize have shifted from heat limited to water limited [30,43], and there is a significant increase in the frequency and spatial extent [44,45]. Therefore, the interdecadal shift of CADs needs further research.
4. Conclusions
In this study, the variability characteristics of CADs on maize in Liaoning Province are analyzed and the impacts of atmospheric circulation are investigated. The study extracts “simple” large-scale circulation factors that have significant impact on “complex” CADs. The results show that there are two high-impact CADs, DC (mainly occurring before 1995) and MD (mainly occurring after 1995), on spring maize in Liaoning. We found that the two main CADs contribute to four atmospheric circulation patterns in the growing season (May–September). For the DC, the NEAL pattern manifested as anomalous cyclones that are mainly active in spring, with spring–summer low temperature and decreased summer precipitation in NEC. On the other hand, for the UH pattern, the upstream high-pressure system triggers an anomalous trough over East Asia, leading to modest precipitation and decreased temperature over Liaoning. For the MD, the low-pressure anomalies in the BHOL pattern are beneficial to the maintenance of anticyclonic anomalies over Lake Baikal. The seasonal variations in weather systems are not obvious. The NEAH pattern corresponds to persistent anomalous high pressure over NEC. Both circulation patterns show that the anomalous height ridge over Liaoning is the main influencing system. Furthermore, the vertical profile and the abnormal results of water vapor transport verify the influence of atmospheric circulations on CADs. This research can contribute to the design of a CAD warning system to minimize maize yield losses related to synergistic climate hazards.
Author Contributions
S.Z. (Siwen Zhao): conceptualization, methodology, funding acquisition; writing—original draft. X.L.: data curation, formal analysis, investigation, writing—original draft. R.J. and S.W.: writing—review and editing. S.Z. (Siyu Zhao): supervision, writing—review and editing. All authors have read and agreed to the published version of the manuscript.
Funding
This research was jointly funded by the National Natural Science Foundation of China (41975149), Open Foundation Project of the Institute of Atmospheric Environment, China Meteorological Administration (2021SYIAEMS2, 2022SYIAEKFZD04), People’s Livelihood Science and Technology Plan Project of Liaoning Province (2021JH2/10200024) and Application of Basic Research Plan of Liaoning Province (2023JH2/101300090).
Institutional Review Board Statement
Not applicable.
Informed Consent Statement
Not applicable.
Data Availability Statement
All datasets used in this study are publicly available as in Section 2.
Conflicts of Interest
The authors declare no conflict of interest.
References
- Barros, V.; Stocker, T.F. Managing the Risks of Extreme Events and Disasters to Advance Climate Change Adaptation: Special Report of the Intergovernmental Panel on Climate Change. J. Clin. Endocr. Metab. 2012, 18, 586–599. [Google Scholar]
- IPCC. Climate Change 2021: The Physical Science Basis; Cambridge University Press: Cambridge, UK, 2021; pp. 1–3939. [Google Scholar]
- O’Neill, B.C.; Oppenheimer, M.; Warren, R.; Hallegatte, S.; Kopp, R.E.; Pörtner, H.O.; Scholes, R.; Birkmann, J.; Foden, W.; Licker, R.; et al. IPCC reasons for concern regarding climate change risks. Nat. Clim. Chang. 2017, 7, 28–37. [Google Scholar] [CrossRef]
- Hamed, R.; Van Loon, A.F.; Aerts, J.; Coumou, D. Impacts of compound hot–dry extremes on US soybean yields. Earth Syst. Dynam. 2021, 12, 1371–1391. [Google Scholar] [CrossRef]
- Ribeiro, A.F.S.; Russo, A.; Gouveia, C.M.; Páscoa, P.; Zscheischler, J. Risk of crop failure due to compound dry and hot extremes estimated with nested copulas. Biogeosciences 2020, 17, 4815–4830. [Google Scholar] [CrossRef]
- Li, E.; Zhao, J.; Zhang, W.; Yang, X. Spatial-temporal patterns of high-temperature and drought during the maize growing season under current and future climate changes in northeast China. J. Sci. Food Agr. 2023, 103, 5709–5716. [Google Scholar] [CrossRef]
- Lesk, C.; Coffel, E.; Winter, J.; Ray, D.; Zscheischler, J.; Seneviratne, S.I.; Horton, R. Stronger temperature–moisture couplings exacerbate the impact of climate warming on global crop yields. Nat. Food 2021, 2, 683–691. [Google Scholar] [CrossRef] [PubMed]
- Li, L.; Li, X.; Zheng, X.; Li, X.; Jiang, T.; Ju, H.; Wan, X. The effects of declining soil moisture levels on suitable maize cultivation areas in Northeast China. J. Hydrol. 2022, 608, 127636. [Google Scholar] [CrossRef]
- Zhou, Z.; Shi, H.; Fu, Q.; Li, T.; Gan, T.Y.; Liu, S. Assessing spatiotemporal characteristics of drought and its effects on climate-induced yield of maize in Northeast China. J. Hydrol. 2020, 588, 125097. [Google Scholar] [CrossRef]
- Lu, Y.; Hu, H.; Li, C.; Tian, F. Increasing compound events of extreme hot and dry days during growing seasons of wheat and maize in China. Sci. Rep. 2018, 8, 16700. [Google Scholar] [CrossRef]
- Wang, Q.; Li, S.l. Different Summer Rainfall Anomaly Patterns in Northeast China Associated with Two Kinds of El Nino Events. J. Trop. Meteorol. 2020, 26, 223–230. [Google Scholar]
- Xu, K.; Lu, R.; Mao, J.; Chen, R. Circulation anomalies in the mid–high latitudes responsible for the extremely hot summer of 2018 over northeast Asia. Atmos. Oceanic Sci. Lett. 2019, 12, 231–237. [Google Scholar] [CrossRef]
- Xu, K.; Lu, R.; Kim, B.J.; Park, J.K.; Kim, E.B. Large-scale circulation anomalies associated with extreme heats in Korea and southern–central Japan. J. Clim. 2019, 32, 8477. [Google Scholar] [CrossRef]
- Li, J.; Zheng, F.; Sun, C.; Feng, J.; Wang, J. Pathways of Influence of the Northern Hemisphere Mid-high Latitudes on East Asian Climate: A Review. Adv. Atmos. Sci. 2019, 36, 902–921. [Google Scholar] [CrossRef]
- Xie, Z.; Bueh, C. Different Types of Cold Vortex Circulations over Northeast China and Their Weather Impacts. Mon. Weather Rev. 2015, 143, 845–863. [Google Scholar] [CrossRef]
- Hao, Y.; Hao, Z.; Feng, S.; Wu, X.; Zhang, X.; Hao, F. Categorical prediction of compound dry and hot events in northeast China based on large-scale climate signals. J. Hydrol. 2021, 602, 126729. [Google Scholar] [CrossRef]
- Liu, G.; Qu, M.; Feng, G.; Chu, Q.; Cao, J.; Yang, J.; Cao, L.; Feng, Y. Application study of monthly precipitation forecast in Northeast China based on the cold vortex persistence activity index. Theor. Appl. Climatol. 2019, 135, 1079–1090. [Google Scholar]
- Shi, C.; Lian, Y.; Yang, X.; Fu, D.; Shen, B.; Li, S.; Liu, G. The relationship between winter cut-off cold vortexes in Northeast Asia and northern hemisphere as well as their connections with extreme low temperature events in China. Acta. Meteorol. Sin. 2020, 78, 778–795. [Google Scholar]
- Hu, K.; Lu, R.; Wang, D. Cold Vortex over Northeast China and Its Climate Effect. Chin. J. Atmos. Sci. 2011, 35, 179–191. [Google Scholar]
- Shen, B.; Lin, Z.; Lu, R.; Lian, Y. Circulation anomalies associated with interannual variation of early- and late-summer precipitation in Northeast China. Sci. China-Earth Sci. 2011, 54, 1095–1104. (In Chinese) [Google Scholar] [CrossRef]
- Ning, G.; Luo, M.; Zhang, W.; Liu, Z.; Wang, S.; Gao, T. Rising risks of compound extreme heat-precipitation events in China. Int. J. Climatol. 2022, 42, 5785–5795. [Google Scholar] [CrossRef]
- Li, H.; He, S.; Gao, Y.; Chen, H.; Wang, H. North Atlantic Modulation of Interdecadal Variations in Hot Drought Events Over Northeastern China. J. Clim. 2020, 33, 4315–4332. [Google Scholar] [CrossRef]
- Yu, W.Y.; Ji, R.P.; Li, Z.Q.; Liu, D.M.; Feng, R.; Wu, J.W.; Zhang, Y.S. Identification and characteristics of multiple agro-meteorological disaster of maize in Liaoning Province, China. J. Appl. Ecol. 2021, 32, 241–251. (In Chinese) [Google Scholar]
- Ji, R.P.; Yu, W.Y.; Feng, R.; Wu, J.W.; Zhang, Y.S. Identification and characteristics of combined agro-meteorological disasters caused by low temperature in a rice growing region in Liaoning Province, China. Sci. Rep. 2021, 11, 9968. [Google Scholar] [CrossRef]
- Jiang, L.; Li, X.; Zhu, H.; Gao, M.; Wang, Q.; Yan, P.; Gong, L.; Zhai, M.; Ji, Y.; Wang, P. Characteristics of combination of cold damage and drought during seedling period and its effects on maize yield in Heilongjiang Province. Agric. Res. Arid. Areas 2020, 38, 255–265. [Google Scholar]
- Hussain, H.A.; Hussain, S.; Khaliq, A.; Ashraf, U.; Anjum, S.A.; Men, S.; Wang, L. Chilling and Drought Stresses in Crop Plants: Implications, Cross Talk, and Potential Management Opportunities. Front. Plant Sci. 2018, 9, 393. [Google Scholar] [CrossRef] [PubMed]
- Cai, J.; Wang, C.; Zhang, J. An assessment of the drought disaster and chilling injury hazard for maize in the various growth stages in northeast China. Acta Meteorol. Sin. 2013, 71, 976–986. [Google Scholar]
- Zhenlin, C.; Jianping, Z.; Chunyi, W.; Jiangping, Z. Application of WOFOST Model in Simulation of integrated Impacts of Low Temperature and Drought on Maize Yield. Chin. J. Agrometeorol. 2007, 28, 440–442+445. (In Chinese) [Google Scholar]
- Guo, E.; Yang, X.; Li, T.; Zhang, T.; Wilson, L.T.; Wang, X.; Zheng, D.; Yang, Y. Does ENSO strongly affect rice yield and water application in Northeast China? Agr. Water. Manag. 2021, 245, 106605. [Google Scholar] [CrossRef]
- Zhang, Y.; Hao, Z.; Feng, S.; Zhang, X.; Hao, F. Changes and driving factors of compound agricultural droughts and hot events in eastern China. Agr. Water. Manag. 2022, 263, 107485. [Google Scholar] [CrossRef]
- Lansu, E.M.; Heerwaarden, C.C.; Stegehuis, A.; Teuling, A. Atmospheric Aridity and Apparent Soil Moisture Drought in European Forest During Heat Waves. Geophys. Res. Lett. 2020, 47, e2020GL087091. [Google Scholar] [CrossRef]
- Pu, L.; Zhang, S.; Yang, J.; Chang, L.; Bai, S. Spatio-Temporal Dynamics of Maize Potential Yield and Yield Gaps in Northeast China from 1990 to 2015. Int. J. Envirn. Res. Public Health 2019, 16, 1211. [Google Scholar] [CrossRef]
- Oh, S.B.; Byun, H.R.; Kim, D.W. Spatiotemporal characteristics of regional drought occurrence in East Asia. Theor. Appl. Climatol. 2014, 117, 89–101. [Google Scholar] [CrossRef]
- Kistler, R.; Kalnay, E.; Collins, W.; Saha, S.; White, G.; Woollen, J.; Chelliah, M.; Ebisuzaki, W.; Kanamitsu, M.; Kousky, V.; et al. The NCEP-NCAR 50-Year Reanalysis: Monthly Means CD-ROM and Documentation. Bull. Am. Meteorol. Soc. 2001, 82, 247–268. [Google Scholar] [CrossRef]
- Huang, R.H.; Li, W.J. Influence of heat source anomaly over the western tropical Pacific on the subtropical high over East Asia and its physical mechanism. Chin. J. Atmos. Sci. 1988, 12, 107–116. (In Chinese) [Google Scholar]
- Liu, G.; Shen, B.Z.; Lian, Y.; Li, S.F.; Cao, L.; Liu, P. The sorts of 500 hPa blocking high in Asia and its relations to cold vortex and aestival low temperature in Northeast of China. Sci. Geogr. Sin. 2012, 32, 1269–1274. (In Chinese) [Google Scholar]
- Sun, L.; Zhen, X.Y.; Wang, Q. The climatological characteristics of northeast cold vortex in China. J. Appl. Meteorol. Sci. 1994, 5, 297–303. (In Chinese) [Google Scholar]
- Lian, Y.; Buhe, C.L.; Xie, Z.W.; Shen, B.Z.; Li, S.F. The Anomalous Cold Vortex Activity in Northeast China during the Early Summer and the Low-frequency Variability of the Northern Hemispheric Atmosphere Circulation. Chin. J. Atmos. Sci. 2010, 34, 429–439. (In Chinese) [Google Scholar]
- Zeng, D.; Yuan, X.; Roundy, J.K. Effect of Teleconnected Land-Atmosphere Coupling on Northeast China Persistent Drought in Spring-Summer of 2017. J. Clim. 2019, 32, 7403–7420. [Google Scholar] [CrossRef]
- Lesk, C.; Rowhani, P.; Ramankutty, N. Influence of extreme weather disasters on global crop production. Nature 2016, 529, 84–87. [Google Scholar] [CrossRef]
- Hao, Z.; Hao, F.; Singh, V.P.; Zhang, X. Quantifying the relationship between compound dry and hot events and El Niño–southern Oscillation (ENSO) at the global scale. J. Hydrol. 2018, 567, 332–338. [Google Scholar] [CrossRef]
- Shuai, J.; Zhang, Z.; Tao, F.; Shi, P. How ENSO affects maize yields in China: Understanding the impact mechanisms using aprocess-based crop model. Int. J. Climatol. 2016, 36, 424–438. [Google Scholar] [CrossRef]
- Li, E.; Zhao, J.; Pullens, J.W.M.; Yang, X. The compound effects of drought and high temperature stresses will be the main constraints on maize yield in Northeast China. Sci. Total Environ. 2022, 812, 152461. [Google Scholar] [CrossRef] [PubMed]
- Yang, Y.; Maraun, D.; Osso, A.; Tang, J. Increased spatial extent and likelihood of compound long-duration dry and hot events in China, 1961–2014. Nat. Hazards Earth Syst. Sci. 2023, 23, 693–709. [Google Scholar] [CrossRef]
- Feng, Y.; Sun, F.; Liu, W.; Chen, J.; Wang, H.; Guo, Q.; Wang, Y.; Zhang, Q.; Sang, Y.F. Changes in compound hot and dry day and population exposure across China under climate change. Int. J. Climatol. 2022, 42, 2935–2949. [Google Scholar] [CrossRef]
Disclaimer/Publisher’s Note: The statements, opinions and data contained in all publications are solely those of the individual author(s) and contributor(s) and not of MDPI and/or the editor(s). MDPI and/or the editor(s) disclaim responsibility for any injury to people or property resulting from any ideas, methods, instructions or products referred to in the content. |
© 2023 by the authors. Licensee MDPI, Basel, Switzerland. This article is an open access article distributed under the terms and conditions of the Creative Commons Attribution (CC BY) license (https://creativecommons.org/licenses/by/4.0/).