Abstract
Microclimatic monitoring (air T, air pressure, CO2, ventilation, humidity, methane, and radon) in selected show caves in Slovenia has been a continuous process for more than 10 years, a process that aims to supervise the use of the caves for tourism in the sense of sustainable environmental management. After the cataclysmic eruption of the Hunga Tonga–Hunga Ha’apai (HTHH) volcano on 15 January 2022, global propagation of ionospheric disturbances was reported worldwide as barometric pressure changes and seismic noise events. Weather stations in Slovenia reported 2–4 hPa changes in atmospheric pressure 16 h after the eruption at 20:30 CET (19:30 UTC). Changes in atmospheric pressure were also detected at 15 air monitoring sites in 3 different caves (20–120 m below the surface), at 8 water monitoring sites in 4 different caves (1–10 m below the water surface), and on the surface (4 air and 2 water monitoring sites), where we identified a small but significant increase in atmospheric pressure of <1 hPa, with the highest signal at 21:00 CET (20:00 UTC). At some cave monitoring locations, air T fell during this global event induced by a far-field volcanic eruption. Cave CO2, methane, and radon measurements did not show significant changes related to the eruption. This is the first evidence of atmospheric pressure changes due to the HTHH volcano eruption in karst caves and waters.
1. Introduction
Microclimatic monitoring has been conducted in some of the most visited show caves in Slovenia for more than 10 years [1,2,3,4,5] with the aim of monitoring tourist use of the caves and implementing sustainable environmental management [5,6,7,8].
On 15 January 2022, a large submarine phreatoplinian eruption at HTHH began at ~04:02 ± 1 UTC. By 04:30 UTC, the eruption plume had risen to a peak height of ~58 km [9]. The eruption duration was estimated to be ~12 h.
The cataclysmic eruption of HTHH produced excitations of the Earth’s interior and entire atmosphere, as well as generating unusually fast tsunami waves and unusually long-lived meteotsunami [10].
The Tonga island chain (Kingdom of Tonga) lies at the top of the Tonga–Kermadec subduction system (subduction of the Pacific Plate beneath the Indo-Australian Plate), which has mature intraoceanic island arc volcanism [10]. The Tonga Ridge, with ~20 km crustal thickness, is one or more volumetrically significant shallow magma reservoirs [11]. The magma source for HTHH’s magmatic system is an open-system shallow magma reservoir that is compositionally and thermally buffered by the continuous or near-continuous recharge of homogeneous magmas [11].
The HTHH eruption produced volcanic lightning (100–200 km from the volcano), large infrasound signals that were observed globally, coherent seismic signals, tsunami waves [10], and gravity waves [12]. The volcano created a sustained source of convectively generated waves for nearly 15 h after the initial eruption [12]. HTHH produced globally detected infrasound (0.01–20 Hz) that had a long-range (~10,000 km) audible sound and ionospheric perturbations. Seismometers worldwide recorded pure seismic and air-to-ground coupled waves [13]. A global-scale wave response of this magnitude from a single source is exceptional [12].
Atmospheric disturbances of large amplitude and long wavelength triggered by the eruption of the HTHH volcano lasted much longer than the eruptions of large earthquakes and produced a kind of shock wave resulting from the interaction between compressed air and the surrounding (rippled) sea surface [10].
When it was announced in the public media that the atmospheric disturbance of the Hunga Tonga–Hunga Ha’apai (HTHH) volcanic eruption had advanced around the world and had reached Europe at around 21:00 CET (20:00 UTC), about 16 h after the explosion [14], we checked our pressure data loggers positioned in karst caves and karst waters. It showed that this global event was also detected in underground karst caves and karst waters.
The HTHH volcano erupted about 17,000 km from Slovenia, which means that the ionospheric disturbance travelled at a speed of almost 1100 km/h. Some weather stations in Slovenia [15] detected the event as a rapid change in atmospheric pressure by 2 to 4 hPa between 21:00 CET (20:00 UTC) and 23:00 CET (22:00 UTC), with the highest change at 21:00 CET [14]. The second signal reached Slovenian weather stations (ARSO) at 02:00 CET on 16 January 2022 [16]. The Italian weather station at Bagnoli della Rosandra (60 m a.s.l.) on the Gulf of Trieste recorded 1024.2 hPa at 20:30 CET (15 January 2022), 1025.8 hPa at 20:50 CET, and 1023.1 hPa at 21:20 CET [16].
ALICE DCS sensors at CERN in Switzerland detected anomalous oscillations of atmospheric pressure at 20:30 CET (19:30 UTC) with an amplitude of 1.3 hPa, followed by several secondary waves. A second oscillation was observed at 01:00 UTC on 16 January 2022 and a third at 07:45 UTC on 17 January 2022. The second oscillation is consistent with the hypothesis of the same wave coming from the volcano in the opposite direction [17].
Of the six pulses (P1–P6) detected at the reading (UK) pressure station from 15 to 19 January 2022, the first occurrence of the HTHH pressure wave was at 19:20 UTC on 15 January 2022 (P1), after crossing the North Pole and propagating southward, with a second occurrence at 02:37 UTC on 16 January 2022 (P2) via a South Pole route and propagating northward [18]. Both caused transient pressure anomalies of 0.5–1 hPa that were initially positive and then negative [18]. The third pulse (P3) was detected at the reading pressure station at 07:05 UTC on 17 January 2022, the fourth (P4) at 13:55 UTC on the same day, the fifth (P5) at 19:23 UTC on 18 January 2022, and the sixth (P6) at 01:18 UTC on 19 January 2022 [18].
The eruption of the HTHH volcano produced a wide range of atmospheric waves that were observed worldwide. It produced an atmospheric pressure anomaly called a Lamb wave. Lamb waves are acoustic gravity waves that compress the atmosphere but also displace it vertically [19]. Lamb waves (≤0.01 Hz) were observed propagating for four minor-arc and three major-arc (antipodal) passages around the Earth over six days [13]. Measurements of Lamb wave peak-to-peak pressure amplitudes as a function of distance indicate that the atmospheric pressure pulse generated by HTHH is comparable to the 1883 Krakatoa eruption [13]. The Lamb waves circled the globe in ~35.5 h and induced prominent seismic waves via air–ground coupling and meteotsunami [10].
HTHH generated strong gravity wave activity in the stratosphere with temperature perturbations of ±4 K, four times the typical background activity [13]. Deep-sea tsunamimeters recorded a clear leading 5 hPa pressure pulse, more than double that of the air pressure pulse [13].
Upper atmospheric perturbances beyond 10,000 km have never been able to be examined before this eruption [20]. Travelling ionospheric disturbances (TIDs) were reported [20].
The HTHH eruption generated an intense and unusual stratospheric plume with a huge amount of injected water vapour that remained well above normal 6 months after the eruption. The initial SO2 was fully converted into sulphates in less than 2 weeks under the influence of water vapour [21].
The aim of our study is to present and analyse perturbations of the microclimatic parameters (especially air pressure) of cave air and karst waters during the HTHH eruption and to show that cave environments are very suitable for geophysical observations, particularly for those like the eruption of HTHH which have multiple global geophysical impacts and until now have not been reported from cave environments yet.
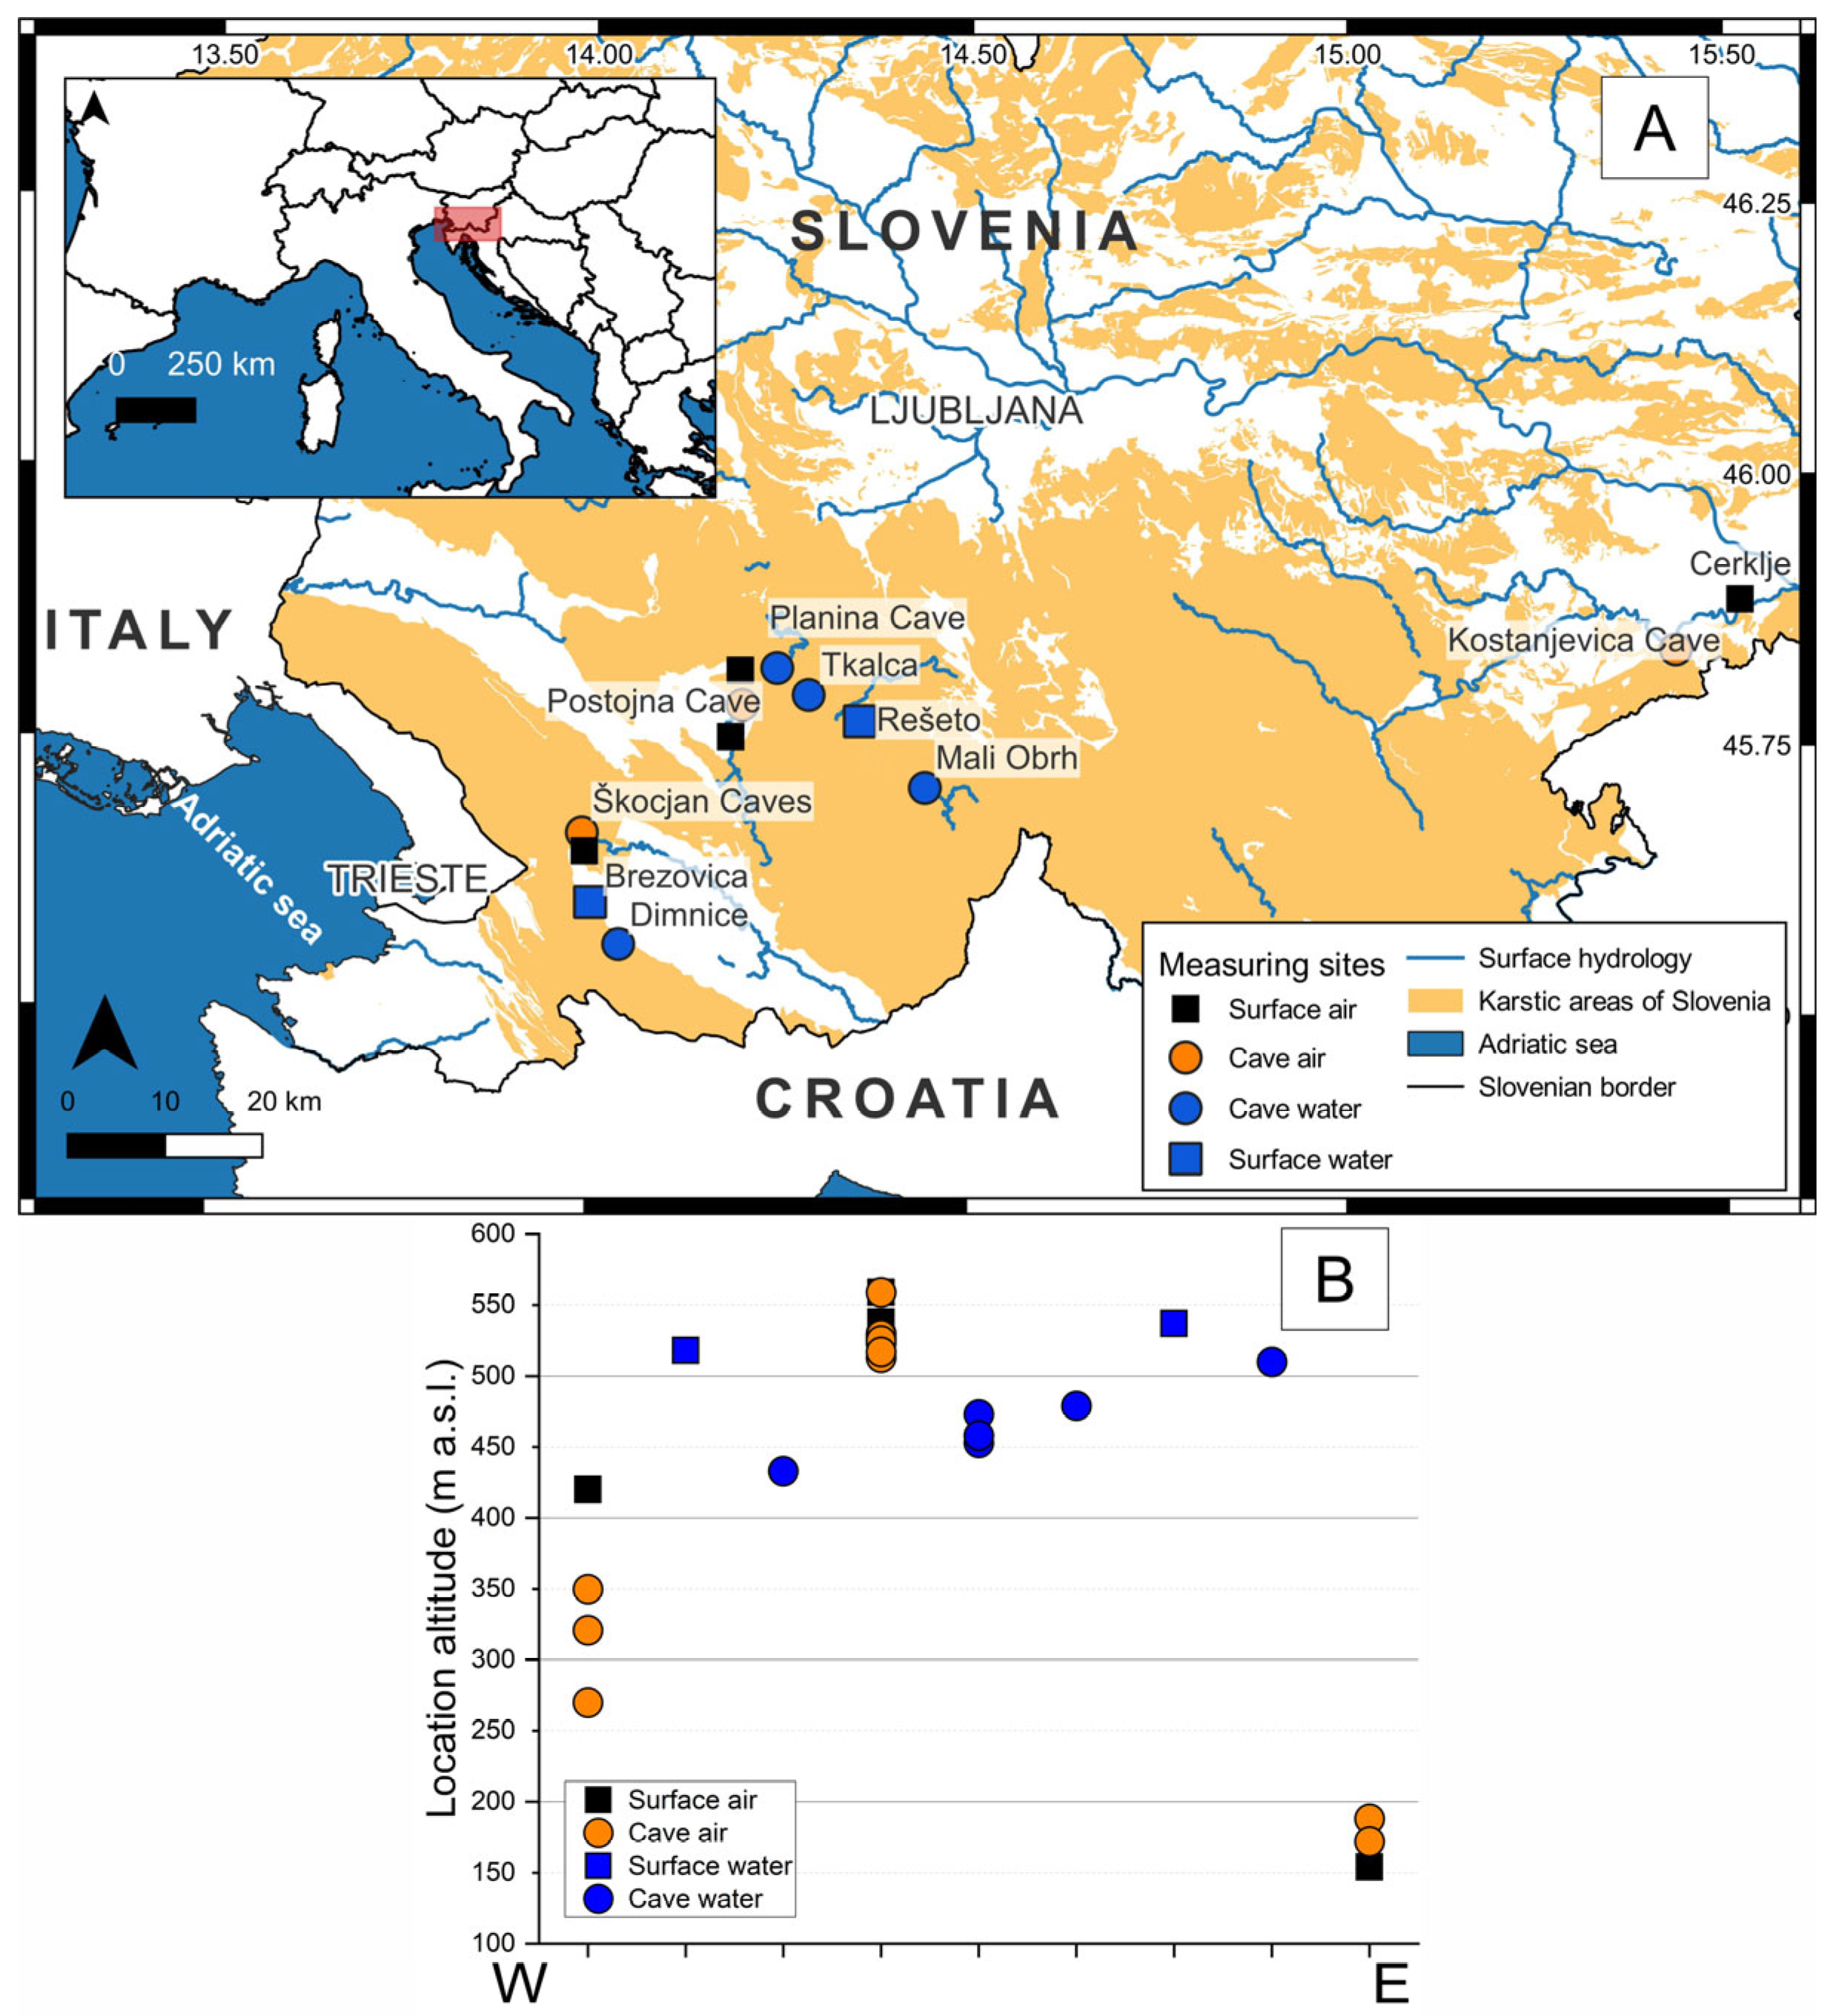
2. Study Locations and Methods
Slovenia is the country of the Classical Karst, with more than 14,800 registered caves [22] and extensive karst area [23]. In some show caves, microclimatic monitoring has been taking place for more than 10 years [5]. Seven caves (Postojna Cave, Škocjan Caves, Kostanjevica Cave, Dimnice, Mali Obrh, Planina Cave, and Tkalca) were selected for this study. Together, they comprise 21 cave monitoring sites (air and water) and six surface monitoring sites (air and water) (Figure 1, Table 1). Atmospheric pressure and air temperature in the caves were measured at hourly intervals using Baro-Diver® data loggers (Van Essen Instruments, Delft, The Netherlands). The pressure sensor measures the equivalent hydrostatic pressure of the water above the sensor membrane to calculate the total water depth. The pressure range is 1.5 m and the accuracy is ±0.5 cm H2O. The accuracy of T measurements is ±0.1° with a resolution of ±0.01°.
Figure 1.
(A) Locations of monitoring sites in caves and on the surface; karstic areas of Slovenia [23] (B) simplified relationship between altitude (m a.s.l.) and relative spatial position (horizontal axis; from W to E; not in scale) of the monitoring sites location.
Table 1.
Atmospheric pressure monitoring sites.
In addition to the data logger at the national weather station in Postojna [15], a Baro-Diver® data logger was placed on the surface above Postojna Cave in 2009 by one of the co-authors to measure hourly air pressure and air T data. Outside Škocjan Caves and Kostanjevica Cave, Slovenian national meteorological data sets for air pressure (Škocjan station and Cerklje na Dolenjskem station) were used for our study [15].
Onset HOBO U20 instruments are used to measure total pressure in water (hydrostatic pressure and air pressure together), at 30 min intervals. They are installed in 4 water-active caves and 2 surface streams (Figure 1, Table 1). Their pressure range varies (four different types of pressure loggers with different maximum operating pressure: 0–145, 0–207, 0–400 or 0–850 kPa). Pressure accuracy is ±0.3% of the instrument’s range and resolution is 0.014–0.085 kPa.
3. Results and Discussion
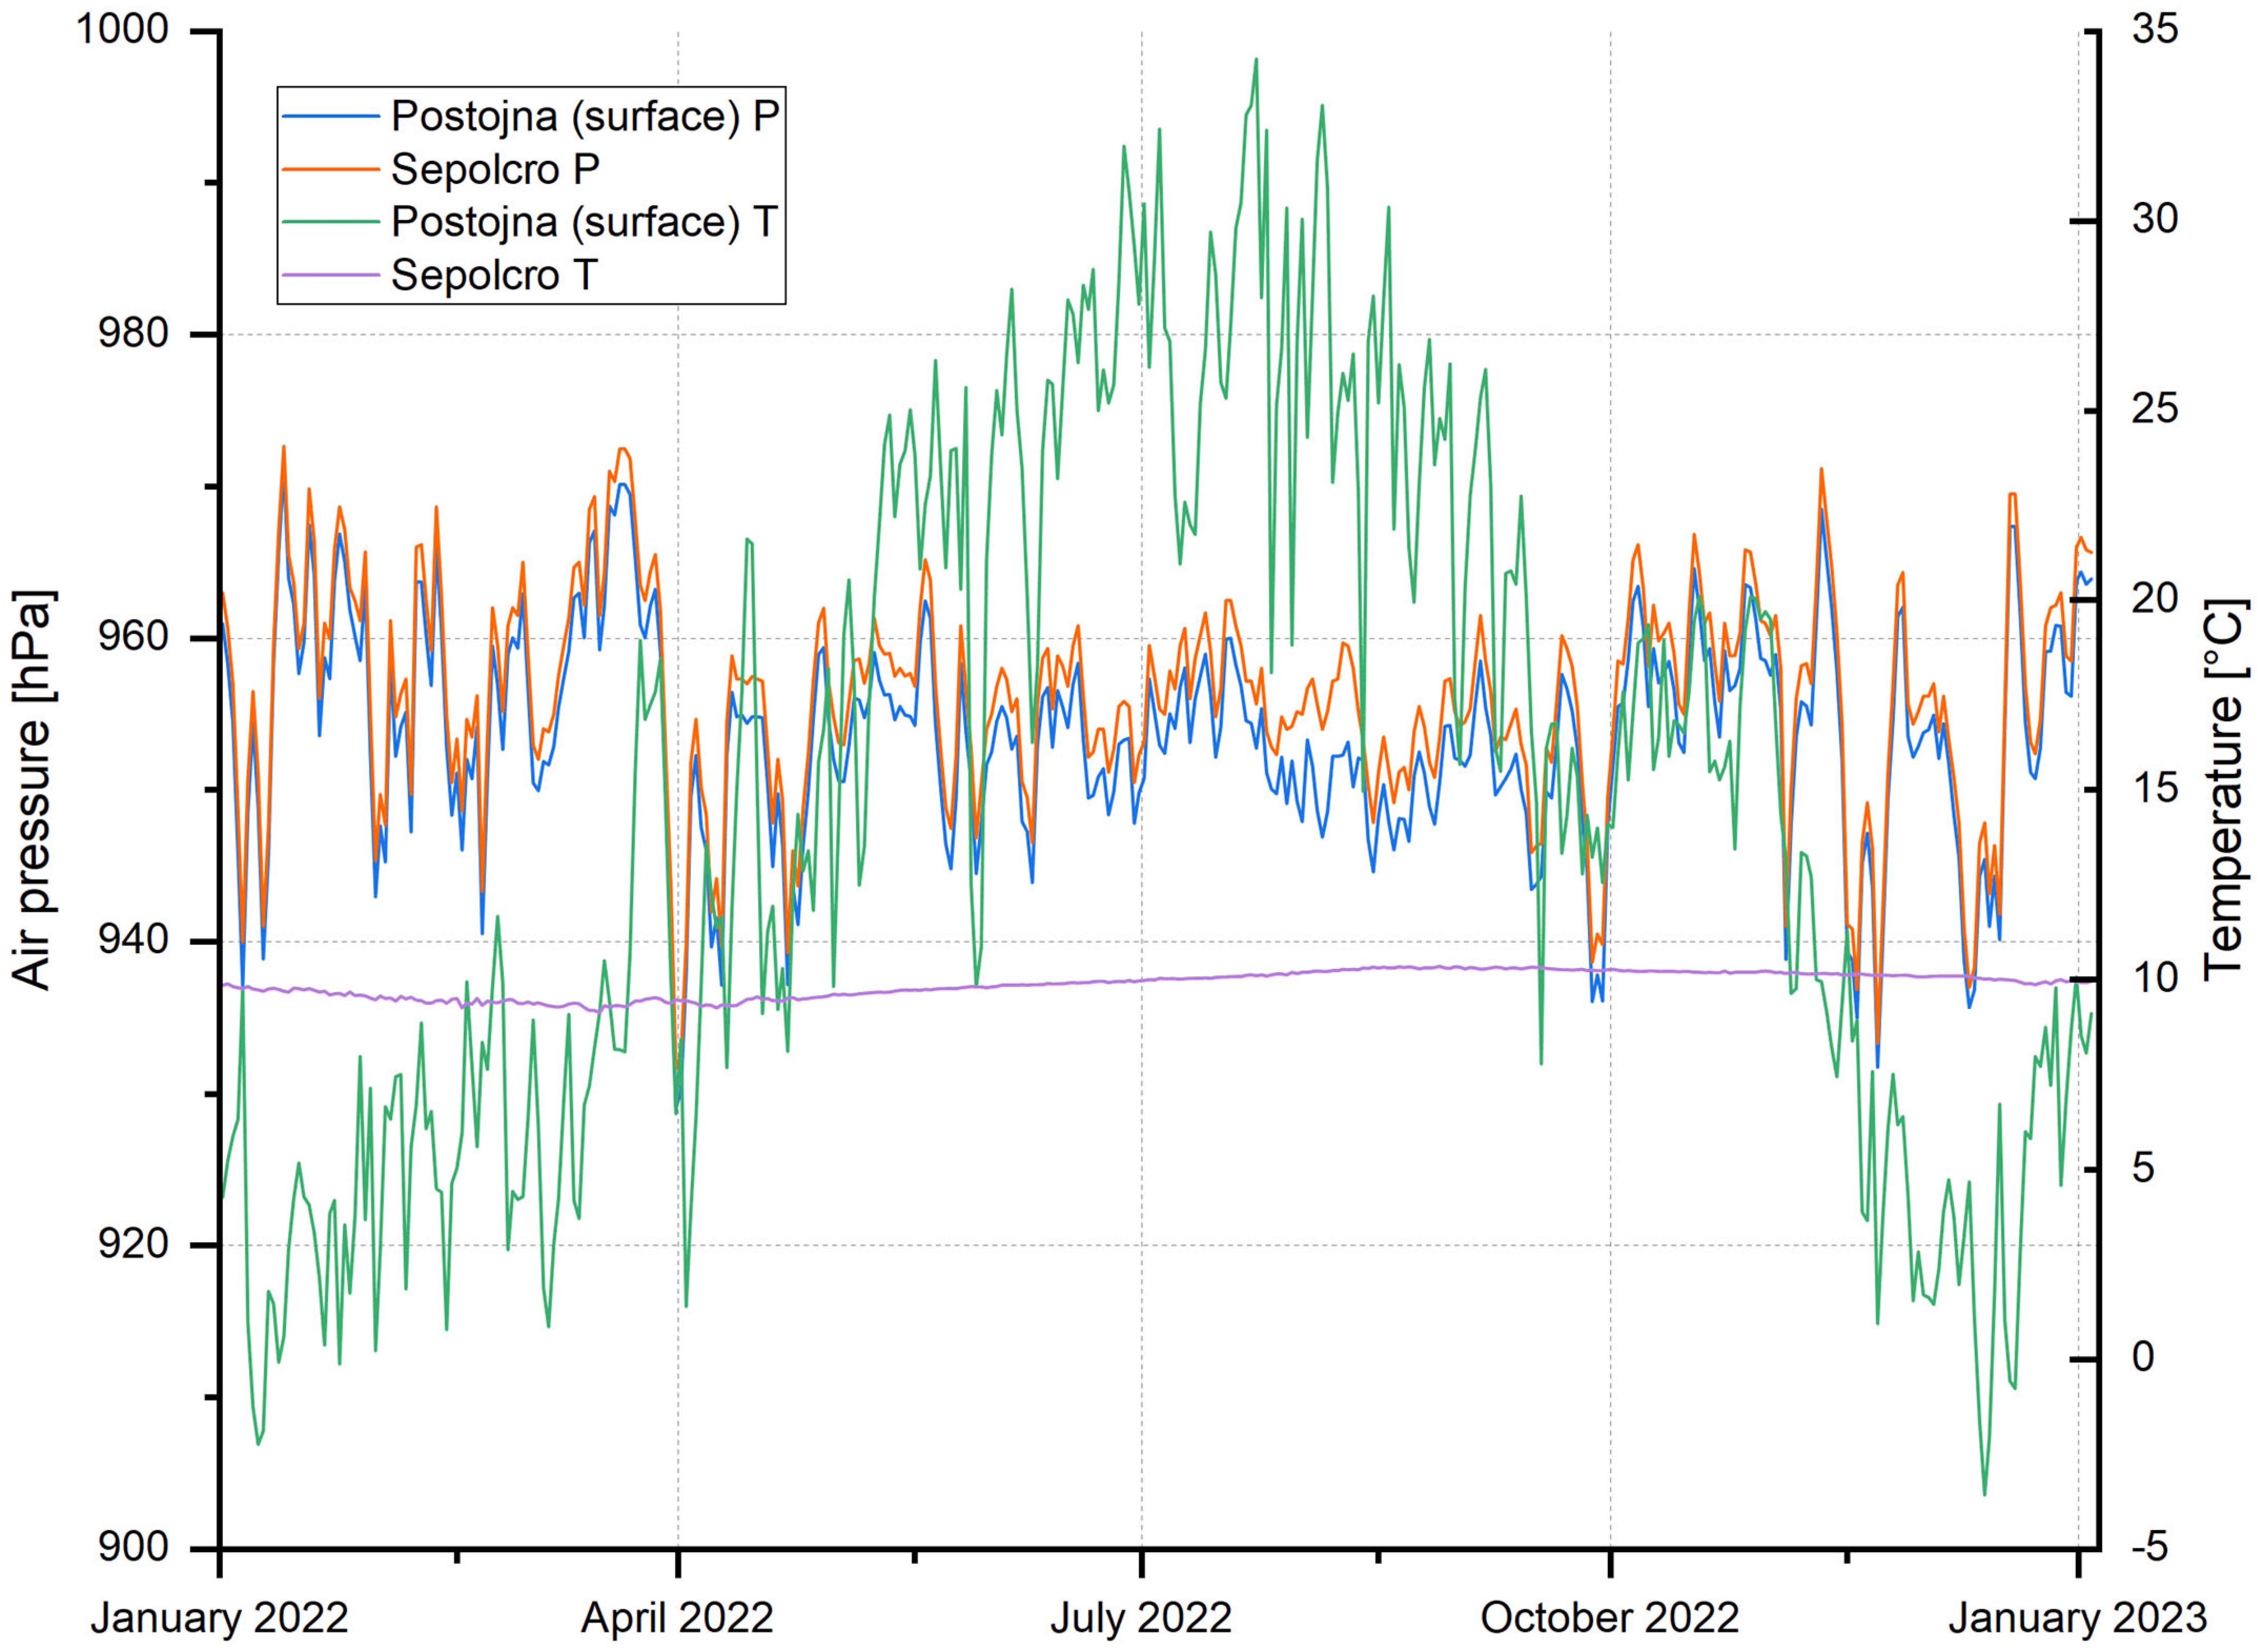
3.1. Air Pressure in Caves and on the Surface over a One-Year Period
Before we discuss air pressure perturbations due to HTHH eruption, we need to describe the year-round characteristics of air pressure relation between surface and caves. This is important for distinguishing between natural air pressure changes and exceptional, sudden variations in the relationship between surface and underground.
In Postojna Cave, the year-round comparison between the air pressure dataset and measurements outside the cave (Figure 2) shows synchronised behaviour between the cave and the surface at 12 h intervals. The difference in air pressure is due to the different altitudes of the measuring instruments. Even 2 min measurement intervals did not result in delays between air pressure measurements at the surface and in the cave [1].
Figure 2.
Relationship between atmospheric pressure (hPa) and air T (°C) in Postojna Cave (Sepolcro site) and on the surface with 12 h interval for 2022.
Atmospheric pressure monitoring sites in Postojna Cave, as well as in Škocjan Caves and Kostanjevica Cave, do not show that they are barometric caves like Wind Cave and Jewel Cave in South Dakota (USA), where air pressure gradients between the outside atmosphere and the cave induce strong bidirectional compensating currents, which control almost all elements of speleoclimatology, including air temperature, humidity, and CO2 dynamics [24].
In the case of the Grotte de Comblain at Comblain-au-Pont in Belgium, it was found that when air pressure is low (outside the cave), air trapped in the interconnected parts of the limestone is carried from the most remote voids to the cave by advection, meaning that when atmospheric pressure drops outside, cave air leaks out, sucking air from the remote parts of the cave system [25].
A phase lag between temperature and air pressure was observed at the Abisso di Trebiciano in Italy, with T peaking about 1 h 45 min earlier than pressure [26] with a sampling period of 5 min. The influence of thermal atmospheric tides on the temperature signal and the presence of a phase lag between temperature and air pressure confirmed at this site contrasts with the situation at Postojna Cave.
A barometer in the cave of the SBCB station in north-eastern Taiwan recorded unusual phenomena of larger amplitudes in air pressure changes inside the cave, as did those at the Xinwu station outside the cave. The phase angle differences reveal that the air pressure outside the cave at the Xinwu station often leads to air pressure changes inside the cave at relatively low-frequency bands [27]. This suggests that pressure–shear (P-SV) vertical ground vibrations can drive air pressure changes [27]. When the ground motion of the P-SV type is related to microseisms, the air pressure can change accordingly. The air pressure in caves can be amplified by the existence of P-SV-type vibrations due to the interior space being partially confined (like squeezing an air-filled rubber ball). Thus, the air pressure retrieved from a barometer inside the cave is sensitive to P-SV-type vibrations [27].
Cave air flows in Postojna Cave, Škocjan Caves, and Kostanjevica Cave are mainly related to the temperature difference between outside and cave atmospheres, with two ventilation regimes [28,29]. When Tout − Tcave < 0, upward flow occurs (UAF mode), and when Tout − Tcave > 0, downward flow occurs (DAF mode) [30], supporting the idea that these are not barometric caves as described in other examples worldwide. In this sense, it is not surprising that pressure changes due to HTHH eruptions that were detected on the surface were marked at cave monitoring sites as well.
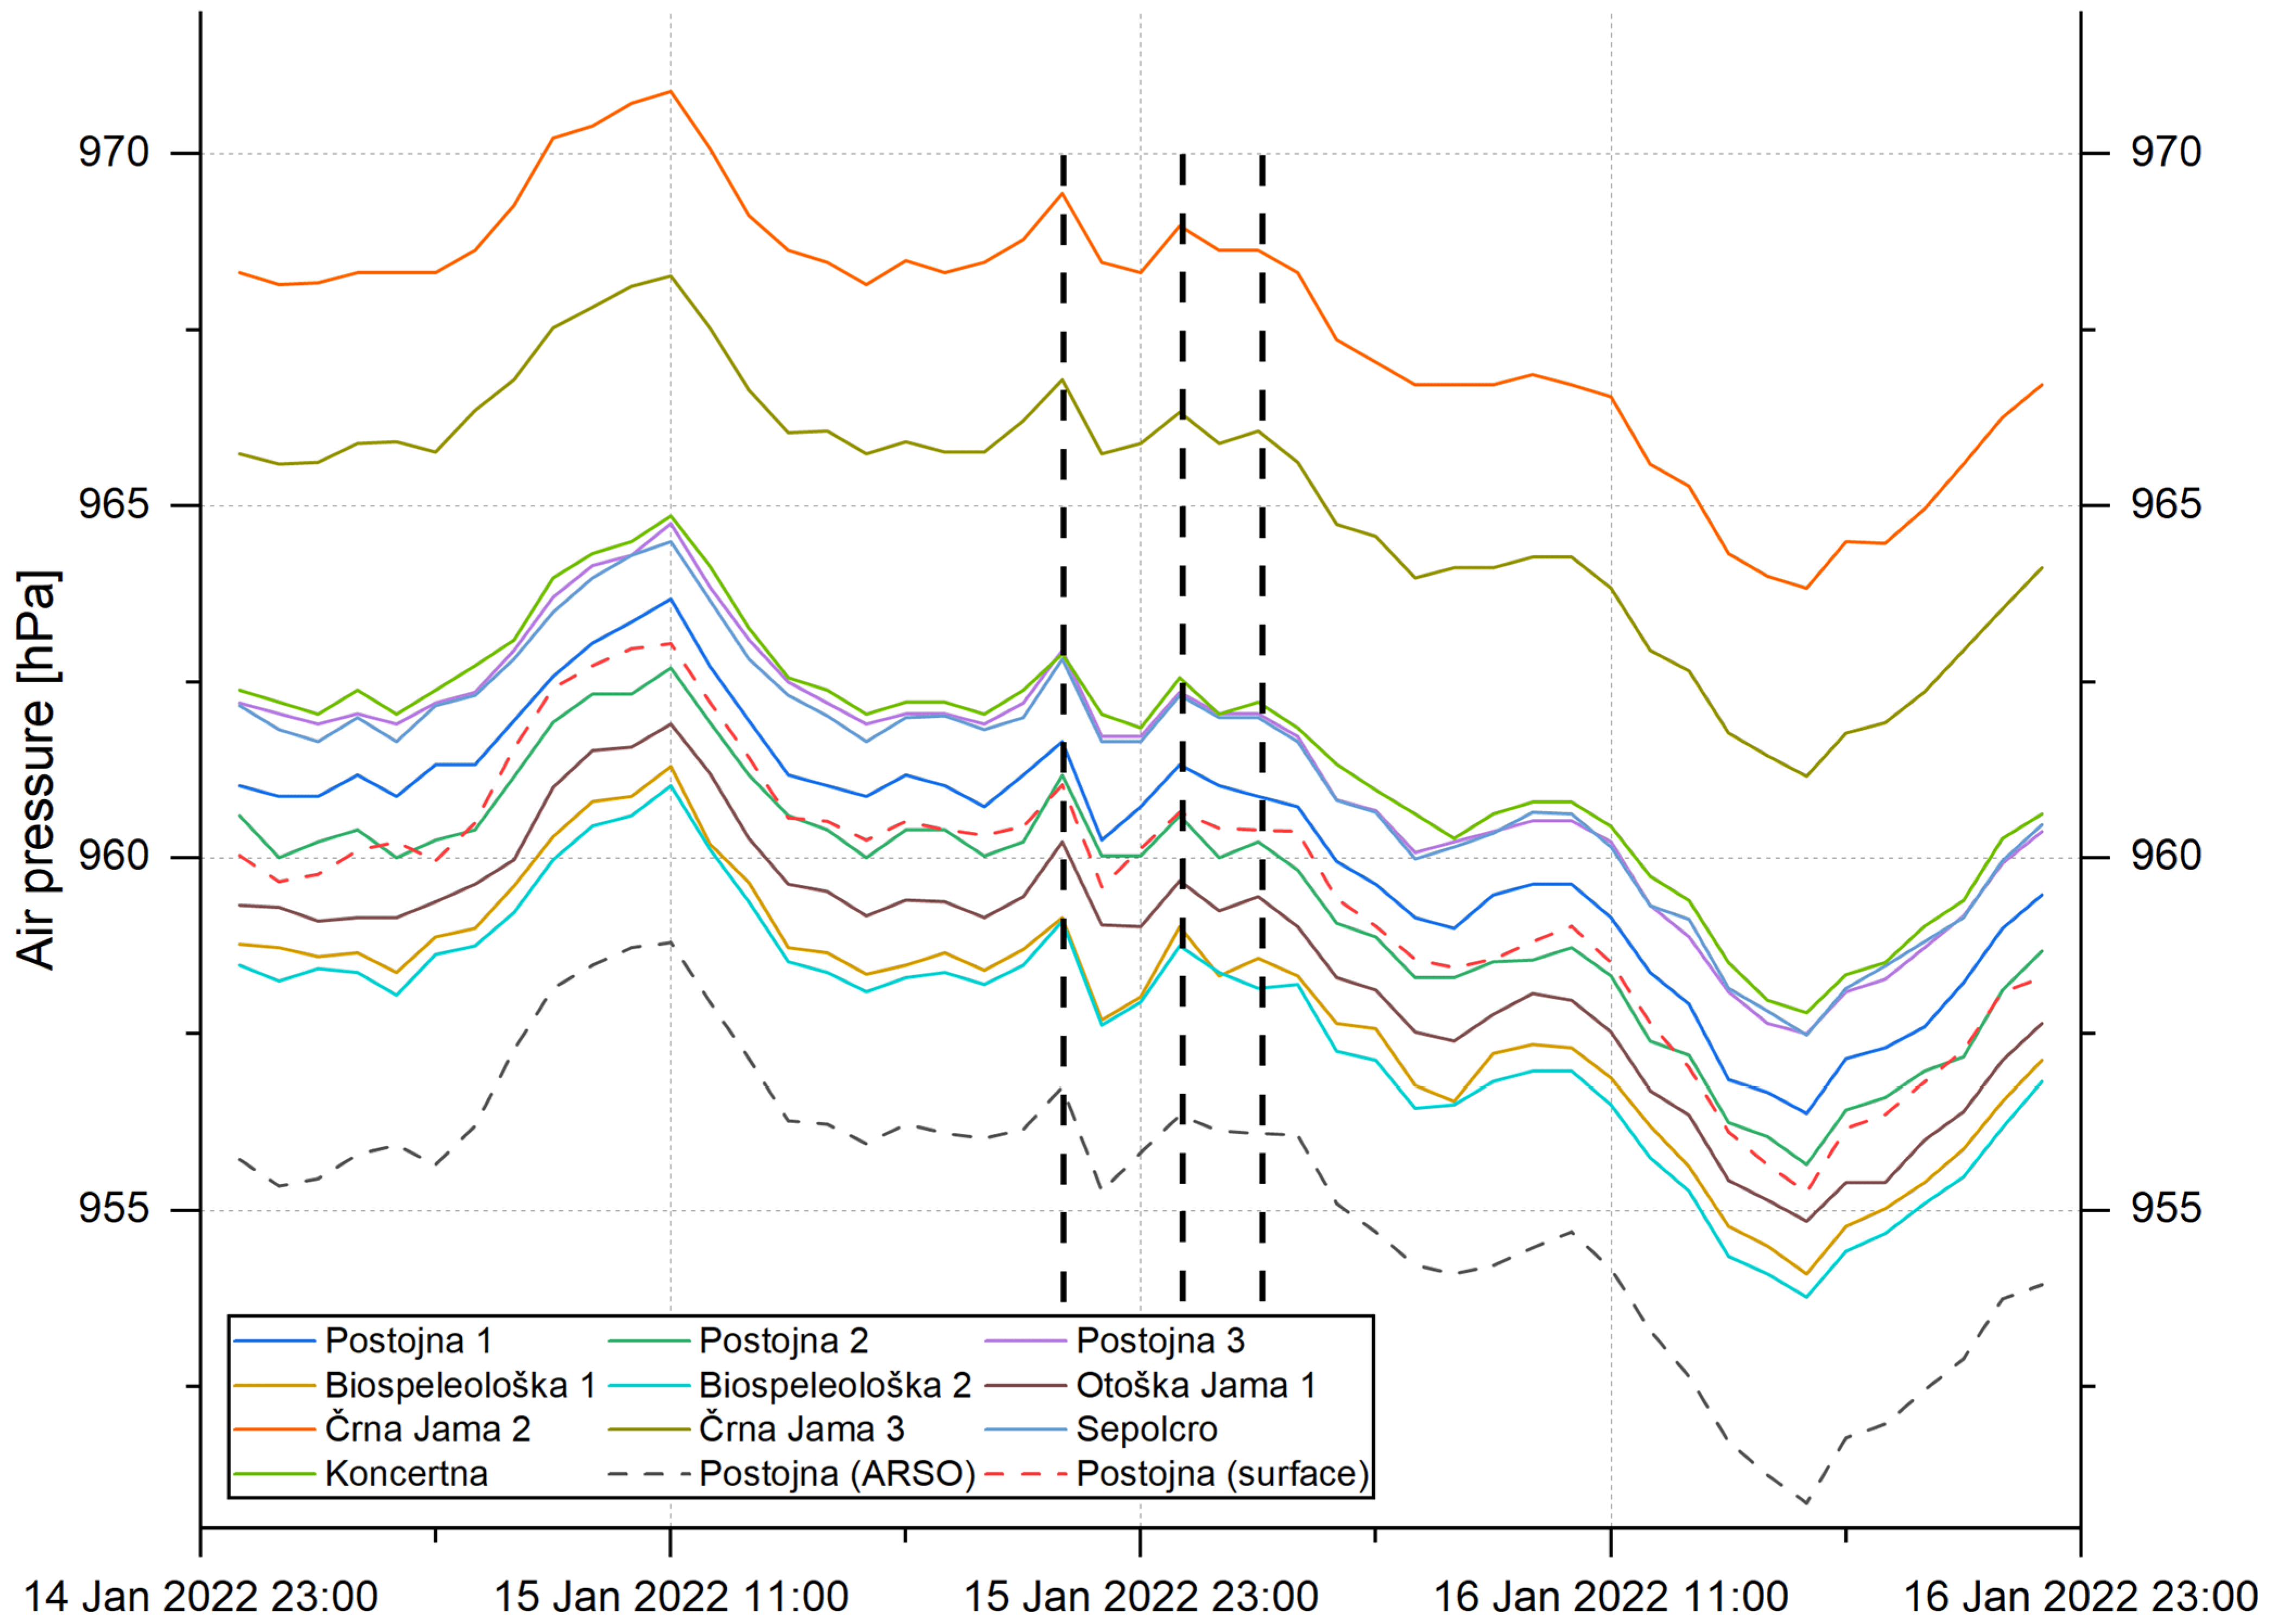
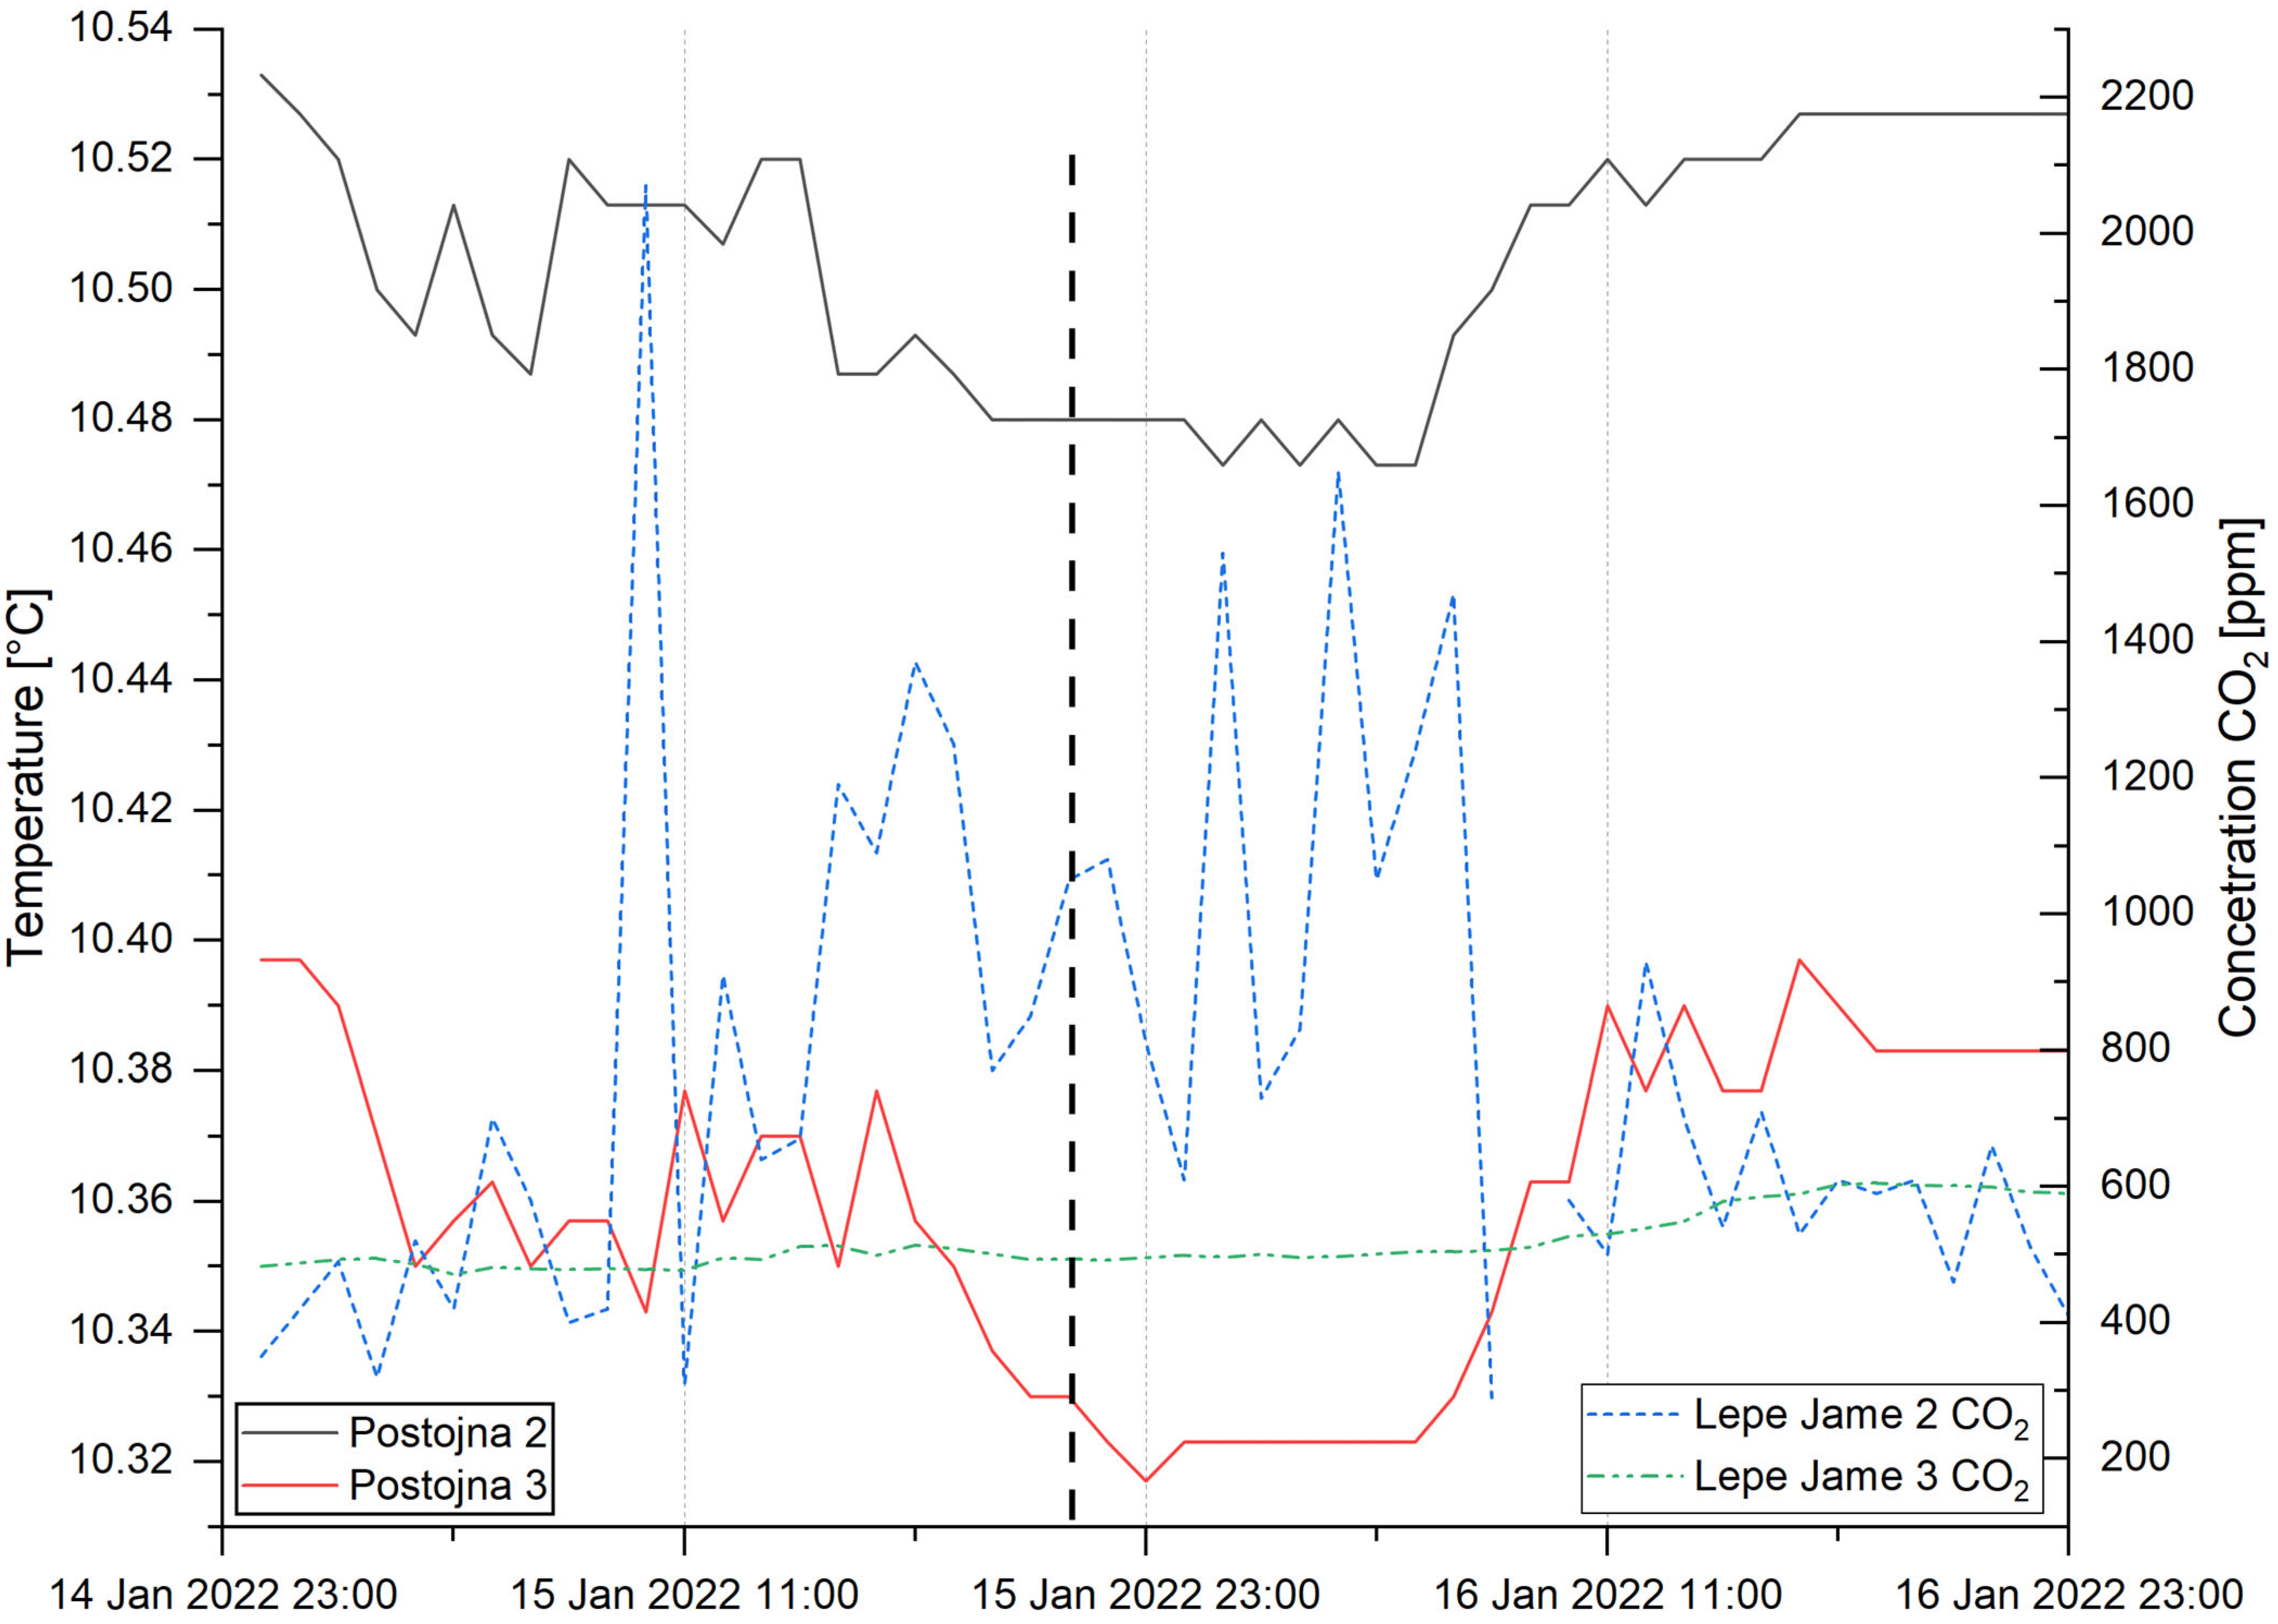
3.2. Air Pressure in Cave Air and on the Surface after the HTHH Eruption on 15 January 2022
Irregular air pressure changes were detected in Postojna Cave, Škocjan Caves, and Kostanjevica Cave on 15 and 16 January 2022. Surface air pressure monitoring locations likewise recorded more signal events.
3.2.1. Postojna Cave
In Postojna Cave we detected an increase of up to 0.84 hPa on 15 January 2022 at 10 cave locations (Figure 3), starting at 20:00 CET (19:00 UTC), with the highest peak at 21:00 CET (20:00 UTC), representing a pressure wave coming from the North Pole, as described by Harrison [18]. According to Madonia et al. [31], the first signal is a short-range signal (first arrival signal). At 00:00 CET (23:00 UTC the previous day), there is another air pressure surge, described by Madonia et al. [31] as a long-range first arrival of an atmospheric pressure pulse.
Figure 3.
Postojna Cave atmospheric pressure (hPa) compared to surface measurements, 15–16 January 2022, sampled at 1 h. Vertical dashed lines: 1—atmospheric pressure pulse (via North Pole) at 21:00 CET (20:00 UTC) on 15 January 2023; 2—atmospheric pressure pulse (long-range according to Madonia et al. [31]) at 00:00 CET (23:00 UTC) on 15–16 January 2023; and 3—atmospheric pressure pulse (via South Pole) at 02:00 CET (01:00 UTC) on 16 January 2023.
The second pressure wave (over the South Pole) at 02:00 CET (01:00 UTC) on 16 January 2022 is about 0.2 hPa and is not visible at all sites, but only at Postojna 2, Otoška Jama 1, Biospeleološka 1, and Koncertna Dvorana (Figure 3). All three air pressure peaks are clearly visible at our Baro-Diver® site outside the cave (Postojna surface in Figure 3), but less clearly at the national weather station in Postojna [15].
Atmospheric waves propagate mechanical disturbances in the atmospheric fluid [13]. The atmospheric pressure anomaly detected in cave air after the eruption of the HTHH volcano is consistent with Lamb waves reported by other authors [10,13,19].
In addition to air temperature and pressure, we also measure carbon dioxide, methane, and radon in Postojna Cave, but during the HTHH event, it was not possible to detect significant changes in their concentrations, as was the case in southern Italy (island of Vulcano), where the short and long ranges of the first arrival signal in the soil CO2 flux are reported [31].
On the other hand, a slight decrease in air temperature of 0.02 °C was observed in Postojna Cave during the first pressure wave on 15 January 2022, from 21:00 to 23:00 CET (20:00 to 22:00 UTC) (Figure 4), but this may also be related to the intrusion of colder outside air into the cave system during the night.
Figure 4.
Two monitoring sites at Postojna Cave Lepe Jame 2 and 3; air T (°C) and CO2 (ppm) values, 15–16 January 2022, sampled at 1 h. Dashed vertical line (1) shows the highest pressure signal at 21:00 CET (20:00 UTC).
In some subsurface cavities, temperature variations of the order of 10−3 °C are permanently induced by variations in atmospheric pressure [32]. Temperature signals are indicative of transient conditions characterised by several processes that are not necessarily easy to separate, such as transient airflow due to barometric winds or localised convection cells, transient infiltration or energy dissipation due to evaporation–condensation on the rock surface, are observed [32].
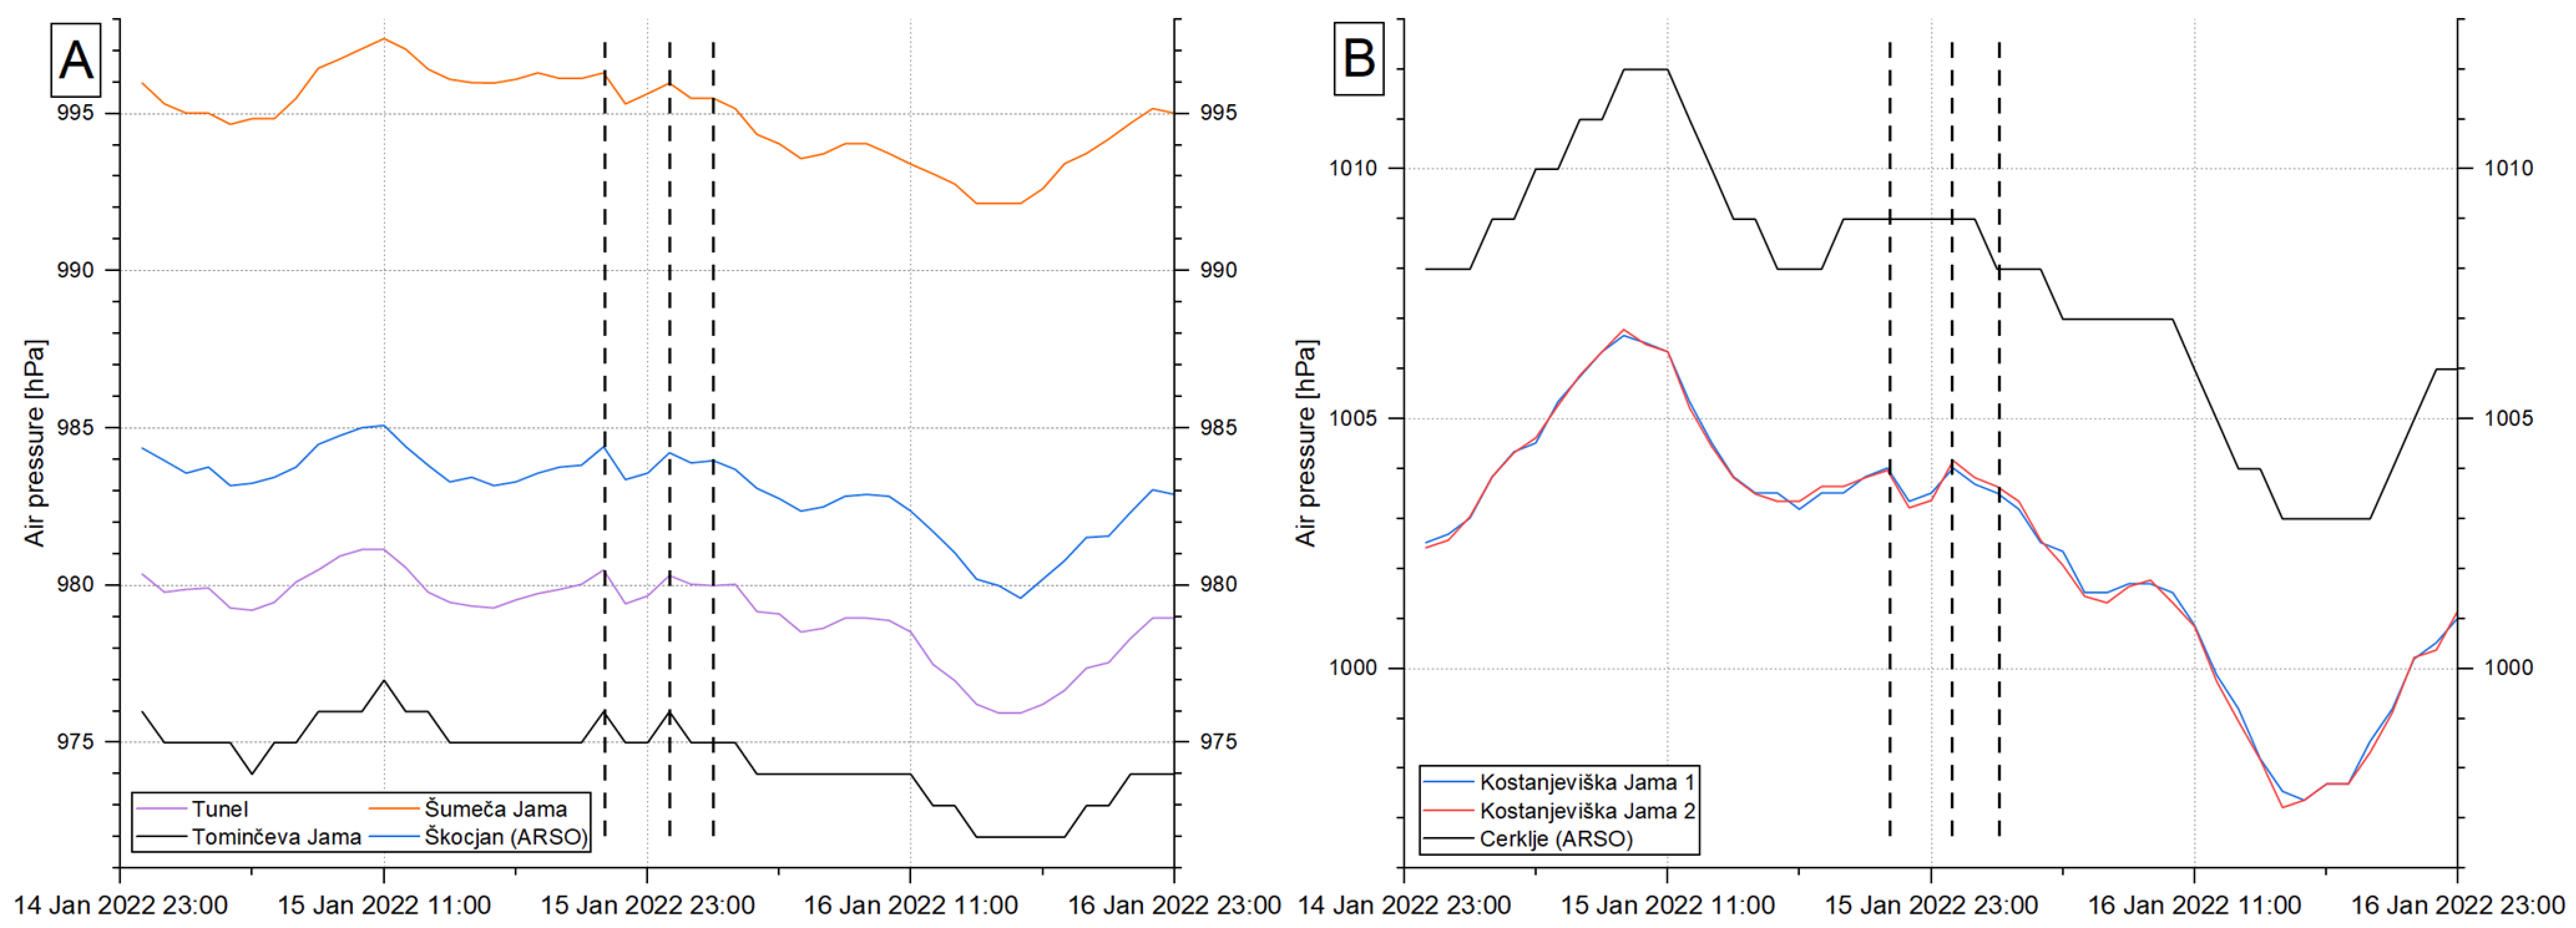
3.2.2. Škocjan Caves
Air pressure in Škocjan Caves increased by 0.62 hPa between 20:00 CET (19:00 UTC) and 21:00 CET (20:00 UTC) on 15 January 2022 (Figure 5A). The oscillation is not well pronounced in Šumeča Jama, an underground water canyon up to 120 m high, possibly reducing the force of the pressure wave in the large underground chamber. The second signal appears to occur (via the South Pole) at 02:00 CET (01:00 UTC) on 16 January 2023.
Figure 5.
(A) Atmospheric pressure at Škocjan Caves and outside the caves [15] in hPa, 15–16 January 2022. (B) Atmospheric pressure at Kostanjevica Cave and outside [15] in hPa, 15–16 January 2022. Vertical dashed lines represent: 1—pressure signals at 21:00 CET (20:00 UTC); 2—pressure signals at 00:00 CET (23:00 UTC); and 3—pressure signals at 02:00 CET (01:00 UTC).
The surface weather station at Škocjan [15] shows that atmospheric pressure began to increase at 20:30 CET (19:30 UTC) in a 30 min measurement interval. Again, the long-range disturbance (first arrival according to Madonia et al. [31]) arrived at 00:00 CET on 16 January 2022 (23:00 UTC the previous day).
3.2.3. Kostanjevica Cave
In the case of Kostanjevica Cave, both air pressure curves are consistent (Figure 5B). On 15 January 2022, we have a slight increase of 0.2 hPa between 20:00 and 21:00 CET (19:00–20:00 UTC) and a decrease of 0.8 hPa between 21:00 and 22:00 CET (20:00–21:00 UTC), corresponding to the first HTHH pressure wave over the North Pole [18]. The second pulse (over the South Pole) arrived at 02:00 CET (01:00 UTC) on 16 January 2022. Between these two pulses, the long-range pulse [31] arrived at 00:00 CET (23:00 UTC) (Figure 5B). Atmospheric pressure data from the national meteorological archive [15] did not show significant changes even at 30 min measurement intervals for the Cerklje na Dolenjskem station (Figure 1, Table 1).
Surface and cave air pressures in Kostanjevica Cave and at the associated weather station are higher than at the other sites because they are located at a lower altitude.
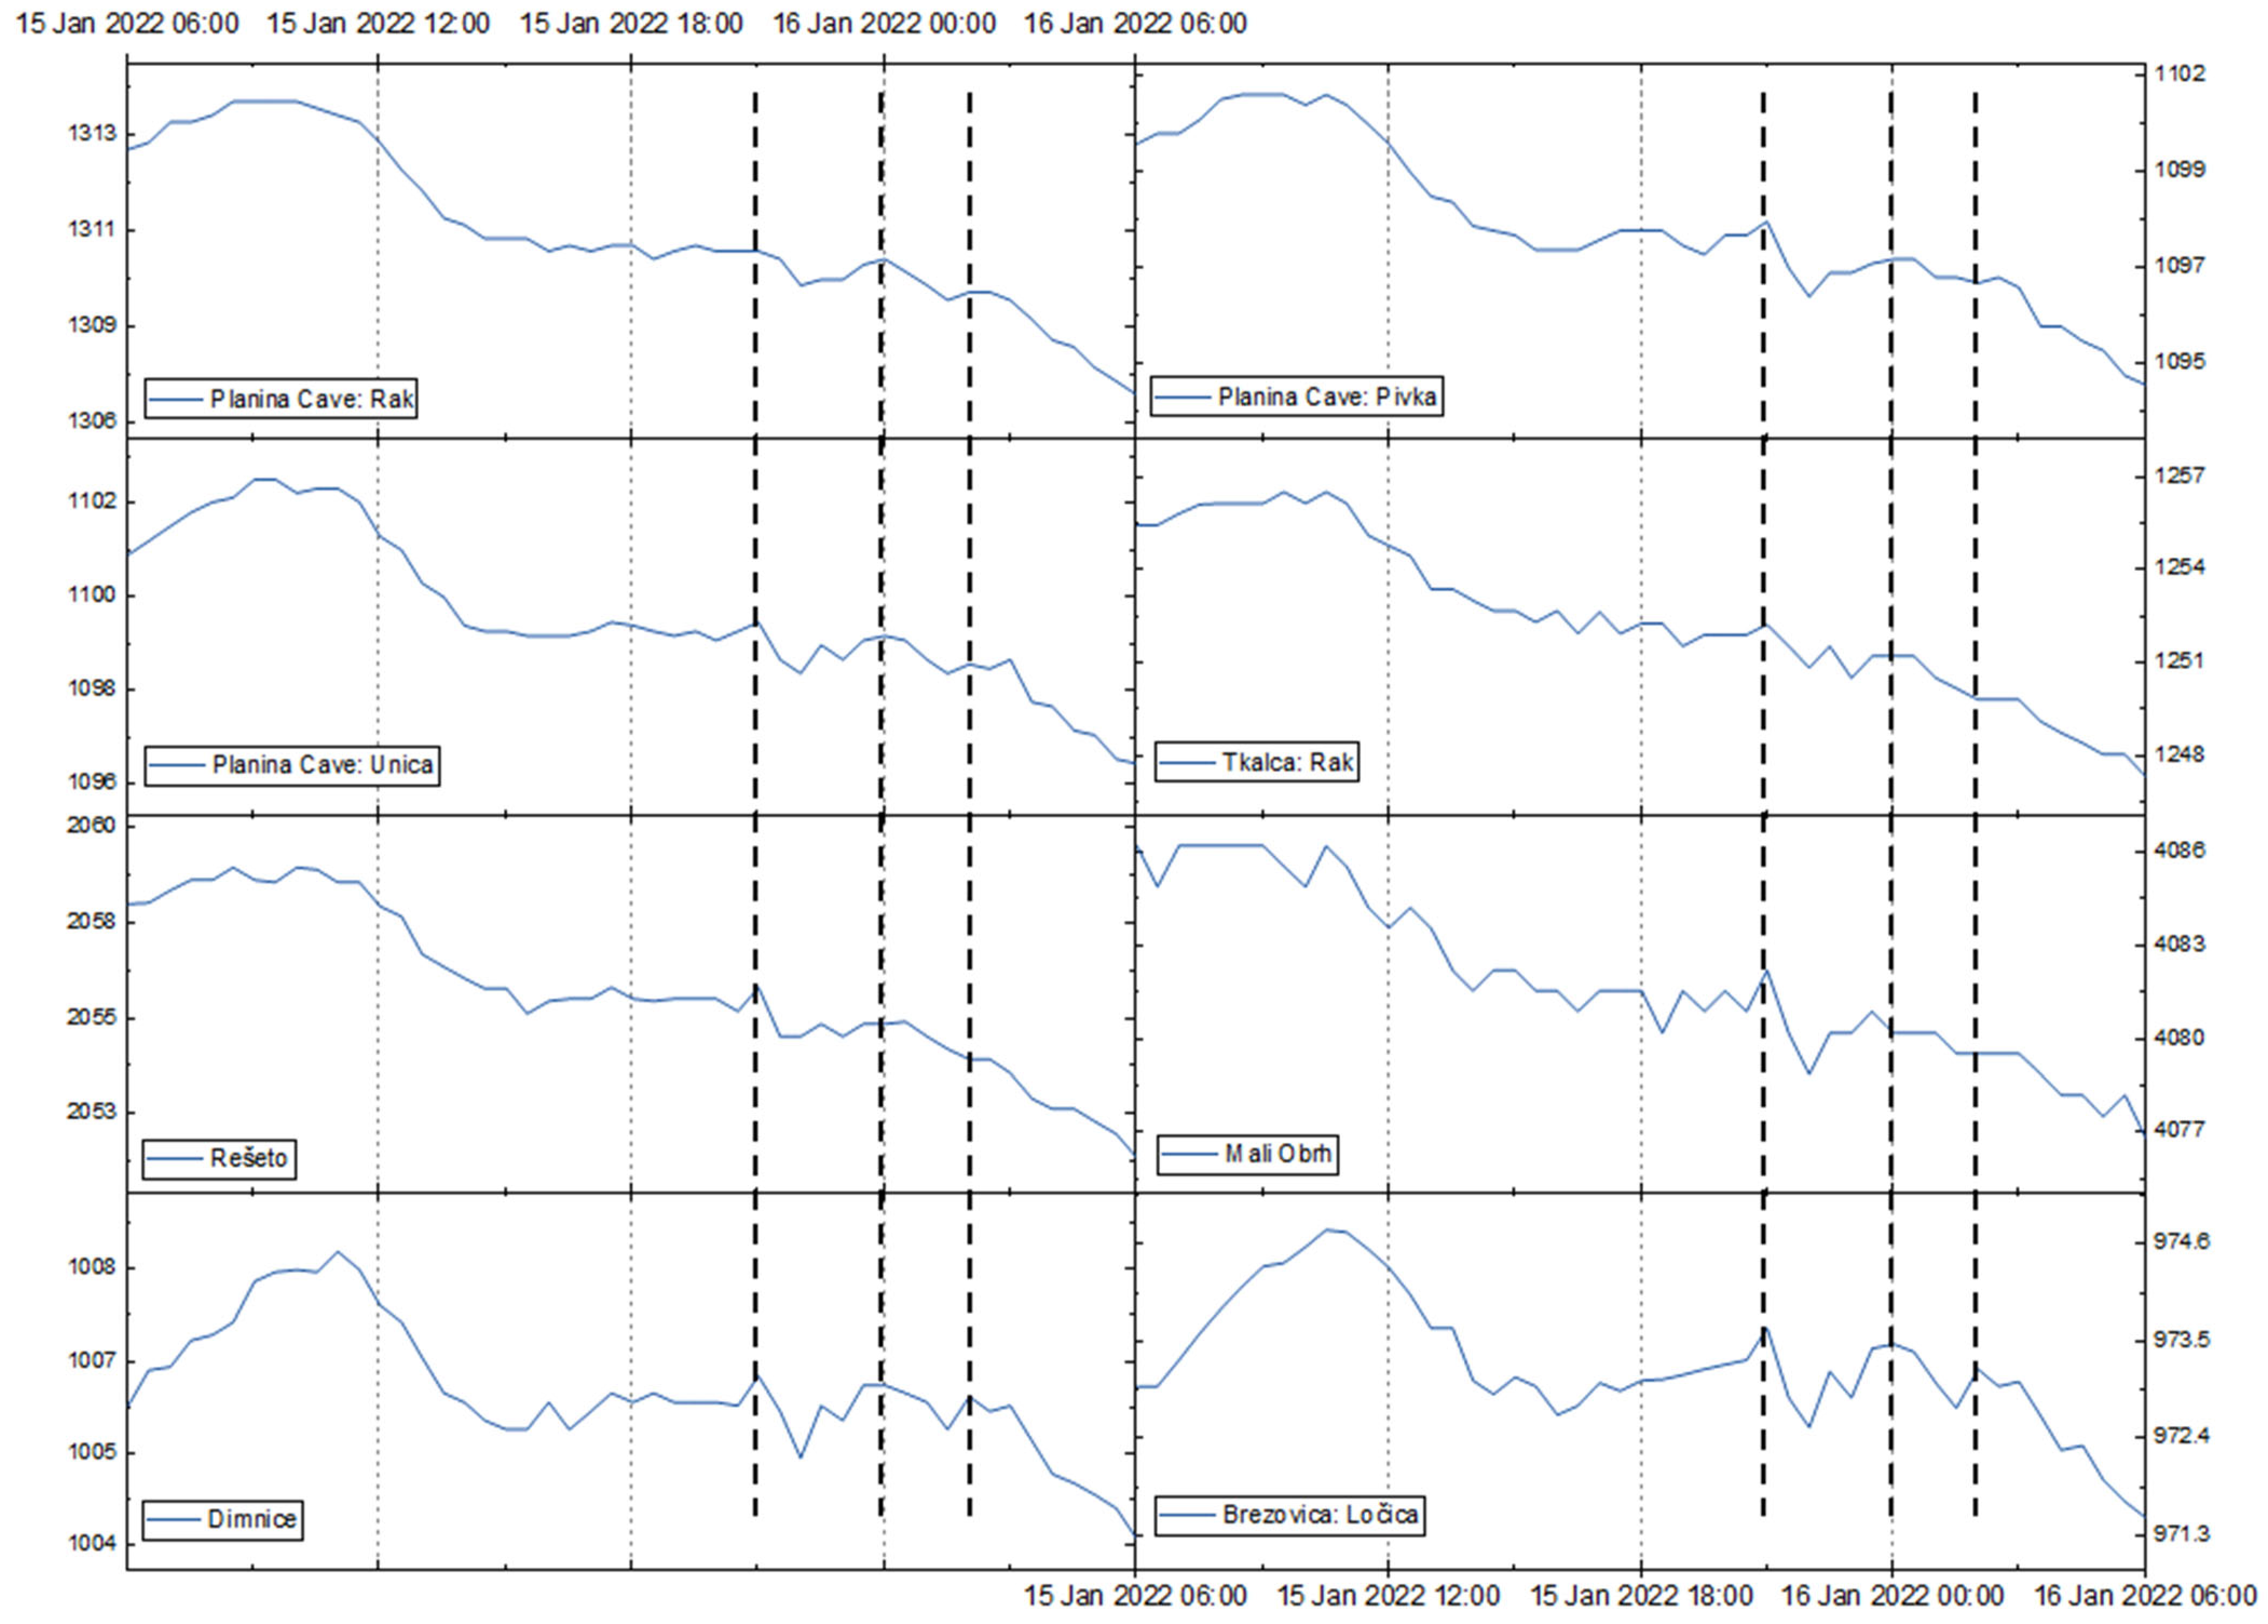
3.3. Pressure in Karst Waters after the HTHH Eruption
The change in the signal is almost identical at all the karst water monitoring sites with the exception of Planina Cave: Rak. Between 20:00 and 21:00 CET (19:00–20:00 UTC) on 15 January 2022, there was a slight increase of, on average, 0.35 hPa (maximum Mali Obrh—0.65 hPa; minimum Planina Cave: Rak—no change recorded) and a decrease of, on average, 1.47 hPa between 21:00 and 22:00 CET (20:00–21:00 UTC) (maximum Mali Obrh—3.23 hPa; minimum Planina Cave: Rak—0.82 hPa), again corresponding to the first HTHH pressure wave over the North Pole [18]. The long-range pulse at 00:00 CET (23:00 UTC) [31] and the second pulse on 16 January 2022 at 02:00 CET (01:00 UTC) were also observed at karst water monitoring sites.
All three pressure waves (the first over the North Pole, the second over the South Pole [18], and the intervening long-range pulse [31]) were also recorded at eight karst water monitoring sites (Figure 6) in four different caves (1–10 m below the water surface) and at two surface karst water sites.
Figure 6.
Total pressure in water measured at karst water monitoring sites in hPa, 15–16 January 2022. Vertical dashed lines represent: 1—pressure signals at 21:00 CET (20:00 UTC); 2—pressure signals at 00:00 CET (23:00 UTC); and 3—pressure signals at 02:00 CET (01:00 UTC).
Pressure waves were also detected at other karst monitoring sites, but we selected the most representative ones. It is interesting to note that there are also some points deep inside the caves where the signal of the pressure waves is attenuated or not visible at all, as is the case for Planina Cave (Rak passage) (Figure 6, Table 1). A possible explanation is that the fluctuation of the air pressure is attenuated due to the connection and morphology of the underground cave system with the surface, or perhaps the distance from the cave entrance meant that it could not be recorded by the logger.
It is also obvious that the HTHH pressure wave occurred at all presented monitoring sites (Table 1) at the same time (21:00 CET (20:00 UTC)) meaning that the air difference of 120 km between the most eastern site, Cerklje (Figure 1B), and most western site, Škocjan Caves, is too short for significant delay, especially due to 1 h measuring intervals. More frequent measurements as shown by Slovene national weather stations [15] suggest that pressure wave arrived in Slovenia half an hour sooner at about 20:30 CET (19:30 UTC).
4. Conclusions
Regular microclimatic monitoring in karst caves and hydrogeological monitoring of karst waters in Slovenia provided important atmospheric pressure data related to the eruption of the Hunga Tonga–Hunga Ha’apai (HTHH) volcano in the Pacific Ocean on 15 January 2022. The ionospheric disturbance, which travelled around the world and reached Slovenia at about 20:30 CET (19:30 UTC), affected atmospheric pressure data from national weather stations [15].
At 15 air monitoring sites in 3 different caves (20–120 m below the surface) and at 4 surface air monitoring sites (Figure 3 and Figure 5), we detected a small increase in the atmospheric pressure of <1 hPa at 21:00 CET (20:00 UTC) on 15 January 2022, corresponding to the first HTHH pressure wave over the North Pole [18]. The second pulse (over the South Pole) arrived at 02:00 CET (01:00 UTC) on 16 January 2022. Between the two pulses, a long-range pulse [31] was detected at 00:00 CET (23:00 UTC).
At some cave monitoring locations (such as Lepe Jame 3 in Postojna Cave, Figure 4), the air temperature dropped slightly during this global event, which was triggered by a far-field volcanic eruption. Carbon dioxide, methane, and radon measurements did not reveal any significant changes that could be attributed to the HTHH eruption.
All three pressure waves (the first over the North Pole, the second over the South Pole [18], and the long-range pulse [31] between the two) were also recorded at eight karst water monitoring sites (Figure 6) in four different caves (1–10 m below the water surface) and at two surface karst water sites (maximum Mali Obrh—0.65 hPa; minimum Planina Cave: Rak—no change recorded).
This is the first evidence of atmospheric pressure changes resulting from the HTHH volcanic eruption in karst caves and waters. It turns out that monitoring karst caves and waters, microclimatically and hydrologically, not only provides data on local microphysical parameters, it also provides insight into events with global effects. This makes karst caves and waters not only attractive tourist destinations, but also very suitable environments for studies of volcanic eruptions and near- and far-field geophysical studies.
Author Contributions
Conceptualization, S.Š., U.N. and B.K.; methodology, S.Š., U.N. and B.K.; formal analysis, S.Š., U.N. and B.K.; investigation, S.Š., U.N. and B.K.; data curation, S.Š., U.N. and B.K.; writing—original draft preparation, S.Š. and U.N.; writing—review and editing, S.Š., U.N. and B.K. All authors have read and agreed to the published version of the manuscript.
Funding
The study is part of the RI-SI-EPOS project C3330-19-952056 (co-financed by the Ministry of Education, Science and Sport of the Republic of Slovenia and the European Regional Development Fund) and the EPOS SP project 871121 (EU Research and Innovation Programme Horizon 2020). The research was conducted within the programs Karst Research (P6-0119), EPOS Infrastructure (I0-E017), and Natural and Cultural Heritage (I0-0031) and the project Characterisation of Karst Aquifers on Regional and Local Scales: The Recharge Area of the Malni Water Source (L7-2630) financed by the Slovenian Research Agency. This work is part of the doctoral dissertation of the U.N. at the University of Nova Gorica (UNESCO Chair on Karst Education).
Institutional Review Board Statement
Not applicable.
Informed Consent Statement
Not applicable.
Data Availability Statement
The original contributions presented in this study are included in the article.
Acknowledgments
The authors gratefully acknowledge Postojnska jama d.d., Škocjan Caves, Kostanjevica Cave, and Dimnice Cave.
Conflicts of Interest
The authors declare no conflict of interest.
References
- Šebela, S.; Turk, J. Local characteristics of Postojna Cave climate, air temperature, and pressure monitoring. Theor. Appl. Climatol. 2011, 105, 371–386. [Google Scholar] [CrossRef]
- Šebela, S.; Turk, J. Sustainable use of the Predjama Cave (Slovenia) and possible scenarios related to anticipated major increase in tourist numbers. Tour. Manag. Perspect. 2014, 10, 37–45. [Google Scholar] [CrossRef]
- Šebela, S.; Turk, J. Comparison of historical and current temperatures in show caves (Slovenia). SN Appl. Sci. 2022, 4, 1. [Google Scholar] [CrossRef] [PubMed]
- Debevec, V.; Rakovec, J. Impact of Visits on the Microclimates of Caves, Experimental Evidence from Škocjan Caves. Acta Carsologica 2021, 50, 269–290. [Google Scholar] [CrossRef]
- Šebela, S. Introduction. In Natural and Anthropogenic Impacts on Cave Climates: Postojna and Predjama Show Caves of Slovenia; Elsevier: Amsterdam, The Netherlands, 2022; pp. 1–6. [Google Scholar]
- Mulec, J. Human impact on underground cultural and natural heritage sites, biological parameters of monitoring and remediation actions for insensitive surfaces: Case of Slovenian show caves. J. Nat. Conserv. 2014, 22, 132–141. [Google Scholar] [CrossRef]
- Mulec, J.; Oarga-Mulec, A.; Šturm, S.; Tomazin, R.; Matos, T. Spacio-Temporal Distribution and Tourist Impact on Airborne Bacteria in a Cave (Škocjan Caves, Slovenia). Diversity 2017, 9, 28. [Google Scholar] [CrossRef]
- Prelovšek, M.; Gabrovšek, F.; Kozel, P.; Mulec, J.; Pipan, T.; Šebela, S. The Škocjan Caves-UNESCO World Heritage Site. In Zeitschrift für Geomorphologie: Preserving World Subterranean Heritage: Natural, Cultural and Mixed Subterranean Heritage; Trofimova, E., Salomon, J.-N., Eds.; Borntraeger Science Publishers: Stuttgart, Germany, 2021; Volume 62, pp. 49–64. [Google Scholar]
- Tonga Volcano Plume Reached the Mesosphere. Available online: https://earthobservatory.nasa.gov/images/149474/tonga-volcano-plume-reached-the-mesosphere (accessed on 17 February 2022).
- Yuen, D.A.; Scruggs, M.A.; Spera, F.J.; Zheng, Y.; Hu, H.; McNutt, S.R.; Thompson, G.; Mandli, K.; Keller, B.R.; Wei, S.S.; et al. Under the surface: Pressure-induced planetary-scale waves, volcanic lightning, and gaseous clouds caused by the submarine eruption of Hunga Tonga-Hunga Ha’apai volcano. Earthquake Res. Adv. 2022, 2, 100134. [Google Scholar] [CrossRef]
- Brenna, M.; Cronin, S.J.; Smith, I.E.M.; Pontesilli, A.; Tost, M.; Baker, S.; Tonga’onevai, S.; Kula, T.; Vaiomounga, R. Post-caldera volcanism reveals shallow priming of an intra-ocean arc andesitic caldera: Hunga volcano, Tonga, SW Pacific. Lithos 2022, 412–413, 106614. [Google Scholar] [CrossRef]
- Wright, C.J.; Hindley, N.P.; Alexander, M.J.; Barlow, M.; Hoffmann, L.; Mitchell, C.N.; Prata, F.; Bouillon, M.; Carstens, J.; Clerbaux, C.; et al. Surface-to-space atmospheric waves from Hunga Tonga–Hunga Ha’apai eruption. Nature 2022, 609, 741–746. [Google Scholar] [CrossRef] [PubMed]
- Matoza, R.S.; Fee, D.; Assink, J.D.; Iezzi, A.M.; Green, D.N.; Kim, K.; Toney, L.; Lecocq, T.; Krishnamoorthy, S.; Lalande, J.-M.; et al. Atmospheric waves and global seismoacoustic observations of the January 2022 Hunga eruption, Tonga. Science 2022, 377, 95–100. [Google Scholar] [CrossRef]
- Udarni val Vulkana Prepotoval ves Svet, v 16 Urah Dosegel Slovenijo. Available online: https://www.24ur.com/novice/slovenija/udarni-val-vulkana-prepotoval-17000-kilometrov-in-dosegel-slovenijo.html (accessed on 17 February 2022).
- Data of Weather Stations of the Slovenian Environment Agency. Available online: https://meteo.arso.gov.si/met/sl/archive/ (accessed on 17 January 2023).
- Ob Izbruhu Podvodnega Vulkana Tudi Pri Nas »Mali Zračni Tsunami«. Available online: https://www.primorski.eu/trzaska/ob-izbruhu-podvodnega-vulkana-tudi-pri-nas-mali-zracni-tsunami-CH1018567 (accessed on 17 February 2022).
- Tonga Volcano Eruption Detected by ALICE DCS. Available online: https://alice-collaboration.web.cern.ch/node/35254 (accessed on 27 March 2022).
- Harrison, G. Pressure anomalies from the January 2022 Hunga Tonga-Hunga Ha’apai eruption. Weather 2022, 77, 87–90. [Google Scholar] [CrossRef]
- Lane, E.M. Atmospheric waves reinforced tsunami after Tongan eruption. Nature 2022, 609, 677–678. [Google Scholar] [CrossRef] [PubMed]
- Zhang, S.-R.; Vierinen, J.; Aa, E.; Goncharenko, L.P.; Erickson, P.J.; Rideout, W.; Coster, A.J.; Spicher, A. 2022 Tonga Volcanic Eruption Induced Global Propagation of Ionospheric Disturbances via Lamb Waves. Front. Astron. Space Sci. 2022, 9, 871275. [Google Scholar] [CrossRef]
- Legras, B.; Duchamp, C.; Sellitto, P.; Podglajen, A.; Carboni, E.; Siddans, R.; Grooß, J.-U.; Khaykin, S.; Ploeger, F. The evolution and dynamics of the Hunga Tonga–Hunga Ha’apai sulfate aerosol plume in the stratosphere. Atmos. Chem. Phys. 2022, 22, 14957–14970. [Google Scholar] [CrossRef]
- Blatnik, M.; Culver, D.C.; Gabrovšek, F.; Knez, M.; Kogovšek, B.; Kogovšek, J.; Hong, L.; Mayaud, C.; Mihevc, A.; Mulec, J.; et al. Karstology in the Classical Karst; Springer: Cham, Switzerland, 2020; pp. 1–222. [Google Scholar]
- Gostinčar, P. Geomorphological Characteristics of Karst on Contact between Limestone and Dolomite in Slovenia. Ph.D. Thesis, University of Nova Gorica, Nova Gorica, Slovenia, 2016. [Google Scholar]
- Gomell, A.K.; Austin, D.C.; Ohms, M.J.; Pflitsch, A. Air pressure propagation through Wind Cave and Jewel Cave: How do pressure waves travel through barometric caves? Int. J. Speleol. 2021, 50, 263–273. [Google Scholar] [CrossRef]
- Godissart, J.; Ek, C. Air CO2 in Comblain-au-Pont Cave (Belgium). Relationships with soil CO2 and open air meteorology. In Proceedings of the 16th International Congress of Speleology, Brno, Czech Republic, 21–28 July 2013; Filippi, M., Bosák, P., Eds.; Czech Speleological Society: Praha, Czech Republic, 2013; pp. 400–405. [Google Scholar]
- Bussani, A. Atmospheric tide effects in a Trieste karst cave: Preliminary results. Atti Memorie Comm. Grotte “E. Boegan” 2007, 41, 17–24. [Google Scholar]
- Chen, C.-H.; Sun, Y.-Y.; Lin, L.-C.; Han, P.; Yu, H.-Z.; Zhang, X.M.; Tang, C.-C.; Chen, C.-R.; Yen, H.-Y.; Lin, C.-H.; et al. Large air pressure changes triggered by P-SV ground motion in a cave in northern Taiwan. Sci. Rep. 2021, 11, 12850. [Google Scholar] [CrossRef]
- Lang, M.; Faimon, J.; Godissart, J.; Ek, C. Carbon dioxide seasonality in dynamically ventilated caves: The role of advective fluxes. Theor. Appl. Climatol. 2017, 129, 1355–1372. [Google Scholar] [CrossRef]
- Lang, M.; Faimon, J.; Kejíková, S. The impact of door opening on CO2 levels: A case study from the Balcarka Cave (Moravian Karst, Czech Republic). Int. J. Speleol. 2017, 46, 345–358. [Google Scholar] [CrossRef]
- Faimon, J.; Troppová, D.; Baldík, V.; Novotný, R. Air circulation and its impact on microclimatic variables in the Císařská Cave (Moravian Karst, Czech Republic). Int. J. Climatol. 2012, 32, 599–623. [Google Scholar] [CrossRef]
- Madonia, P.; Bonaccorso, A.; Bonforte, A.; Buonocunto, C.; Cannata, A.; Carleo, L.; Cesaroni, C.; Currenti, G.; De Gregorio, S.; Di Lieto, B.; et al. Propagation of Perturbations in the Lower and Upper Atmosphere over the Central Mediterranean, Driven by the 15 January 2022 Hunga Tonga-Hunga Ha’apai Volcano Explosion. Atmosphere 2023, 14, 65. [Google Scholar] [CrossRef]
- Perrier, F.; Bourges, F.; Girault, F.; Le Mouël, J.-L.; Genty, D.; Lartiges, B.; Losno, R.; Bonnet, S. Temperature variations in caves induced by atmospheric pressure variations–Part 2: Unveiling hidden thermal signals. Geosyst. Geoenviron. 2023, 2, 100146. [Google Scholar] [CrossRef]
Disclaimer/Publisher’s Note: The statements, opinions and data contained in all publications are solely those of the individual author(s) and contributor(s) and not of MDPI and/or the editor(s). MDPI and/or the editor(s) disclaim responsibility for any injury to people or property resulting from any ideas, methods, instructions or products referred to in the content. |
© 2023 by the authors. Licensee MDPI, Basel, Switzerland. This article is an open access article distributed under the terms and conditions of the Creative Commons Attribution (CC BY) license (https://creativecommons.org/licenses/by/4.0/).