Communication

A Compact NO2 Gas Sensor with an Optimized Photoacoustic Cell and 450 nm-LD

1
State Key Laboratory on Integrated Optoelectronics, Institute of Semiconductors, Chinese Academy of Sciences, Beijing 100083, China
2
College of Materials Science and Opto-Electronic Technology, University of Chinese Academy of Sciences, Beijing 100049, China
*
Author to whom correspondence should be addressed.
Atmosphere 2023, 14(4), 704; https://doi.org/10.3390/atmos14040704
Submission received: 8 March 2023 / Revised: 4 April 2023 / Accepted: 10 April 2023 / Published: 12 April 2023
(This article belongs to the Special Issue Advanced Photoacoustic Spectroscopy and Its Applications)

Abstract

:
In this paper, a compact ambient gas sensor with an optimized photoacoustic cell is reported. The relationship between the geometric dimensions (usually radius and length) of the photoacoustic cell (PAC) and the acoustic signal was studied through theoretical and finite element analysis. Then an optimized H-type PAC with a volume of 80 mm × 30 mm × 30 mm was machined out. The gas capacity is only 18.85 millilitres. The performance of the photoacoustic cell has been verified experimentally by the detection of nitrogen dioxide ( NO 2 ) standard gas. With an electret microphone and an economically self-designed 450 nm laser module, the detection of NO 2 concentration was executed. The experimental results show good linearity with a fitting R-square of 0.9991. With an SNR (signal-to-noise ratio) of 41.247, the minimum detection limit (MDL) of the system can reach 4.85 ppb (1 σ ). With an analysis of allan variance, the MDL can achieve 0.11 ppb with a 228 s integration time. By replacing the light source, the system shows great potential for sensitive and compact detectors for other ambient gasses as well.

1. Introduction

With the development of human society, gas sensing technology plays a vital role in various fields, such as environmental protection, medical diagnosis and industrial monitoring [1,2,3,4]. In recent years, the demand for trace gas sensing technology has been increasing due to global warming and increased polluting gas emissions. From the perspective of spectroscopy, gas sensing technology can be usually divided into non-spectral methods and spectral methods. The spectral methods include tunable diode laser absorption spectroscopy (TDLAS), Fourier transform infrared spectroscopy (FTIR), nondispersive infrared (NDIR), cavity ring-down spectroscopy (CRDS), and photoacoutic spectroscopy (PAS) [5,6,7,8,9,10]. Compared with the non-spectral methods, including electrochemical sensing technology, solid dielectric gas sensors and oxide semiconductor materials [11,12], spectral methods have the advantages of high sensitivity, fingerprint absorption characteristics and fast response time. For decades, spectral methods for gas sensing have been widely used and developed.
The detection of nitrogen dioxide ( NO 2 ) is a representative example. NO 2 is one of the most common pollutants that cause photochemical smog and acid rain. According to WHO’s suggestion, when the concentration of NO 2 is higher than 106.4 ppb, it can cause significant health effects and great harm to the human body [13]. However, in cities with heavy traffic and primary industries, the NO 2 concentrations often exceed this value. So reliable real-time detection of nitrogen dioxide concentrations is of paramount importance. Traditional means of monitoring the concentration of nitrogen oxides generally use chemiluminescence technology and wet chemical analysis technology [14,15]. Although these methods are relatively mature and widely used, researchers have done much work on optical gas detection to achieve better detection performance. A large number of nitride sensors with different optical technologies have been developed over the past decades. As early as 2008, Kalkman, J. et.al. reported a ppb-detection of NO 2 with a simple photoacoustic setup [16]. Markku Vainio developed a cantilever-enhanced photoacoustic spectroscopy (CEPAS) based sensor in 2015. The system can achieve a 50 ppt detection limit with a 4.7 W power [17]. The development of using NDIR to measure nitrides was summarized in detail in JE Thompson’s work [18]. In 2020, Fei Zheng et al. demonstrated a TDLAS-based nitric oxide (NO) gas sensor with a quantum cascade laser and reached a detection limit of 28 ppb over 180 s integration time [19]. In the same year, Gang Li reported their accurate analysis above the spectral line data of NO 2 , which is essential for the TDLAS system [20]. Fortunately, the detection limits below 1 ppb have been demonstrated in PA measurements with high-power lasers and sensitive microphone [21,22]. Liu put forward a scheme for nitride measurement using CRDS technology [23], and Li proposed a quartz-enhanced photoacoustic (QEPAS) sensor for ppb-level NO 2 detection [24]. Their systems can retrieve fast variations in ambient NO 2 . Among all these optical methods, PAS have the advantages of no background absorption, less dependence on absorption length and so forth. The gas concentration can be directly obtained by detecting the sound waves generated by the photoacoustic effect [25].
QEPAS can achieve urtra-compact size with a high sensitivity and have been developed rapidly [26,27]. However, the quartz forks can degrade due to prolonged exposure to the gas being measured which make it unsuitable for long-term stable measurements in confined spaces [28]. Instead, the traditional PAS system with a PAC and microphone is more appropriate. The PAC in a PAS system can be divided into two types: non-resonant and resonant according to the working mode. Usually, the resonant PAC can significantly improve the SNR, so it can realize a meagre limit and continuous flow sampling detection of gas. However, the structure of the resonant PAC is relatively complex with a large volume. To get a compact structure and better performance, researchers have done quite a lot of work to design different kinds of PACs. Typical resonant PACs includes Helmholtz, H-type, T-type, their different combinations, and the optimization of PAC revolves around these types. A T-type PAC was proposed by Gong, and the system achieved a 0.7 ppb C 2 H 2 . Its volume was 180 mm × 20 mm × 20 mm [29]. Gong designed an H-type PAC with a volume of 240 mm × 24 mm × 24 mm and reached a 1.26 ppb detection limit of NO 2 [30]. Cao et al. introduced a differential photoacoustic spectrometer, consisting of two 220 mm × 70 mm × 70 mm H-type PACs [31]. The system can measure aerosol and NO 2 at the same time. A sphere-tube coupled PAC was developed to improve detection sensitivity, composed of a diffuse-reflective sphere and an acoustic resonance tube. The MDL of the system can reach 0.27 ppb in a 645 s average time [32]. It can be easily found that the volume of these PACs is too large to restrict the ability to measure in a small space. So it is crucial to decrease the volume of the PAC without compromising detection capabilities.
In order to solve the above problems, this paper first analyzes the mechanism of photoacoustic signal generation and then optimizes the PAC by changing its radius and length. An optimized PAC with a volume of 80 mm × 30 mm × 30 mm is designed through finite element analysis. Then a highly self-made NO 2 detection system with a 450 nm LD is demonstrated, and its performance was evaluated at different concentrations of NO 2 . The MDL of the system can achieve 4.85 ppb in a 2 s integration time. Through the comparison with other reports, it can be found the volume of the PAC is decreased, and the performance is not reduced.

2. Principle

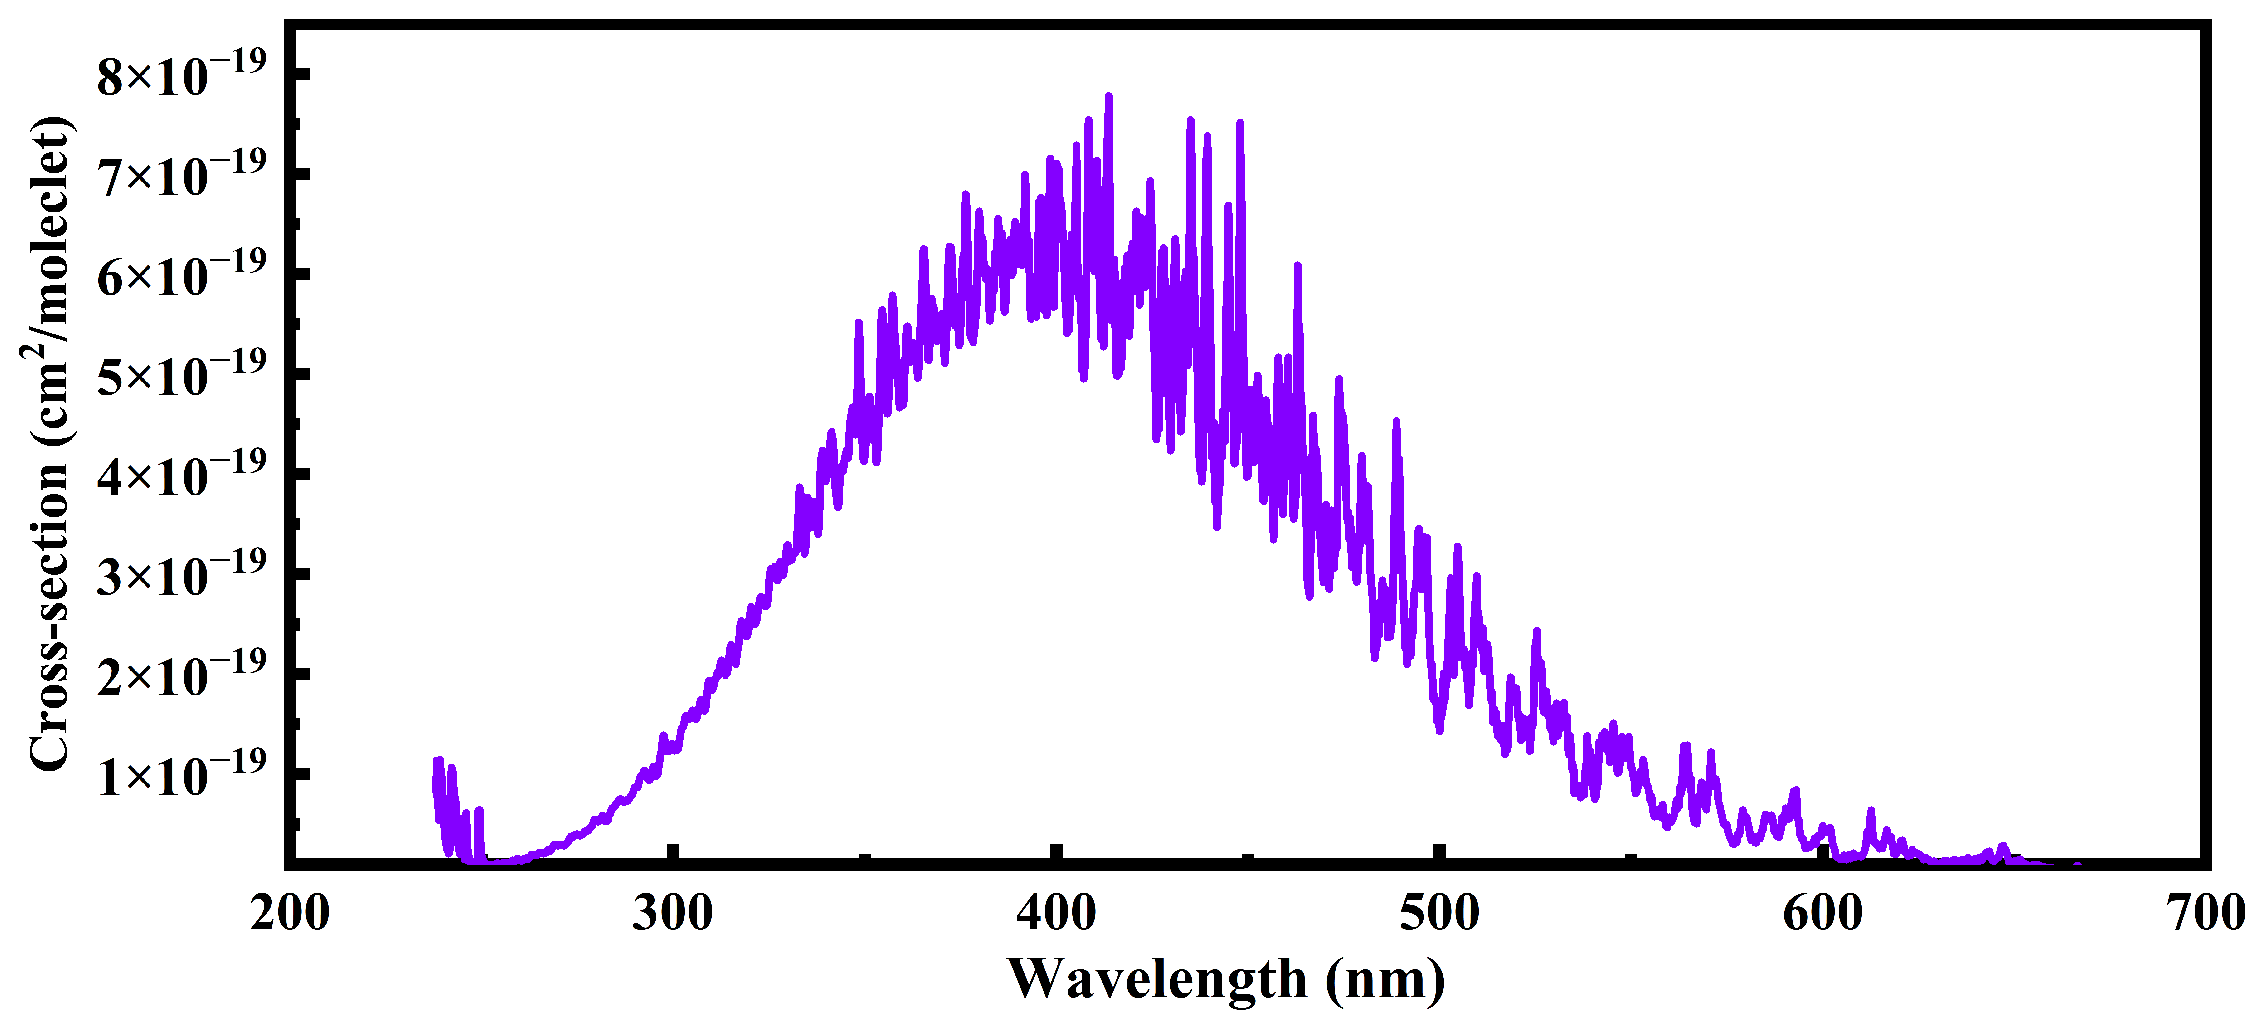
2.1. Gas Absorption Line Selection

Based on the HITRAN database, a strong broadband absorption from 250 nm to 600 nm of NO 2 can be obtained [33]. The maximum cross-section of 7.4 × 10 19 cm 2 /molecule in this area at 414 nm is strong enough to ensure a high SNR. However, Nitrogen dioxide exhibits a photolysis effect under the illumination of 420 nm. It can be photolyzed to nitric oxide and oxygen as follows [34]:
N O 2 + h v N O 2 * N O + O
O 2 + O + M O 3 + M
So the condition of the induced light that the wavelength is over 430 nm should be met. The cross-section line located at 450 nm satisfies the measurement requirements with an intensity of 4.8 × 10 19 cm 2 /molecule, as shown in Figure 1.

2.2. The Generation of Photoacoustic Signal

Photoacoustic spectroscopy technology is based on photoacoustic effect [25]. The gas molecules absorb the energy of the induced light and release it in the form of heat energy. The periodic release of heat can lead to a synchronous change in pressure, which is what we call a photoacoustic signal. In the photoacoustic cavity, the gas will form a thermal power density source after absorbing the modulated light, which can be expressed as H ( r , t ) . If the gas can be approximated to be ideal, the process is represented by the wave equation of gas as follows [35]:
2 p 1 v 2 2 p t 2 = γ 1 v 2 H t
where p is the pressure in the cavity, γ = C p C v is the heat capacity ratio, and v is the sound velocity. Then the Helmholtz equation of the process can be obtained by Fourier transformation of the Equation (3):
2 + ω 2 v 2 p r , ω = γ 1 v 2 i ω H r , ω
the expression for p ( r , ω ) can be obtained by solving the non-homogeneous wave equation:
p ( r , ω ) = j A j ( ω ) p j ( r )
For p j ( r ) corresponding to the above formula, it can be obtained by solving the Helmholtz equation and boundary conditions.
For an H-type photoacoustic cell, it always works in the first-order longitudinal mode, which means [qmn] is equal to [100], and the amplitude of the photoacoustic signal can be expressed as [30]:
p ( r , ω j ) = ( γ 1 ) Q j L p j ( r ) V p j * r g ( r ) d V V ω j C α P l i g h t
In the formula, ω j is the lowest order normal angular frequency, Q j is the quality factor, V is the cavity volume, α = N σ is the gas absorption coefficient, σ is the cross-section of the detected gas, P l i g h t is the optical power, g ( r , ω ) is the normalized light intensity distribution, which usually presents a Gaussian distribution.
And the electrical signal induced by acoustic wave signal can be expressed as:
S PA = S · p ( r , ω j ) = C cell α P light SC
where C c e l l = ( γ 1 ) Q j L p j ( r ) V p j * r g ( r ) d V V ω j represents the photoacoustic cell constant, α is the absorption effect of the gas to be tested, P l i g h t is the light intensity, S is the microphone sensitivity, and C means the concentration of the gas.
An H-type photoacoustic is composed of one resonant cavity in the middle and two buffer cavities in both ends, its resonance frequency can be expressed as:
f = v 2 ( L + 16 3 π R r e s )
In the formula, R r e s represents the radius of the resonant cavity, v is the sound velocity.
The finite element simulation method is used to optimize the structure of the photoacoustic cell. In the simulation, the accurate setting of the boundary layer plays a significant role in the results. So the theoretical derivation and simulation process should be strictly consistent. The detailed simulation process will be exhibited in the experiment as follow.

3. Experiment Configuration

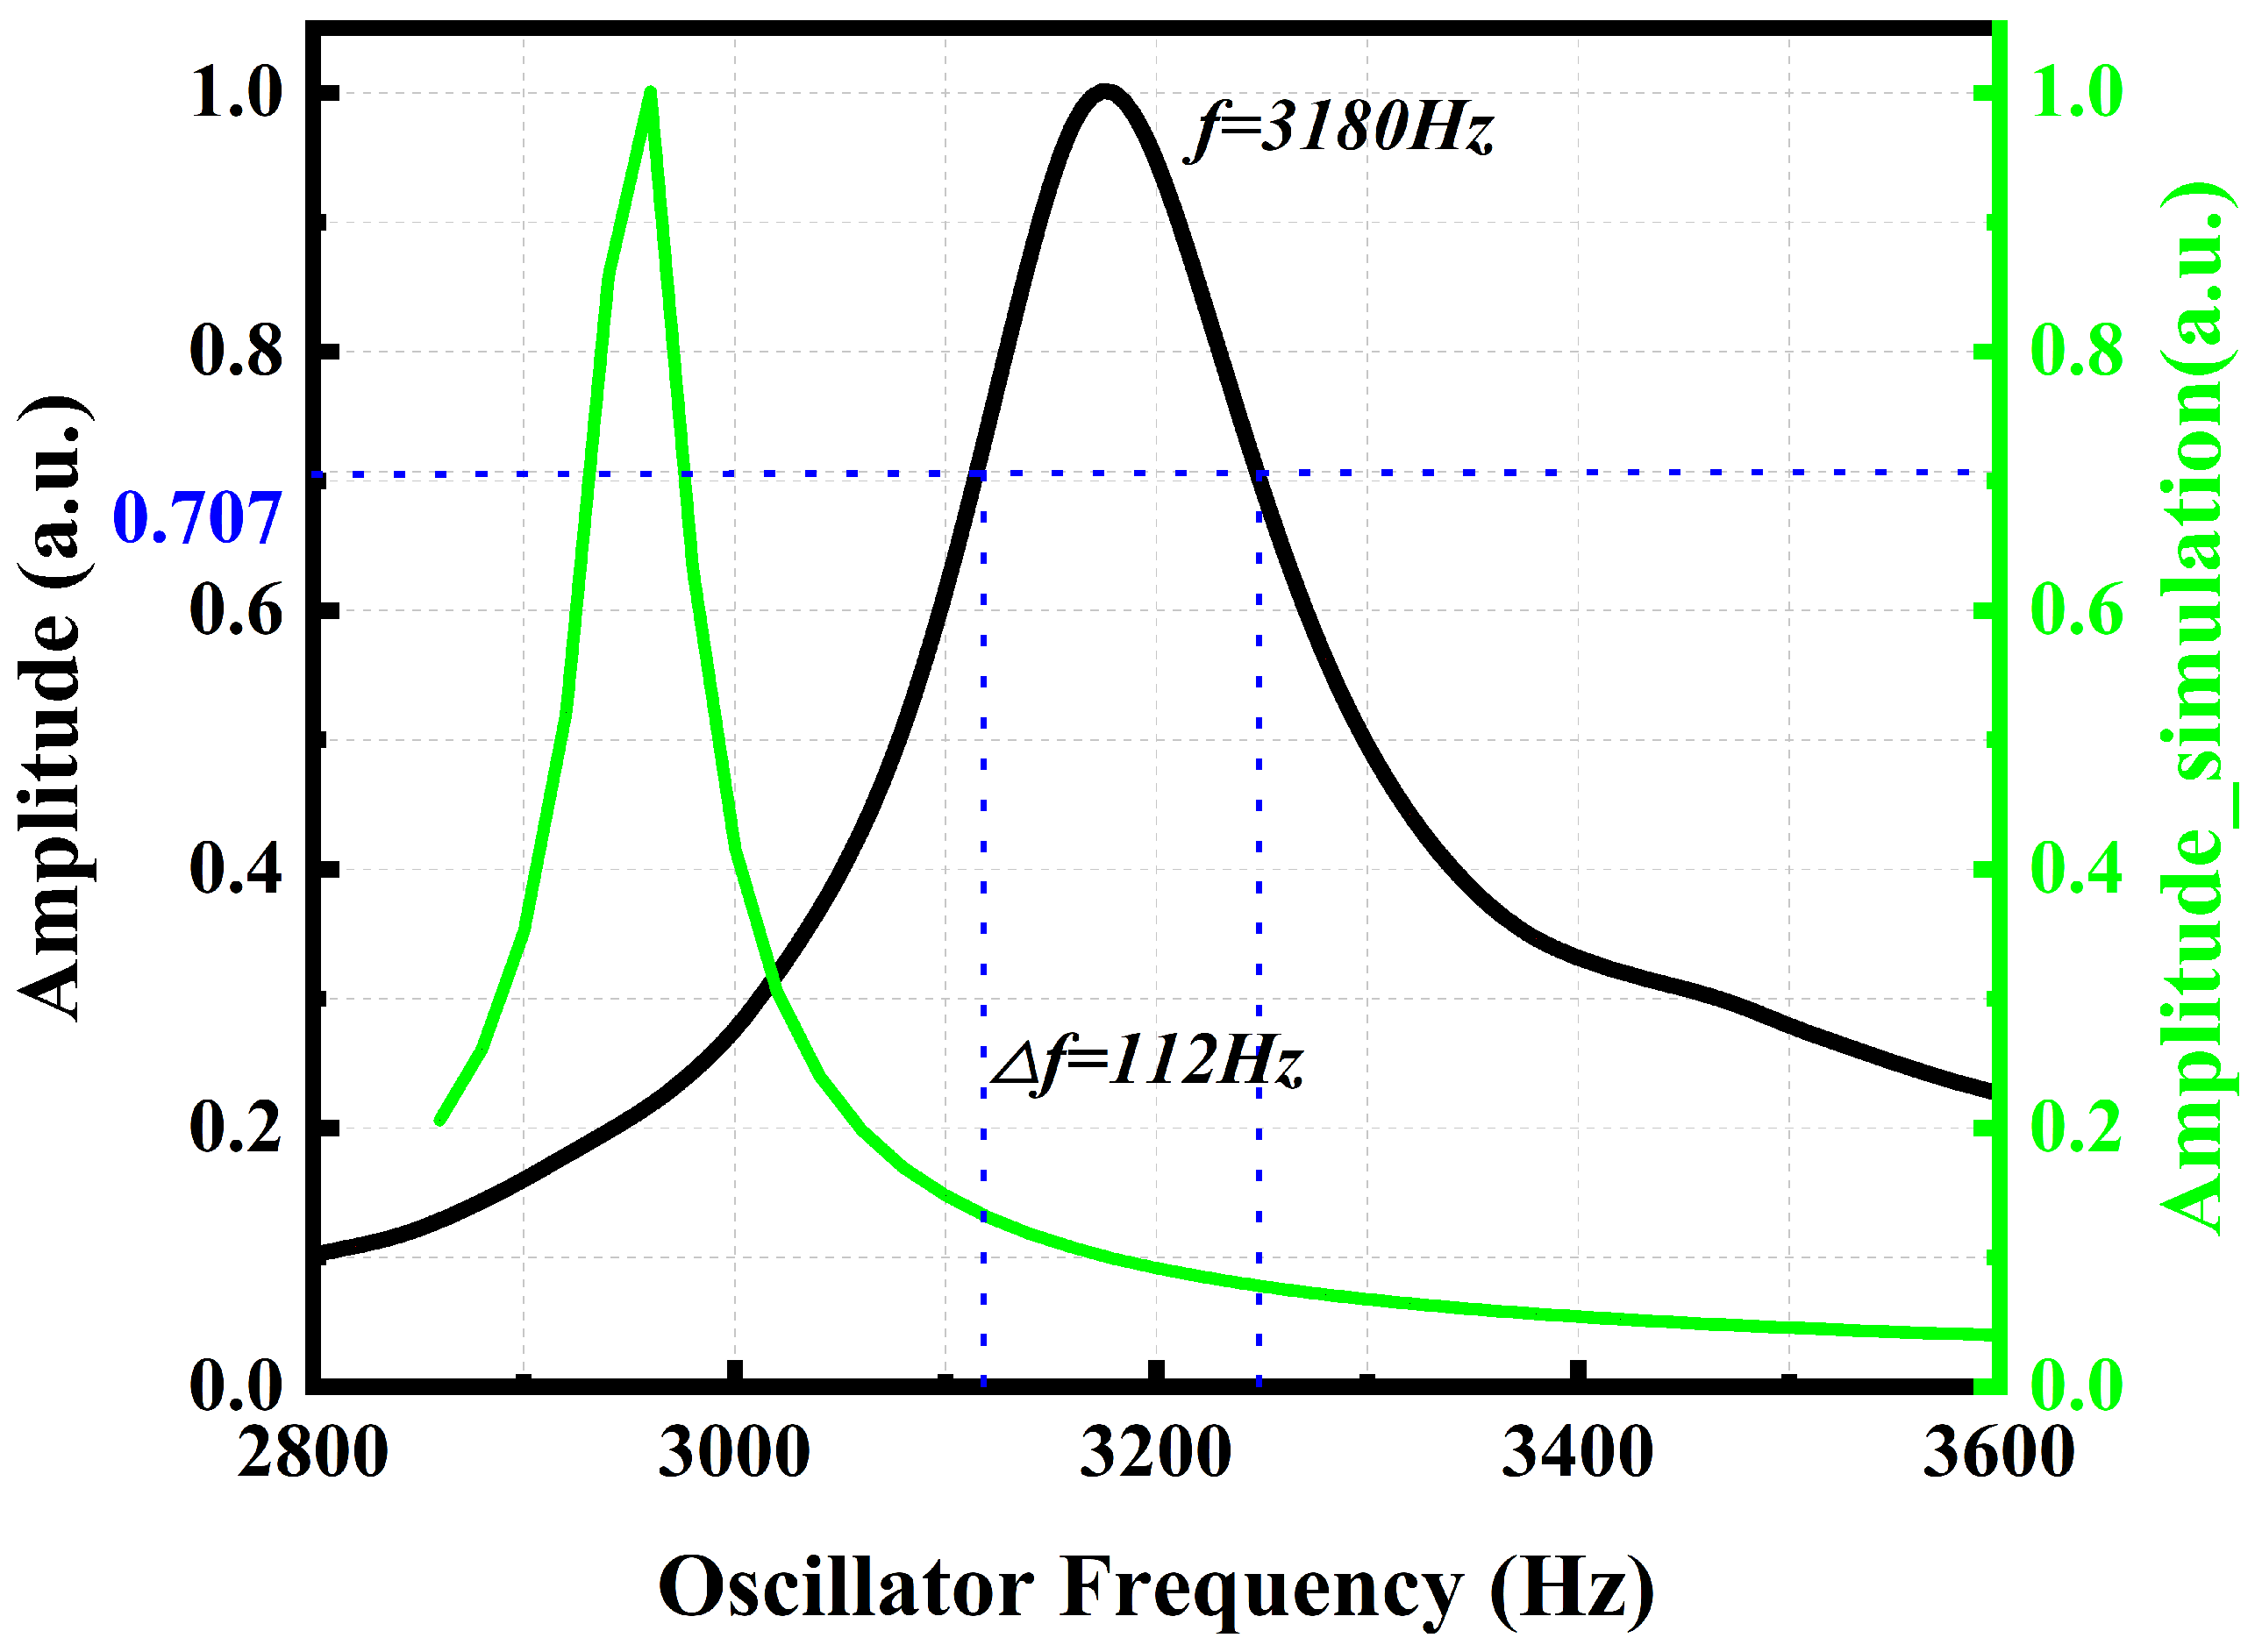
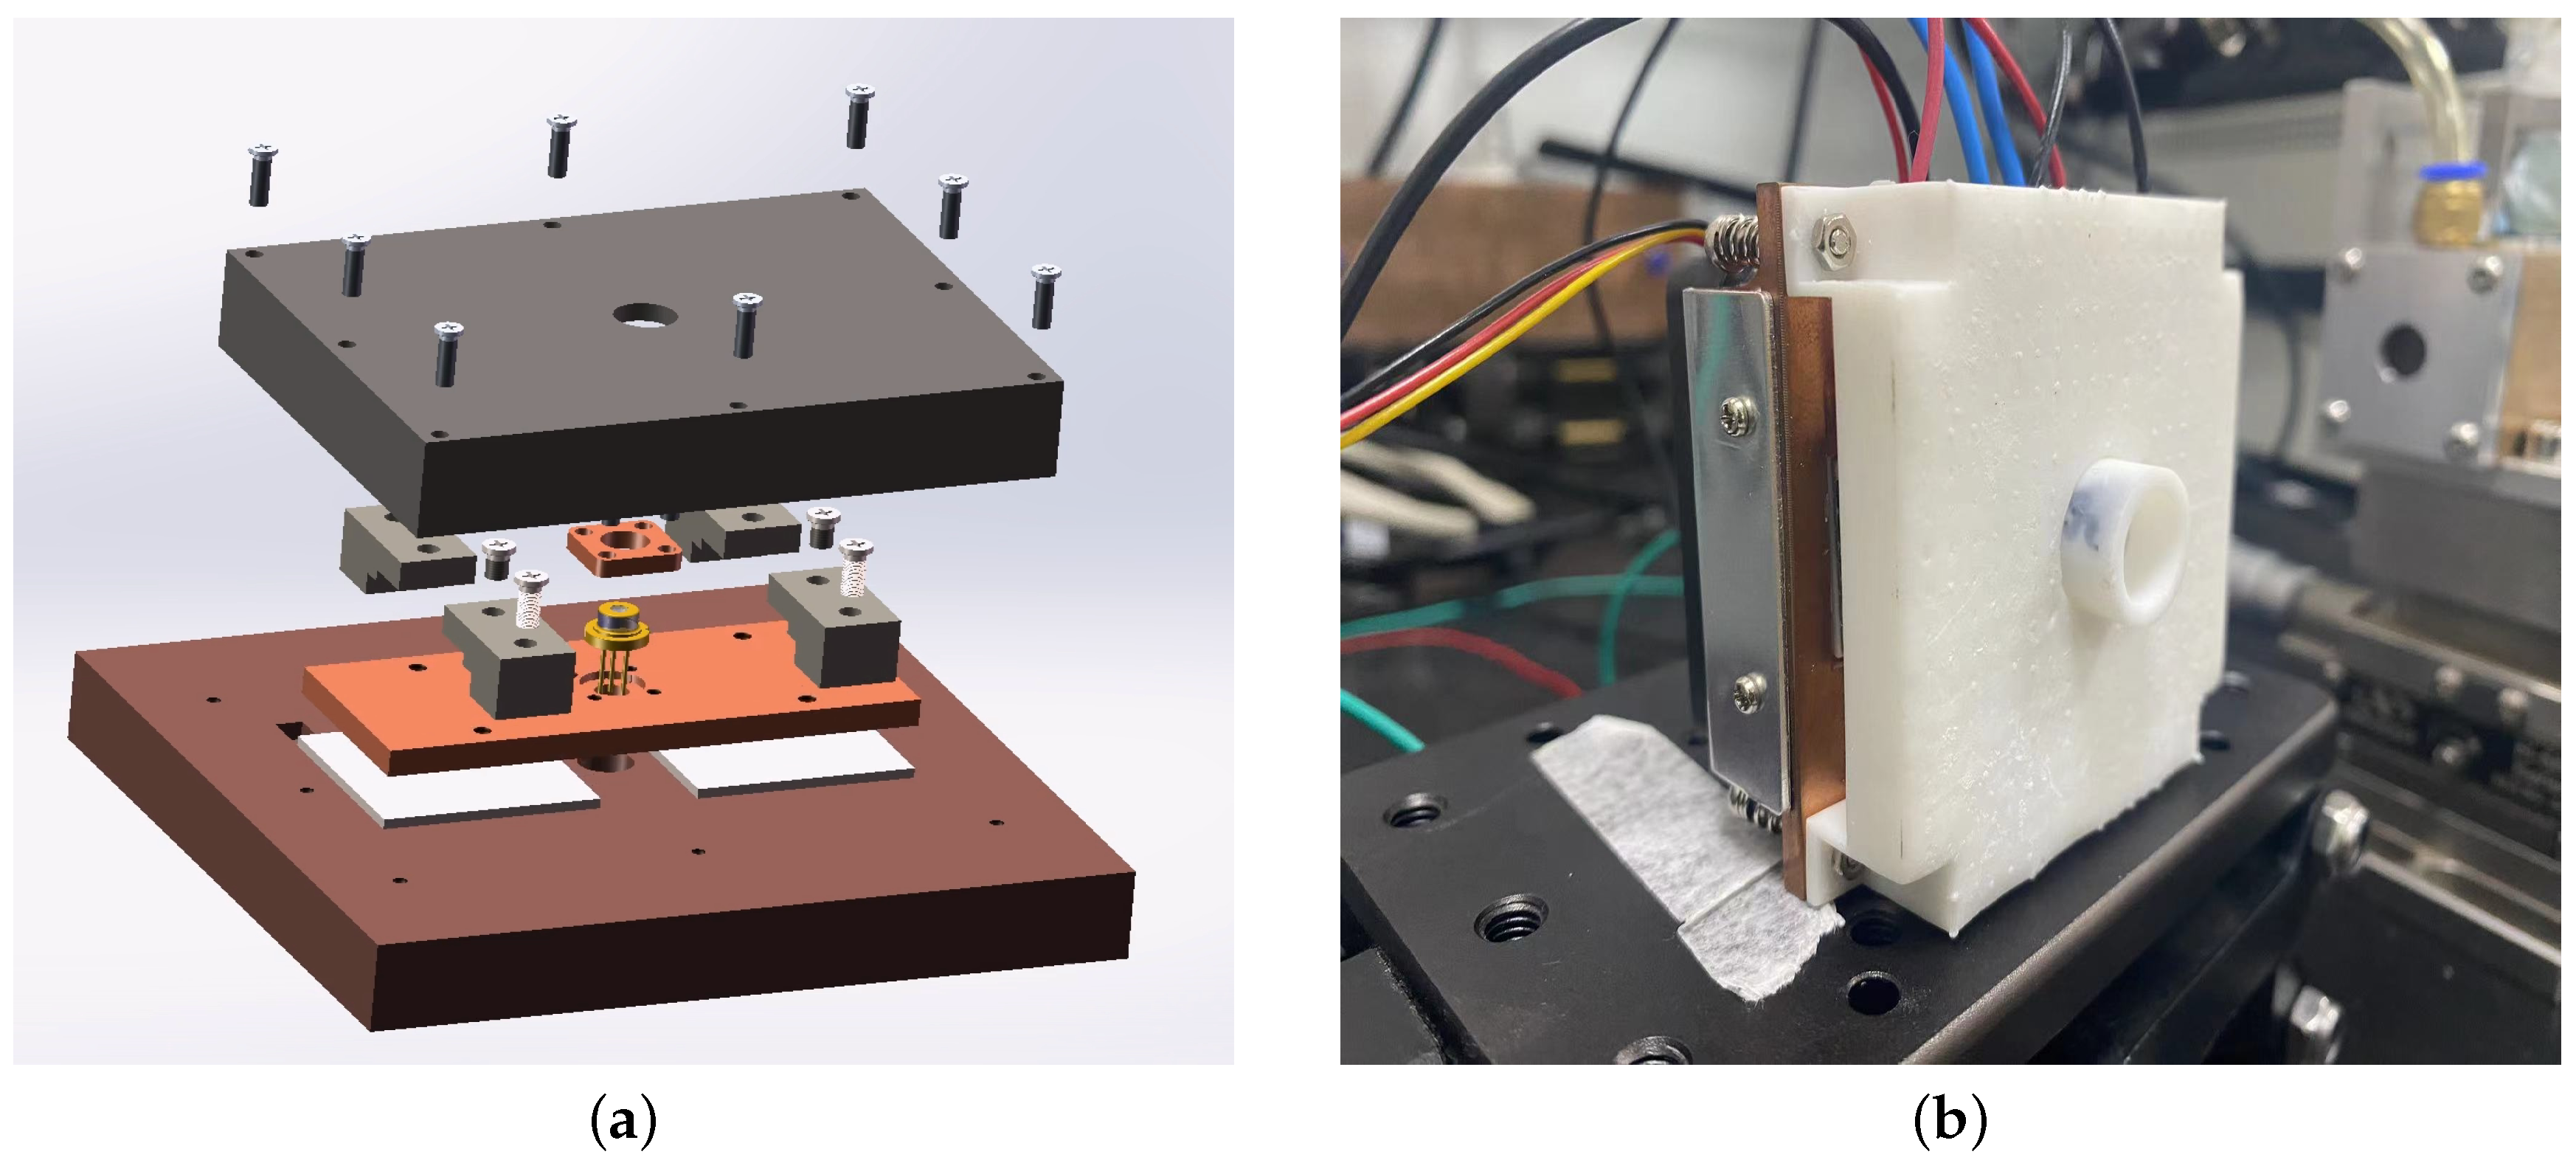
3.1. Photoacoustic Cell Design

As one of the most important parts of the resonant photoacoustic detection system, the PAC plays an influential role in the collection and amplification of the photoacoustic signals. Therefore, the optimization design of PACs is an important process in the whole system configuration. The finite element simulation is used in the process of PAC optimization design. In the simulation, the light source is set to a Gaussian light source, which is consistent with the actual situation. In the simulation process, we must consider obtaining a large photoacoustic signal and reducing the possibility of light hitting the wall at the same time. For these two points, we set the radius of the resonant cavity to 5 mm and the radius of the buffer cavity to 15 mm [36] with a 3 mm light spot. After that, the simulation parameters was changed in the following steps. First, adjust the total absorption path length to a given value. To be clear, the total absorption path length is the sum of the resonator cavity length and two buffer cavity lengths. Then we changed the resonator cavity length every 5 mm and recorded the results we need. Afterward, change the value of the total absorption length and repeat the previous two steps. The simulated resonance frequency and signal intensity are as shown in Figure 2. It can be seen that when the length of the buffer cavity is 10mm and the length of the resonant cavity is 60 mm, the photoacoustic signal reaches the maximum. The resonance frequency obtained by simulation is 2953 Hz. Compared with the H-type photoacoustic cell reported in the traditional literature, the volume has been reuduced by half with an excellent performance.
Since the H-type PAC works in the first-order resonance state, the modulation frequency of the light source should be adapted to the resonance frequency to ensure that we can get the maximum photoacoustic signal. From the simulation results, it can be seen that the theoretical resonance frequency is 2953 Hz, but considering the influence of temperature, humidity and the processing accuracy of the photoacoustic cell, it is necessary to calibrate the resonant frequency of the photoacoustic cell. So we introduced a specific concentration of NO 2 into the photoacoustic cell and scanned the frequency in the range of 2400–4000 Hz. In the meantime, the photoacoustic signals generated at different frequencies were recorded. The fitted curve is shown in Figure 3, from which it can be seen that the resonant frequency of the photoacoustic cell is about 3180 Hz. The blue line in the Figure 3 is at the 2 2 location of the maximum amplitude. The half-height width can be calculated to 116 Hz from the intersection of the blue line with the resonance curve. So the quality factor can be calculated to 27.4. The real resonant frequency is close to the simulation result, which can be used to support the reliability of simulation.

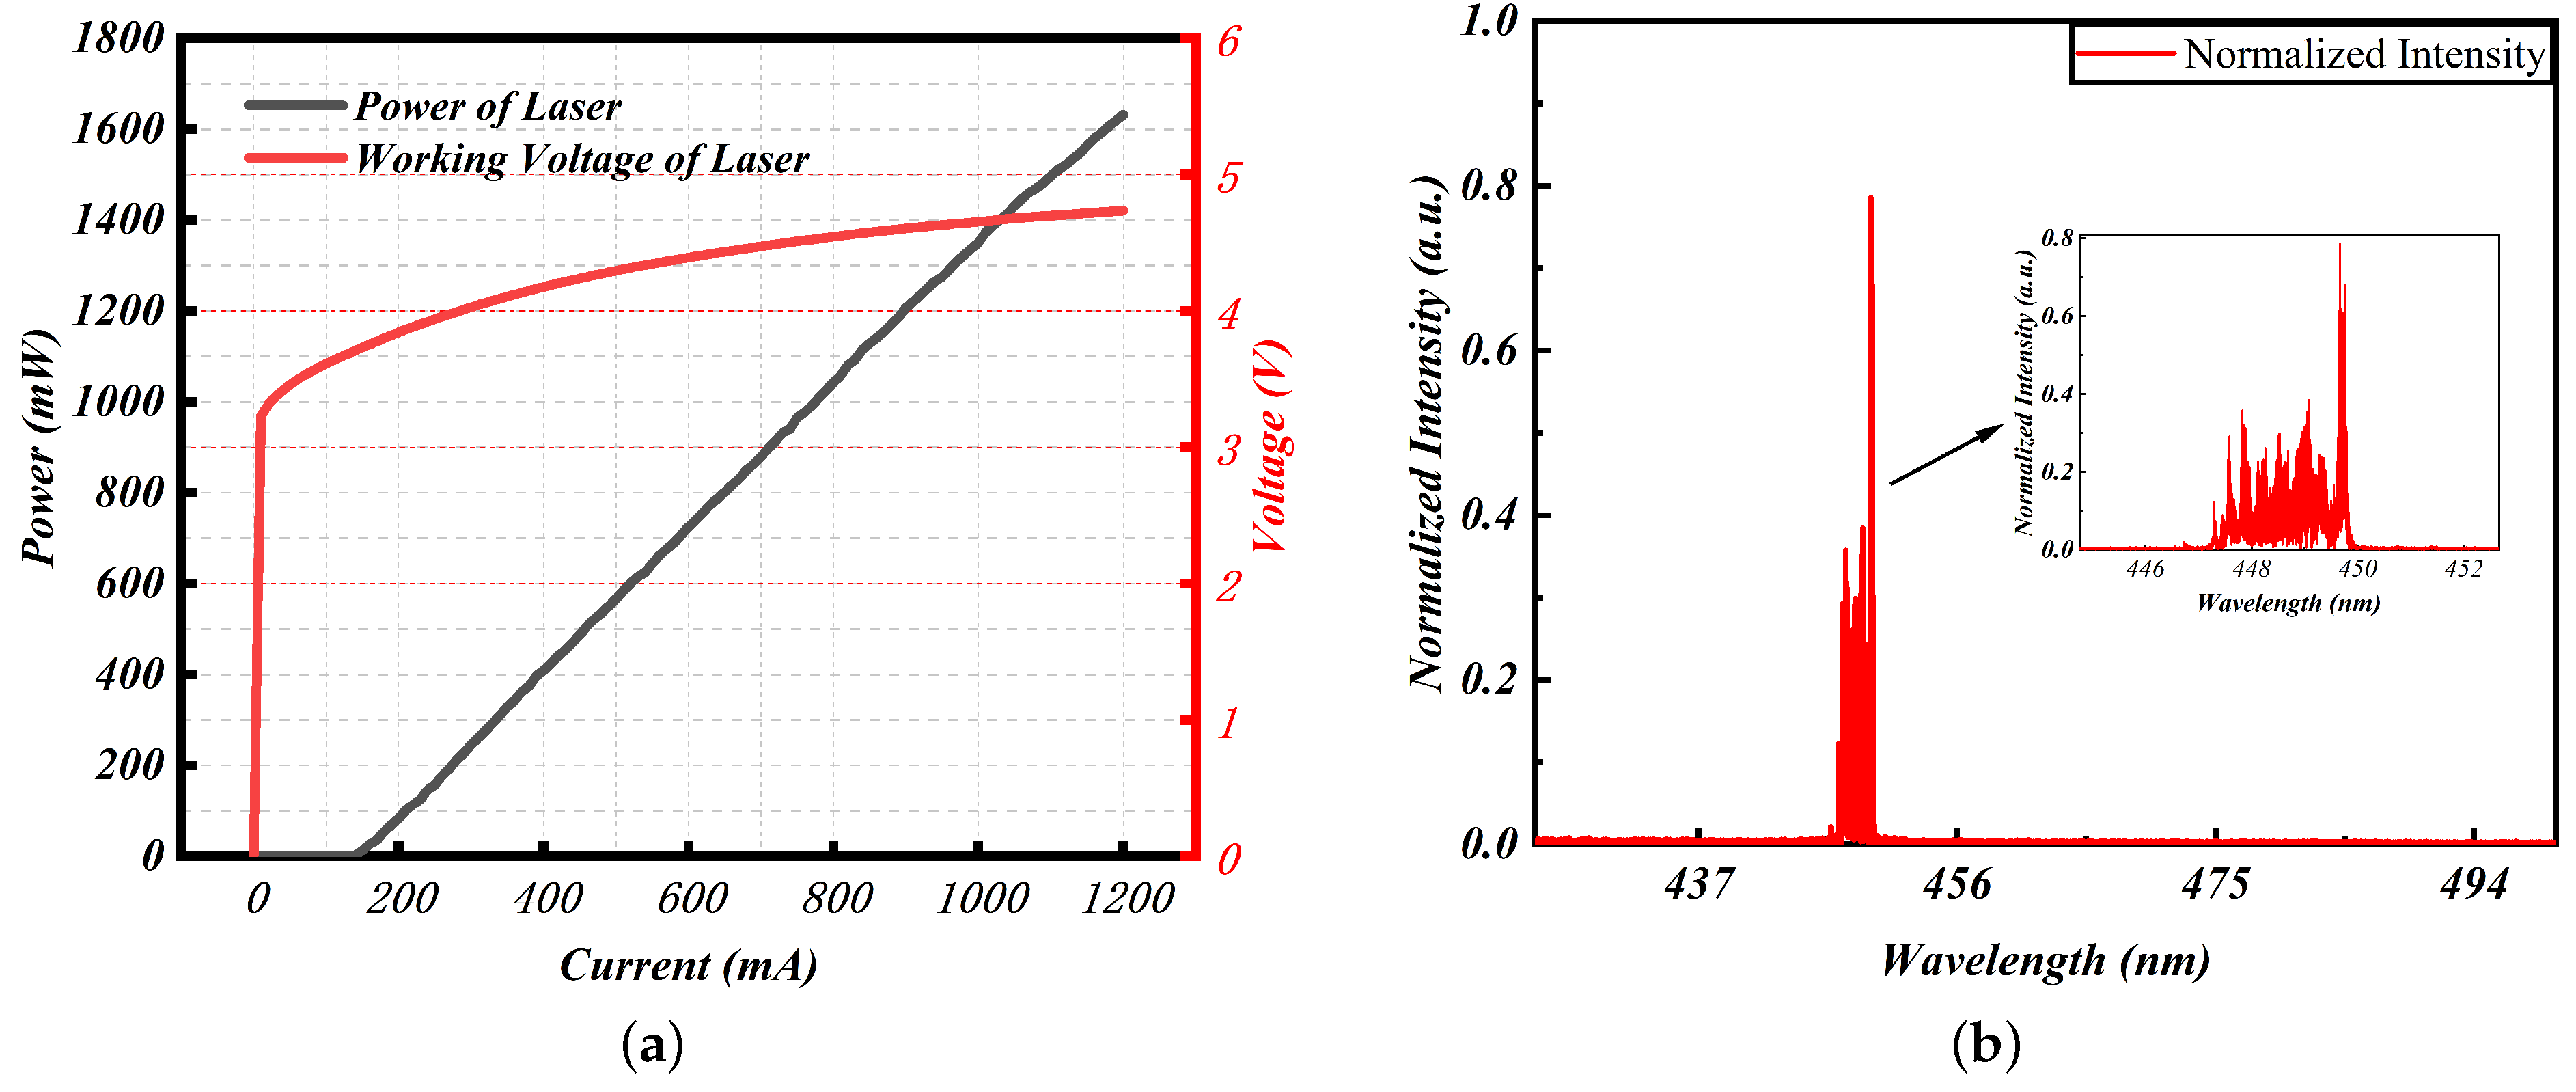
3.2. Excitation Light Source Selection

A 450 nm laser (L450P1600MM, Thorlabs, Newton, NJ, USA) with a maximum power of 1.6 W is utilized as the excitation source in the system. The laser has a multi-mode output with a beam divergence angle of 23 degrees in the vertical direction and 7 degrees in the parallel direction. So an aspheric condenser lens (ACL108U, Thorlabs) is used for beam shaping, resulting in a 3 mm diameter spot. Figure 4 shows a physical diagram of the packaged laser, whose total volume is 60 mm × 58 mm × 60 mm. The measured L-I-V (light-current-voltage) and spectrum is shown in Figure 5. The spectrum data was measured using a spectrum analyzer (OSA 201 spectrum analyzer, Thorlabs).
In the system, the square wave is used to modulate the excited light. During the modulation process, the duty ratio of the square wave will affect the intensity of the photoacoustic signal. The relationship between the duty cycle and the signal strength is studied. We use a signal generator (DG 3101A, RIGOL, Beijing, China) to apply a square wave modulated signal to the current controller (ITC4005-QCL, Thorlabs). Then the study starts with modulating the light to a specific frequency 3180 Hz corresponding to the resonance frequency of the photoacoustic cell. Then the duty cycle of the square wave at two different concentrations is changed with collecting the photoacoustic signal in the meantime. The test results are shown in Figure 6. From the results, it can be found that the photoacoustic signal reaches the maximum value when the duty cycle is 50%. So the duty cycle of the square wave in the system is set to 50%.

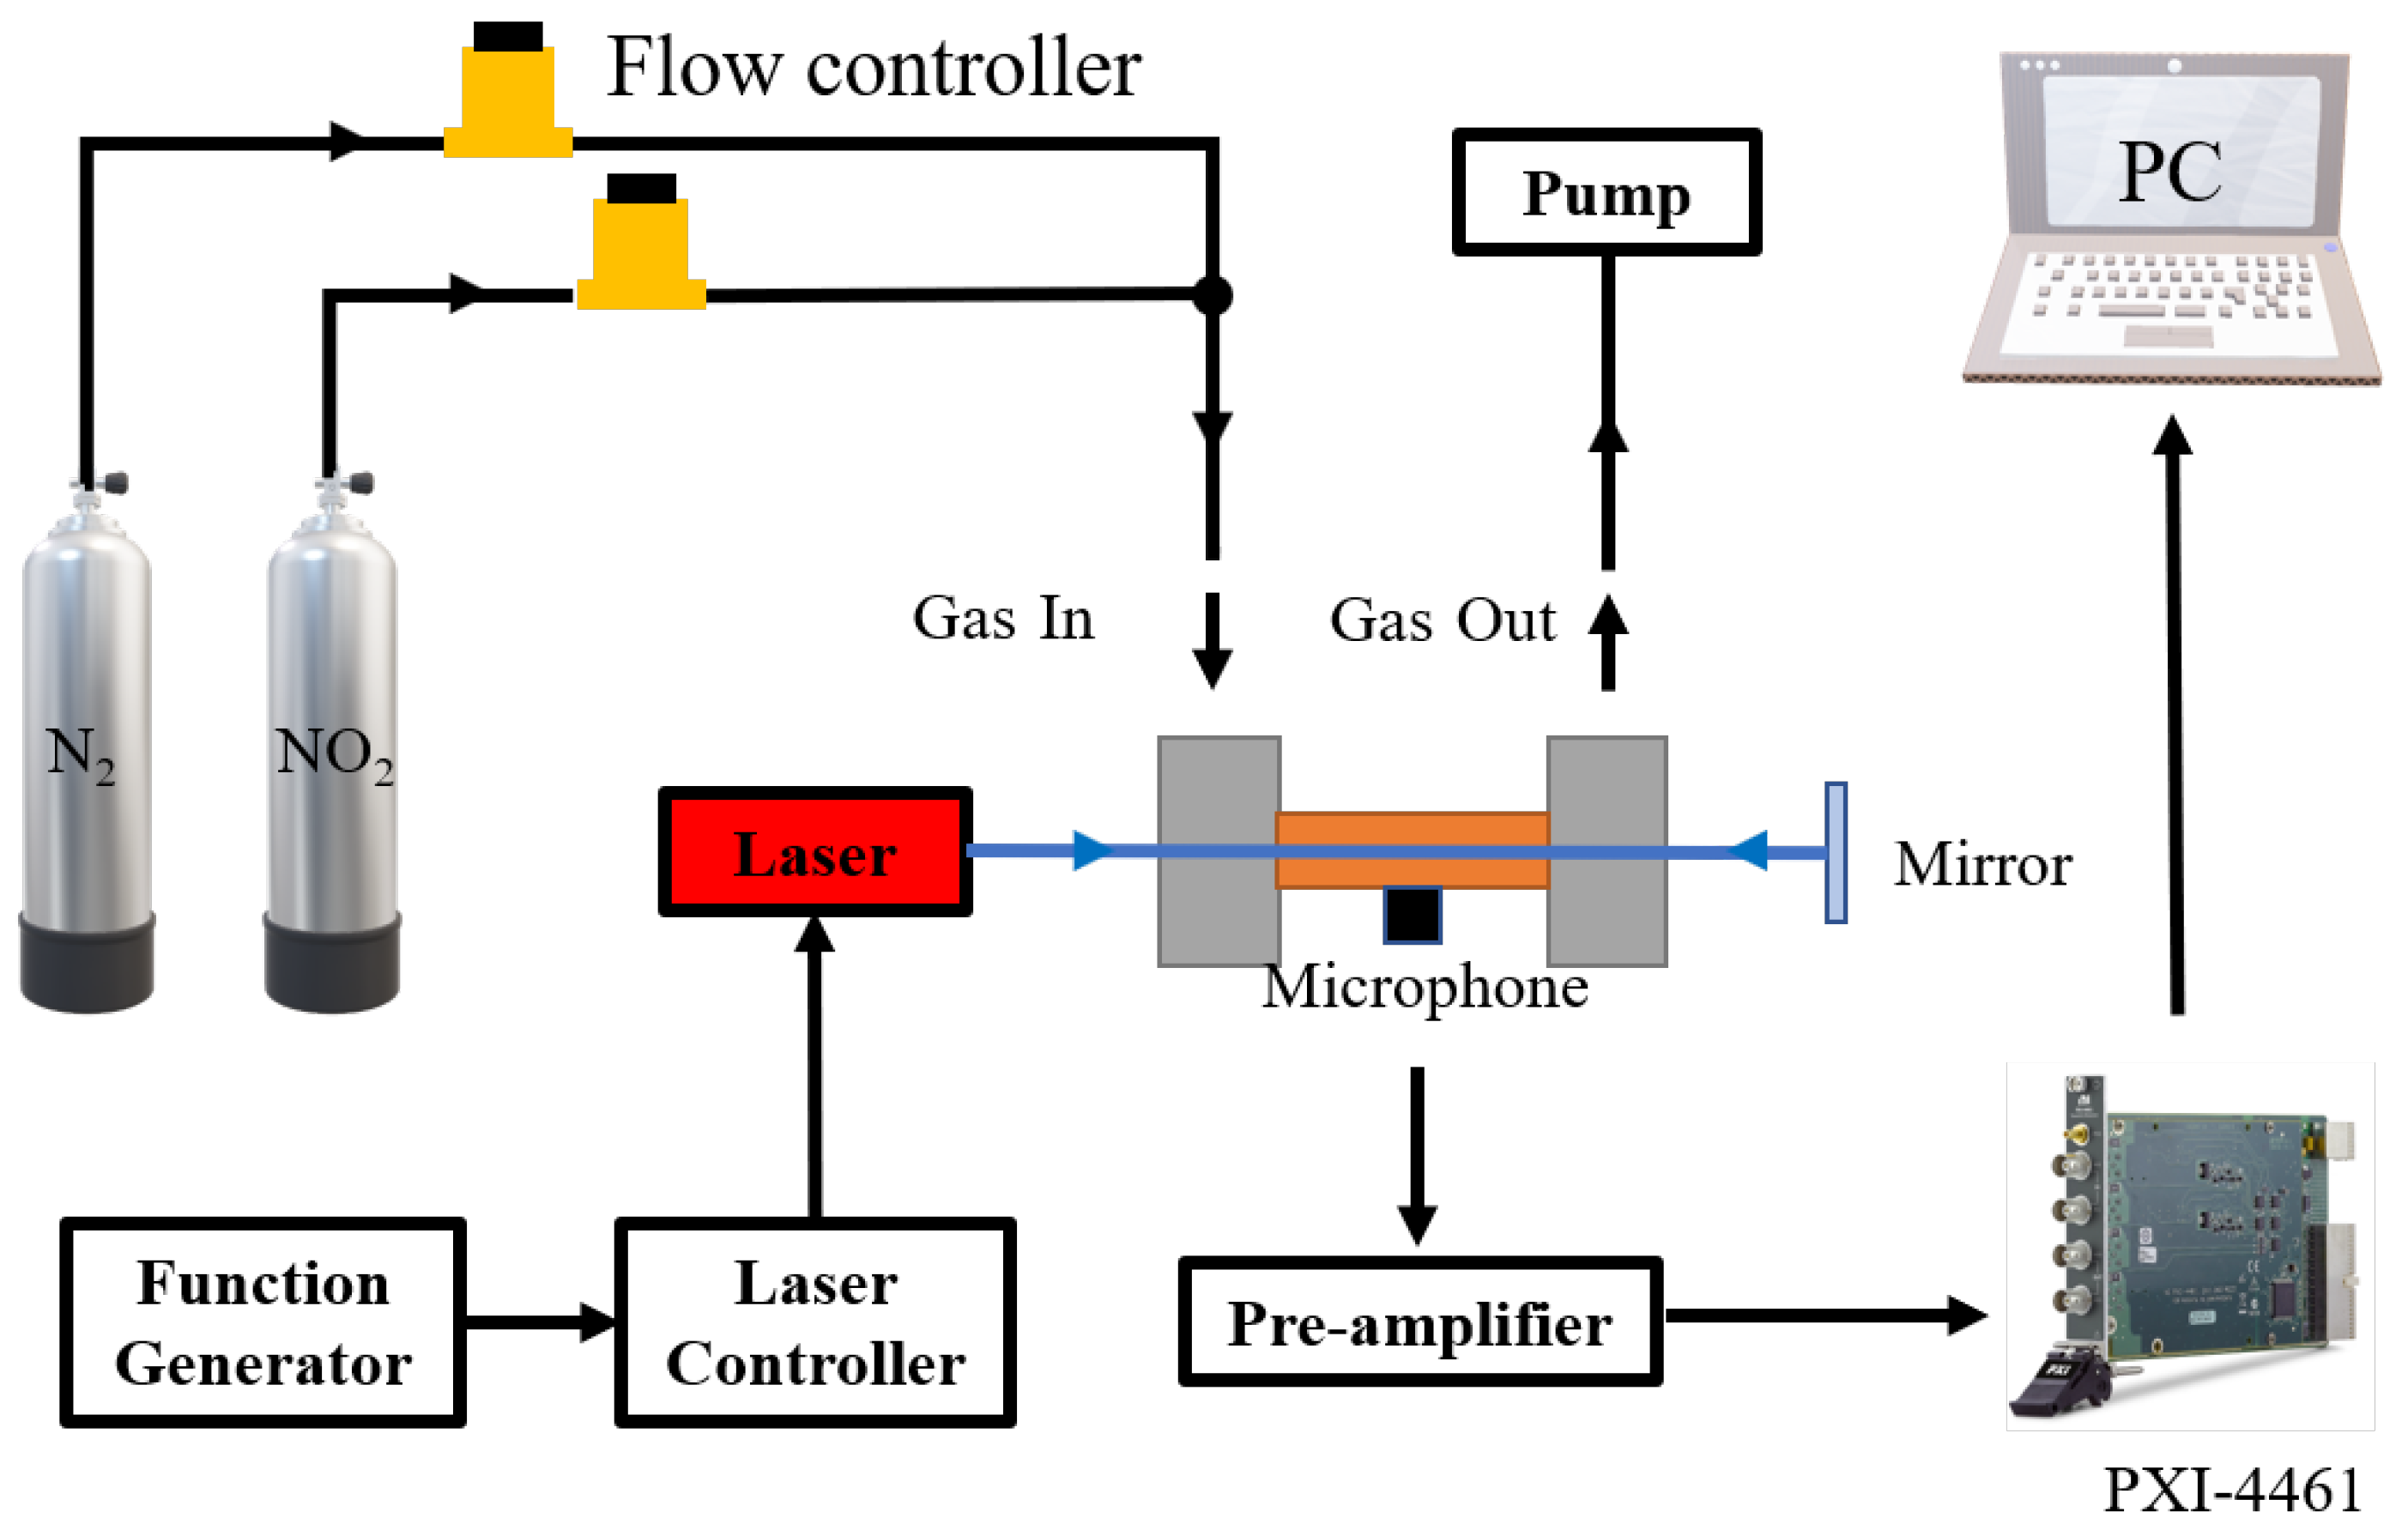
3.3. Experimental Set-Up

Figure 7 depicts the total schematic of the compact gas measurement system. The system comprises the optical section, mechanical structure and electrical section. In the system, a 450 nm LD is used as the excitation light. The light source is modulated by a square wave with a duty cycle of 50% and a frequency of 3180 Hz. Then the modulated light is absorbed by the NO 2 inter the photoacoustic cell and the photoacoustic signal is generated after the absorption. The acoustic signal is collected by an electret microphone (MPA201, BJSW, Beijing, China). After that, the signal from the microphone is pre-amplified and passed into the DAQ (Data Acquisition, PXI4461, National Instruments, Austin, TX, USA). All data are recorded and processed by LabVIEW software (2018, National Instruments) on a personal computer.

4. Results and Discussion

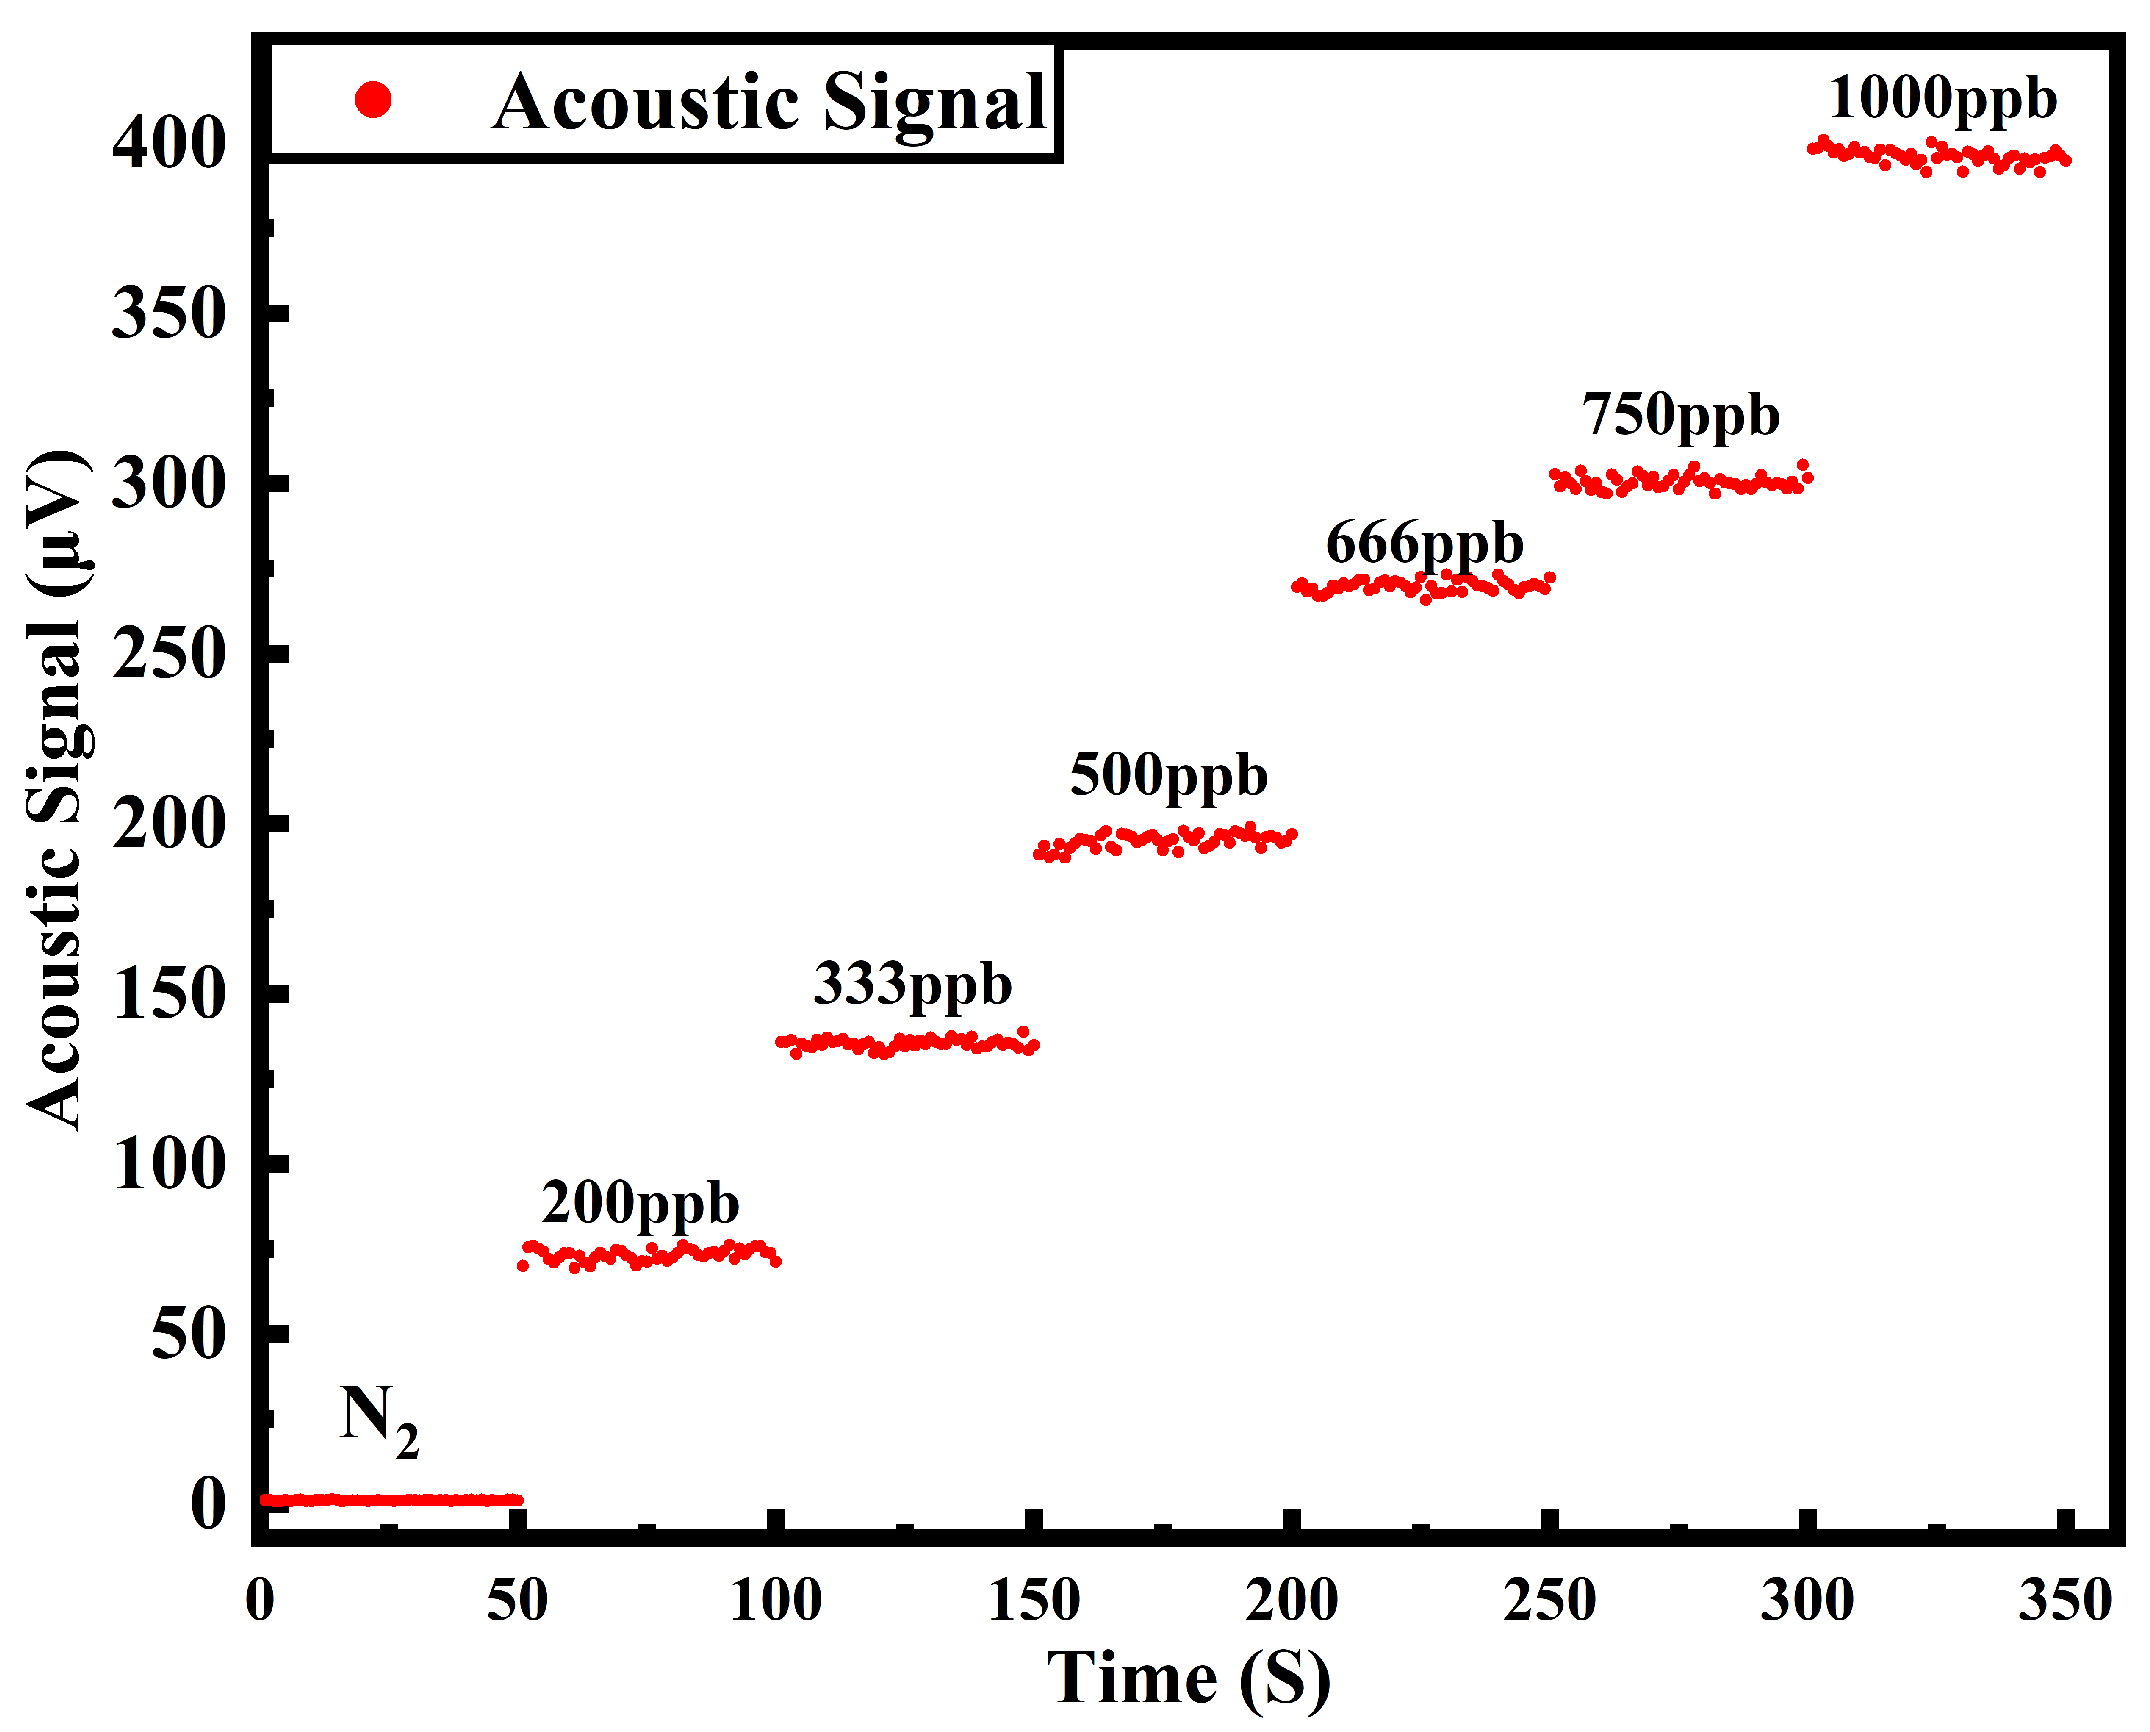
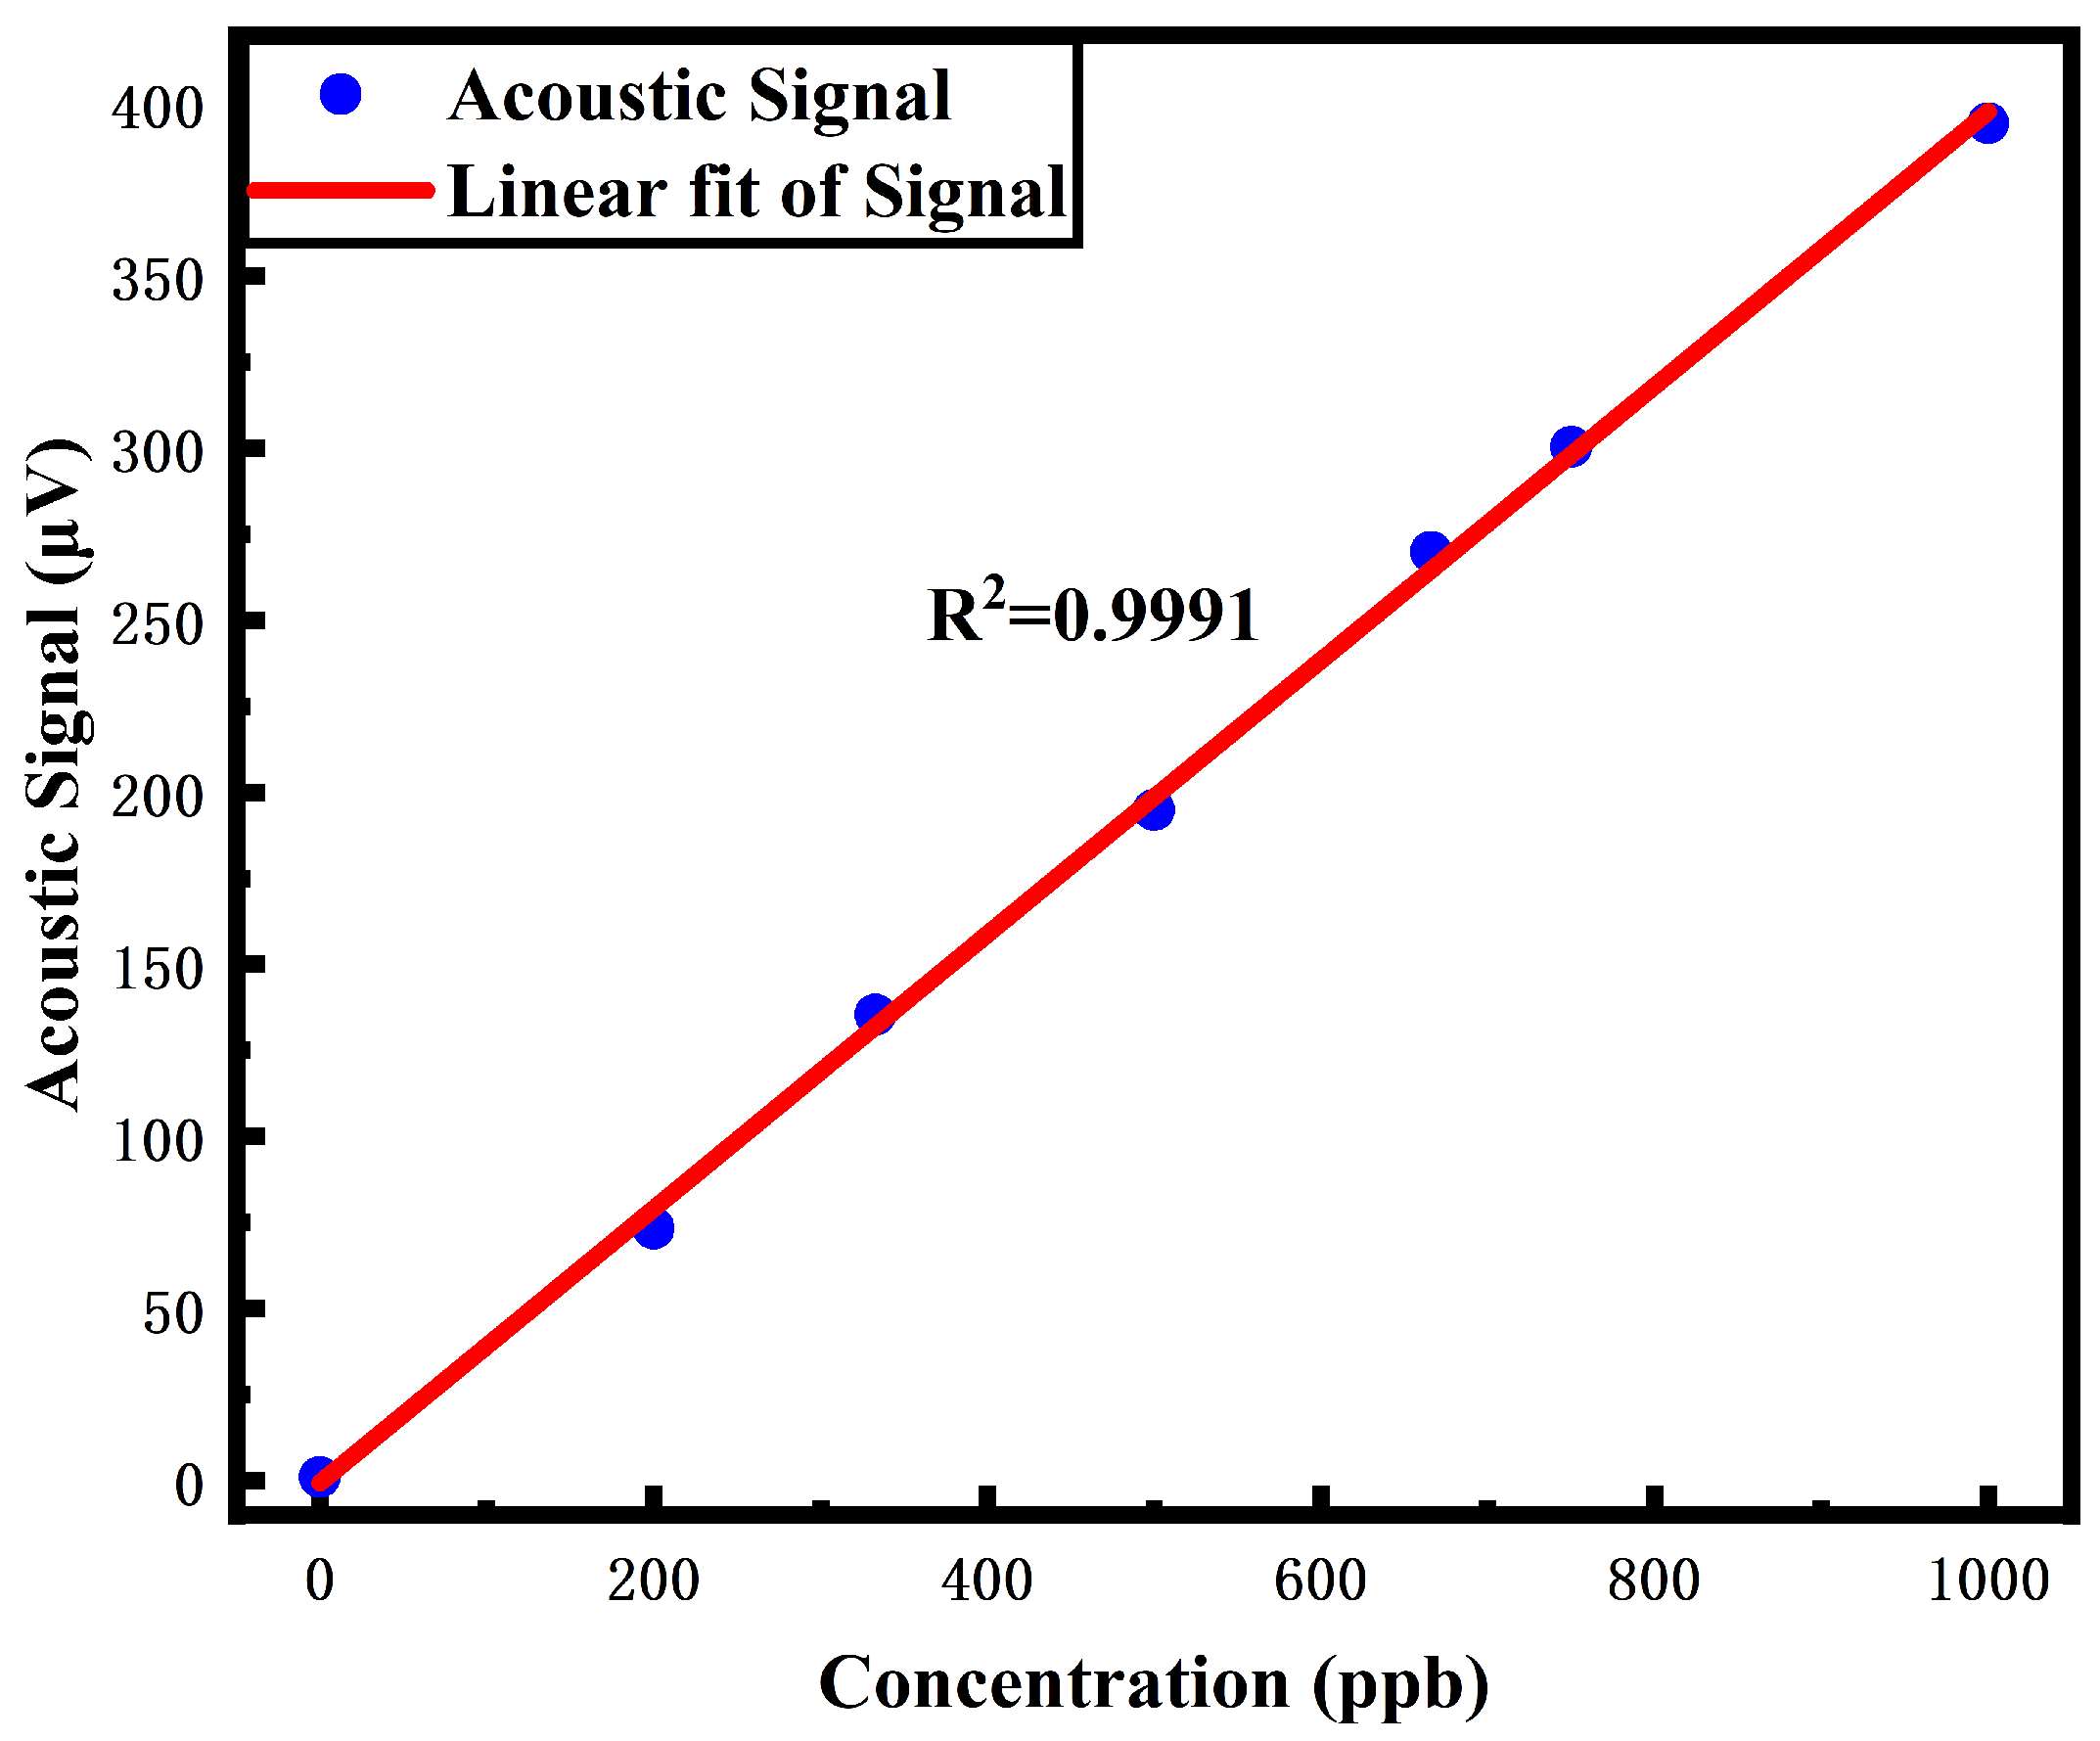
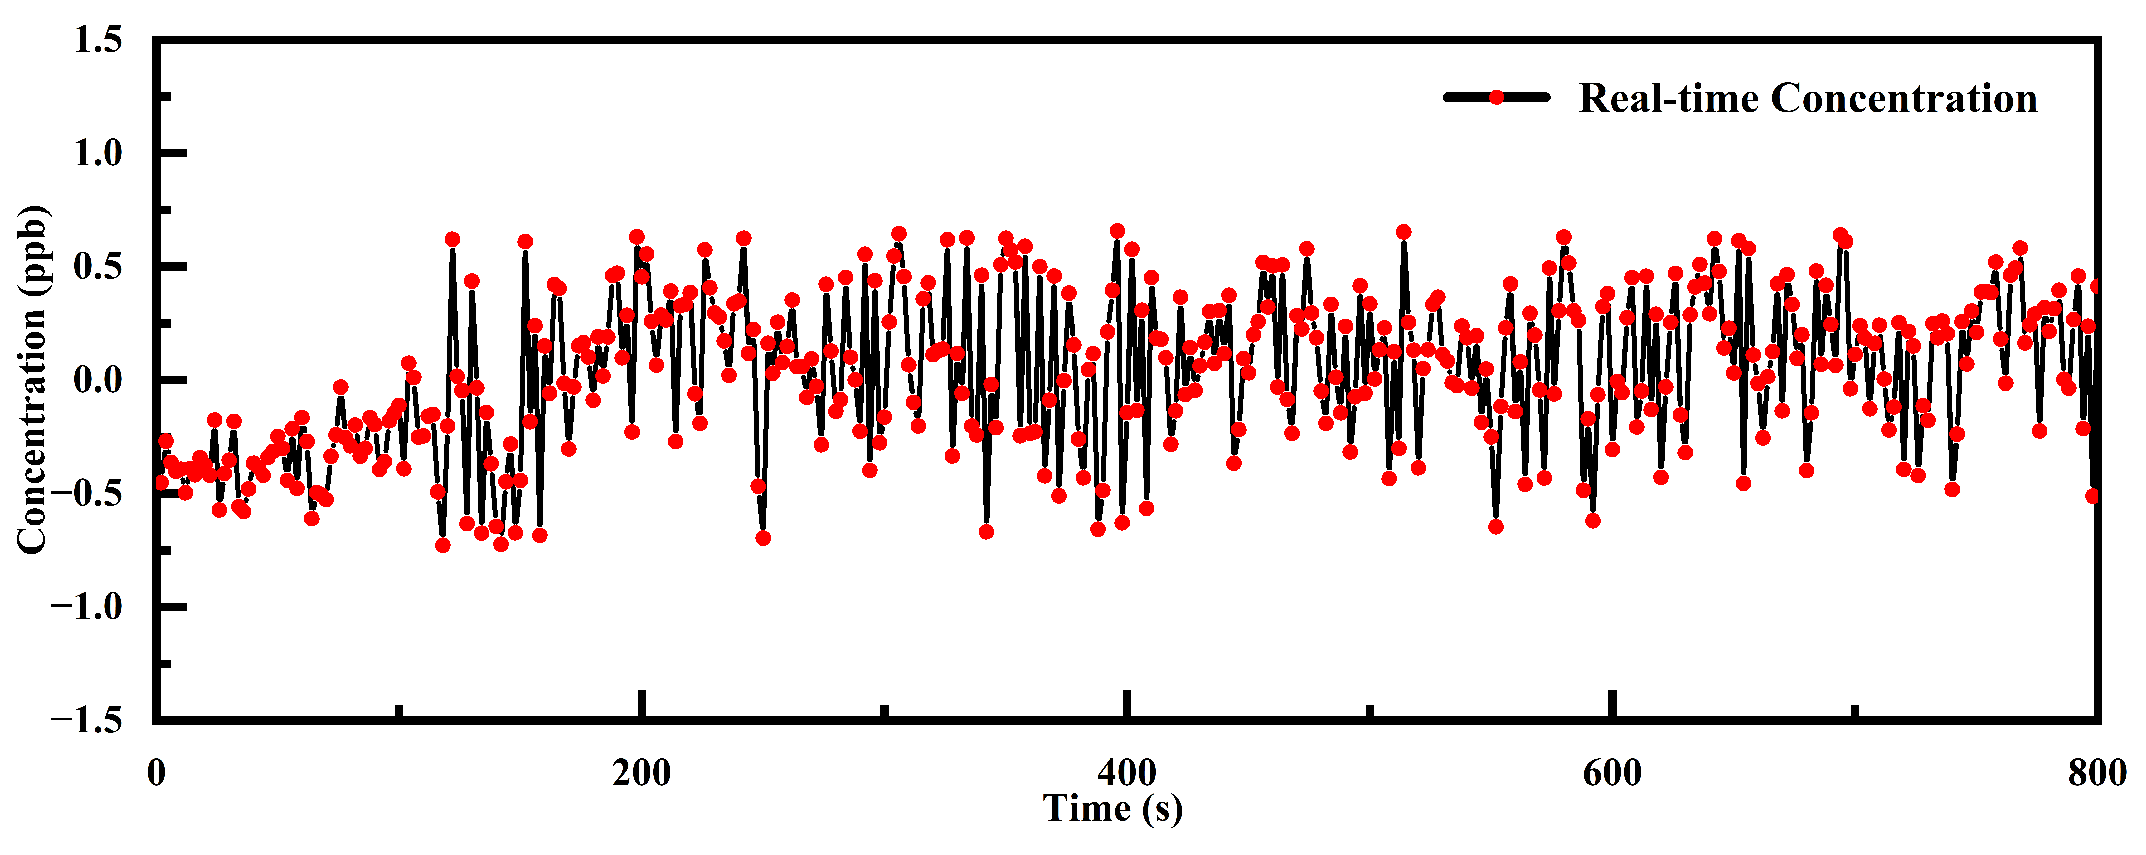
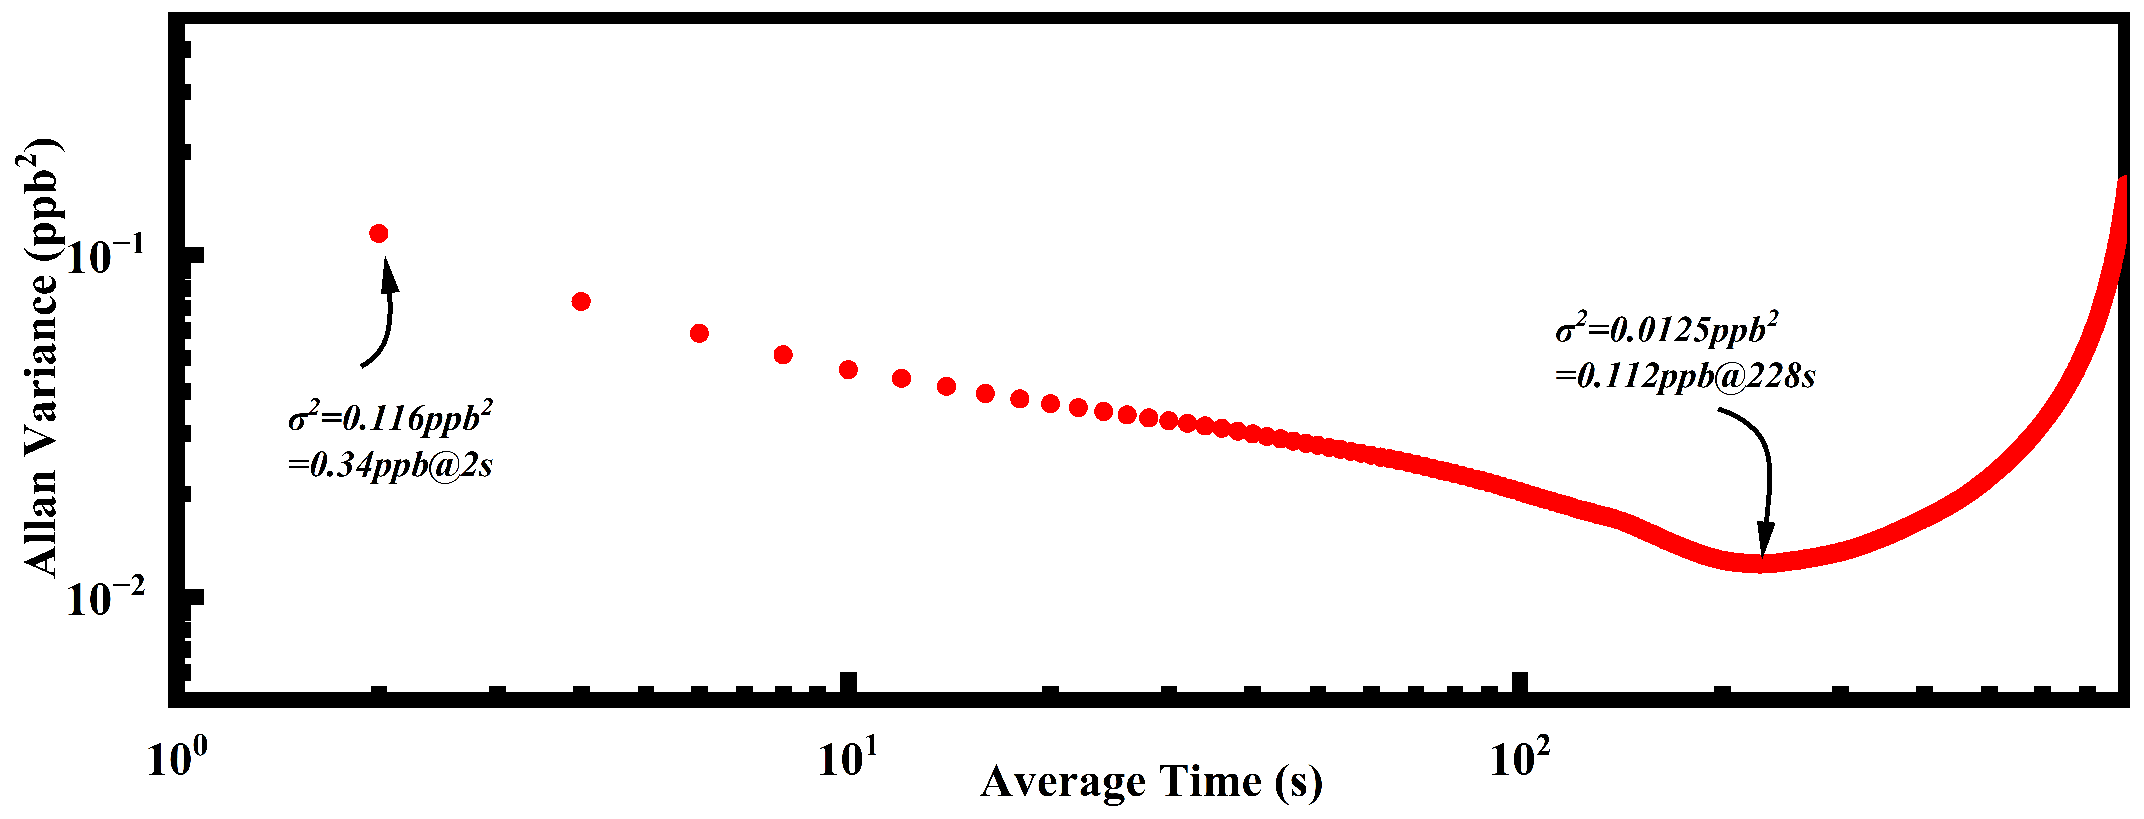
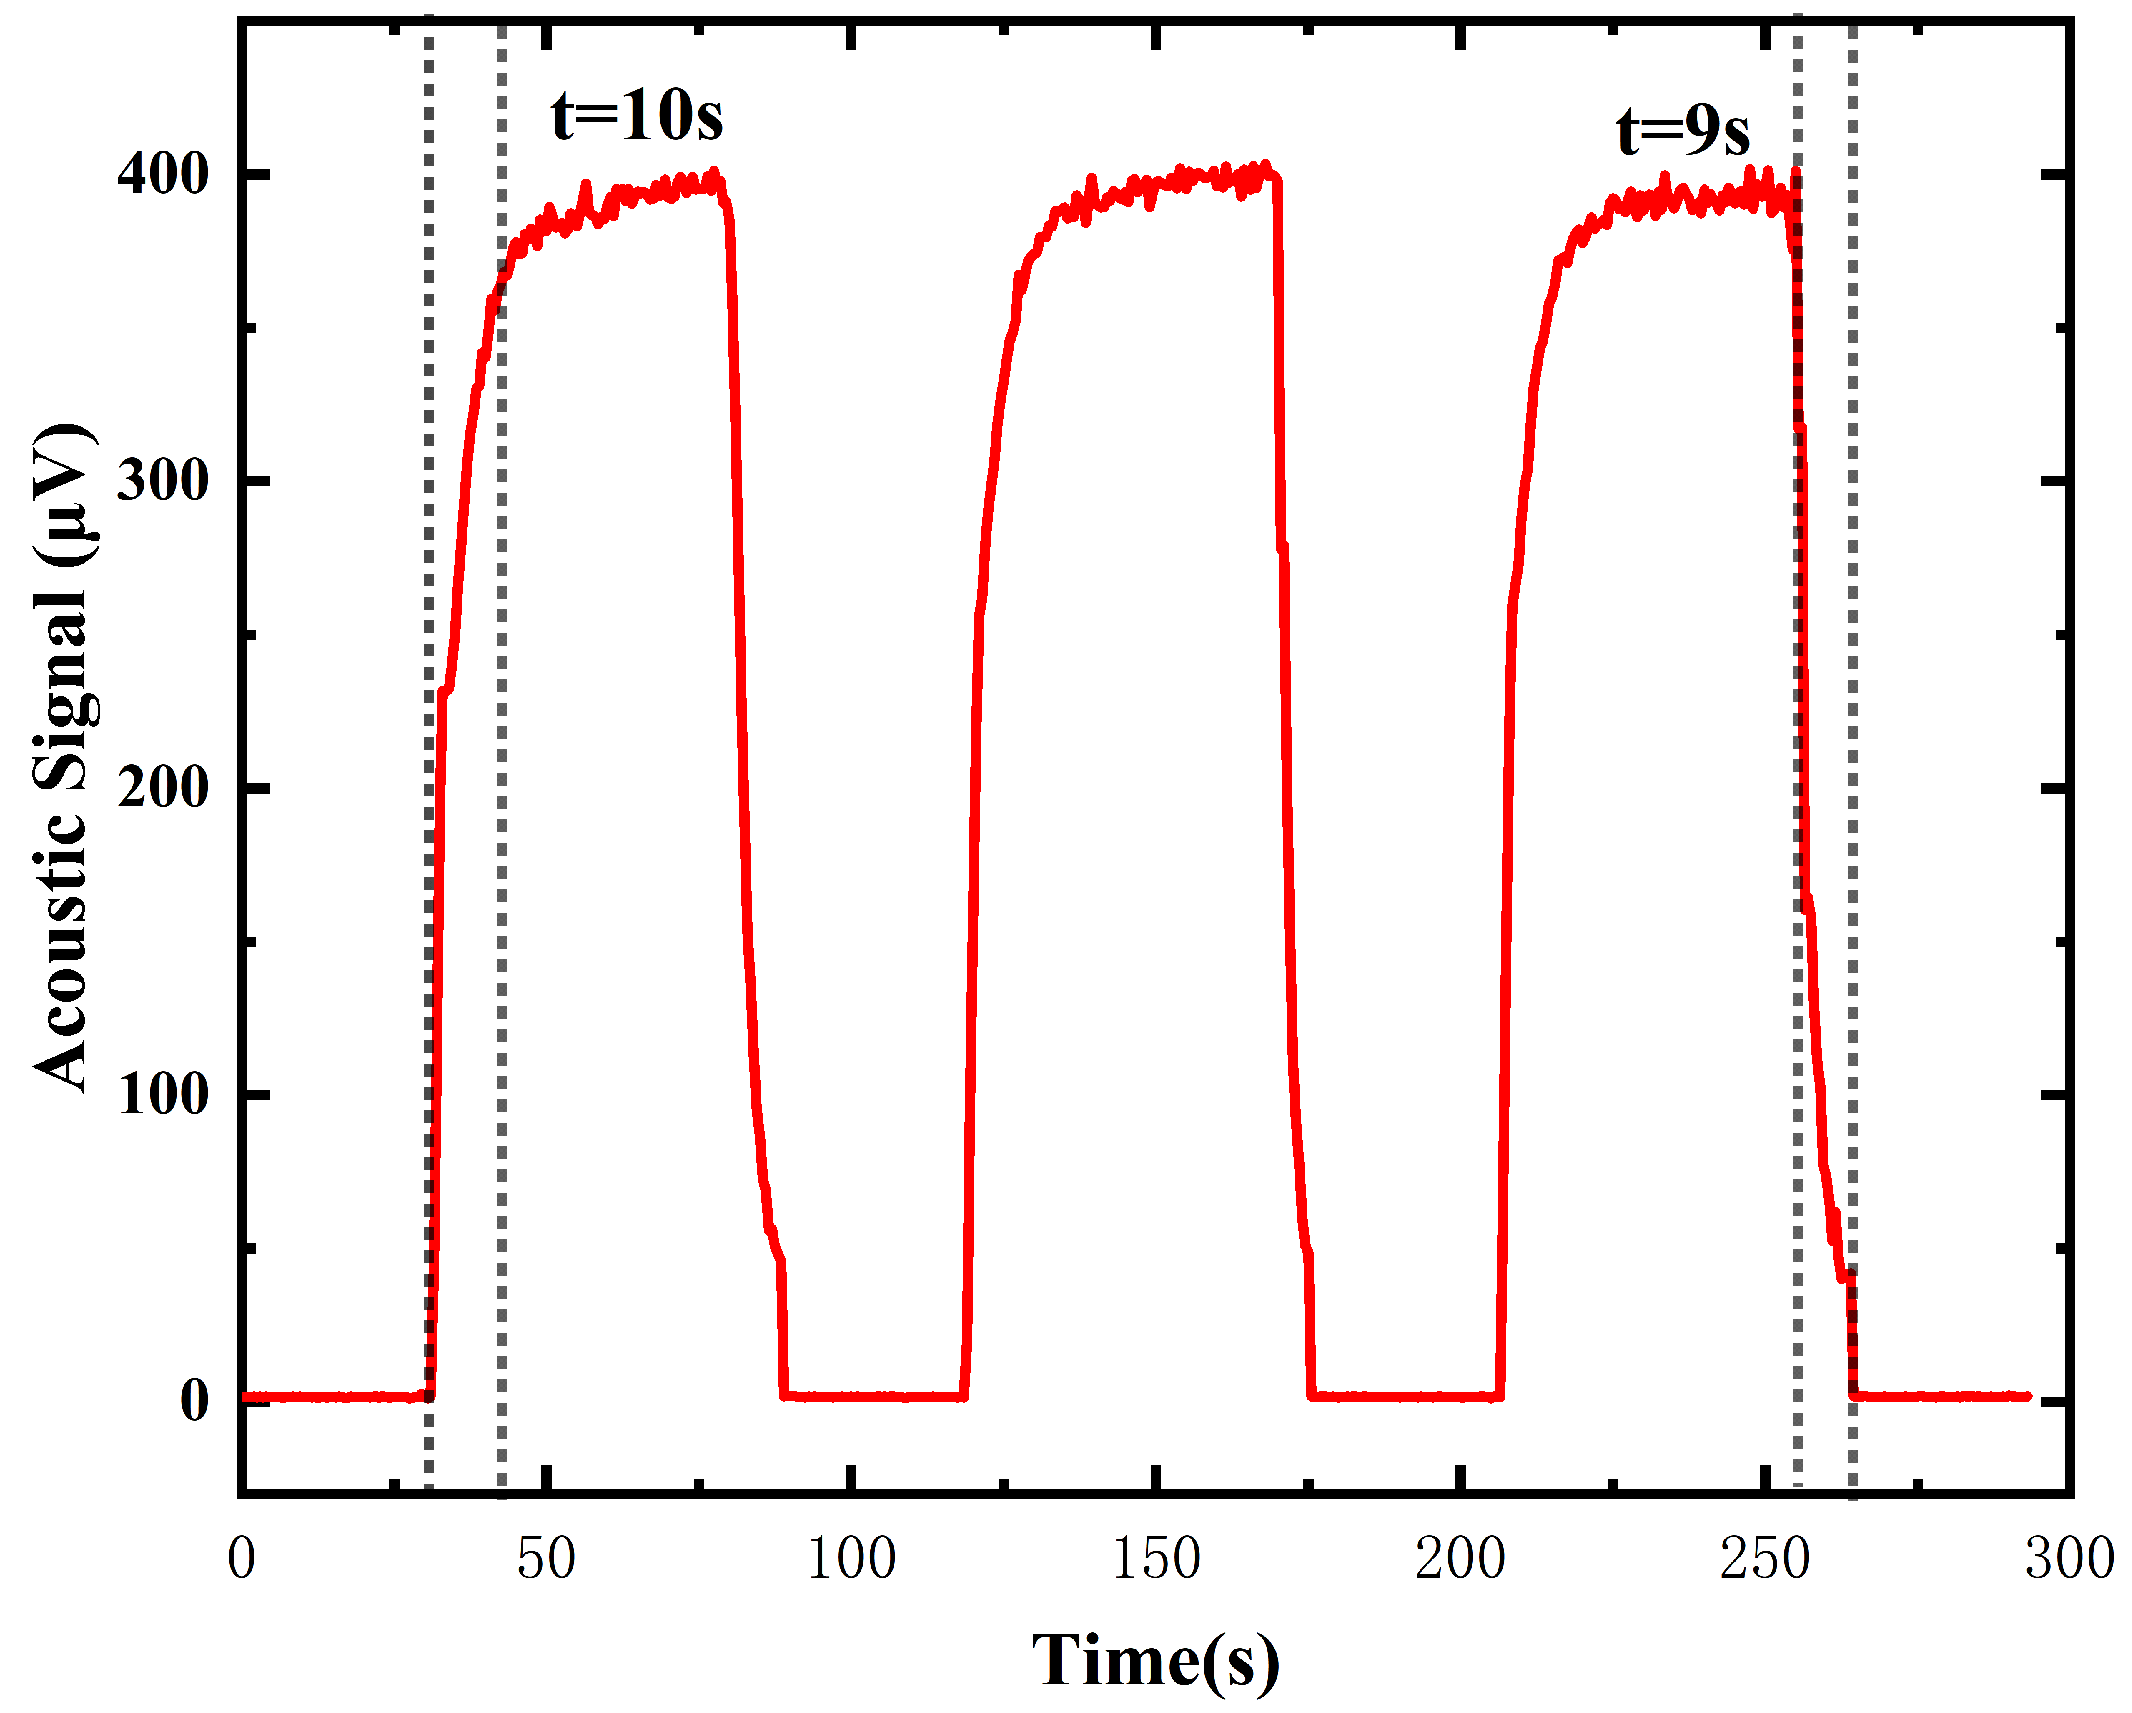
4.1. Performance Evaluation

To verify the performance of the system, several concentrations of NO 2 were tested. The NO 2 of different concentrations are obtained by mixing the 1 ppm standard NO 2 and high purity nitrogen with two flow controllers (MFC300, Altoly electronic, Suzhou, China). The continuous measurement of the 200 ppb, 333 ppb, 500 ppb, 666 ppb, 750 ppb, 1000 ppb and the N 2 atmosphere can be seen in the Figure 8. Figure 9 shows the results of the linear fitting of the photoacoustic signal at different concentrations. The R-square of the linear fitting is 0.9991, from which the linear response of the system can be proved. The stability of the system can also be demonstrated from the results.As for the background noise in 200 ppb is calculated to 1.7776 μ V, and the photoacoustic signal of the 200 ppb NO 2 is 73.32 μ V, the SNR of the system can be calculated to 41.247. Then the MDL of the system can be obtained to be 4.85 ppb (1 σ ). As an allan variance is commonly used to evaluate the performance of the sensor system, we record the data in 800 s in the N 2 atmosphere. The time-domain data is shown in Figure 10. An allan variance analysis is presented in Figure 11. From the result, the MDL of the system can achieve 0.11 ppb with a average time of 228 s.
The response time characteristics of the system have been also studied. As can been seen from the interval between the dashed lines in the Figure 12, the rise time and the descent time of the system are 10 s and 9 s, respectively. To some extent, the response time of the system is related to the time used to fill the PAC. So the system can get a better response characteristic by optimizing the gas flow structure in the future.

4.2. Discussion

Table 1 compared the results of this paper with similar reports. Through the size of the reported PACs, we calculated the gas capacity which is equal to the volume of the resonant cavity and two buffer cavaties. As can be seen, the volume of PAC optimized in this paper is quite smaller than others, even less than half the size. And the detection performance of NO 2 is also similar. The optimization of the PAC is meaningful and valuable.

5. Conclusions

In conclusion, an ultra-sensitive NO 2 gas sensor with an optimized PAC is demonstrated in this paper. The excitation light source is a 450 nm laser module packaged by ourselves, and the absorption line matches the absorption cross-section of NO 2 . By analyzing the modulation depth of the laser, a square wave modulation whose duty cycle is 50% is selected. Under the duty cycle, the maximum photoacoustic signal can be obtained. Considering the size, the resonant frequency and the photoacoustic signal, an optimized H-type PAC is designed with a volume of 80 mm × 30 mm × 30 mm. The size is quite smaller than others have been reported, and the gas capacity is only 18.85 millilitres. The gas sensor shows excellent performance in the NO 2 standard gas test. The response of the sensor at different concentrations has good linearity and stability. And the limitation of detection can reach 4.85 ppb (1 σ ) in a 2 s integration time. With an analysis of an allan variance analysis, the MDL can achieve 0.11 ppb with a 228 s integration time. With the aid of a powerful signal-processing method, a level of minimum detectable concentration may be reached that is interesting for applications in sub-ppb test.

Author Contributions

Conceptualization, L.X. and P.G.; methodology, W.Y.; validation, W.Y., J.Y. and M.J.; formal analysis, W.Y.; investigation, W.Y.; resources, L.X. and P.G.; data curation, W.Y.; writing—original draft preparation, W.Y.; writing—review and editing, W.Y., Y.J. and C.L.; project administration, L.X. All authors have read and agreed to the published version of the manuscript.

Funding

This research was funded by the National Natural Science Foundation of China, Grant No. U1930205.

Institutional Review Board Statement

Not applicable.

Informed Consent Statement

Not applicable.

Data Availability Statement

Not applicable.

Conflicts of Interest

The authors declare no conflict of interest.

Abbreviations

The following abbreviations are used in this manuscript:
LDlaser diode
PACphotoacoustic cell
NO 2 nitrogen dioxide
SNRsignal-to-noise
MDLminimum detection limit
TDLAStunable diode laser absorption spectroscopy
FTIRfourier transform infrared spectroscopy
NDIRnondispersive infrared
CRDScavity ring-down spectroscopy
PASphotoacoustic spectroscopy
QEPASquartz-enhanced photoacoustic
HITRANhigh resolution Transmission molecular absorption database
DAQdata acquisition
L-I-Vlight-current-voltage

References

  1. Werle, P. A review of recent advances in semiconductor laser based gas monitors. Spectrochim. Acta Part A Mol. Biomol. Spectrosc. 1998, 54, 197–236. [Google Scholar] [CrossRef]
  2. Fiddler, M.N.; Begashaw, I.; Mickens, M.A.; Collingwood, M.S.; Assefa, Z.; Bililign, S. Laser spectroscopy for atmospheric and environmental sensing. Sensors 2009, 9, 10447–10512. [Google Scholar] [CrossRef] [PubMed] [Green Version]
  3. Dhall, S.; Mehta, B.; Tyagi, A.; Sood, K. A review on environmental gas sensors: Materials and technologies. Sens. Int. 2021, 2, 100116. [Google Scholar] [CrossRef]
  4. Bielecki, Z.; Stacewicz, T.; Wojtas, J.; Mikołajczyk, J.; Szabra, D.; Prokopiuk, A. Selected optoelectronic sensors in medical applications. Opto-Electron. Rev. 2018, 26, 122–133. [Google Scholar] [CrossRef]
  5. Hodgkinson, J.; Tatam, R.P. Optical gas sensing: A review. Meas. Sci. Technol. 2012, 24, 012004. [Google Scholar] [CrossRef] [Green Version]
  6. Frish, M.B.; Wainner, R.T.; Laderer, M.C.; Green, B.D.; Allen, M.G. Standoff and Miniature Chemical Vapor Detectors Based on Tunable Diode Laser Absorption Spectroscopy. IEEE Sens. J. 2010, 10, 639–646. [Google Scholar] [CrossRef]
  7. Faix, O. Fourier transform infrared spectroscopy. In Methods in Lignin Chemistry; Springer: Berlin/Heidelberg, Germany, 1992; pp. 83–109. [Google Scholar]
  8. Jha, R.K. Non-dispersive infrared gas sensing technology: A review. IEEE Sens. J. 2021, 22, 6–15. [Google Scholar] [CrossRef]
  9. Romanini, D.; Ventrillard, I.; Méjean, G.; Morville, J.; Kerstel, E. Introduction to cavity enhanced absorption spectroscopy. In Cavity-Enhanced Spectroscopy and Sensing; Springer: Berlin/Heidelberg, Germany, 2014; pp. 1–60. [Google Scholar]
  10. Li, J.; Chen, W.; Yu, B. Recent progress on infrared photoacoustic spectroscopy techniques. Appl. Spectrosc. Rev. 2011, 46, 440–471. [Google Scholar] [CrossRef]
  11. Hunter, G.W.; Akbar, S.; Bhansali, S.; Daniele, M.; Erb, P.D.; Johnson, K.; Liu, C.C.; Miller, D.; Oralkan, O.; Hesketh, P.J.; et al. Editors’ choice—Critical review—A critical review of solid state gas sensors. J. Electrochem. Soc. 2020, 167, 037570. [Google Scholar] [CrossRef]
  12. Yamazoe, N.; Sakai, G.; Shimanoe, K. Oxide semiconductor gas sensors. Catal. Surv. Asia 2003, 7, 63–75. [Google Scholar] [CrossRef]
  13. World Health Organization. Air Quality Guidelines: Global Update 2005: Particulate Matter, Ozone, Nitrogen Dioxide, and Sulfur Dioxide; World Health Organization: Copenhagen, Denmark, 2006. [Google Scholar]
  14. Li, B.; Kim, Y.L.; Lippert, A.R. Chemiluminescence measurement of reactive sulfur and nitrogen species. Antioxid. Redox Signal. 2022, 36, 337–353. [Google Scholar] [CrossRef]
  15. Ugale, A.D.; Umarji, G.G.; Jung, S.H.; Deshpande, N.G.; Lee, W.; Cho, H.K.; Yoo, J.B. ZnO decorated flexible and strong graphene fibers for sensing NO2 and H2S at room temperature. Sens. Actuators B Chem. 2020, 308, 127690. [Google Scholar] [CrossRef]
  16. Kalkman, J.; Van Kesteren, H. Relaxation effects and high sensitivity photoacoustic detection of NO2 with a blue laser diode. Appl. Phys. B 2008, 90, 197–200. [Google Scholar] [CrossRef]
  17. Peltola, J.; Hieta, T.; Vainio, M. Parts-per-trillion-level detection of nitrogen dioxide by cantilever-enhanced photo-acoustic spectroscopy. Opt. Lett. 2015, 40, 2933–2936. [Google Scholar] [CrossRef]
  18. Thompson, J.E. Crowd-sourced air quality studies: A review of the literature & portable sensors. Trends Environ. Anal. Chem. 2016, 11, 23–34. [Google Scholar]
  19. Zheng, F.; Qiu, X.; Shao, L.; Feng, S.; Cheng, T.; He, X.; He, Q.; Li, C.; Kan, R.; Fittschen, C. Measurement of nitric oxide from cigarette burning using TDLAS based on quantum cascade laser. Opt. Laser Technol. 2020, 124, 105963. [Google Scholar] [CrossRef]
  20. Li, G.; Werwein, V.; Lüttschwager, A.; Eon Kim, M.; Nwaboh, J.; Werhahn, O.; Ebert, V. FTIR-based spectral line data of the v3 band of NO2 at 6.3 μm and multi-component impurity analysis of NO2 reference gases within the scope of the EMPIR MetNO2 project. In Proceedings of the EGU General Assembly Conference Abstracts, Online, 4–8 May 2020; p. 21718. [Google Scholar]
  21. Rück, T.; Bierl, R.; Matysik, F.M. Low-cost photoacoustic NO2 trace gas monitoring at the pptV-level. Sens. Actuators A Phys. 2017, 263, 501–509. [Google Scholar] [CrossRef]
  22. Karhu, J.; Hieta, T.; Manoocheri, F.; Vainio, M.; Ikonen, E. LED-based photoacoustic NO2 sensor with a sub-ppb detection limit. ACS Sens. 2021, 6, 3303–3307. [Google Scholar] [CrossRef]
  23. Liu, X.; Hu, Z.; Tang, H.; Xue, H.; Chen, Y.; Hu, R. Compact, Fast Cavity Ring-Down Spectroscopy Monitor for Simultaneous Measurement of Ozone and Nitrogen Dioxide in the Atmosphere. Atmosphere 2022, 13, 2106. [Google Scholar] [CrossRef]
  24. Li, S.; Lu, J.; Shang, Z.; Zeng, X.; Yuan, Y.; Wu, H.; Pan, Y.; Sampaolo, A.; Patimisco, P.; Spagnolo, V.; et al. Compact quartz-enhanced photoacoustic sensor for ppb-level ambient NO2 detection by use of a high-power laser diode and a grooved tuning fork. Photoacoustics 2022, 25, 100325. [Google Scholar] [CrossRef]
  25. Bell, A.G. The production of sound by radiant energy. Science 1881, 48, 242–253. [Google Scholar] [CrossRef]
  26. Patimisco, P.; Scamarcio, G.; Tittel, F.K.; Spagnolo, V. Quartz-enhanced photoacoustic spectroscopy: A review. Sensors 2014, 14, 6165–6206. [Google Scholar] [CrossRef] [PubMed] [Green Version]
  27. Ma, Y. Review of recent advances in QEPAS-based trace gas sensing. Appl. Sci. 2018, 8, 1822. [Google Scholar] [CrossRef] [Green Version]
  28. Ayache, D.; Rousseau, R.; Kniazeva, E.; Charensol, J.; Seoudi, T.; Bahriz, M.; Gouzi, F.; Spagnolo, V.; Vicet, A. Commercial and Custom Quartz Tuning Forks for Quartz Enhanced Photoacoustic Spectroscopy: Stability under Humidity Variation. Sensors 2023, 23, 3135. [Google Scholar] [CrossRef] [PubMed]
  29. Gong, Z.; Chen, K.; Chen, Y.; Mei, L.; Yu, Q. Integration of T-type half-open photoacoustic cell and fiber-optic acoustic sensor for trace gas detection. Opt. Express 2019, 27, 18222–18231. [Google Scholar] [CrossRef] [PubMed]
  30. Gong, Z.; Gao, T.; Chen, Y.; Zhang, B.; Peng, W.; Yu, Q.; Ma, F.; Mei, L.; Chen, K. Sub-ppb level detection of nitrogen dioxide based on an optimized H-type longitudinal acoustic resonator and a lock-in white-light interferometry demodulation algorithm. J. Quant. Spectrosc. Radiat. Transf. 2020, 253, 107136. [Google Scholar] [CrossRef]
  31. Cao, Y.; Liu, Q.; Wang, R.; Liu, K.; Chen, W.; Wang, G.; Gao, X. Development of a 443 nm diode laser-based differential photoacoustic spectrometer for simultaneous measurements of aerosol absorption and NO2. Photoacoustics 2021, 21, 100229. [Google Scholar] [CrossRef]
  32. Li, Z.; Si, G.; Ning, Z.; Liu, J.; Fang, Y.; Si, B.; Cheng, Z.; Yang, C. Highly sensitive sphere-tube coupled photoacoustic cell suitable for detection of a variety of trace gases: NO2 as an example. Sensors 2022, 22, 281. [Google Scholar] [CrossRef]
  33. Brewer, A.; McElroy, C.; Kerr, J. Nitrogen dioxide concentrations in the atmosphere. Nature 1973, 246, 129–133. [Google Scholar] [CrossRef]
  34. Pollack, I.B.; Lerner, B.M.; Ryerson, T.B. Evaluation of ultraviolet light-emitting diodes for detection of atmospheric NO2 by photolysis-chemiluminescence. J. Atmos. Chem. 2010, 65, 111–125. [Google Scholar] [CrossRef]
  35. Rosencwaig, A.; Griffiths, P.R. Photoacoustics and photoacoustic spectroscopy. Phys. Today 1981, 34, 64. [Google Scholar] [CrossRef]
  36. Cai, Y.; Arsad, N.; Li, M.; Wang, Y. Buffer structure optimization of the photoacoustic cell for trace gas detection. Optoelectron. Lett. 2013, 9, 233–237. [Google Scholar] [CrossRef]
  37. Pan, Y.; Dong, L.; Yin, X.; Wu, H. Compact and highly sensitive NO2 photoacoustic sensor for environmental monitoring. Molecules 2020, 25, 1201. [Google Scholar] [CrossRef] [PubMed] [Green Version]
  38. Lassen, M.; Lamard, L.; Balslev-Harder, D.; Peremans, A.; Petersen, J.C. Mid-infrared photoacoustic spectroscopy for atmospheric NO2 measurements. In Proceedings of the Photonic Instrumentation Engineering V, San Francisco, CA, USA, 27 January–1 February 2018; Volume 10539, pp. 108–114. [Google Scholar]
  39. Keeratirawee, K.; Hauser, P.C. Piezoelectric tube as resonant transducer for gas-phase photoacoustics. Anal. Chim. Acta 2021, 1147, 165–169. [Google Scholar] [CrossRef]
Figure 1. Cross-section of NO 2 in UV-area.
Atmosphere 14 00704 g001
Figure 2. Finite simulation for photoacoustic cell: (a) The acoustic pressure of the simulation; (b) The frequency of the simulation.
Atmosphere 14 00704 g002
Figure 3. The real (black line) and simulation (green line) first order resonant frequency of PAC.
Atmosphere 14 00704 g003
Figure 4. (a) Package strategy for the laser; (b) The picture of the packaged laser.
Atmosphere 14 00704 g004
Figure 5. Spectrum and L-I-V of the laser (a) L-I-V of the laser; (b) The spectrum of the laser.
Atmosphere 14 00704 g005
Figure 6. The relationship between duty cycle and photoacoustic signal.
Atmosphere 14 00704 g006
Figure 7. Schematic of the photoacoustic gas measurement system.
Atmosphere 14 00704 g007
Figure 8. The continuous measurement of NO 2 with different concentrations.
Atmosphere 14 00704 g008
Figure 9. Linear fitting of the acoustic signals under different NO 2 concentrations.
Atmosphere 14 00704 g009
Figure 10. The measurement data of the system in 800 s in a N 2 atmosphere.
Atmosphere 14 00704 g010
Figure 11. The allan variance of the system.
Atmosphere 14 00704 g011
Figure 12. The response time characteristics of the system.
Atmosphere 14 00704 g012
Table 1. Comparison of the developed sensor and previously reported systems.
ReferencePAC TypeFrequency (Hz)Volume (mm × mm × mm)Gas Capacity (mL)MDL (ppb)
[37]differential1780170 × 50 × 5055.350.25
[30]H-type1415240 × 24 × 2455.791.26
[31]H-type1430220 × 70 × 70431.58300
[32](sphere + tube)1199100 × 50 × 5071.730.7
[38]H-type14,40045 × 8 × 81.8771600
[39]H-type523880 × 26 × 2631.8583
This paperH-type315080 × 30 × 3018.854.85
Disclaimer/Publisher’s Note: The statements, opinions and data contained in all publications are solely those of the individual author(s) and contributor(s) and not of MDPI and/or the editor(s). MDPI and/or the editor(s) disclaim responsibility for any injury to people or property resulting from any ideas, methods, instructions or products referred to in the content.

