Article

Optimization of Photoacoustic Cell for Trace Acetylene Detection in Transformer Oil

1
State Grid Hubei Electric Power Research Institute, Wuhan 430077, China
2
State Key Laboratory of Power Transmission Equipment & System Security and New Technology, Chongqing University, Chongqing 400044, China
*
Author to whom correspondence should be addressed.
Atmosphere 2023, 14(5), 801; https://doi.org/10.3390/atmos14050801
Submission received: 6 April 2023 / Revised: 22 April 2023 / Accepted: 23 April 2023 / Published: 28 April 2023
(This article belongs to the Special Issue Advanced Photoacoustic Spectroscopy and Its Applications)

Abstract

:
This paper presents the development of a highly sensitive gas detection system based on a resonant photoacoustic cell for detecting dissolved gases in transformer oil. A simulation model of the resonant photoacoustic cell was studied and optimized the buffer chamber volume while ensuring signal enhancement. The volume of the photoacoustic cell was reduced by about 80% compared to the classical model. A resonant photoacoustic cell was then fabricated based on the optimized simulation optimization. The dual-resonance photoacoustic system was constructed by combining the resonant PA cell with a handmade cantilever fiber acoustic sensor. The system’s sensitivity was further improved by using an erbium-doped fiber amplifier, wavelength modulation, and harmonic detection technology. The experimental results showed that the system achieved a detection limit of 6 ppb and an excellent linear range under 1000 ppm for C2H2 gas. The developed gas detection system has potential applications for monitoring the condition of power transformers in power grids.

1. Introduction

The detection of dissolved acetylene in a transformer can help in the timely identification of high-energy discharge faults [1,2]. To this end, various on-line monitoring commercial systems for dissolved gas detection in transformer oil and the utilization of diverse detection principles have been widely employed [3]. Due to its fast detection speed and low maintenance, photoacoustic spectroscopic (PAS) gas detection is gradually becoming one of the most favorable transformer online monitoring methods [4,5,6]. The demand for the detection of low-concentration acetylene gas in a transformer has increased year after year. The minimum detection limit requirements for acetylene reach hundreds of ppb. PAS offers high detection sensitivity due to its zero-background property, as the photoacoustic (PA) signal varies linearly with the amount of absorbed laser power [7]. In addition, the weak photoacoustic signal can be detected using a highly sensitive microphone [8,9,10] and enhanced through the use of a resonant photoacoustic cell [11,12,13].
The resonant PA cell is commonly used in PAS to create a standing wave from the specific frequency of the photoacoustic signal. However, the analytical solution of the resonant PA cell is limited to analyzing parameters of the resonant cavity with openings at both ends in ideal conditions [12]. It cannot be used to optimize the PA cell with a complex structure. As a result, some researchers have used simulation models to optimize the parameters of the resonant PA cell.
Cheng [14] developed a simulation model for the excitation of the acoustic field in the PA cell. By using this simulation model, the shapes of both ends of the resonator were changed into a bell mouth [14] and a trapezoid compound [15]. Compared to the original PA cell, the optimized PA cells produced increased photoacoustic signals. Gong [16,17] proposed a T-type resonant PA cell using the finite element method and thermoviscous acoustic theory. The optimized T-type longitudinal resonant PA cell features a high PA cell constant, fast response time, and an easy manufacturing process. Jin [18] designed a PA cell for measuring respirable dust through a theoretical and simulation analysis. Yin [19] proposed a dual-resonator photoacoustic cell and achieved a background noise level in the microvolt range. Cheng [20] proposed a new influential factor of the PA signals intensity, the PA field (PAF)-PA cell (PAC) coupling term. In addition to changing the structure of the PA cell, some researchers optimized the traditional cylindrical resonator into an ellipsoid resonator [21] and an arched resonator [22] using simulation models. These optimization designs can effectively improve signal enhancement.
The simulation-optimization cases mentioned above for PA cells have primarily focused on improving detection sensitivity. In pursuit of this goal, certain articles have employed larger volume PA cells to achieve higher sensitivity. However, in contrast to monitoring SF6 decomposition components [23,24], detecting dissolved gases in transformer oil necessitates the separation of oil and gas beforehand. If the PA cell volume is too large, the volume of the degassing module must be increased, and the time required for a single measurement may also increase. This is not conducive to the timely detection of rapid and sudden faults. Traditional resonant PA cells have large-volume buffer chambers at both ends, exacerbating this problem. Therefore, decreasing the volume of the buffer chamber through reasonable optimization can significantly improve the application and promotion of highly sensitive resonant photoacoustic cells in this field. We previously presented our work on using an optimized volume PA cell to measure methane in transformer oil at a conference [25]. However, it did not provide a thorough analysis of the simulation-based optimization process used for the PA cell.
This thesis presents a simulation model for optimizing the volume of a resonant photoacoustic cell. The paper is organized as follows: Section 2.1 describes the principles of the PA effect and the analytical solution of the PA signal. In Section 2.2, a simulation model for the resonant PA cell is established and validated. Section 2.3 employs the simulation model to optimize the volume of the buffer chamber while ensuring the strength of the PA signal. Then, in Section 2.4, a resonant PA cell with an optimized structure is fabricated using the simulation analysis results, and a detection system is built. Section 3 presents the experimental results and a discussion of C2H2 gas detection. Finally, the discussion and conclusion of this thesis are provided in Section 4 and Section 5.

2. Materials and Methods

2.1. Basic Principle of the PA Effect

Photoacoustic spectroscopy gas detection utilizes the photoacoustic effect to determine gas concentration [26,27]. A laser with a specific wavelength is directed at the gas sample. If the gas contains a target gas, it will absorb the specific wavelength light energy and become excited to a high-energy state. The high-energy state molecules are unstable and will transition back to a low-energy state through non-radiative transitions, releasing absorbed light energy as heat. When the light source is modulated, such as through intensity modulation or wavelength modulation, the gas molecules cycle between a high-energy state and a low-energy state, generating an acoustic signal with the same modulation frequency as the light source. The air pressure within the PA cell also undergoes periodic changes due to temperature changes, producing a PA signal which can be detected using a microphone. Before the gas concentration reaches saturation, the intensity of the photoacoustic signal is linearly related to the gas concentration. The target gas concentration in the gas sample can be determined by analyzing the strength of the photoacoustic signal.
The PA cell can be categorized as either a resonant or a non-resonant PA cell based on whether the acoustic signal generates a standing wave distribution within the photoacoustic cell. A resonant PA cell can support longitudinal, angular, and radial acoustic modes [28]. When the laser modulation frequency matches the resonant frequency, the photoacoustic signal generates a standing wave, which means it operates in resonance mode. The photoacoustic signal can be represented as [29]:
p ( r , ω j ) = P 0 α C cell
where P0 is the optical power of excitation light in W, α is the absorption coefficient of the target gas in cm−1, Ccell is the PA cell constant in Pa·cm·W−1, which represents the amplification ability of the PA cell in relation to the photoacoustic signal. Increasing the PA cell constant of the photoacoustic cell can effectively improve the intensity of the photoacoustic signal. The PA cell constant can be expressed as [12]:
C cell = L j Q ( γ 1 ) I j p j ( r ) V c ω j
where Lj is the contact length between the excitation light and the gas in the PA cell in cm, Q is the quality factor of the PA cell, γ is the specific heat capacity of the gas, Ij is the coupling degree between the normal mode of the PA cell and the excitation light,  p j ( r )  is the normal mode, Vc is the volume of the PA cell in cm3, and ωj is the modulation angular frequency.
The quality factor Q is a parameter to measure the energy loss mechanism of the PA cell, which reflects the ratio of the energy accumulated in the PA cell to the energy dissipated in one cycle [12]:
Q j = 2 π E a E d = f 0 f
where Ed is the energy dissipated in one cycle in W, and Ea is the energy accumulated in one cycle in W. For a high Q system, the Q can also be obtained by dividing the resonant frequency f0 by the full linewidth Δf of 1/√2 height of the resonant peak. A larger quality factor means a smaller energy loss of the PA cell.
Among the longitudinal, angular, and radial resonant PA cells, the longitudinal is the most widely used because of its high cell constant, low resonance frequency, small volume, and low consumption of gas to be measured. For the first-order longitudinal resonant PA cell, the parameters affecting the Q are mainly the surface loss Qsuf caused by the heat conduction and viscous effect at the boundary of the gas and PA cell, which can be expressed as [30]:
Q 100 Q suf = R c d v + ( γ 1 ) d h ( 1 + 2 R c / L eff )
where Rc is the radius of the PA cell in cm, dh is the thickness of the thermal boundary layer in cm, and dv is the thickness of the viscous boundary layer in cm. Leff is the effective length of the PA cell considering the so-called end correction in cm, which can be expressed as [12]:
L eff = L c + 16 3 π R c
where Lc is the actual length of the PA cell in cm.
The thickness dh of the thermal boundary layer and the thickness dv of the viscous boundary layer in Equation (4) can each be obtained by the following equations [31]:
d h = 2 K ρ ω c p
d v = 2 η ρ ω
where K is the thermal conductivity of the gas in W·m−1·K−1, ρ is the density of the gas in kg/m3, ω is the modulation angular frequency of the photoacoustic signal, Cp is the molar heat capacity at constant pressure in J·kg−1·K−1, and η is the viscosity coefficient in Pa·s. Usually, dh and dv are both in the order of millimeters.
For a first-order longitudinal resonant PA cell with buffer chambers, the first-order longitudinal resonance frequency is [12]:
f 100 = ω 100 2 π = υ 2 L eff

2.2. Simulation Model Establishment and Verification

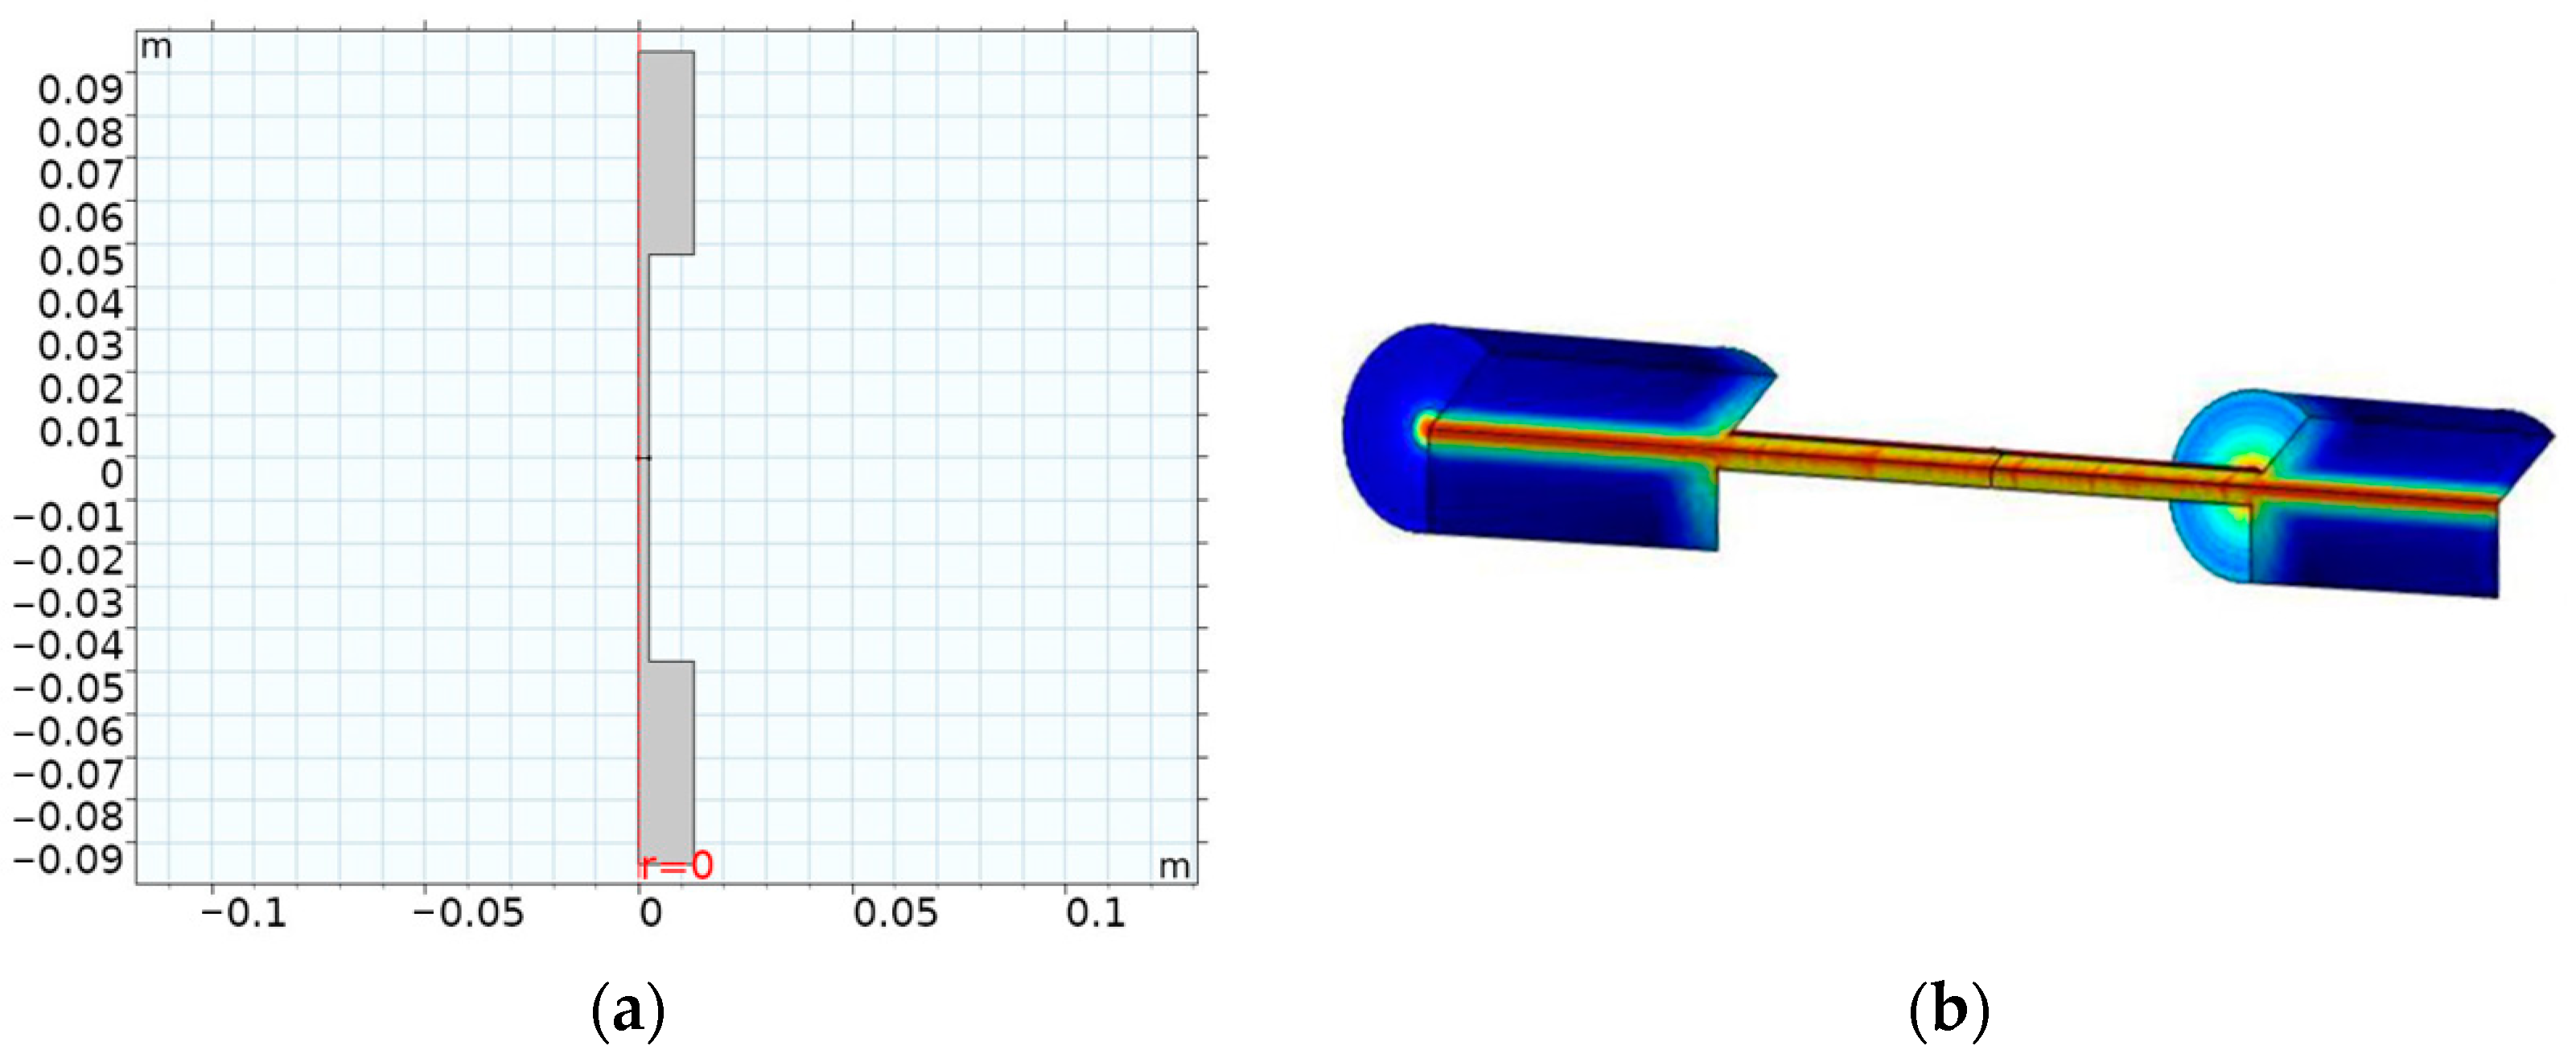
2.2.1. Simulation Model Establishment of the PA Cell

Equation (2) reveals that the use of a longer resonator length and smaller radius can significantly enhance the photoacoustic signal. To expedite calculations, a 2D axisymmetric simulation model with buffer chambers was established, as depicted in Figure 1a. The resonant cavity length was set to 100 mm with a radius of 2.5 mm, while the buffer chamber length was set to 50 mm with a radius of 12.5 mm.
As the majority of the gas to be measured after the separation of oil and gas is N2, the fluid material is simplified to N2. The speed of sound within the PA cell is set at 349 m/s. Material parameters such as density, dynamic viscosity, specific heat rate, and thermal conductivity are determined by utilizing built-in N2 parameters, and the Thermoviscous Acoustics module is incorporated into the simulation model. A Gaussian laser source with a power of 4.5 mW, a beam waist radius of 0.5 mm, and a center wavelength of 1653.7 nm is utilized to generate the photoacoustic signal, exciting CH4 gas with a volume concentration of 100 ppm. To simplify calculations, the thermal power density source H is set in the model under this condition [14]. The velocity field at the cell wall is set as no-slip, while the temperature field at the cell wall is set at isothermal boundary conditions. A 2D axisymmetric model rotating to a 3D model is depicted in Figure 1b.

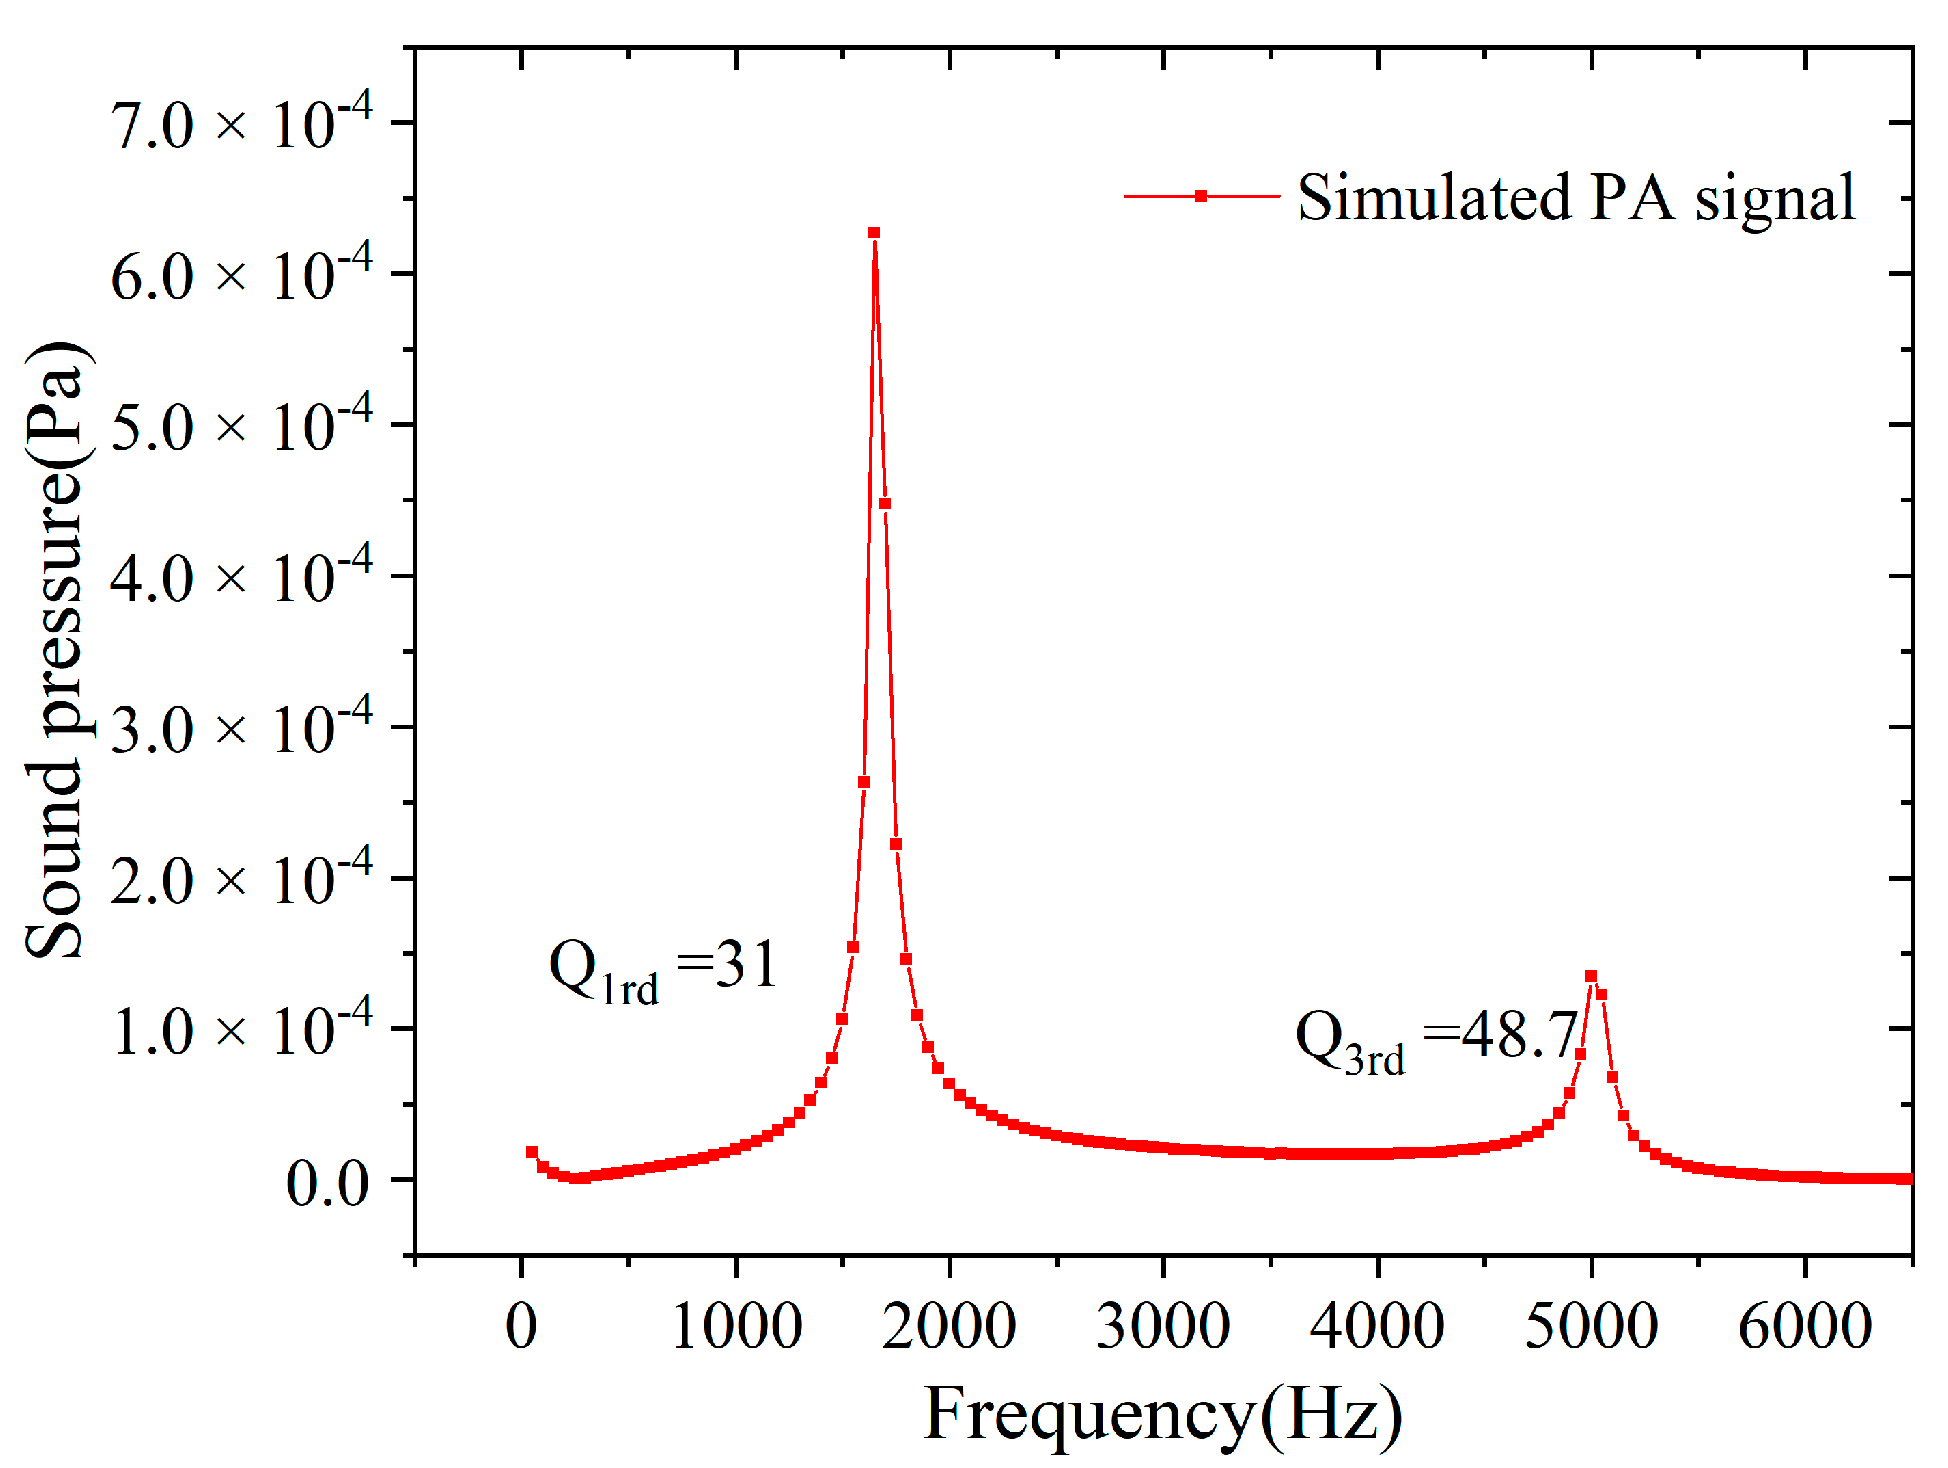
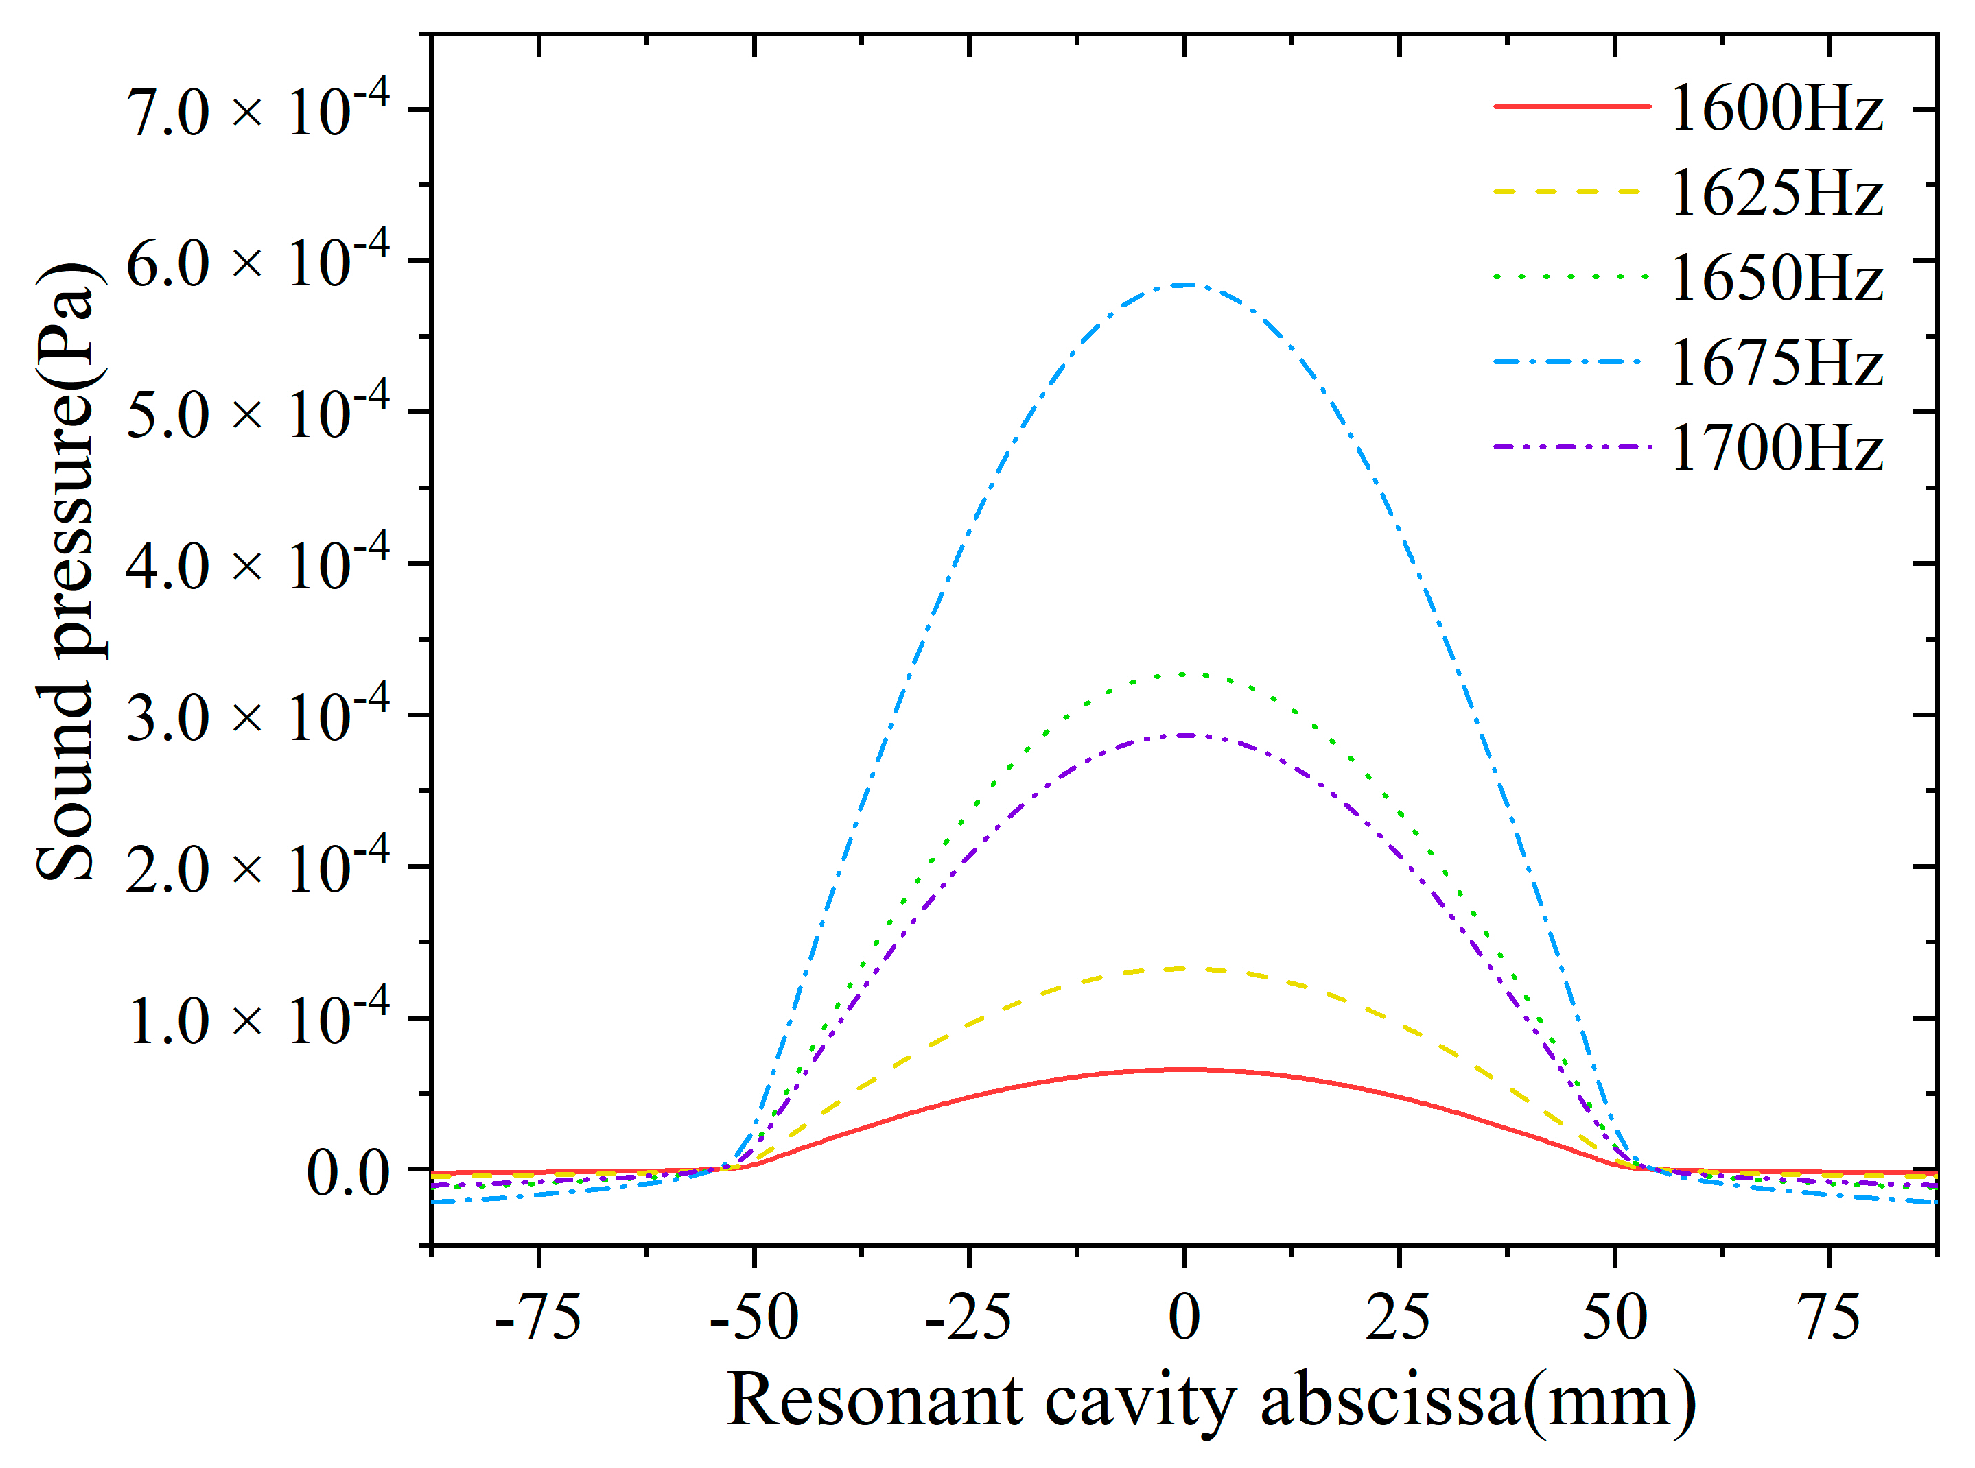
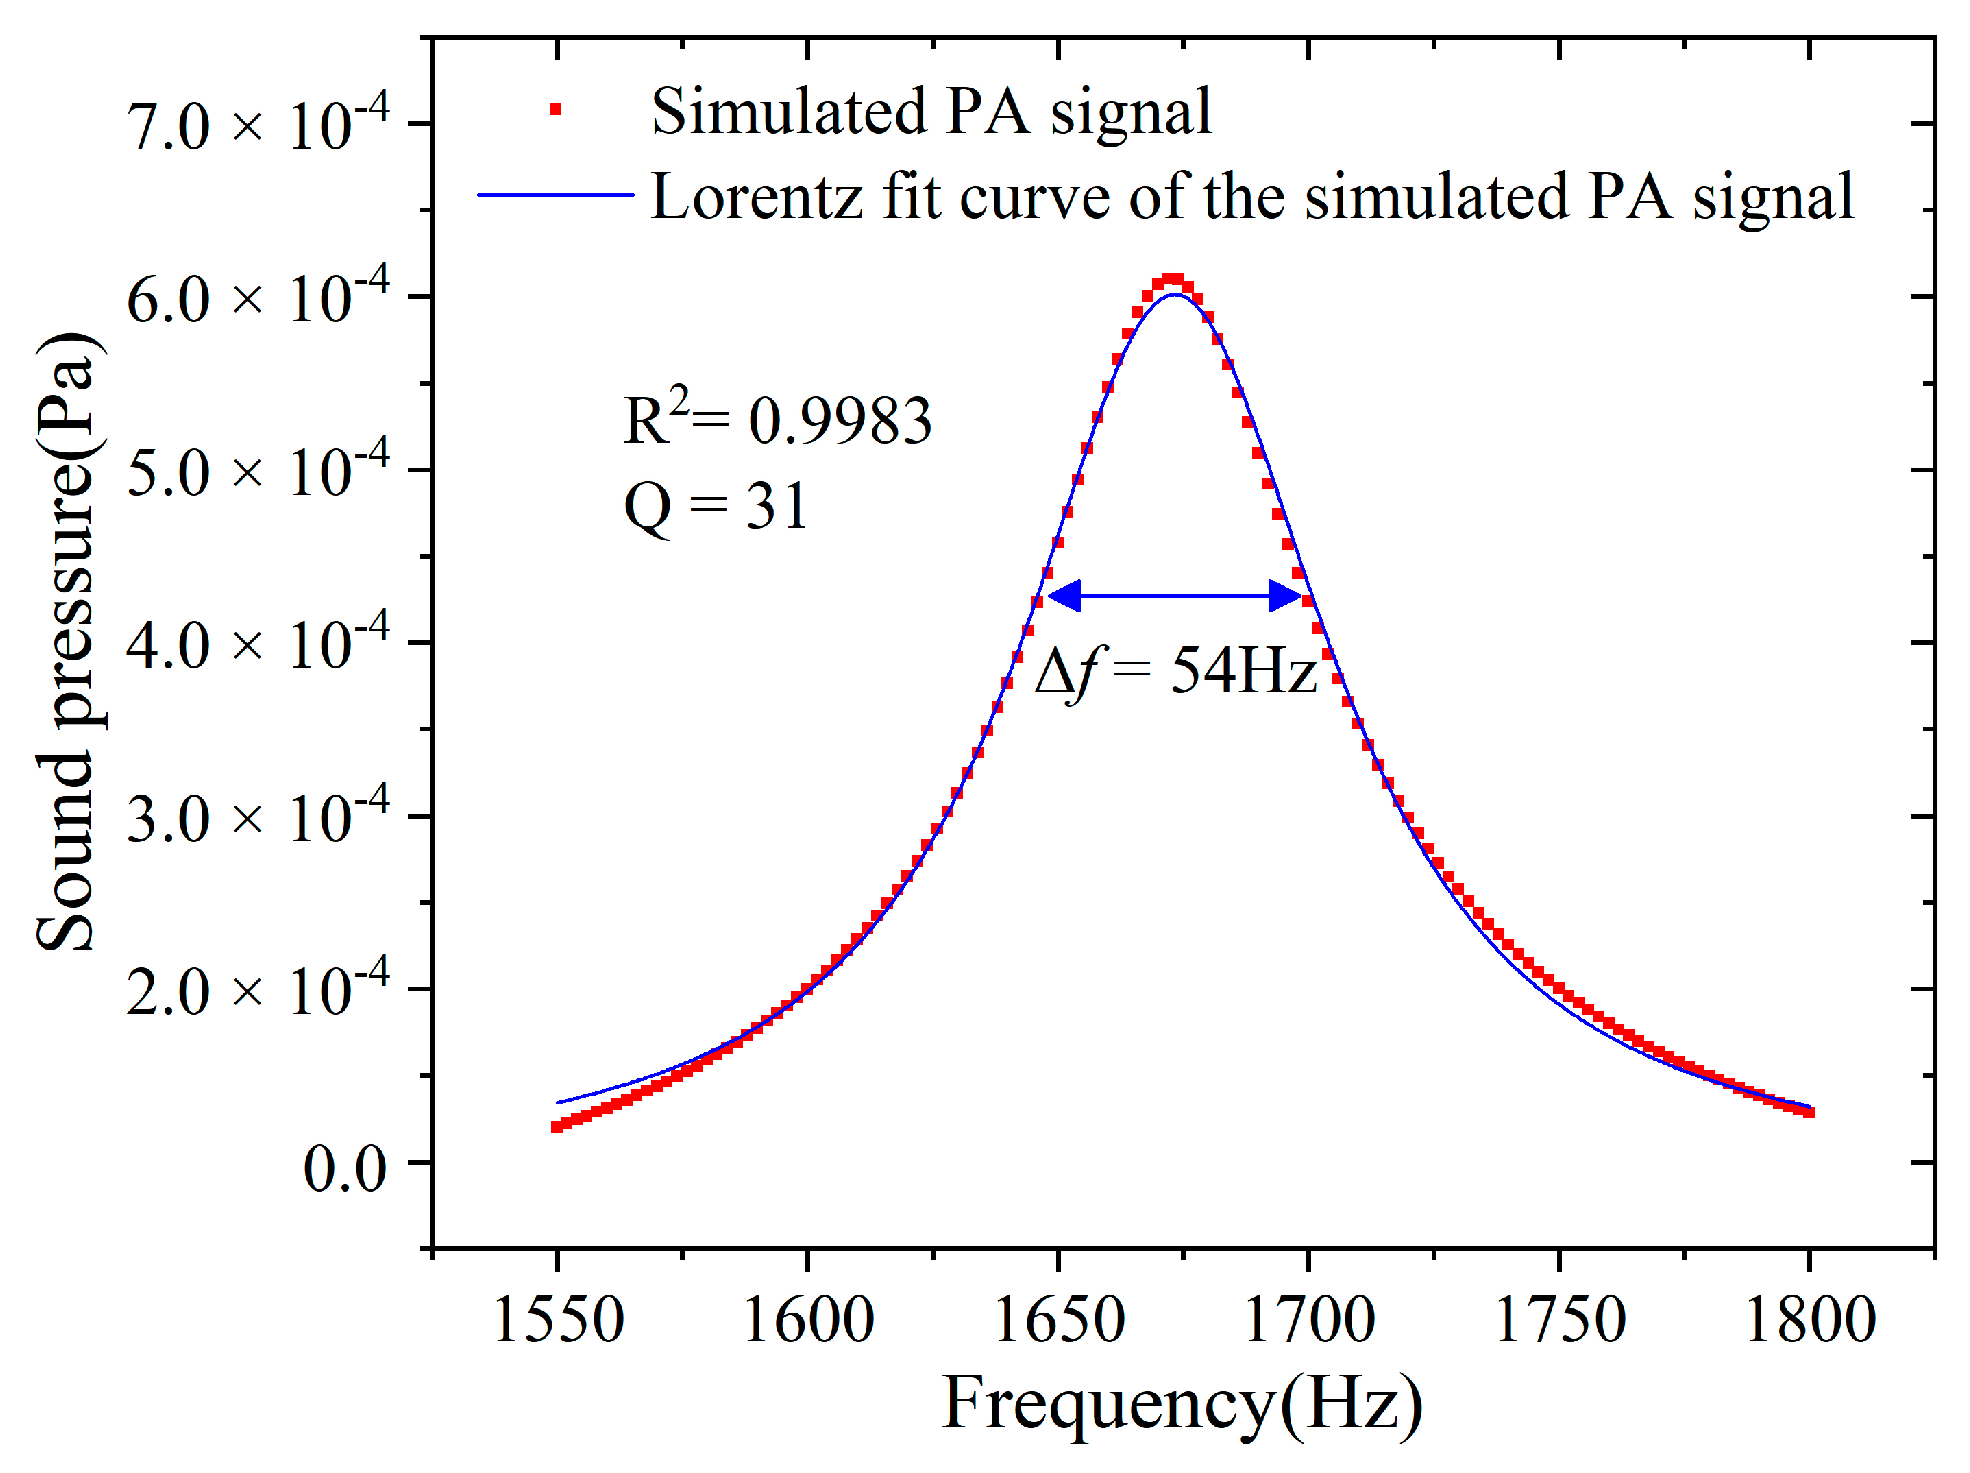
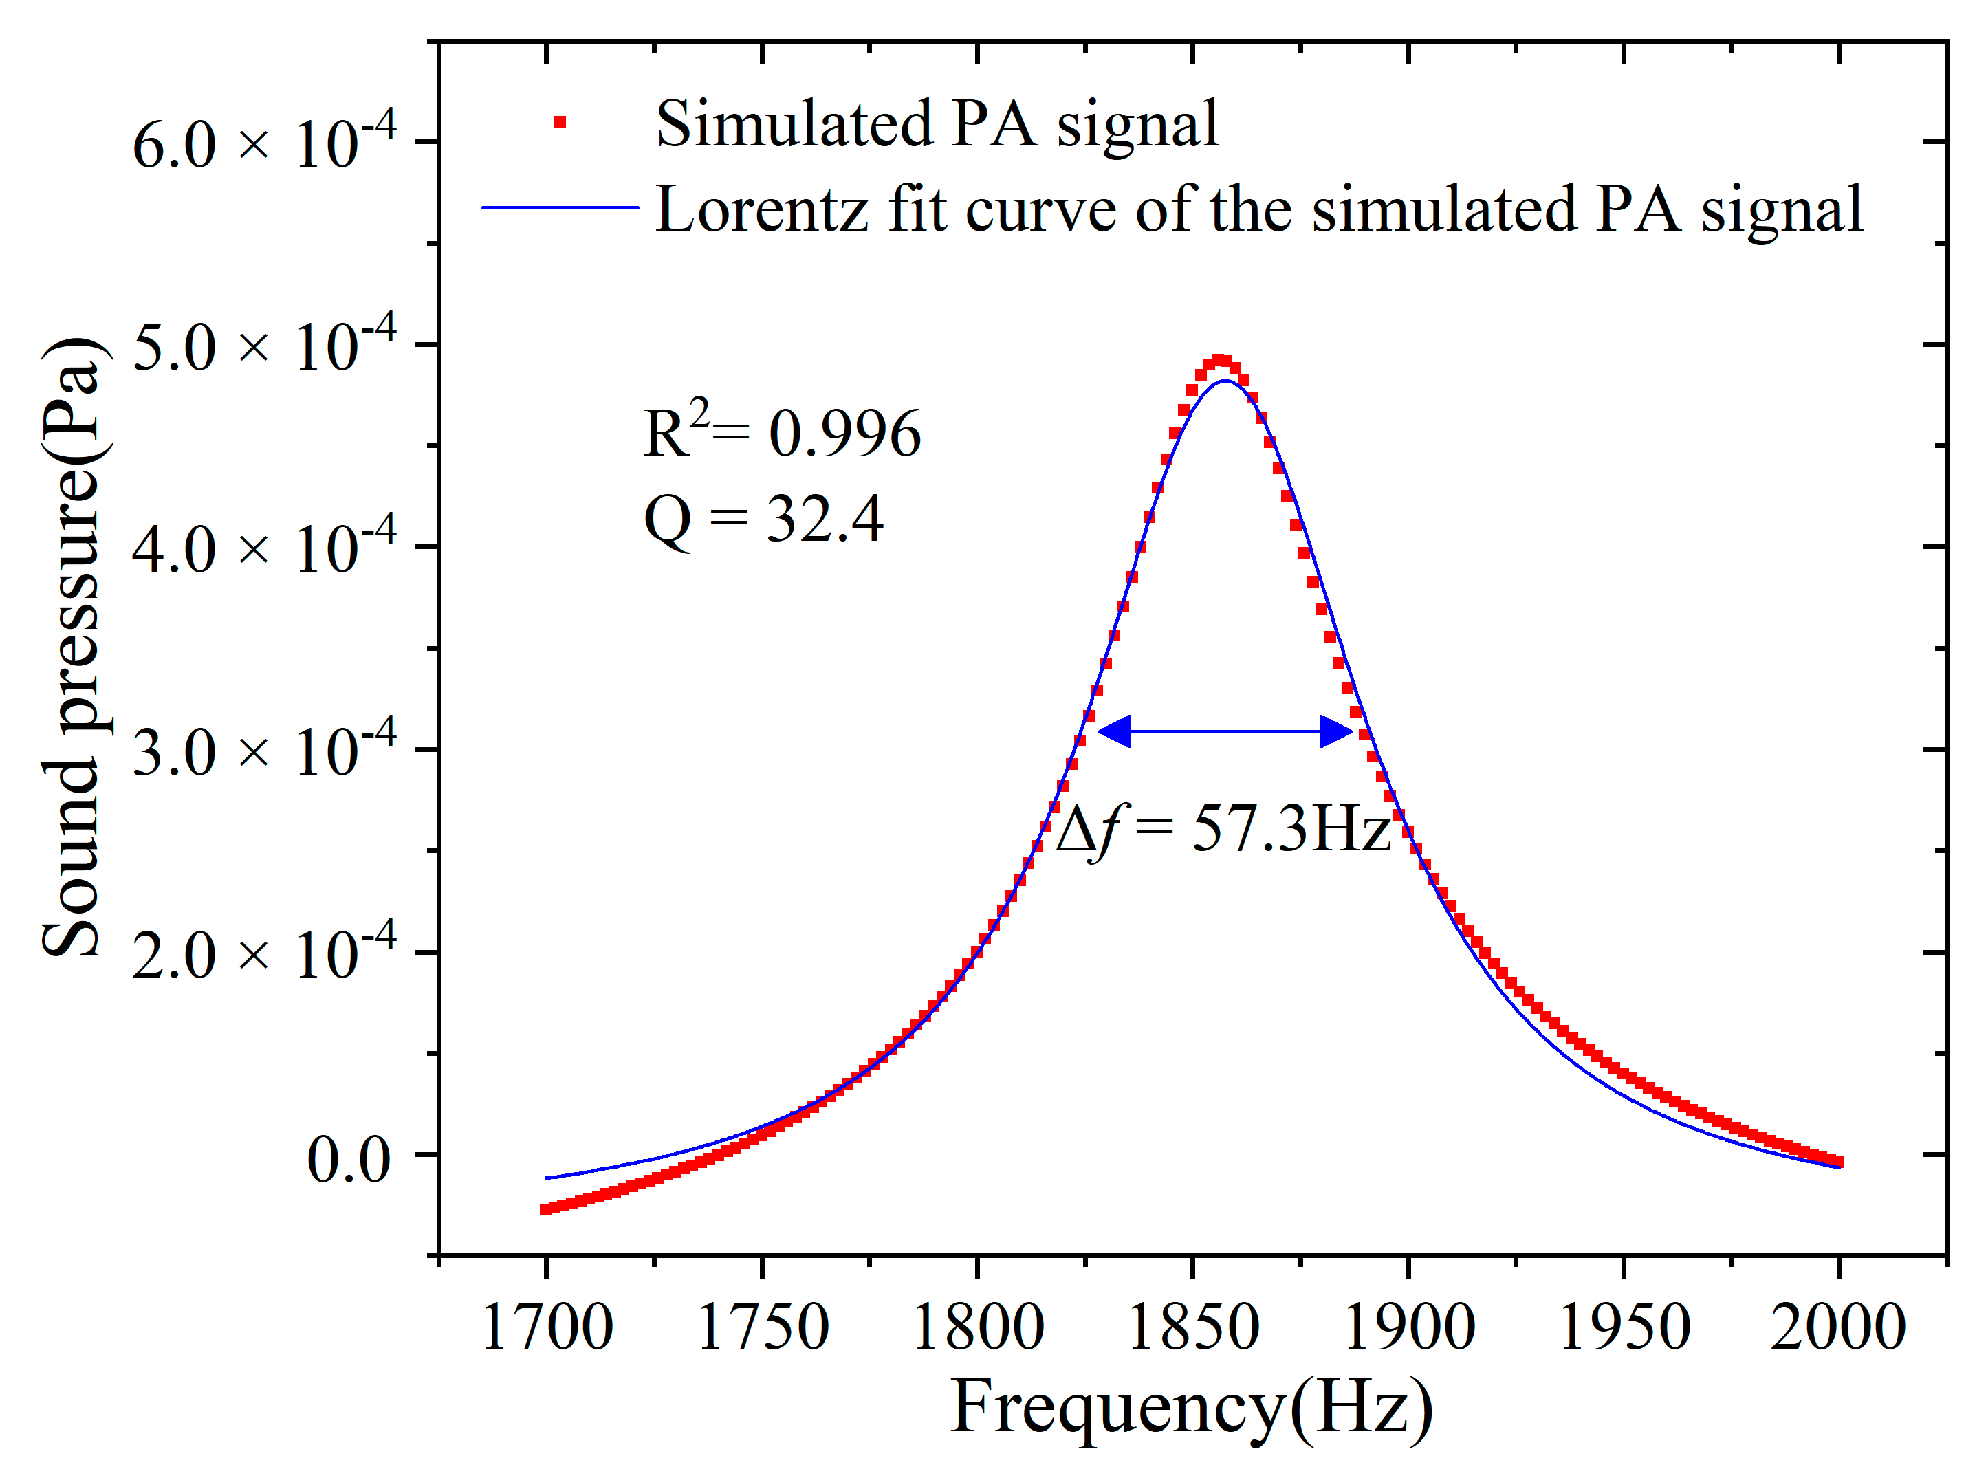
2.2.2. Simulation Model Verification of the PA Cell

To obtain the frequency response of the simulated PA cell, the sound pressure at the zero axis of the PA cell was swept with a step size of 5 Hz and a frequency range of 50 to 6500 Hz. The magnitude of the frequency response at the center of the PA cell was obtained and is shown in Figure 2. The simulation value of the quality factor can be calculated by Equation (3). As illustrated in Figure 2, the sound pressure reaches its peak at around 1675 Hz and 5050 Hz, corresponding to the first-order and third-order longitudinal resonant frequencies, respectively [12]. It can also be observed that the sound pressure intensity of the first-order normal mode antinode is significantly higher than that of the third-order normal mode. Additionally, as illustrated in Figure 2, the photoacoustic signal gradually increases as the sound pressure frequency decreases when below 500 Hz. This is because when the frequency is much lower than the first-order resonant frequency, the photoacoustic cell operates in a non-resonant mode. In this mode, the photoacoustic signal is inversely proportional to the modulation frequency [32].
The distribution pattern of the sound field in the first-order longitudinal resonant PA cell is verified by conducting a frequency sweep along the longitudinal direction of the PA cell with a step size of 25 Hz and a frequency range of 1600 to 1700 Hz. Figure 3 shows the frequency response, revealing that the sound field near the resonant frequency takes the form of a quadratic parabola. The strongest photoacoustic signal is detected at the center of the resonator, and the end correction is also observed. The zero sound pressure nodes are extended to about ~4.3 mm to both sides, rather than being at the two ends of the resonator at the abscissas of −50 mm and 50 mm. The simulation results match the effective length of the PA cell Leff calculated by Equation (5), which is 4.24 mm.
To derive the quality factor and cell constant of the simulation model, the sound pressure value at the center of the PA cell is swept with a step size of 2 Hz and a frequency range of 1550 to 1800 Hz. Figure 4 presents the resulting frequency response and the Lorentzian fitted function. It can be seen that the simulated value of the resonance frequency fsim is 1673.3 Hz. The simulation value of the quality factor Qsim is calculated as 31 according to Equation (3).
By applying Equation (1), the PA cell constant can be expressed as:
C cell = p ( r , ω j ) P 0 α
The absorption coefficient α of CH4 with a concentration of 100 ppm at a wavelength of 1653.7 nm is 3.63 × 10⁻⁵ cm−1 [33]. From the sound pressure of 6.1 × 10⁻⁴ Pa at the resonant frequency in Figure 4, the simulation value of the cell constant Csim can be obtained as 3734.3 Pa∙cm/W.
After substituting the cavity length Lc with 100 mm and the cavity radius Rc with 2.5 mm into Equations (2), (4) and (8), the analytical parameters of the PA cell were obtained. Table 1 shows a comparison between the analytical and simulated parameters, and it can be seen that they are in agreement.

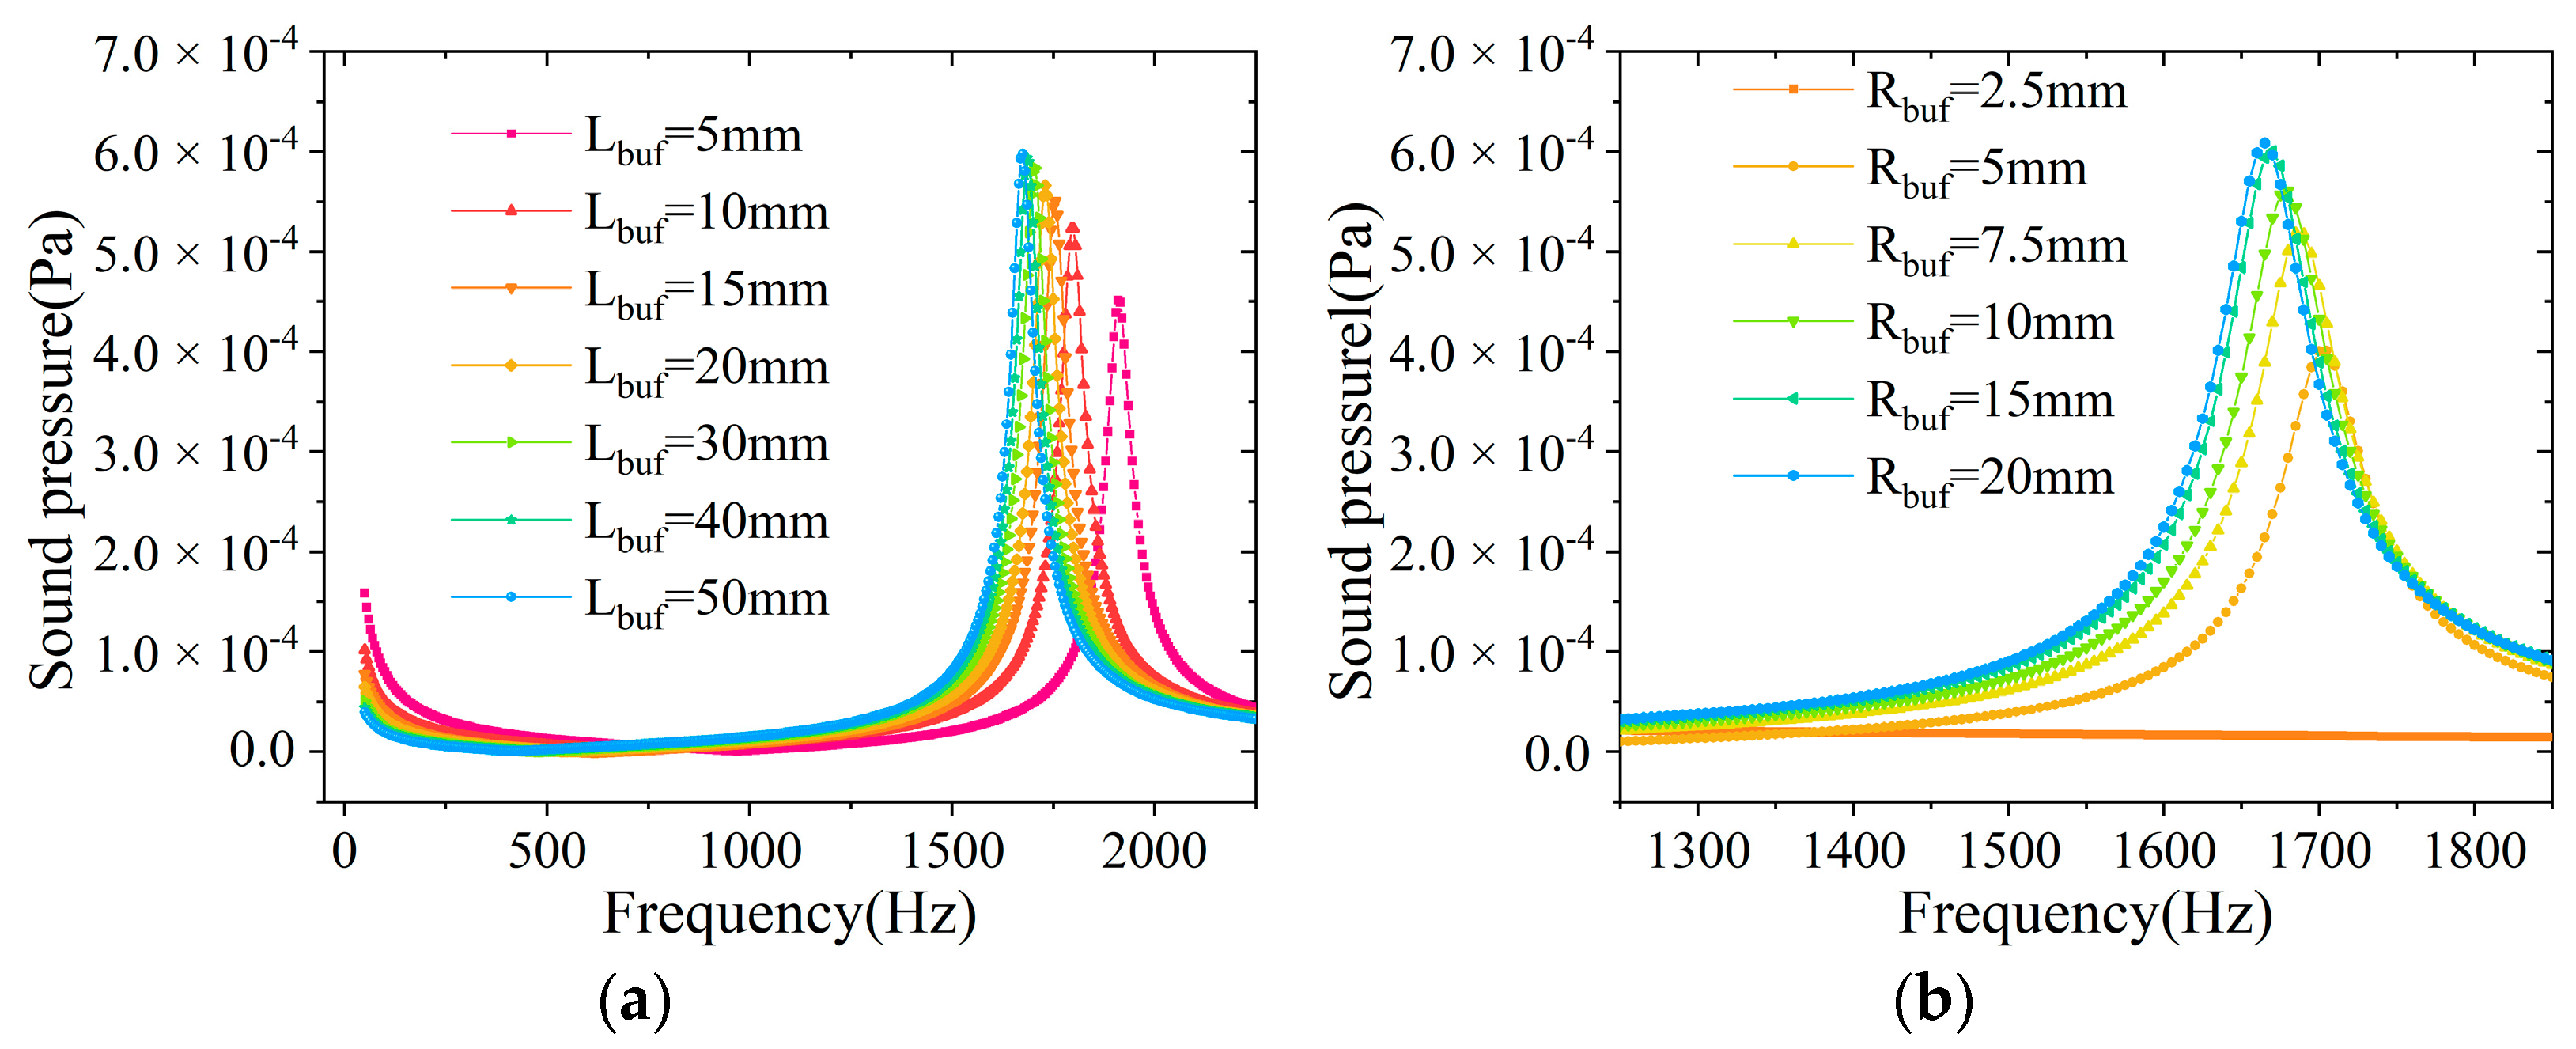
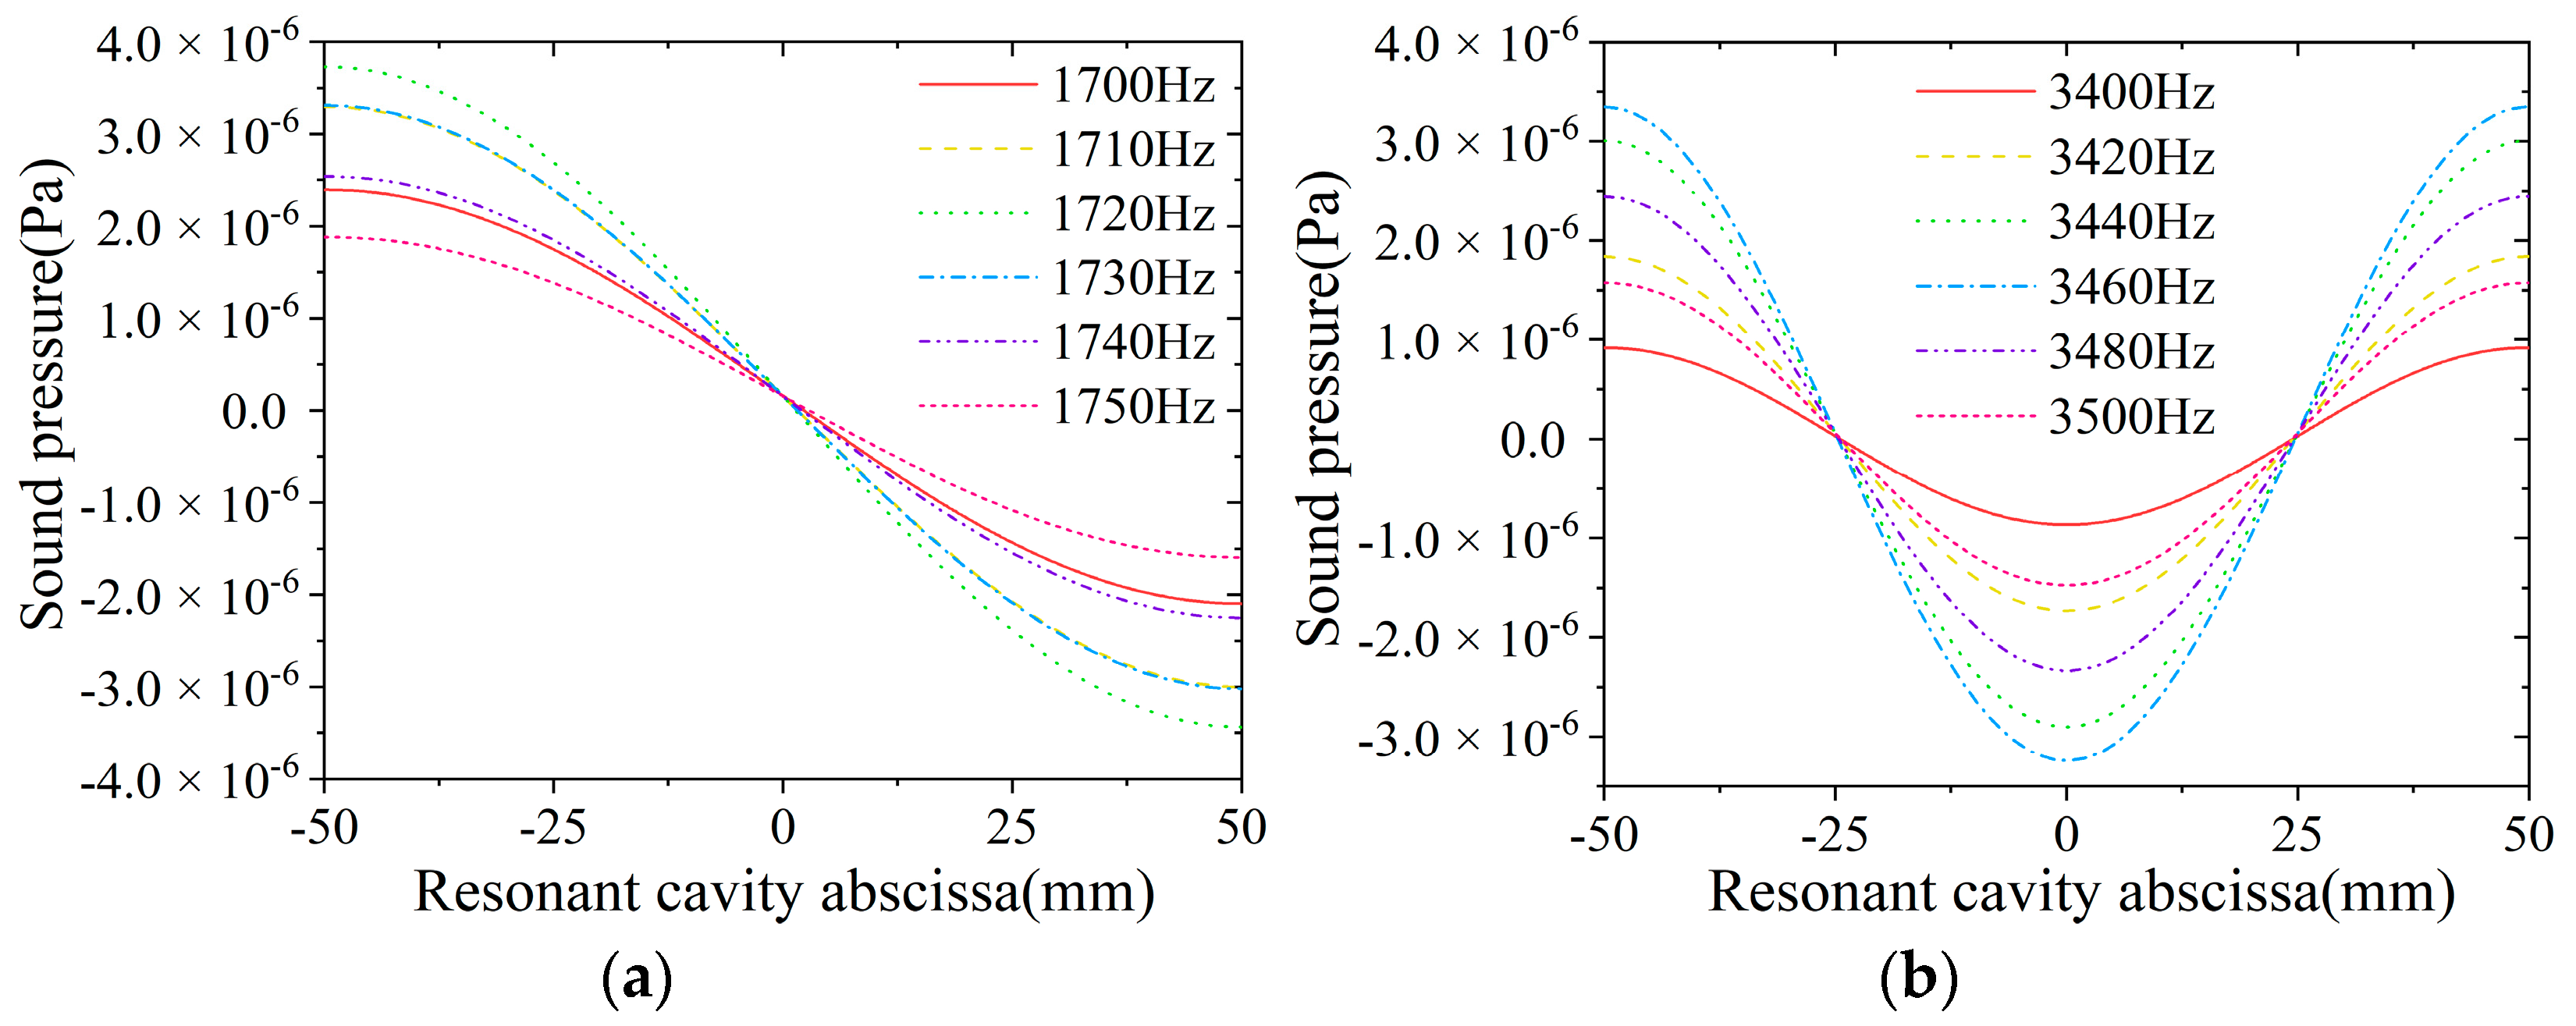
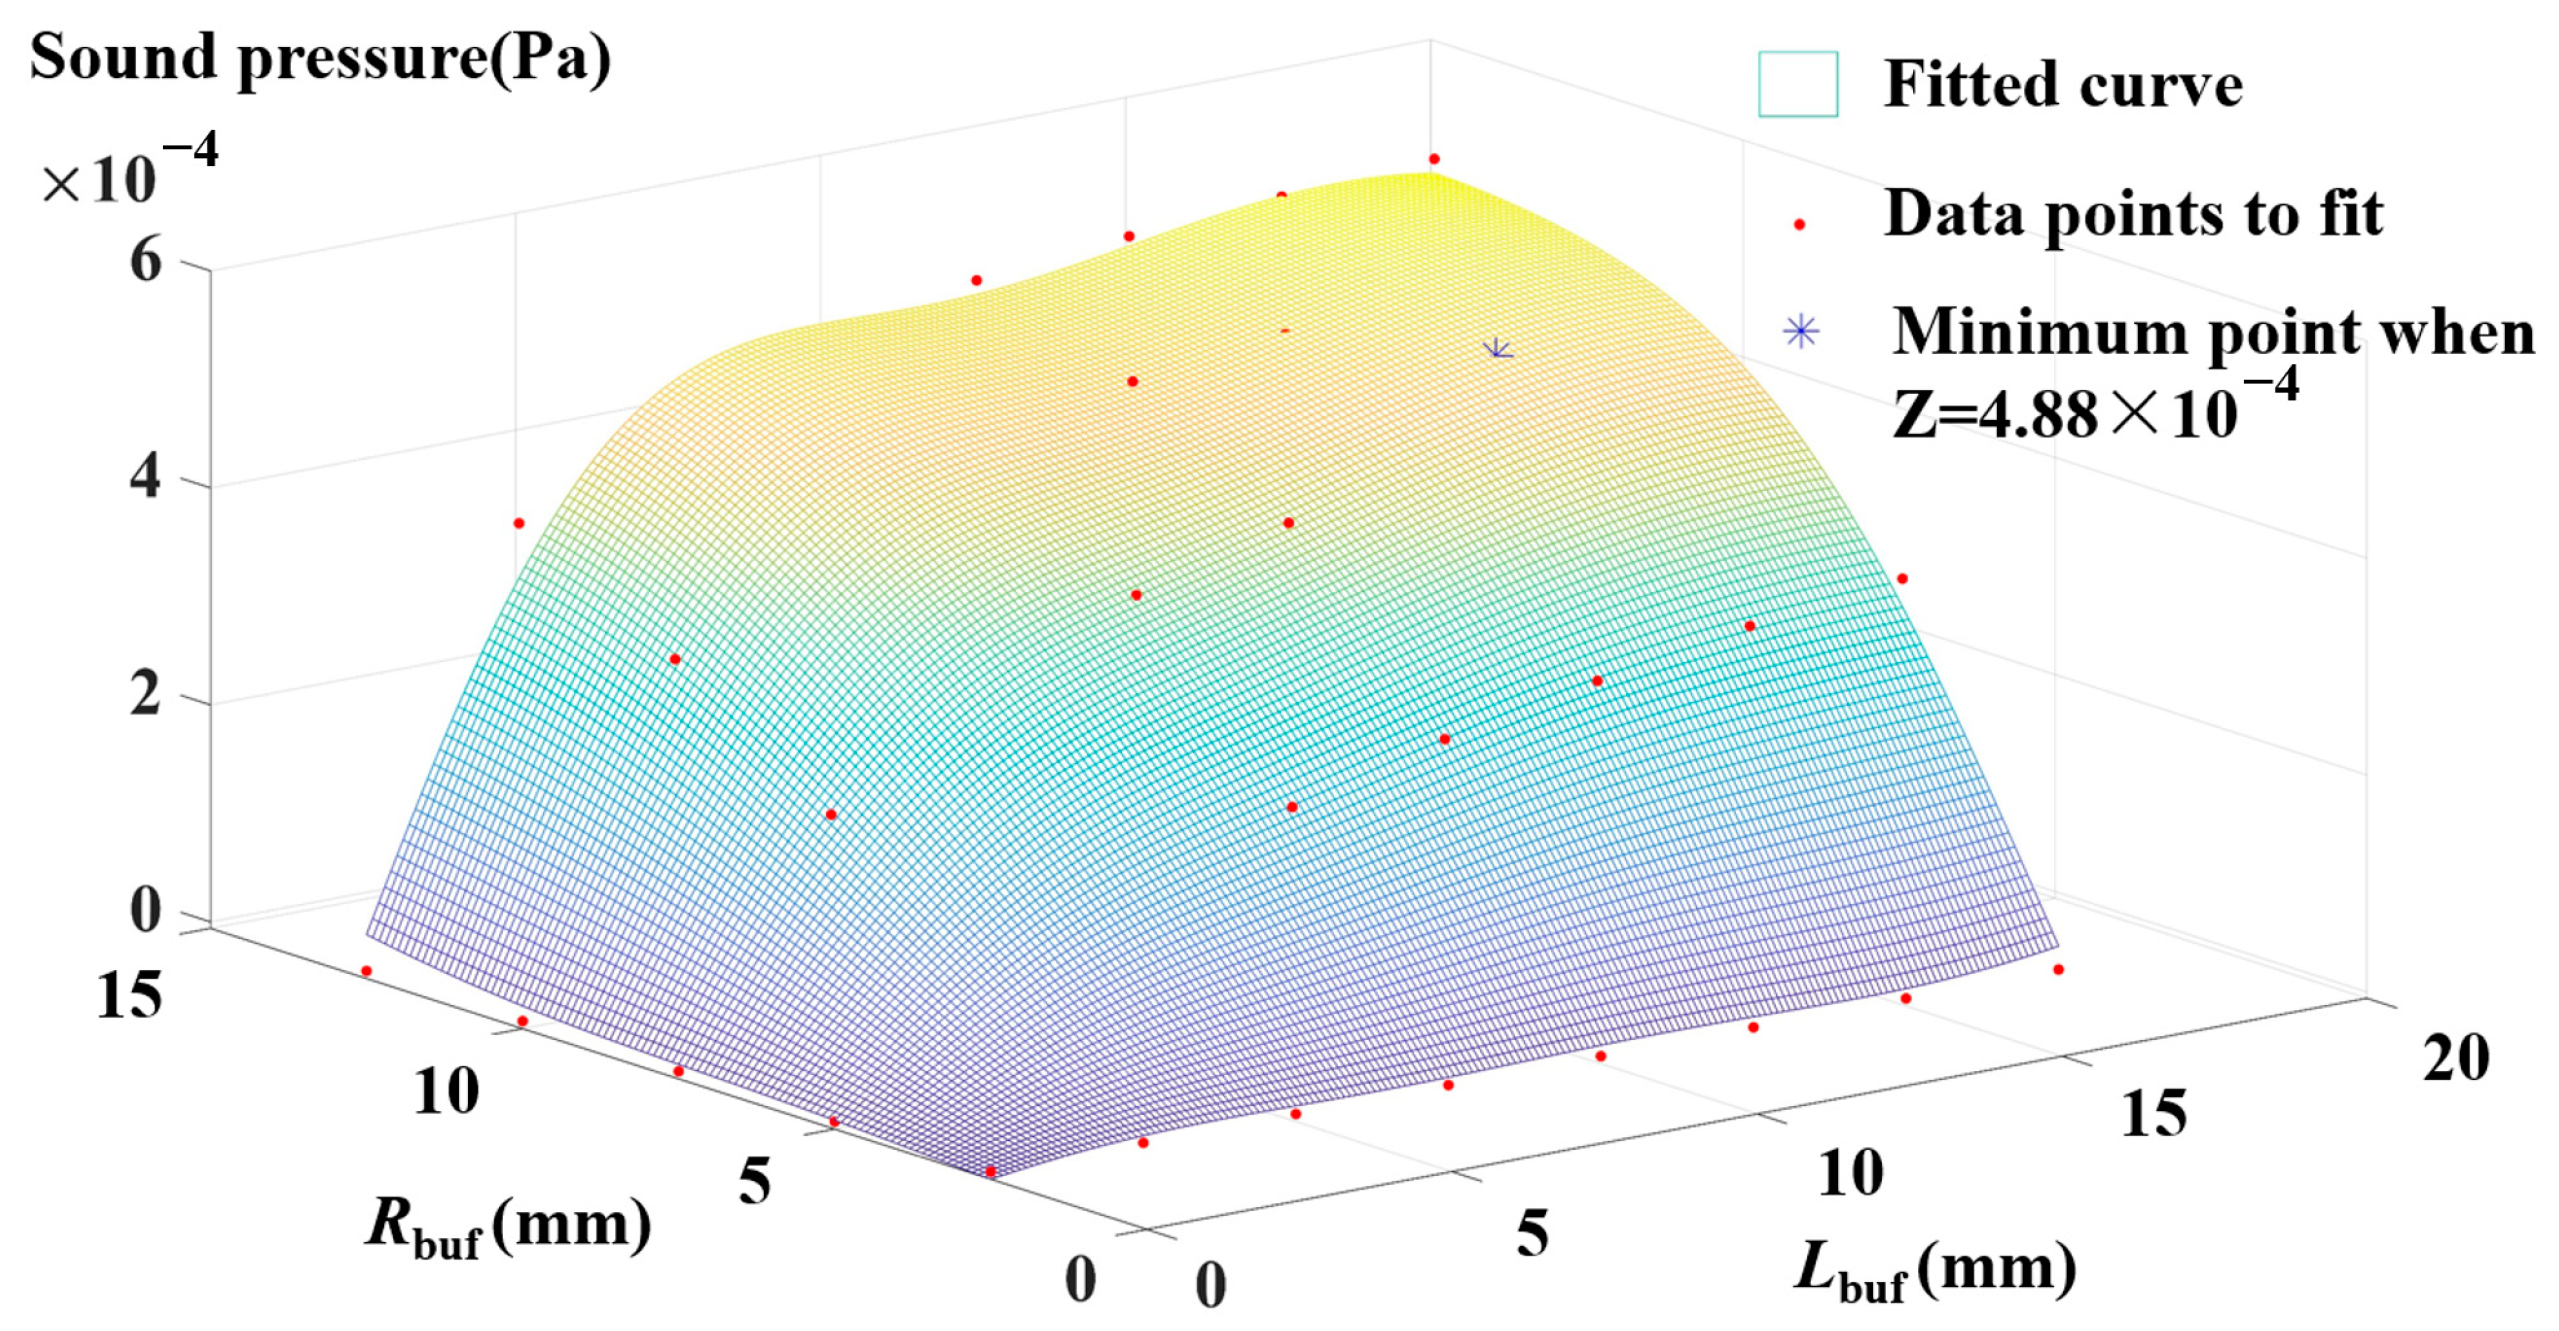
2.3. Simulation Optimization of the PA Cell

The photoacoustic cell model depicted in Figure 1 includes buffer chambers at both ends. The buffer chamber substantially improves the gas volume, resulting in a buffer chamber volume that is 6.25 times larger than that of the PA cell. This structure limits the PA cell’s application due to the finite gas to be detected. Although the buffer chamber can effectively shield the noise caused by the photoacoustic signal from the glass window and enable the PA cell to measure the flowing gas, this advantage is not necessary for detecting dissolved gas in transformer oil. Moreover, wavelength modulation of the laser instead of mechanical chopping can effectively eliminate the photoacoustic signal caused by the glass window [34]. Therefore, reducing the buffer chamber size while meeting the gas volume requirement can significantly improve the PA cell’s application without affecting its performance.
To investigate the effect of the buffer chamber size on the PA cell’s performance, we set Rc to 2.5 mm, Lc to 100 mm, Rbuf to 12.5 mm, and scanned the length with a step size of 10 mm and a range of 5 to 50 mm, as shown in Figure 5a. We also set Lbuf to 50 mm and scanned the radius with a step size of 2.5 mm and a range of 2.5 to 20 mm, as shown in Figure 5b. As depicted in Figure 5, increasing the buffer chamber length and radius gradually decreases the PA cell’s resonance frequency and increases the photoacoustic signal. The reason behind this is that the acoustic field coupling changes when the buffer chamber size is reduced, causing the resonator’s effective length to no longer meet the end correction requirement. However, the impact of the buffer chamber is noticeable only when the length or radius of the chamber is reduced to approximately 5 mm.
Furthermore, Figure 5a reveals a reverse correlation between the length of the buffer chamber and the photoacoustic signal at low frequencies. The analysis indicates that this is due to the non-resonant mode of the photoacoustic cell at frequencies much lower than the first-order resonance frequency. In non-resonant PA cells, the photoacoustic signal exhibits an inverse relationship with the volume of the cell [35]. Thus, the low-frequency range exhibits a reverse relationship between the photoacoustic signal and the length of the buffer chamber.
Figure 5b illustrates that a resonance peak is almost non-existent in the center of the PA cell when the radius of the buffer chamber is equivalent to that of the resonant cavity. In this situation, the cylindrical PA cell consists of the resonant cavity and the buffer chamber, and it measures 200 mm in length with closed ends. In the case of a first-order longitudinal resonance PA cell with closed ends, the antinodes of the standing waves are symmetrically distributed at both ends of the cell. To analyze the photoacoustic signal in the PA cell with closed ends, a PA cell model without the two buffer chamber structures is established, with Rc set to 2.5 mm and Lc set to 100 mm. Frequency sweeps are conducted along the longitudinal direction, with a step size of 10 Hz and frequency range of 1700 to 1750 Hz for the first-order frequency response shown in Figure 6a, and a step size of 20 Hz and frequency range of 3400 to 3500 Hz for the second-order frequency response shown in Figure 6b. Figure 6 demonstrates that in the PA cell with closed ends, the sound field near the resonant frequency is distributed in a cosine function within the resonator. However, when comparing Figure 5 with Figure 6, it can be observed that the photoacoustic signal in the PA cell with both ends open is significantly stronger than that in the PA cell with closed ends for the first-order longitudinal PA cell. This is mainly because the surface loss at both ends of the PA cell with closed ends is much larger than that of the PA cell with both ends open. Therefore, the resonant openings at both ends of the PA cell cannot be closed simply to reduce the gas volume.
In the PA cell with openings at both ends, the analytical solution assumes that both ends of the resonator are connected to the external atmosphere; therefore, the effect of the buffer chamber volume on the photoacoustic signal cannot be quantified. To analyze the influence of the buffer chamber size on the photoacoustic signal, a simulation model is employed where the resonator radius Rc is set to 2.5 mm and the length Lc is set to 100 mm. Parametric scanning of the buffer chamber length and radius is performed while keeping the resonator size constant. The sound pressure values at the first-order resonance frequency under different buffer chamber sizes are recorded as parameter points. These parameter points in the 3D space are fitted by support vector regression (SVR), and the results are presented in Figure 7.
Figure 7 illustrates that the sound pressure at the first-order resonance frequency gradually decreases with the reduction of both cavity length Lbuf and radius Rbuf. This decline occurs because when the buffer chamber’s volume is too small, the resonator no longer conforms to the PA cell model with openings at both ends. Instead, it falls somewhere between the PA cells with openings at both ends and the ones that are closed at both ends. As a result, the surface loss on the buffer chamber’s end face impacts the resonator’s photoacoustic signal. When the radius or length of the buffer chamber approaches zero, the resonator converts from open-ended to closed-ended, and the photoacoustic signal significantly decreases.
The resonance enhancement effect of the resonant PA cell makes it highly valuable to trade a part of the enhancement for a considerable reduction in the volume demand. With the sound pressure amplitude set to 4.88 × 10⁻⁴ Pa and nonlinear equation constraint used, a buffer chamber radius Rbuf of 8.5 mm and length Lbuf of 14.4 mm is obtained when the PA cell’s volume reaches its minimum value. Figure 7 shows the corresponding data points.
To obtain the optimized model’s quality factor and cell constant, the sound pressure value at the center of the PA cell is swept with a step size of 2 Hz and a frequency range of 1700–2000 Hz. The resulting frequency response plot and fitted Lorentzian function are shown in Figure 8. The simulated resonance frequency fsim is 1857.6 Hz and the simulated quality factor Qsim is 32.4, which are calculated using the Lorentz-fitting function and Equation (3). The absorption coefficient α of CH4 with a concentration of 100 ppm at a wavelength of 1653.7 nm is 3.63 × 10⁻⁵ cm−1 [33]. From the sound pressure 4.91 × 10⁻⁴ Pa at the resonant frequency in Figure 8 and Equation (9), the simulated cell constant Csim of the PA cell can be calculated as 2883.37 Pa∙cm/W. As shown in Figure 4, in the classical model of the PA cell with openings at both ends, the sound pressure for the same size resonator is 6.1 × 10⁻⁴ Pa. The volume of the PA cell is reduced from 51 mL to 8.5 mL, which is about 20% of the original volume.

2.4. Photoacoustic Spectroscopy Gas Detection with the Optimized PA Cell

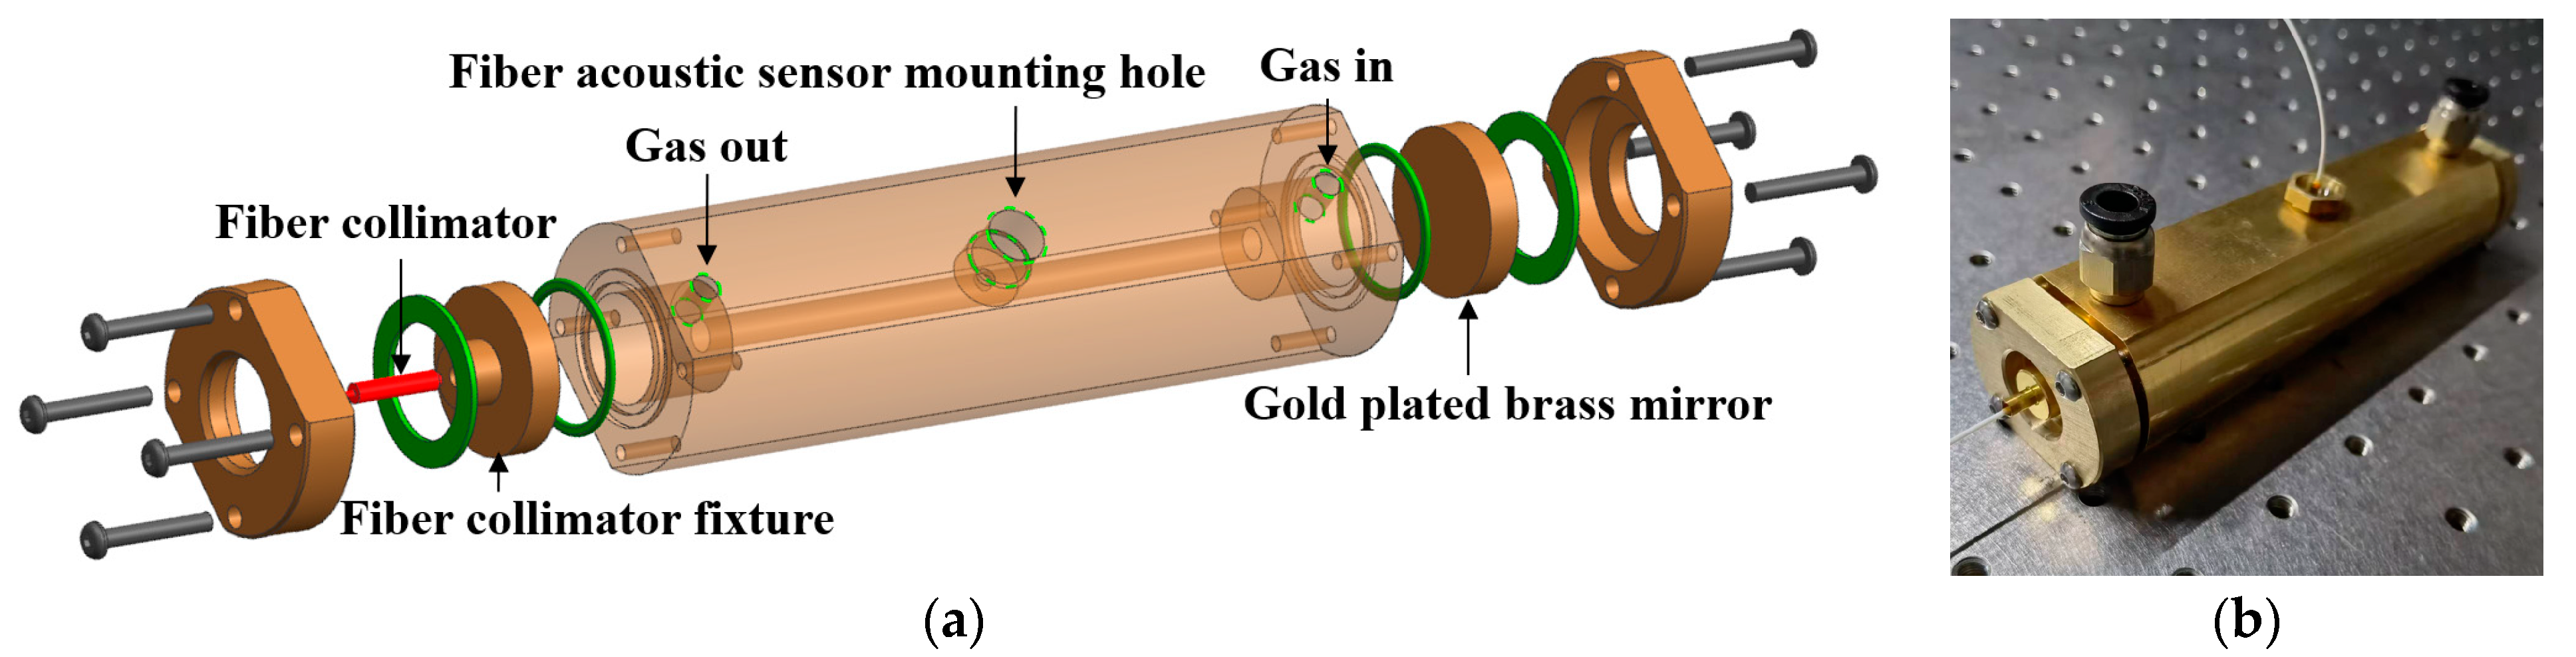
2.4.1. Design and Fabrication of the Optimized Buffer Chamber PA Cell

A resonant brass material PA cell with optimized buffer chambers was built based on the simulation. The schematic diagram is shown in Figure 9a, and the image of the PA cell is shown in Figure 9b. The resonator has a radius of 2.5 mm and a length of 100 mm, while the buffer chamber has a radius of 8.5 mm and a length of 14.4 mm. To maintain the stability of the optical path and avoid a reduction in the excitation light power, the laser input window was replaced with a brass fiber collimator fixture, which can directly couple the excitation light into the PA cell. The angle of the fiber collimator was carefully calibrated to prevent the excitation light from contacting the resonator. The laser output window was replaced with a gold-plated brass mirror to increase the action path between the gas to be measured and the excitation light and improve the intensity of the photoacoustic signal. Moreover, the brass structure can resist external noise more effectively than a quartz window. To prevent the change in the sound velocity inside the PA cell due to temperature changes, a heating resistance wire was wrapped outside of the PA cell to maintain a constant temperature.

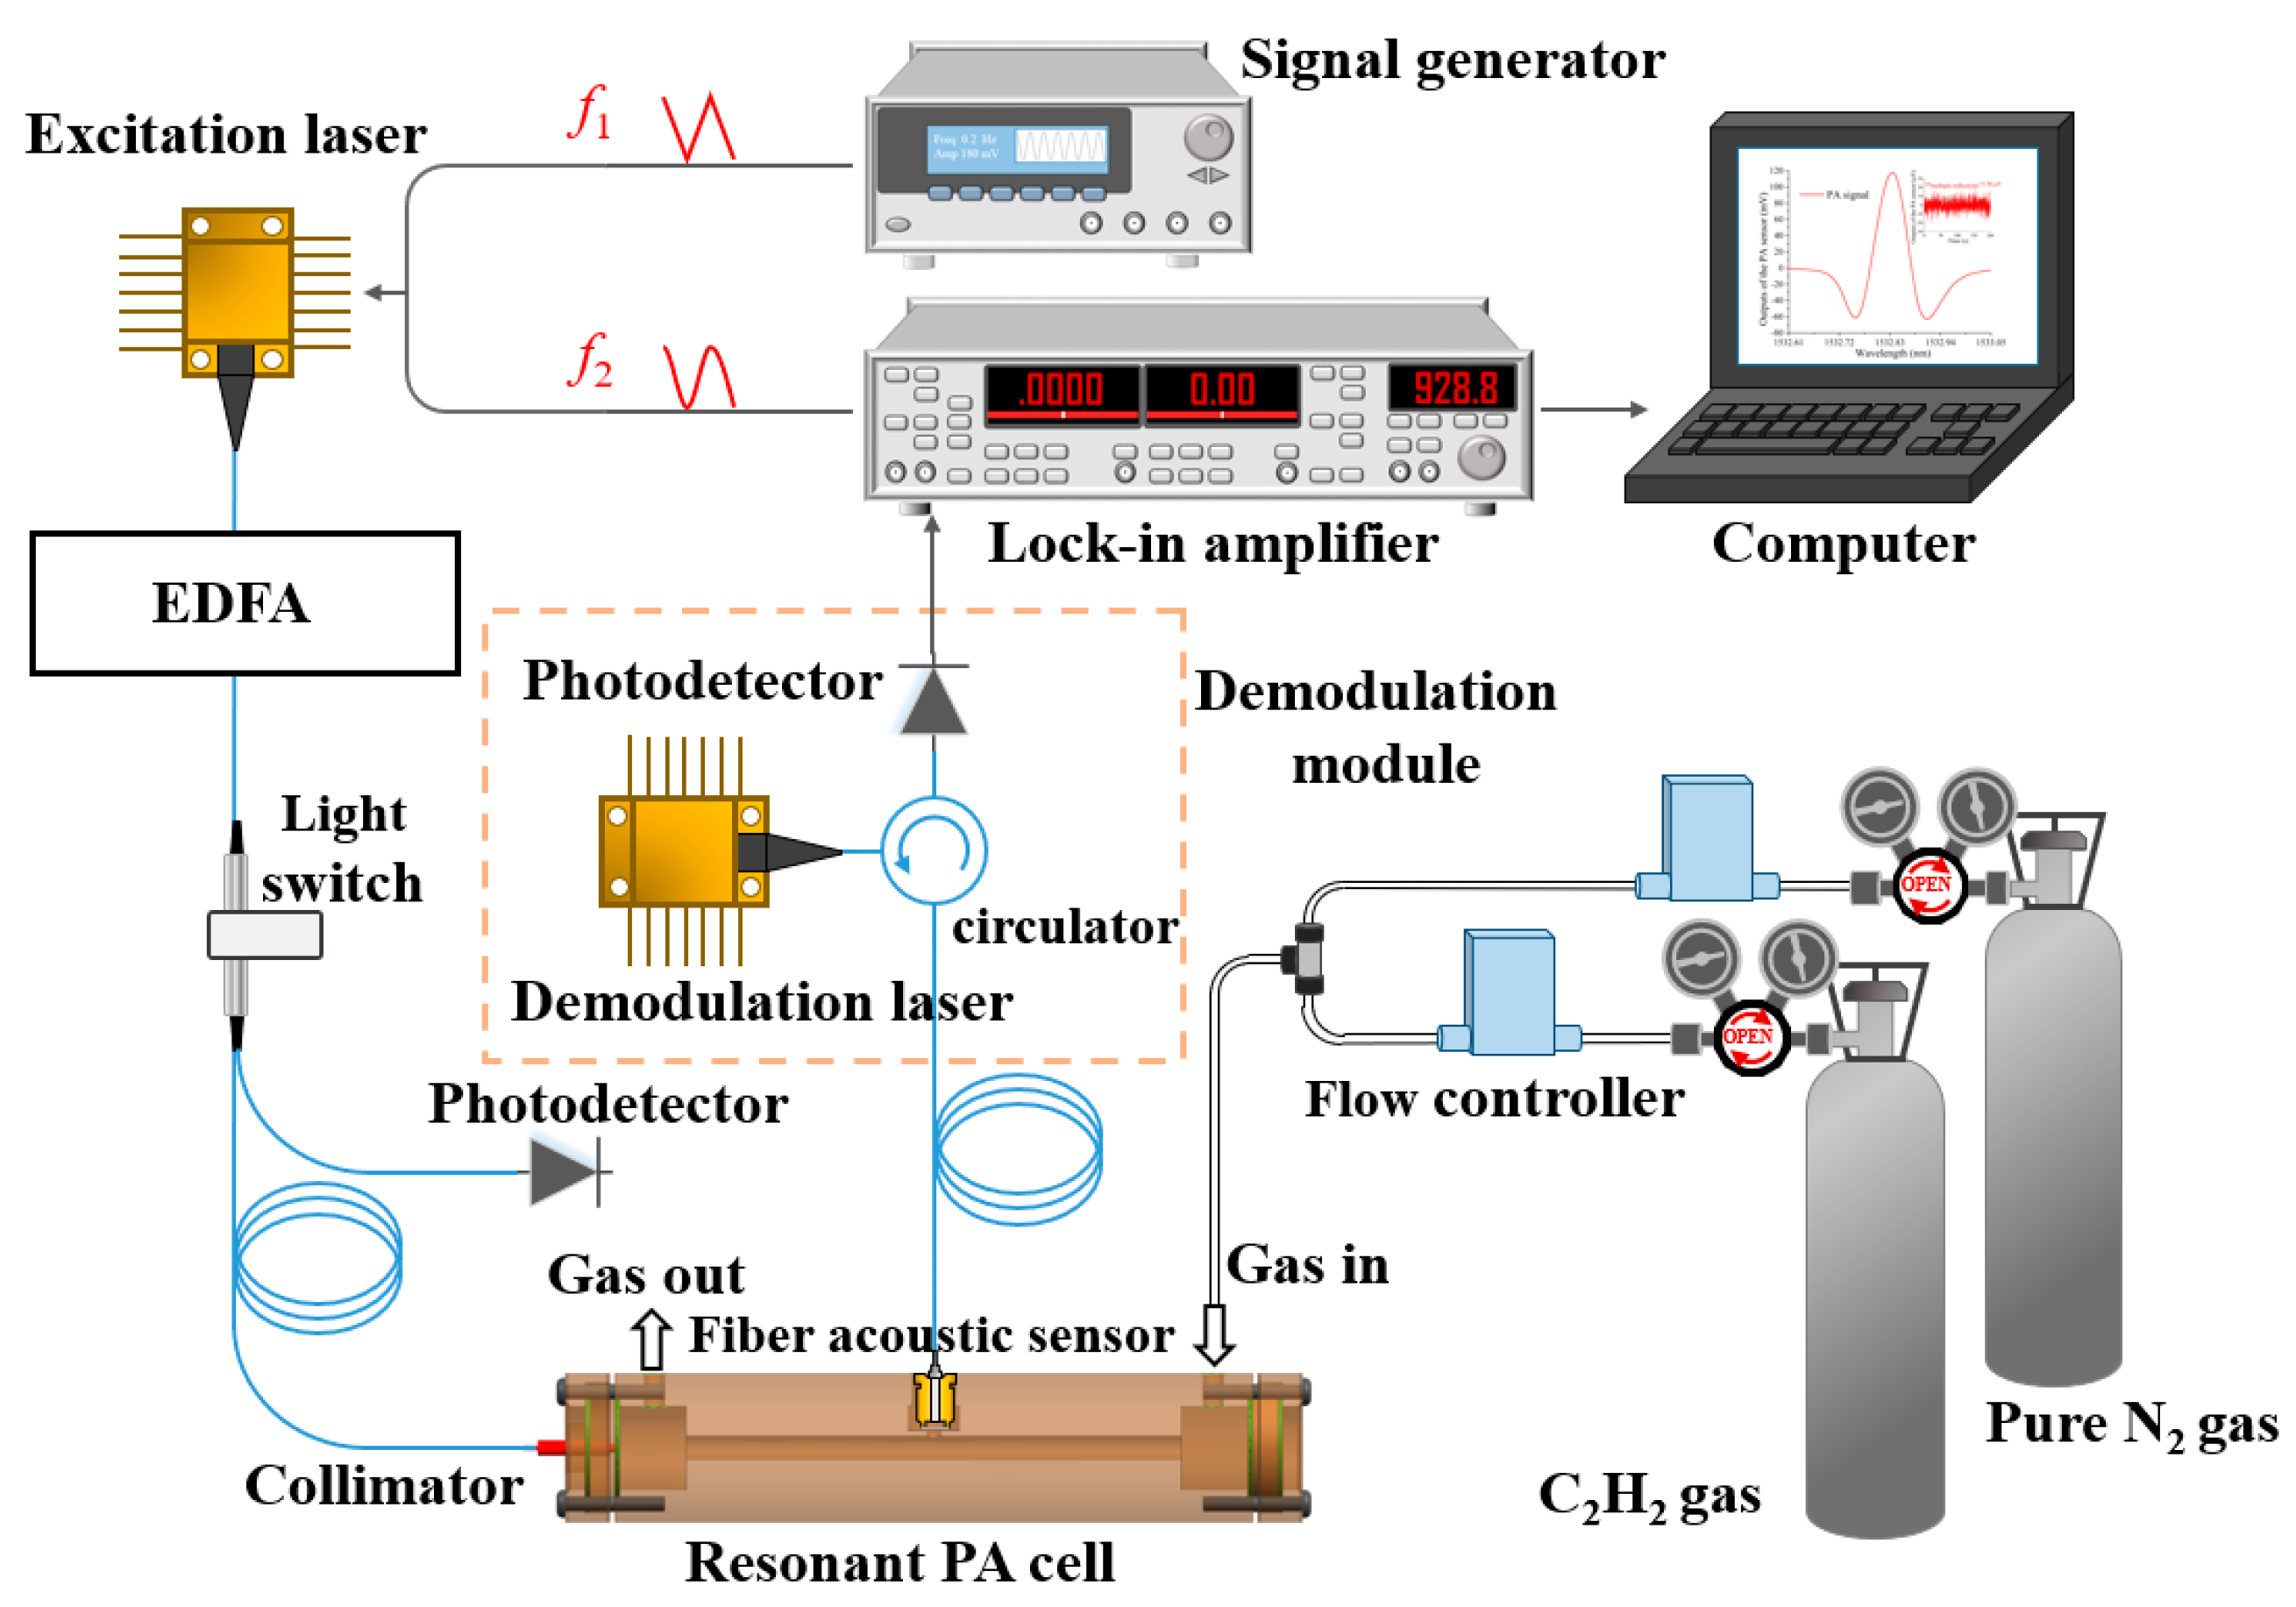
2.4.2. Construction of a Dual-Resonance Photoacoustic Spectroscopy Gas Detection System

The overall configuration for the photoacoustic spectroscopy system is presented in Figure 10. Initially, the heating resistor outside the PA cell is activated to maintain a consistent temperature. The residual gas from the previous measurement is then evacuated using pure N2 gas. The flow controller is utilized to introduce the required concentration of the gas into the PA cell. Afterward, the gas inlet and outlet are sealed to allow the gas to settle. The signal generator (AFG3022C, Tektronix, Beaverton, USA) produces a low-frequency triangular signal f1 merged with the high-frequency sinusoidal signal f2, which is output by a lock-in amplifier (SR830, SRS, Sunnyvale, CA, USA). These merged signals fine-tune the excitation laser for generating the photoacoustic signal. Before each measurement, the optical switch is toggled to transmit the excitation laser into the optical power meter to examine any optical power drift. After obtaining the optical power reading, the optical switch is switched to irradiate the excitation laser into the PA cell. A handmade cantilever fiber acoustic sensor senses the photoacoustic signal. The cantilever beam has dimensions of 2.1 mm in length, 1.4 mm in width, and 10 μm in thickness. The sensor operates on the principle of Fabry-Perot (F-P) interference formed between the cantilever beam and the single-mode fiber. The weak vibration of the cantilever beam is detected by the change in light intensity in the photodetector. The light intensity exchange is further demodulated and extracted by a lock-in amplifier and subsequently analyzed using a computer.
In transformer Dissolved Gas Analysis (DGA) applications, acetylene is a crucial gas to detect as it indicates high-energy discharge. Precise detection of low-concentration acetylene gas produced in the transformer can effectively detect such discharge. Therefore, acetylene gas was used to test the photoacoustic spectroscopy gas detection system.

3. Results

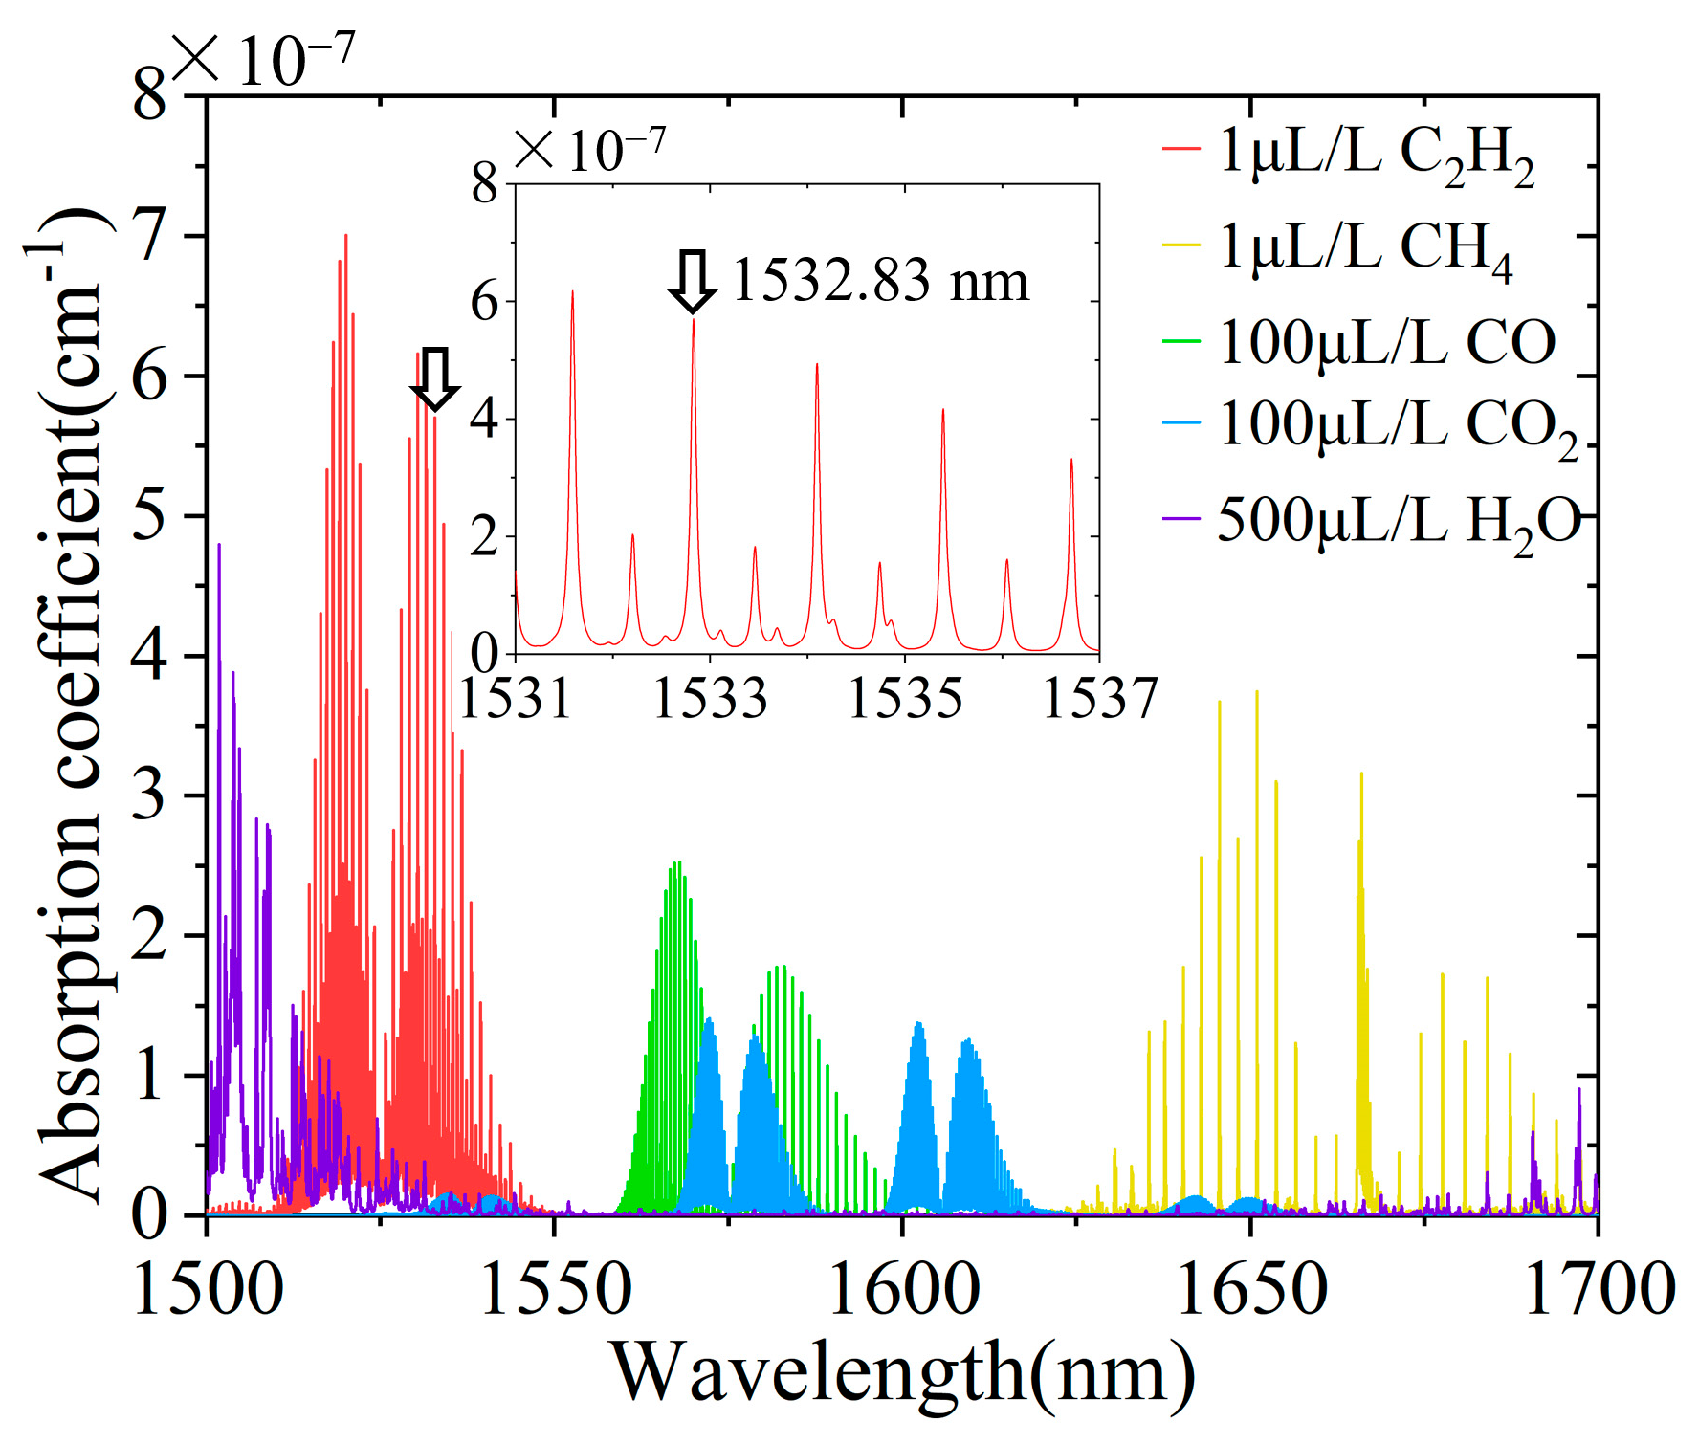
3.1. The Absorption Lines of C2H2

To achieve better visibility, the absorption spectra of the characteristic gas dissolved in transformer oil and water vapor are depicted in Figure 11 at varying concentrations. It was generated using the HITRAN database, utilizing the Voigt linear function with a temperature of 296 K and gas pressure of 1 atm [33]. It can be observed from Figure 11 that C2H2 gas exhibits a strong absorption effect in the vicinity of a 1530 nm wavelength, with minimal interference from other gas absorption lines. To obtain a more detailed view of the C2H2 absorption spectrum line near the 1530 nm wavelength, an enlarged image is provided in the attached figure within Figure 11. Due to the wide distribution of water vapor absorption lines and their high concentration, this system employs a wavelength of 1532.83 nm for the C2H2 absorption line to avoid the absorption line of H2O and other characteristic gases while accounting for the absorption coefficient of C2H2.

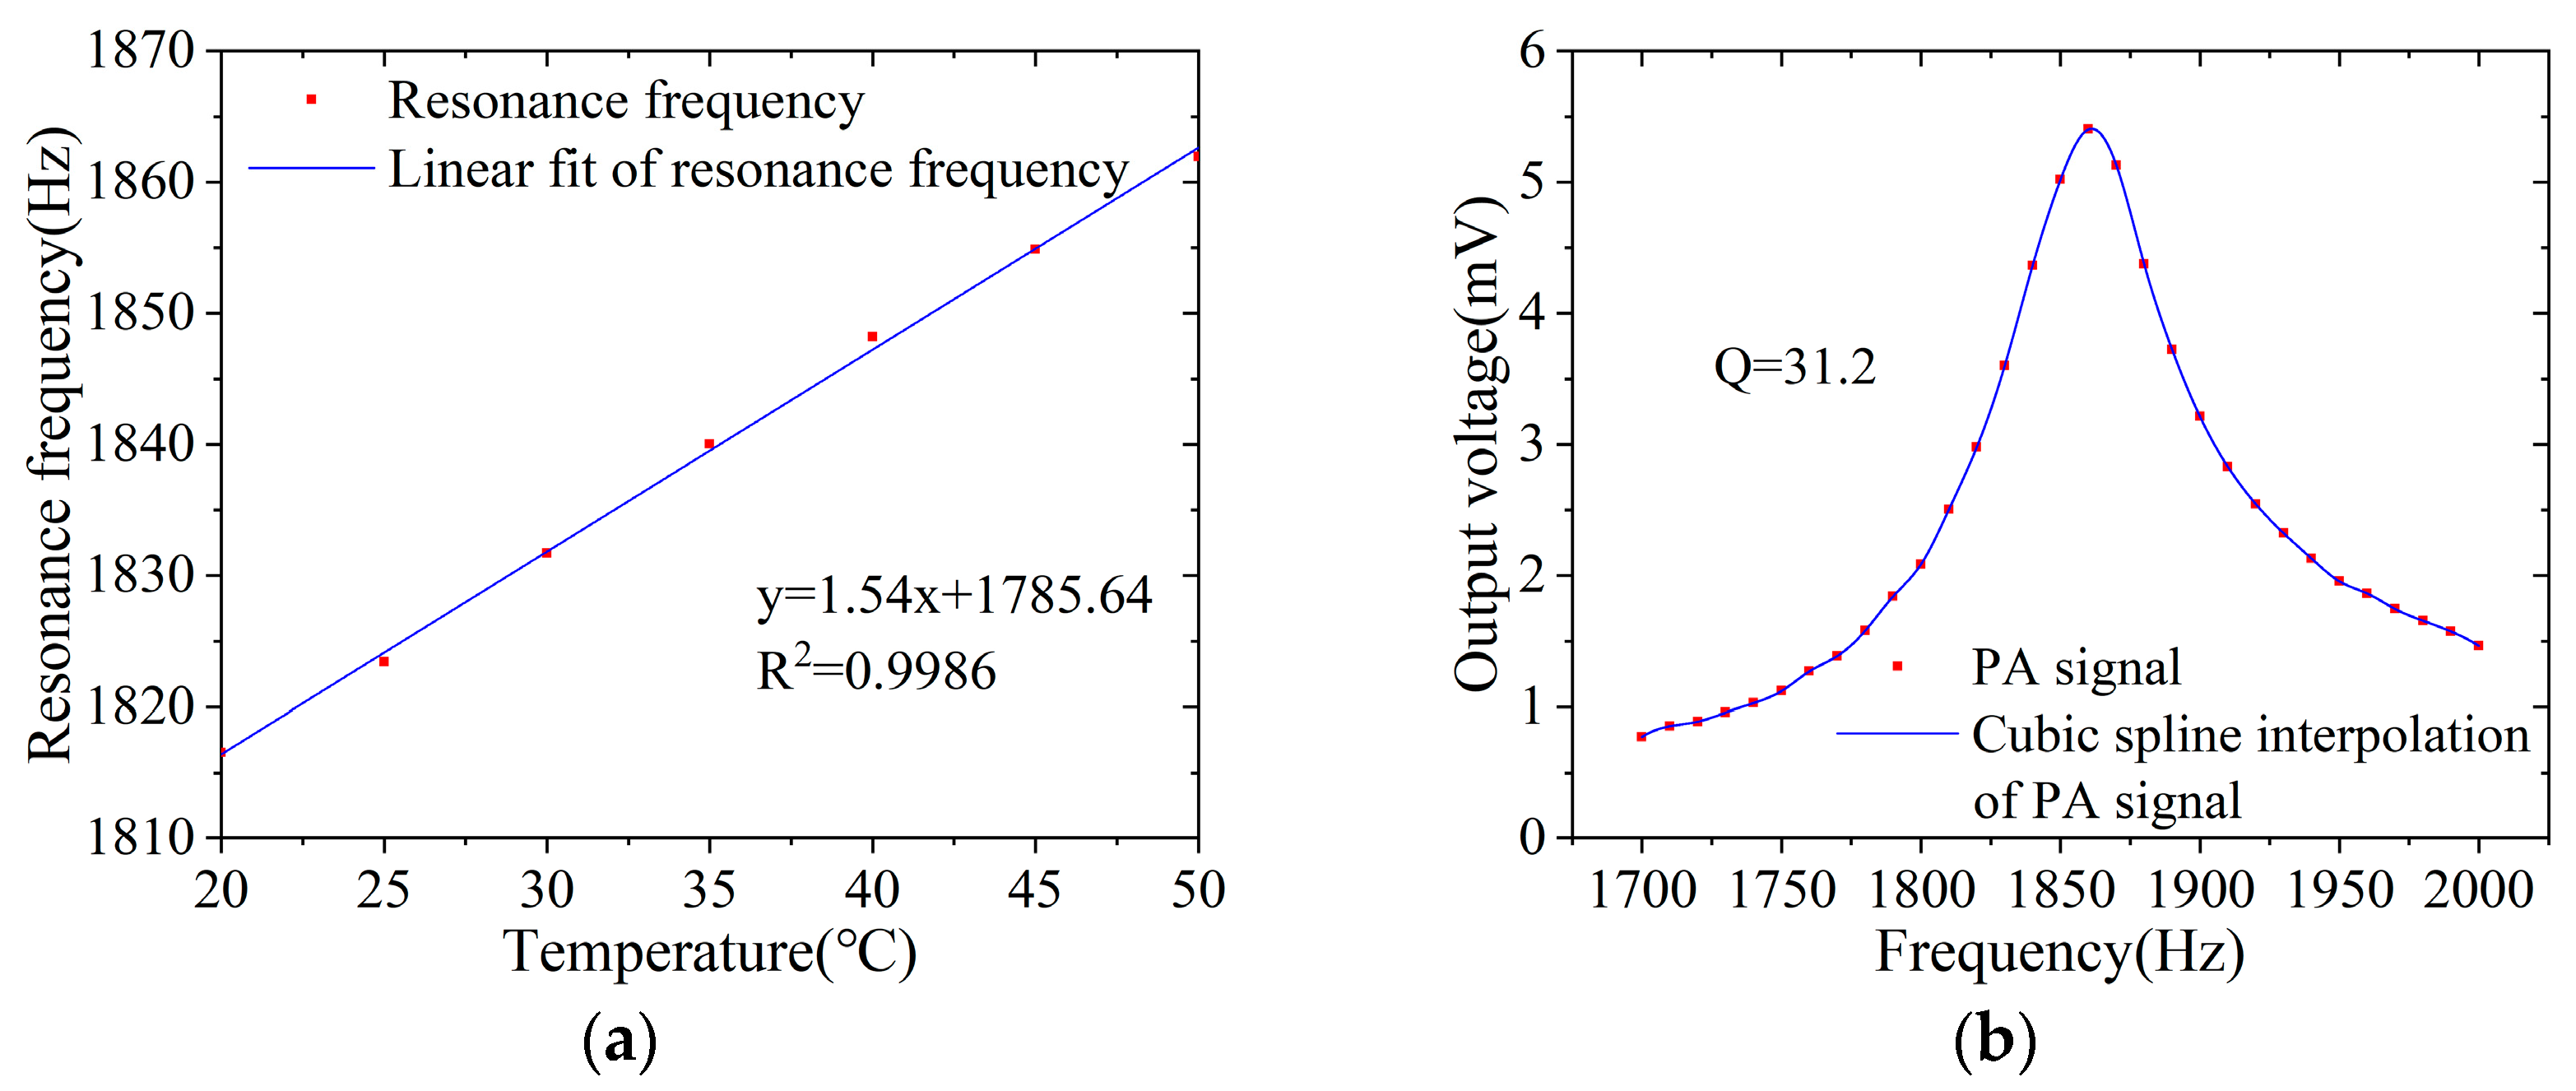
3.2. Resonant Frequency Measurement of the PA Cell

To ensure the accurate measurement of the resonant frequency, it was necessary to determine the actual value since theoretical values may differ from the actual ones. A commercial electric microphone (EK23024, Knowles, Itasca, IL, USA) with a flat response in the range of 1700–2000 Hz was placed at the acoustic sensor mounting hole of the PA cell. A flow controller was used to pass 100 ppm C2H2 gas into the PA cell, and the operating temperature of the laser was adjusted to lock the central wavelength to 1532.83 nm. The laser power output by the EDFA was set to 100 mW, and a 1700–2000 Hz sweep of the second harmonic frequency was conducted. The actual value of the resonance frequency of the PA cell at room temperature was measured to be 1812 Hz, which was consistent with the simulated value of fsim = 1857.6 Hz.
Equation (8) shows that the resonance frequency is dependent on the sound speed of the gas in the PA cell, which can be altered by the gas temperature. The speed of sound of the gas in the PA cell can be expressed as [36]:
v = v 0 1 + T 273.15
where v0 is the speed of sound at 0 °C in m/s, and T is the absolute temperature of the gas in °C.
The PA cell was heated to 20–50 °C with a resistance wire. The resonance frequencies of the PA cell at different temperatures were recorded, as shown in Figure 12a. In order to improve the detection sensitivity, a handmade cantilever fiber acoustic sensor was used to detect the photoacoustic signals. The resonance frequency of the fiber acoustic sensor was about 1858 Hz. A dual resonance enhancement was achieved by matching the fiber acoustic sensor and the resonant PA cell [37]. Since the resonance frequency of the cantilever is almost temperature-independent [38], the resonant frequency can be fine-tuned by adjusting the temperature of the PA cell without affecting the first-order longitudinal resonance frequency of the cantilever. The resonance frequency of the PA cell was adjusted to meet the resonance frequency of the cantilever fiber acoustic sensor to achieve a double resonance enhancement [39]. It can be seen from Figure 12a that when the temperature of the PA cell was 46.7 °C, the resonance frequency matched the acoustic sensor. The frequency sweep of the PA cell was carried out at this temperature. The obtained frequency response and Lorentz fitting function diagram are shown in Figure 12b. The experimental value of the resonant frequency was about 1859 Hz. The experimental value of the quality factor can be calculated by the Lorentzian fitted function and formula (3), which was 31.2.
The PA cell was heated to 20–50 °C using resistance wire, and the resonance frequencies at different temperatures were recorded, as illustrated in Figure 12a. To enhance the detection sensitivity, a handmade cantilever fiber acoustic sensor was used to detect the photoacoustic signals. The resonance frequency of the fiber acoustic sensor was approximately 1858 Hz. By matching the fiber acoustic sensor and the resonant PA cell, dual resonance enhancement was achieved [37]. Since the first-order longitudinal resonance frequency of the cantilever is almost temperature-independent [38], the resonant frequency could be finely tuned by adjusting the temperature of the PA cell without affecting the first-order longitudinal resonance frequency of the cantilever. The resonance frequency of the PA cell was adjusted to match the resonance frequency of the cantilever fiber acoustic sensor to achieve double resonance enhancement. As shown in Figure 12a, the resonance frequency of the PA cell matched the resonance frequency of the acoustic sensor at a temperature of 46.7 °C. The frequency sweep of the PA cell was conducted at this temperature, and the resulting frequency response and Lorentz fitting function diagram are shown in Figure 12b. The measured value of the resonant frequency was about 1859 Hz. The value of the quality factor was determined to be 31.2 based on the Lorentzian fitted function and Equation (3).

3.3. Gas Detection

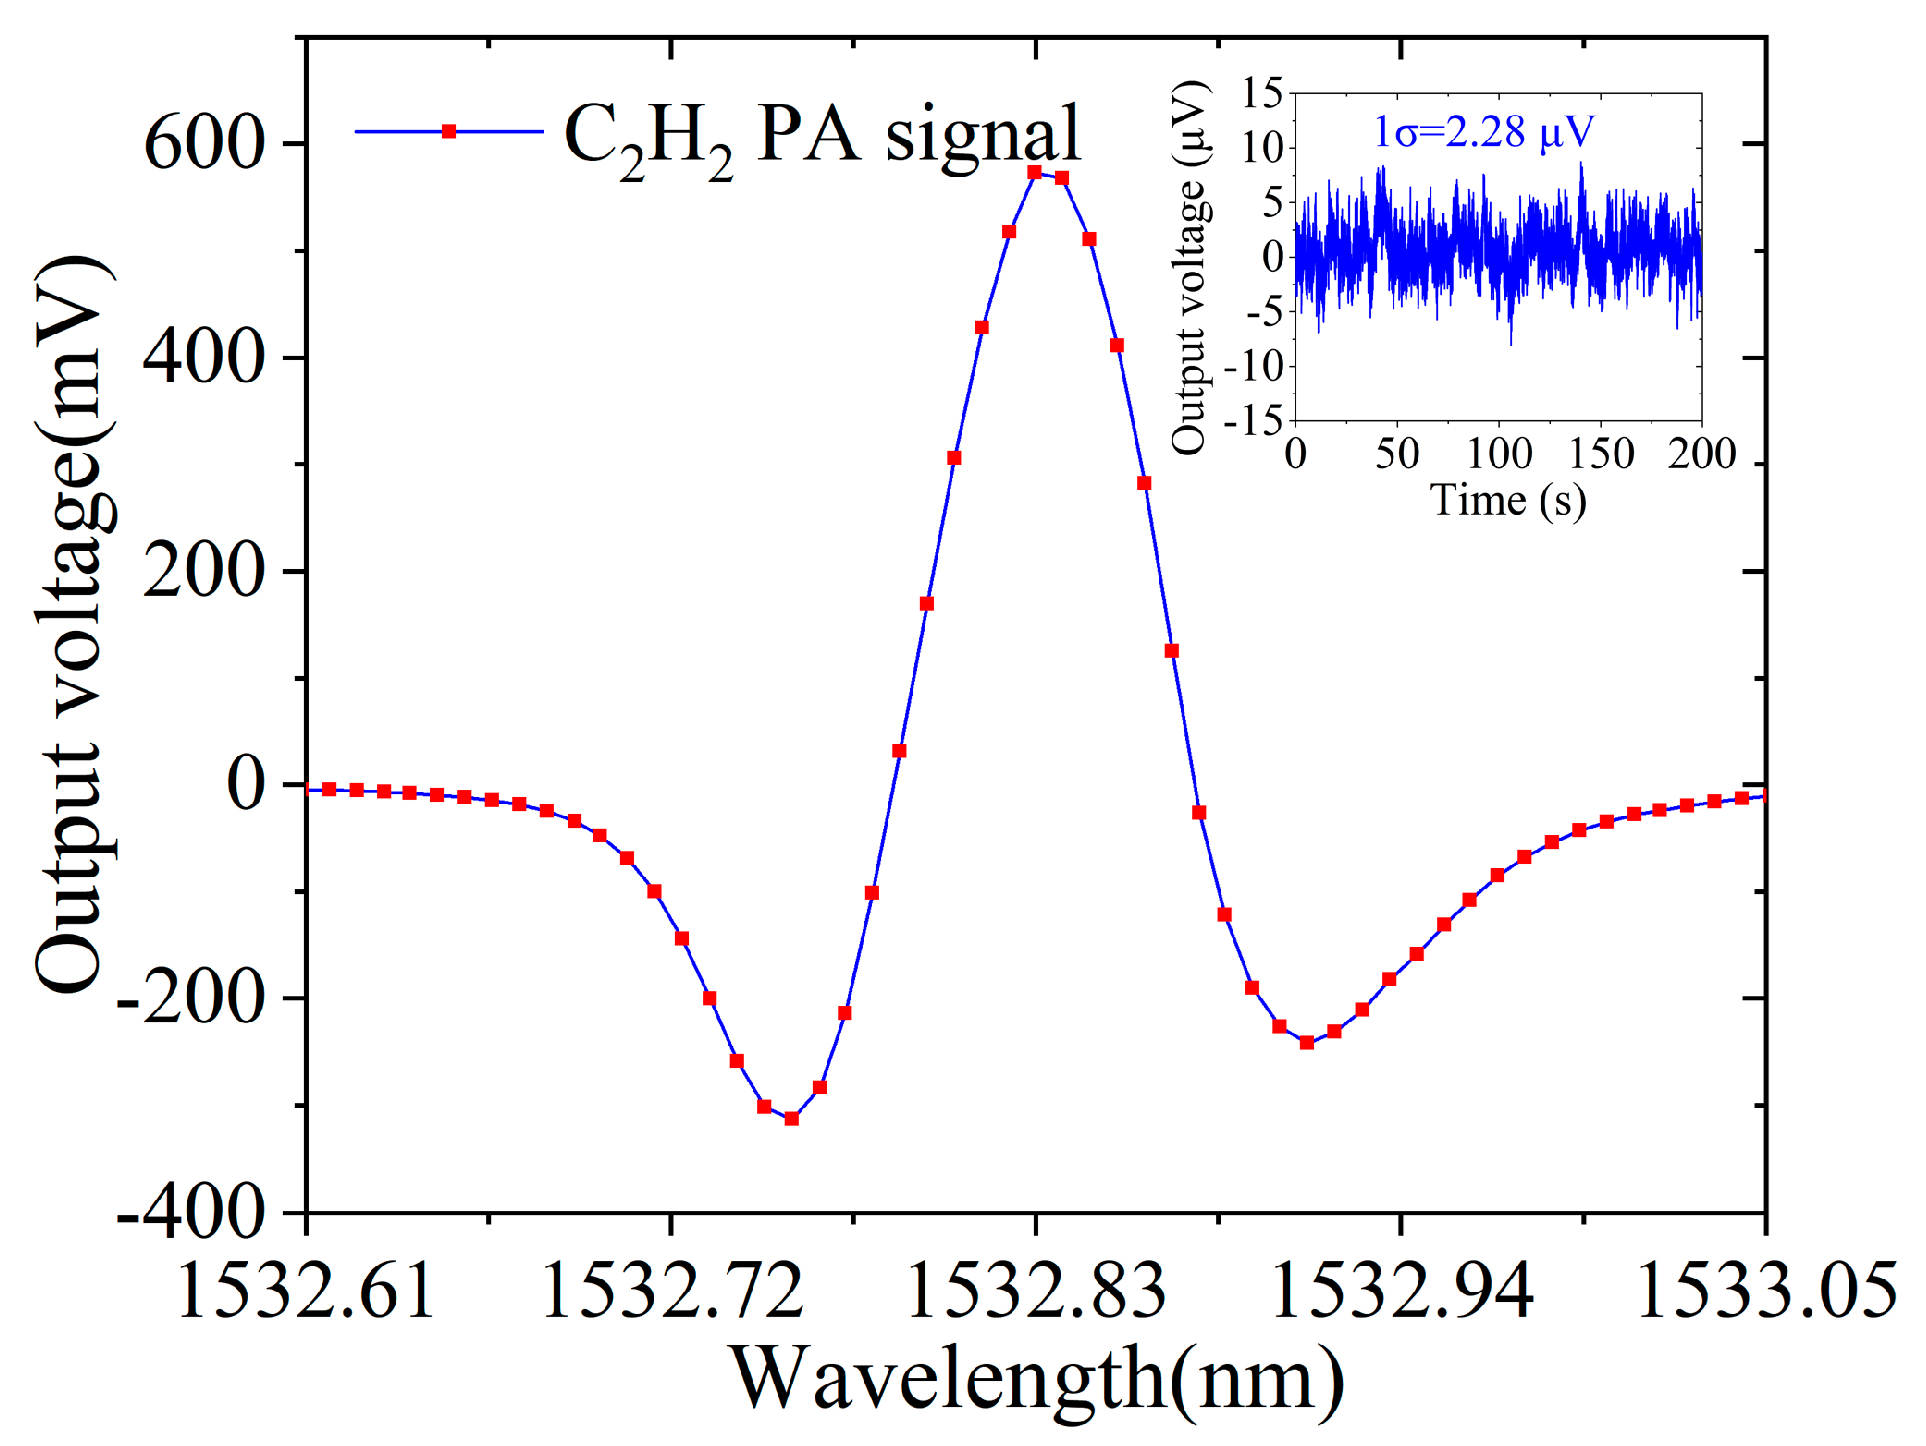
3.3.1. Detection Limit

To determine the detection limit of C2H2, the PA cell was filled with 500 ppm C2H2 gas, and the laser wavelength was adjusted to the center wavelength of the C2H2 absorption line. The laser output power was set to 200 mW, and the PA cell’s temperature was maintained at 46.7 °C using a resistance wire.
A low-frequency triangular wave signal with a frequency of 0.2 Hz and a sinusoidal modulation signal with a frequency of 929.5 Hz were generated by the signal generator and lock-in amplifier, respectively. The excitation laser’s wavelength was adjusted simultaneously by both signals. The lock-in amplifier’s time constant was set to 1 s, and the cantilever fiber acoustic sensor was used to measure the photoacoustic signal. The lock-in amplifier extracted the 2nd harmonic signal, as shown in Figure 13. After the measurement, the PA cell was purged with pure N2 gas, and the background noise was measured, as illustrated in Figure 13. It is apparent that the wavelength modulation technology and the second harmonic detection can effectively decrease the background noise.
Based on the 2nd harmonic signal in Figure 13 and the background noise within one standard deviation (1σ), the detection limit of the system for C2H2 at a SNR of 3 was determined to be 6 ppb.

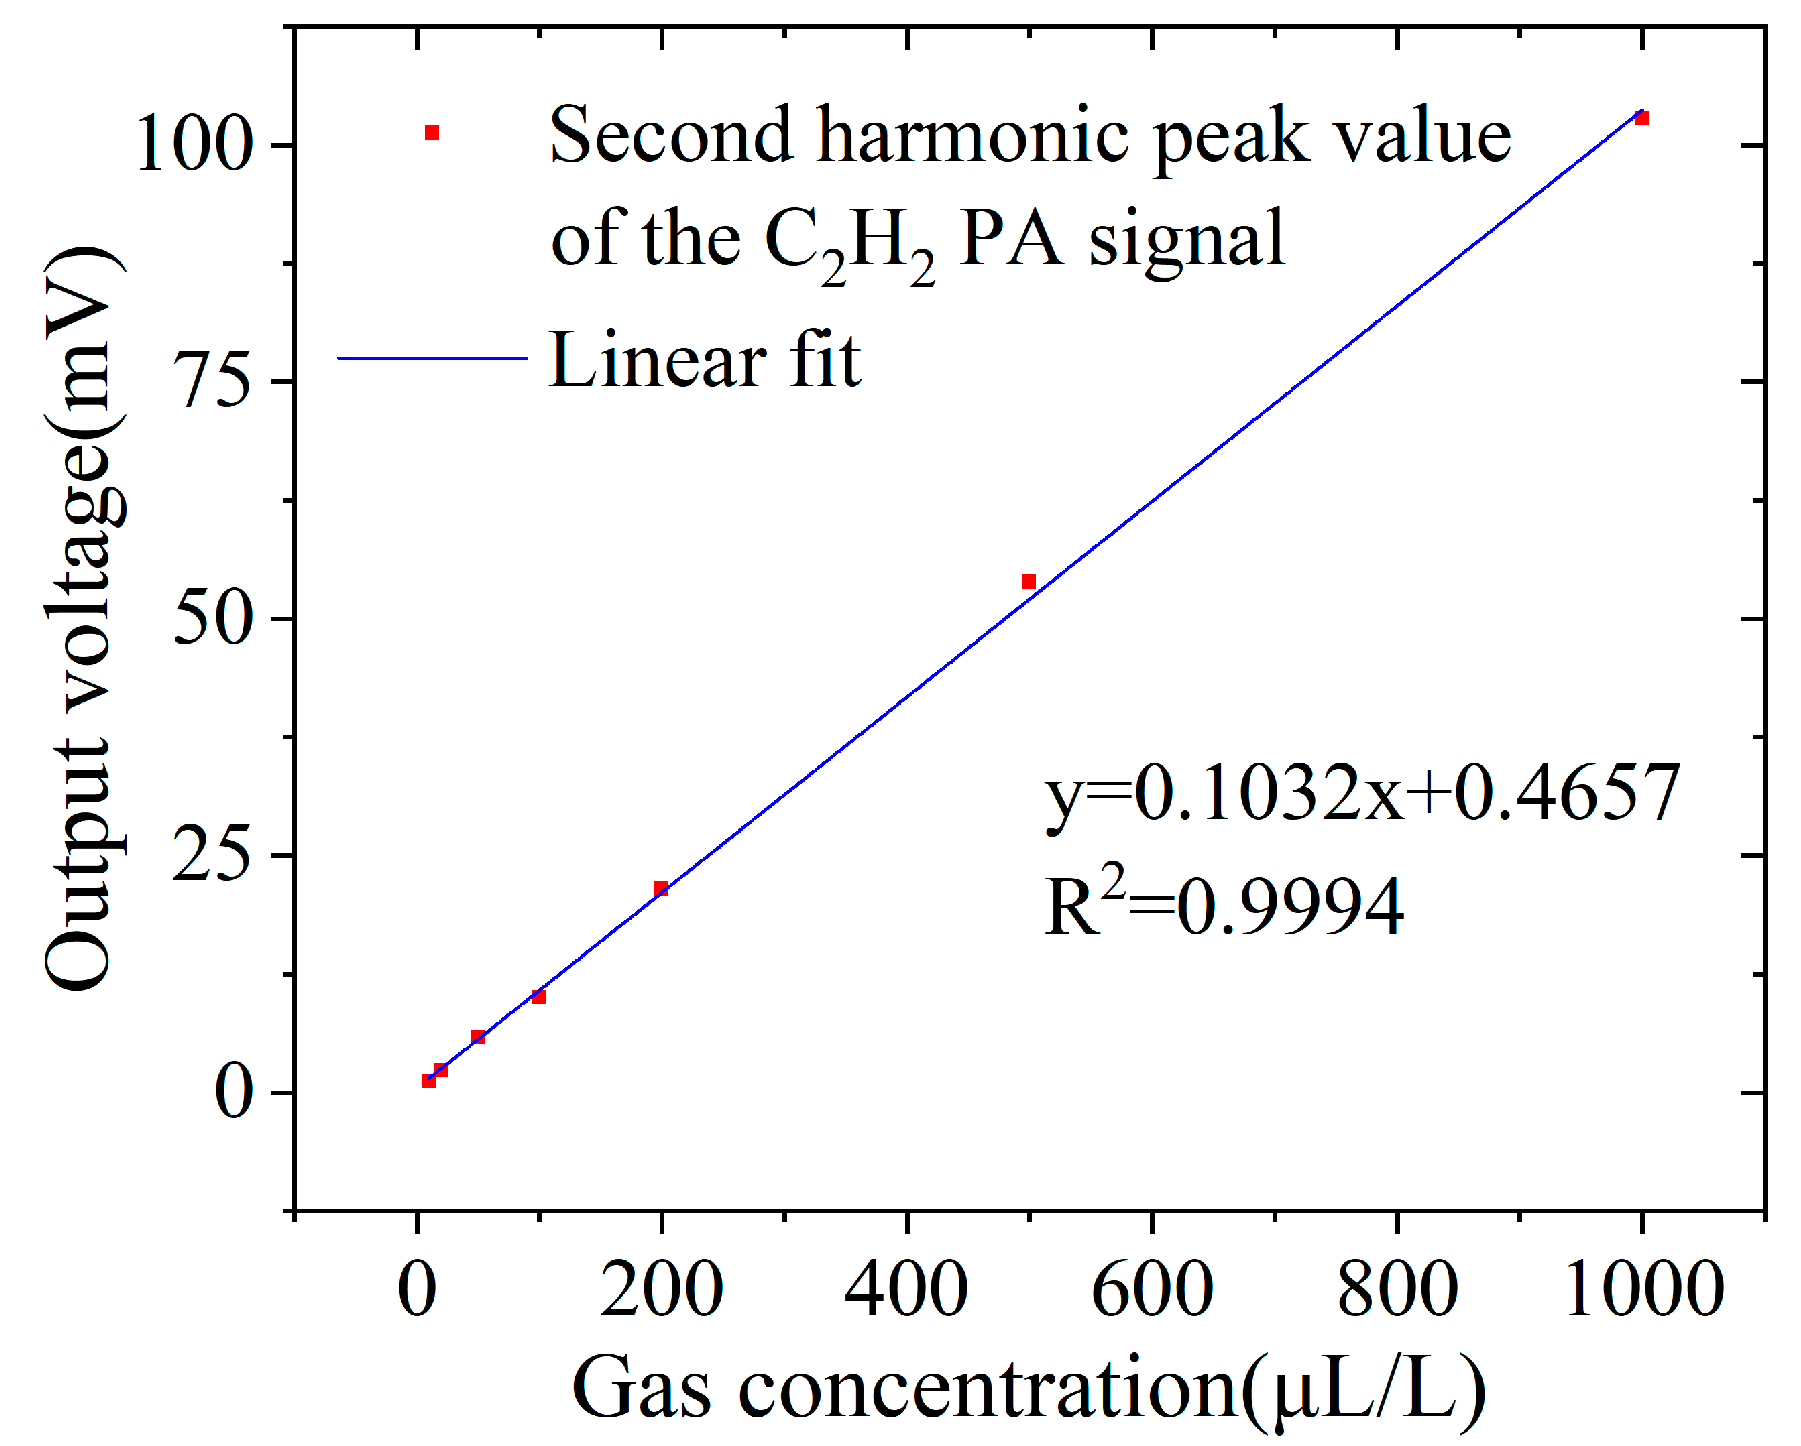
3.3.2. Measuring Range

To determine the measurement range of C2H2 gas, the PA cell was sequentially filled with C2H2 gas with different concentrations via a flow controller. The other system parameters were kept the same as those in the detection limit experiment. The lock-in amplifier was used to extract the second harmonic peak signal, as depicted in Figure 14. After each measurement, the PA cell was purged with pure N2 gas. It can be observed from Figure 14 that it demonstrates a broad linear range for C2H2 gas.

4. Discussion

The resonant photoacoustic cell has unique standing wave amplification properties that make it effective for enhancing photoacoustic signal intensity and improving detection sensitivity. Compared to non-resonant photoacoustic cells, the buffer chamber structure of the resonant photoacoustic cell is its most significant feature, occupying a larger portion of the cell’s volume. However, larger buffer chambers are still recommended for applications with sufficient detected gases, such as atmospheric environment monitoring.
It should be noted that the size of the resonant cavity in this research is commonly used by researchers. However, with good laser collimation and small manufactured microphones, a smaller resonant cavity can be made to obtain a photoacoustic cell with a smaller volume. The research method presented in this paper can produce a miniaturized buffer chamber suitable for a resonator of this size. Nonetheless, it is important to consider that as the length of the resonant cavity decreases, the first resonance frequency increases. Thus, detecting gases with long relaxation times, such as CO and CH4, may result in weaker photoacoustic signals. To address this, increasing the humidity of the gas in the photoacoustic cell via a water bath or air purging can reduce the relaxation time of the gas and increase the photoacoustic signal.
Moreover, when optimizing the buffer chamber size of a resonant photoacoustic cell with a chopper and light-transmitting window, shortening the length of the buffer chamber is not recommended. This is because the solid-state photoacoustic signal generated by the light-transmitting window has the same frequency as the gas photoacoustic signal, and it can only be located at the node of the resonance signal when the length of the buffer chamber is half of the resonant cavity. Through the utilization of wavelength modulation technology and second harmonic detection, the solid-state photoacoustic signal noise generated by the light-transmitting window can be effectively removed.
Finally, while this paper only detects acetylene gas in dissolved characteristic gas in transformer oil, it does not imply that the system can only detect acetylene gas. By changing the laser wavelength, the system can easily detect multiple groups of gases.

5. Conclusions

In this article, we developed a simulation model for the resonant PA cell and confirmed its accuracy. The volume was optimized while ensuring the enhancement of the photoacoustic signal. Compared to the classical model, the volume of the PA cell was reduced by 20% from 51 mL to 8.5 mL. With the optimized simulation results, we constructed a resonant PA cell, and the resonant frequency was measured at 1859 Hz at 46.7 °C using a commercial microphone. A dual-resonance enhanced photoacoustic spectroscopy gas detection system was assembled with a customized cantilever fiber acoustic sensor, and the SNR was further increased with the aid of an erbium-doped fiber amplifier, wavelength modulation, and harmonic detection technology. Experimental results showed that the system had a detection limit of 6 ppb for C2H2 gas and an excellent linear range under 1000 ppm.

Author Contributions

Conceptualization, T.Y.; methodology, T.Y.; software, T.Y.; validation, K.Z. and L.J.; formal analysis, T.Y.; investigation, T.Y. and R.L.; resources, T.Y. and W.C.; data curation, T.Y.; writing—original draft preparation, T.Y. and K.Z.; writing—review and editing, T.Y. and L.J.; visualization, T.Y. and R.L.; supervision, W.C.; project administration, T.Y. and W.C.; funding acquisition, K.Z. All authors have read and agreed to the published version of the manuscript.

Funding

This research received no external funding.

Institutional Review Board Statement

Not applicable.

Informed Consent Statement

Not applicable.

Data Availability Statement

The data that support the findings of this research are available from the corresponding author, T.Y., upon reasonable request.

Conflicts of Interest

The authors declare no conflict of interest.

References

  1. Bakar, N.A.; Abu-Siada, A.; Islam, S. A review of dissolved gas analysis measurement and interpretation techniques. IEEE Electr. Insul. Mag. 2014, 30, 39–49. [Google Scholar] [CrossRef]
  2. de Faria, H., Jr.; Costa, J.G.S.; Olivas, J.L.M. A review of monitoring methods for predictive maintenance of electric power transformers based on dissolved gas analysis. Renew. Sust. Energy Rev. 2015, 46, 201–209. [Google Scholar] [CrossRef]
  3. Bustamante, S.; Manana, M.; Arroyo, A.; Castro, P.; Laso, A.; Martinez, R. Dissolved Gas Analysis Equipment for Online Monitoring of Transformer Oil: A Review. Sensors 2019, 19, 4057. [Google Scholar]
  4. Wu, Z.Y.; Gong, Y.H.; Yu, Q.X. Photoacoustic spectroscopy detection and extraction of discharge feature gases in transformer oil based on 1.5 mu tunable fiber laser. Infrared Phys. Technol. 2013, 58, 86–90. [Google Scholar] [CrossRef]
  5. Gong, Z.F.; Chen, K.; Yang, Y.; Zhou, X.L.; Yu, Q.X. Photoacoustic spectroscopy based multi-gas detection using high-sensitivity fiber-optic low-frequency acoustic sensor. Sens. Actuator B-Chem. 2018, 260, 357–363. [Google Scholar] [CrossRef]
  6. Zhou, S.; Iannuzzi, D. Immersion photoacoustic spectrometer (iPAS) for arcing fault detection in power transformers. Opt. Lett. 2019, 44, 3741–3744. [Google Scholar] [PubMed]
  7. Tomberg, T.; Vainio, M.; Hieta, T.; Halonen, L. Sub-parts-per-trillion level sensitivity in trace gas detection by cantilever-enhanced photo-acoustic spectroscopy. Sci. Rep. 2018, 8, 1848. [Google Scholar] [CrossRef]
  8. Zhou, S.; Slaman, M.; Iannuzzi, D. Demonstration of a highly sensitive photoacoustic spectrometer based on a miniaturized all-optical detecting sensor. Opt. Express 2017, 25, 17541–17548. [Google Scholar]
  9. Gong, Z.; Chen, Y.; Gao, T.; Chen, K.; Jiao, Y.; Guo, M.; Zhang, B.; Liu, S.; Mei, L.; Peng, W.; et al. Parylene-C diaphragm-based low-frequency photoacoustic sensor for space-limited trace gas detection. Opt. Lasers Eng. 2020, 134, 106288. [Google Scholar] [CrossRef]
  10. Guo, M.; Chen, K.; Li, C.X.; Xu, L.; Zhang, G.Y.; Wang, N.; Li, C.Y.; Ma, F.X.; Gong, Z.F.; Yu, Q.X. High-Sensitivity Silicon Cantilever-Enhanced Photoacoustic Spectroscopy Analyzer with Low Gas Consumption. Anal. Chem. 2022, 94, 1151–1157. [Google Scholar] [CrossRef]
  11. Bijnen, F.G.C.; Reuss, J.; Harren, F.J.M. Geometrical optimization of a longitudinal resonant photoacoustic cell for sensitive and fast trace gas detection. Rev. Sci. Instrum. 1996, 67, 2914–2923. [Google Scholar] [CrossRef]
  12. Miklos, A.; Hess, P.; Bozoki, Z. Application of acoustic resonators in photoacoustic trace gas analysis and metrology. Rev. Sci. Instrum. 2001, 72, 1937–1955. [Google Scholar] [CrossRef]
  13. Wang, Q.Y.; Wang, J.W.; Li, L.A.; Yu, Q.X. An all-optical photoacoustic spectrometer for trace gas detection. Sens. Actuator B-Chem. 2011, 153, 214–218. [Google Scholar] [CrossRef]
  14. Cheng, G.; Cao, Y.; Liu, K.; Cao, Y.N.; Chen, J.J.; Gao, X.M. Numerical calculation and optimization of photoacoustic cell for photoacoustic spectrometer. Acta Phys. Sin. 2019, 68, 074202. [Google Scholar] [CrossRef]
  15. Cheng, G.; Cao, Y.N.; Tian, X.; Liu, K.; Cheng, J.J. Calculation and Evaluation of Acoustic and Flow Field Characteristics of Trapezoid Compound Photoacoustic Cell. Acta Photonica Sin. 2021, 50, 0230001. [Google Scholar]
  16. Gong, Z.F.; Gao, T.L.; Mei, L.; Chen, K.; Chen, Y.W.; Zhang, B.; Peng, W.; Yu, Q.X. Ppb-level detection of methane based on an optimized T-type photoacoustic cell and a NIR diode laser. Photoacoustics 2021, 21, 100216. [Google Scholar] [CrossRef]
  17. Gong, Z.F.; Wu, G.J.; Jiang, X.; Li, H.E.; Gao, T.L.; Guo, M.; Ma, F.X.; Chen, K.; Mei, L.; Peng, W.; et al. All-optical high-sensitivity resonant photoacoustic sensor for remote CH4 gas detection. Opt. Express 2021, 29, 13600–13609. [Google Scholar] [CrossRef]
  18. Jin, H.W.; Luo, P.; Dou, J.; Bai, H.C. Study on neural network algorithm for detecting respirable dust in photoacoustic cavity. AIP Adv. 2021, 11, 125307. [Google Scholar] [CrossRef]
  19. Yin, X.K.; Gao, M.; Miao, R.Q.; Zhang, L.; Zhang, X.S.; Liu, L.X.; Shao, X.P.; Tittel, F.K. Near-infrared laser photoacoustic gas sensor for simultaneous detection of CO and H2S. Opt. Express 2021, 29, 34258–34268. [Google Scholar] [CrossRef]
  20. Cheng, H.; Zeng, F.; Zhang, X.; Tang, J.; Zhang, Y. The effect of the photoacoustic Field-Photoacoustic cell coupling term on the performance of the gas detection system. Opt. Laser Technol. 2022, 153, 108211. [Google Scholar] [CrossRef]
  21. Zhang, C.; Wang, Q.Y.; Yin, X.Y. Photoacoustic spectroscopy for detection of trace C2H2 using ellipsoidal photoacoustic cell. Opt. Commun. 2021, 487, 126764. [Google Scholar] [CrossRef]
  22. Zhao, N.; Zhao, D.; Ma, L.G.; Wang, B. Study on a photoacoustic spectroscopy trichloromethane gas detection method based on an arched photoacoustic cavity. Anal. Methods 2022, 14, 1507–1514. [Google Scholar] [CrossRef]
  23. Yin, X.; Dong, L.; Wu, H.; Gao, M.; Zhang, L.; Zhang, X.; Liu, L.; Shao, X.; Tittel, F.K. Compact QEPAS humidity sensor in SF6 buffer gas for high-voltage gas power systems. Photoacoustics 2022, 25, 100319. [Google Scholar] [CrossRef] [PubMed]
  24. Chen, B.; Li, H.; Zhao, X.; Gao, M.; Cheng, K.; Shao, X.; Wu, H.; Dong, L.; Yin, X. Trace photoacoustic SO2 gas sensor in SF6 utilizing a 266 nm UV laser and an acousto-optic power stabilizer. Opt. Express 2023, 31, 6974–6981. [Google Scholar] [CrossRef]
  25. Yang, T.; Liu, R.; Yao, Y.; Luo, W.; Zhou, K.; Jin, L. Photoacoustic Spectroscopy for Detection of Trace CH4 using Optimized Photoacoustic Cell. In Proceedings of the 2022 IEEE International Conference on High Voltage Engineering and Applications (ICHVE), Chongqing, China, 25–29 September 2022; pp. 1–4. [Google Scholar]
  26. Bell, A.G. On the production and reproduction of sound by light. Am. J. Sci. 1880, 3, 305–324. [Google Scholar] [CrossRef]
  27. Bell, A.G. Upon the production of sound by radiant energy. Science 1881, 2, 242–253. [Google Scholar] [CrossRef]
  28. Zoltan, B.; Andrea, P.; Gabor, S. Photoacoustic Instruments for Practical Applications: Present, Potentials, and Future Challenges. Appl. Spectrosc. Rev. 2011, 46, 1–37. [Google Scholar]
  29. Dumitras, D.C.; Dutu, D.C.; Matei, C.; Magureanu, A.M.; Petrus, M.; Popa, C. Laser photoacoustic spectroscopy: Principles, instrumentation, and characterization. J. Optoelectron. Adv. Mater. 2007, 9, 3655–3701. [Google Scholar]
  30. Karbach, A.; Hess, P. High Precision Acoustic Spectroscopy by Laser Excitation of Resonator Modes. J. Chem. Phys. 1985, 83, 1075–1084. [Google Scholar] [CrossRef]
  31. Song, K.; Cha, H.; Kapitanov, V.; Ponomarev, Y.N.; Rostov, A.; Courtois, D.; Parvitte, B.; Zeninari, V. Differential Helmholtz Resonant Photoacoustic Cell for Spectroscopy and Gas Analysis with Room-Temperature Diode Lasers. Appl. Phys. B 2002, 75, 215–227. [Google Scholar] [CrossRef]
  32. Zhang, M.; Zhang, B.; Chen, K.; Guo, M.; Liu, S.; Chen, Y.W.; Gong, Z.F.; Yu, Q.X.; Chen, Z.Q.; Liao, M.F. Miniaturized multi-pass cell based photoacoustic gas sensor for parts-per-billion level acetylene detection. Sens. Actuator A-Phys. 2020, 308, 112013. [Google Scholar] [CrossRef]
  33. Rothman, L.S.; Gordon, I.E.; Babikov, Y.; Barbe, A.; Benner, D.C.; Bernath, P.F.; Birk, M.; Bizzocchi, L.; Boudon, V.; Brown, L.R. The HITRAN2012 Molecular Spectroscopic Database. J. Quant. Spectrosc. Radiat. Transf. 2013, 130, 4–50. [Google Scholar] [CrossRef]
  34. Li, C.G.; Dong, L.; Zheng, C.T.; Lin, J.; Wang, Y.D.; Tittel, F.K. Ppbv-Level Ethane Detection Using Quartz-Enhanced Photoacoustic Spectroscopy with a Continuous-Wave, Room Temperature Interband Cascade Laser. Sensors 2018, 18, 723. [Google Scholar] [CrossRef] [PubMed]
  35. Kuusela, T.; Kauppinen, J. Photoacoustic gas analysis using interferometric cantilever microphone. Appl. Spectrosc. Rev. 2007, 42, 443–474. [Google Scholar] [CrossRef]
  36. Hardy, H.C.; Telfair, D.; Pielemeier, W.H. The velocity of sound in air. J. Acoust. Soc. Am. 1942, 13, 226–233. [Google Scholar] [CrossRef]
  37. Guo, M.; Chen, K.; Gong, Z.F.; Yu, Q.X. Trace ammonia detection based on near-infrared fiber-optic cantilever-enhanced photoacoustic spectroscopy. Photonic Sens. 2019, 9, 293–301. [Google Scholar] [CrossRef]
  38. Chen, K.; Yu, Q.X.; Gong, Z.F.; Guo, M.; Qu, C. Ultra-high sensitive fiber-optic Fabry-Perot cantilever enhanced resonant photoacoustic spectroscopy. Sens. Actuator B-Chem. 2018, 268, 205–209. [Google Scholar] [CrossRef]
  39. Chen, K.; Deng, H.; Guo, M.; Luo, C.; Liu, S.; Zhang, B.; Ma, F.X.; Zhu, F.; Gong, Z.F.; Peng, W.; et al. Tube-cantilever double resonance enhanced fiber-optic photoacoustic spectrometer. Opt. Laser Technol. 2020, 123, 105894. [Google Scholar] [CrossRef]
Figure 1. (a) 2D axisymmetric physical model of the PA cell; (b) 3D model of the PA cell.
Atmosphere 14 00801 g001
Figure 2. The simulated frequency response curve of the PA cell within the frequency range of 50–6500 Hz.
Atmosphere 14 00801 g002
Figure 3. The simulated frequency response curve of the resonant cavity within the frequency range of 1600–1700 Hz.
Atmosphere 14 00801 g003
Figure 4. The simulated frequency response curve of the PA cell within the frequency range of 1550–1800 Hz.
Atmosphere 14 00801 g004
Figure 5. Simulation curve of the frequency response of buffer cells with different sizes: (a) different length (50–2250 Hz); (b) different radius (1250–1850 Hz).
Atmosphere 14 00801 g005
Figure 6. Simulation curve of the frequency response of resonant cavity enclosed at both ends: (a) first-order resonance (1700–1750 Hz); (b) second-order resonance (3400–3500 Hz).
Atmosphere 14 00801 g006
Figure 7. Support vector regression curve fitting the relationship between the buffer chamber size and the sound pressure at the first resonant frequency of the PA cell.
Atmosphere 14 00801 g007
Figure 8. Simulated frequency response curve of the optimized PA cell within the frequency range of 1700–2000 Hz.
Atmosphere 14 00801 g008
Figure 9. (a) Schematic depiction of the structure of the resonant PA cell; (b) an image of the resonant PA cell.
Atmosphere 14 00801 g009
Figure 10. Schematic diagram of the detection system.
Atmosphere 14 00801 g010
Figure 11. The absorption spectrum of dissolved gas in the near-infrared band of transformer oil.
Atmosphere 14 00801 g011
Figure 12. (a) Variation in resonance frequency of the PA cell at different temperatures (20–50 °C); (b) frequency response curve of PA cell at 46.7 °C (1700–2000 Hz).
Atmosphere 14 00801 g012
Figure 13. The 2f-WMS signals with 500 ppm C2H2 gas. Inset: a noise when the PA cell was filled with pure N2 gas.
Atmosphere 14 00801 g013
Figure 14. The maximum peak value of the 2f-WMS spectrum of C2H2 gas with varying concentrations.
Atmosphere 14 00801 g014
Table 1. Analytical and simulated values of various parameters of the PA cell.
Resonance Frequency (Hz)Quality FactorCell Constant (Pa∙cm/W)
Analytical parameters1673.9632.43918.5
Simulated parameters1673.3313734.3
Disclaimer/Publisher’s Note: The statements, opinions and data contained in all publications are solely those of the individual author(s) and contributor(s) and not of MDPI and/or the editor(s). MDPI and/or the editor(s) disclaim responsibility for any injury to people or property resulting from any ideas, methods, instructions or products referred to in the content.

