Abstract
The noise-like behavior of the geomagnetic anomalies observed in Tlamacas station (volcano Popocatepetl, Mexico), linked to the ionization produced by intensive radon release, are presented in the experimental part of this study. The magnetic field perturbations produced by charge spreading currents within the fair-weather electric field are considered in the theoretical model based on the electrode. The electric charges are generated by the air ionization due to radon emanation. The simulations demonstrated that the ionization of the air leads to magnetic field perturbations of about 0.001–0.1 nT in the ULF (ultra low frequency) range 10−3–10−1 Hz. Magnetic field perturbations can be higher when the radon emanation occurs in a region with terrain irregularities.
1. Introduction
Seismological and volcanological studies are closely connected with the analysis and monitoring of the physical fields of the Earth, as well as anomalous phenomena observed in the atmosphere. These investigations, as a rule, have both theoretical and highly practical character. In this relation, special attention should be paid to precursors of these phenomena. Often the detection of temperature fluctuations in the soil or atmosphere, intense variations in the magnetic field, and anomalous concentrations of radioactive elements, including radon gas, allow for predicting earthquakes or volcanic eruptions.
Earthquakes and volcanic processes are often related to each other both in time and in the region where they occur [1,2]. This is due to the fact that, in most cases, it is the fluctuations of the Earth’s crust that provoke the weakening of its stability (rigidity) and lead to the formation of channels for the rapid ascent of magmatic melts to the Earth’s surface. These processes most often occur at the boundaries of lithospheric plates [3,4,5], but often they can be observed in the intraplate space as well. These are so-called intraplate deformations and intraplate volcanism [6,7,8,9,10]. Intraplate volcanism in the ocean is most often explained in terms of the hot-spot hypothesis and has been described by many authors [11,12,13,14,15]. Regarding continents, this phenomenon has also been widely described in the scientific literature from different positions [16,17,18,19,20,21,22].
An important element determining the seismicity and volcanism of continents is heat flow [23,24]. Studies of the relationship between the heat flux, atmospheric phenomena, earth physical field anomalies, and other processes can serve as precursors to catastrophic events, such as devastating earthquakes and volcanic eruptions. Among the precursors of earthquakes and volcanic eruptions, anomalies in soil radon concentrations are an important component [25,26,27,28,29].
Mexico is an area where all these processes are very active. Many works are devoted to their regional study [18,19,30,31,32,33]. One of the most famous seismic-volcanic structures in Mexico is the Popocatepetl volcano.
The Popocatepetl volcano (Central Mexico, latitude, 19.065° N; longitude, 98.63° W, 5465 m elevation, Figure 1) is considered as a major geological hazard in Mexico, because its sudden eruption threatens one of the world’s most populated areas (Mexico City, situated about 70 km southeast) and the nearby population of Puebla (about 45 km west) and Cuernavaca (about 60 km northeast), among others. A major eruption would have serious consequences for the 30 million people living in communities on the flanks of the volcano, and ash from such an eruption could also endanger aircraft using Mexico City international airport [34,35]. It is also one of several active volcanoes that forms the Trans-Volcanic Belt of Mexico (also known as the Neo-Volcanic Axes) and its existence is related to the geodynamics of the North American and Cocos plates.
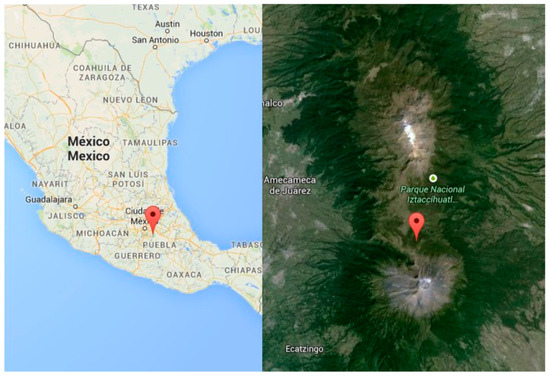
Figure 1.
Location of volcano Popocatepetl and Tlamacas observational site (https://www.cenapred.unam.mx/reportesVolcanGobMX/ (accessed on 15 December 2022)).
Our earlier studies in the volcano Popocatepetl area (Figure 1) have shown the variety of phenomena in the local geomagnetic field [36,37,38,39,40], and the radon [41,42] and temperature [43] behavior associated with the volcano activity. The current study is devoted to the possibility of the generation of geomagnetic noise provoked by the highly ionized environment generated due to the enormous radon emanation.
2. Experiment and Results
2.1. Geomagnetic Field Measurements
Geomagnetic measurements in the volcano Popocatepetl area and observed effects can be found in [36,37,38,39,40]. Here, we just briefly summarize the basic points of the applied methodology and emphasize the principal phenomena, which are the object of our interest in the present paper.
Permanent geomagnetic observations were carried out with a 3-axial fluxgate magnetometer (GPS synchronized, 1 Hz sampling rate, designed at UCLA) at Tlamacas station of Centro Nacional de Prevención de Desastres (CENAPRED), Long. 261.37° E, Lat. 19.07° N, 4000 m elevation above the sea level (Figure 1), situated 4 km north from the volcano crater. The total period of observations covers the period of the years 2003–2006. The first data were affected by different gaps caused by regular power cuts at the station. The results presented in the current paper are processed from the most reliable measurements related to the 2005–2006 interval when a no-brake power system was installed at the station.
2.1.1. Methodology
Our study includes the analysis of the time variation in the signal and its dynamic spectra. To distinguish the local volcano effects from the global ones, we used referent data from Juriquilla station (Queretaro, Mexico (100°26′48.81″ W, 20°42′14.87″ N, 1946 m elevation) integrated to the Mid-Continent Magneto-seismic Chain (McMAC) [44] equipped with the same instrument. As well, to estimate Solar-Terrestrial coupling influence with high geomagnetic activity such as geomagnetic storms, the equatorial Disturbance Storm Time (Dst) index (taken from Kyoto geomagnetic site) is applied to the analysis.
2.1.2. Results
The phenomenon that is the subject of study in the present article is the following. The noise background estimated by the spectral intensity of the geomagnetic field is much higher in the Tlamacas (volcano) station in comparison with the referent Juriquilla station. One can see (Figure 2, [39]) the obvious domination of more intensive orange colors in the Tlamacas spectra contrary to the weaker green and blue in the Juriquilla spectra.
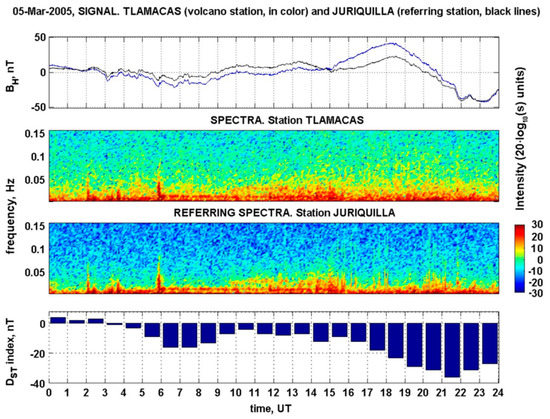
Figure 2.
(top panel) H—component signals, Tlamacas (blue line) and Juriquilla (black). (2nd and 3rd panel) Tlamacas and reference spectrogram dynamic spectra. (bottom panel) Disturbance Storm Time (Dst) index of geomagnetic activity.
The noise contamination measured at the volcano area can vary with its intensity. Figure 3 shows the changes in the magnetic field during the week 9–16 June 2005. The increase in electromagnetic noise is emphasized from the 3rd to the 6th day of measurements.
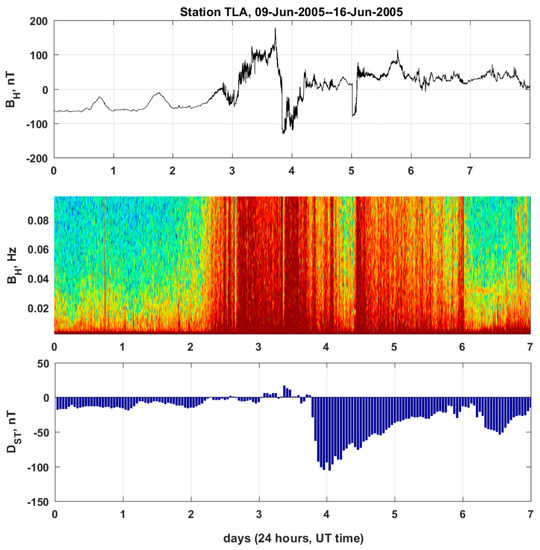
Figure 3.
(top panel) H—component signal, Tlamacas station. (middle panel) Its dynamic spectra. (bottom panel) Disturbance Storm Time (Dst) index of geomagnetic activity.
Generally, “crazy” elevated electromagnetic noise at the Tlamacas site is often observed and can last from a dozen minutes—2 h up to several days, as is shown in the abovementioned figure.
To understand the essence of the difference in the observed results, we must emphasize the fundamental differences in the geographic location of the stations. The Juriquilla station is situated in an urban environment; moreover, it is surrounded by a dense industrial cluster with an increased electromagnetic background. The Tlamacas station, on the contrary, is in an unhabitable place where any human-made electromagnetic activity is absent naturally. All this would suggest the opposite effect. Thus, the explanation of the unexpected discrepancy would require an alternative sizeable natural source. We propose an increased radon emanation in the Tlamacas observation site as a reliable candidate for the enhanced electromagnetic contamination of the geomagnetic field.
2.2. Radon-Related Measurements
Radon is a radioactive gas formed by the alpha decay of Radium. It belongs to the uranium series and the half-life of radon (222Rn) is short and constant (3.8 days). Radon is released from the ground surface and measured as the atmospheric radon concentration [45]. Variations in soil and atmospheric radon concentrations are an important component of predicting earthquakes and seismogenic volcanic processes [46,47]. Numerous studies highlight the presence of notable Rn anomalies in the soil, air, and groundwater around the time of earthquake activity [48,49,50]. Radon concentration changes related to earthquake occurrences have been observed in air emanating from the soil [51], in groundwater, and in the atmosphere [52]. Anomalous increases in the radon (222Rn) concentration in the soil, groundwater, and atmosphere have been reported prior to large earthquakes [45,52,53]. It has been established that it is the activity of seismotectonic movements of the Earth’s crust that causes increased radon content in the near-surface layer. Studies of radon properties and the monitoring of its concentration are widely used in modern geological and geophysical practice [54,55,56]. Our study consisted of the application of the technique of periodic measurements of radon, taking into account different stages of activity of the Popocatepetl volcano.
2.2.1. Methodology
Different measurement methods were used in various radon surveys in the area of the volcano Popocatepetl [41]. Initial area mapping was performed with SARAD Scout portable detectors. This instrument uses diffuse air passing through the instrument; therefore, it is more appropriate for permanent Rn monitoring as was performed in our previous study related to the radon behavior during volcano activity [40]. More precise studies were performed with SARAD Radon monitor RTM 1688-2- and CR39-type SSNTD (Solid State Nuclear Track Detectors).
SARAD Radon monitor RTM 1688-2 is equipped with a proper pump to analyze air samples; both SARAD Scout and RTM instruments use ionization chamber to calculate radon (222Rn) concentration, which is measured by the short-living daughter products, generated by the radon decay inside a measurement chamber. Directly after the decay, the remaining 218Po nucleus becomes charged positively for a short period, because some shell electrons are scattered away by the emitted alpha particles. Those ions are collected by the electric field forces on the surface of a semiconductor detector. The number of collected 218Po ions is proportional to the radon gas concentration inside the chamber.
CR39 is a plastic polymer (polyally-diglycol-carbonated, or PADC) that belongs to the class of polyesters. This material has the characteristic of being susceptible to alpha particles resulting from radioactive decay of radon. The impacts of the particles with CR39 create damage on the surface of the detectors; the damage concentration is related to the radon concentration. Damage tracks can be highlighted through a chemical attack carried out using KOH 6.2 M, placed in an oven at a constant temperature of 60 °C for 18 h. During this chemical attack, the detectors are thinned, and the tracks of the damage are enlarged. After this process, the tracks are calculated using an optical microscope.
We used results obtained with CR39 detectors as a more confident presentation in the current paper. Plastic glasses with suspended CR39 detectors inside were buried in 40 cm deep holes in the 30 measurement sites during 15–17 April 2010 and recovered 9 May 2010. The total deployment time of the detectors varied between 22 days 4 h and 24 days 6 h.
2.2.2. Results
The results of the different studies related to the radon concentration in the volcano Popocatepetl area during 2007–2009 as well as the details of the applied methodology can be found in the papers [40,41]. Their principal results in the focus of the present paper can be reported as follows:
- -
- The radon release in the Tlamacas Mountain (up to 5000 Bq/m3) is significantly higher than in any other referent site;
- -
- It is much higher than in the other areas of the volcano Popocatepetl;
- -
- The origin of the radon in Tlamacas is caused by natural degassing in addition to the radioactive soil deposits detected in other volcano sites;
- -
- Tlamacas Mountain can be considered as a natural reactor and a powerful source of ionization that modifies the atmosphere electricity vertical profile.
Further studies in the localization of Tlamacas Mountain [40] during 2010–2011 allowed us to confirm a stable high radon level (up to 6500 Bq/m3), prove the non-homogeneous spatial character of its emanation, and estimate the typical spatial size of the active areas (about 50 m, as can be seen in Figure 4, [40]) which we also use as the reference data for our simulation model.
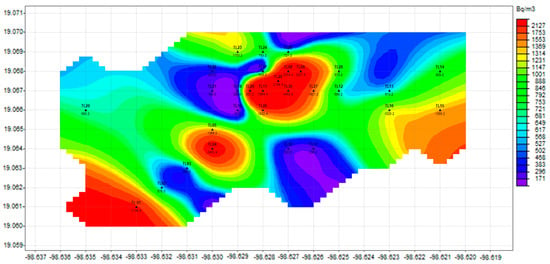
Figure 4.
Spatial distribution of the radon concentration in Tlamacas Mountain, April–May 2010. The top of Tlamacas Mountain is approximately in the center of the map. Black triangles denote measurement stations, accompanied by station numbers and measured radon values in Bq/m3.
3. Air Ionization Produced by Radon and Large Hydrated Clusters Formation
It was established as early as 1986 [57] that natural radioactivity, where the main component is 222Rn, is the main source of the atmospheric boundary-layer ionization from the ground surface up to a 1 km altitude where the galactic cosmic rays start to prevail in the ionization impact on the atmosphere. Radon emanation from the Earth’s crust is more intensive in the vicinity of active tectonic faults and areas of volcano activity [58]. If the average value of radon activity is nearly several tens of Bq/m3, in seismically active areas it can reach incredible values of hundreds of kBq/m3 [59].
We can estimate the ion production rate and electron concentration for the registered Tlamacas radon activity level at 6500 Bq/m3. During the decay of the radon, 222Rn releases α-particles with energy Eα = 5.6 MeV. Because the energy of the atmospheric gas ionization is in the range from 10 to 30 eV, each α-particle released by radon can produce on average ~3 × 10⁵ electron–ion pairs. Then, in view of the ionization capacity of radon α-particles of ~3 × 10⁵ electron–ion pairs, the ion-production rate is ~1.95 × 10⁹ m−3 s−1. According to [60], the ionization by energetic α-particles in the dense near-ground atmospheric layer has the track character. The track is the short cylinder with a length of the free-pass of an α-particle in the atmosphere, which is nearly 4 cm, surrounded by short spurs of secondary electrons producing the volumetric ionization because of the short distance between the spurs. Modeling of the processes of ionization [60] gives the primary electron concentration within the spur, Ne ≈ 1012 cm−3. The size and the lifetime of the track is determined by the ambipolar diffusion from the primary track volume, so by the primary ions’ recombination within this volume.
The primary ions enter into the series of plasmachemical reactions and are subject to the final ion’s hydration. All this happens pretty fast—during nearly 1 s after the ionization is “switched on”. The deposition of water vapor on ions leads to the drop in relative humidity, air temperature growth, and the formation of condensation nuclei [61].
The large, hydrated clusters still conserve their electric charge, so the layer of so-called “atmospheric plasma” is formed [59], for which the behavior can be considered within the framework of the dusty plasma theory [62]. So, one of the possible sources of the registered emission, the near-ground atmospheric plasma instability, can be considered.
4. Model
The proposed qualitative model for the generation of geomagnetic noise assumes the presence of active zones emanating radon during the degassing process in the volcano area. The increased radon release produces high ionization in a near-surface air layer, as mentioned in Section 3. Thus, there are the regions where the description of the electric processes differs from these processes in the free atmosphere well above the surface. Near the surface, it is important to take into account the turbulent exchange, the presence of radioactive substances, the properties of the surfaces, and the motion of aerosols. The presence of the Earth–air interface results in the appearance of a sort of electrode layer, where the conductivity depends on the value of the electric field.
Here are some results of the simulations of the classical electrode effect, i.e., without the turbulence. Consider the light ions. The basic equations are [63,64] as follows:
Equation (1) shows the drift equations for the motion of positive and negative ions considered jointly with the Poisson equation for the quasi-static electric field E. Here, n+, n− are the concentrations of the positive and negative ions, respectively; b+ > 0, b− < 0 are their mobilities; E is the electric field; φ is the electric potential; E0 < 0 is the fair-weather electric field; q (r, t) is the intensity of the generation of the ions due to the ionization; and α is the coefficient of recombination. The OZ axis is directed vertically perpendicular to the surface z = 0.
There is evidence in the literature that the stationary electrode effect leads to the variation in the electric field near the Earth’s surface. Moreover, the concentrations of the positive and negative ions differ from each other there because at the boundary z = 0 the positive ions move downwards (n+(z = 0) ≠ 0), whereas the negative ones move upwards (n−(z = 0) = 0).
The electrode effect is more sizeable in mountain regions than in the flatlands, because the air is rarefied and the mobilities of ions are higher there. Moreover, the constant electric field E0 is higher too. Our earlier measurements of the values of the atmosphere electric field at the Tlamacas station confirmed this. When the ionization of the air is excited by the radon emanation, the source q (r, t) can be large enough and non-stationary. Due to this, the electrode effect also causes a high non-stationary density of electric currents:
These electric currents produce magnetic fields in the ultra low frequency (ULF) range (f = 0.001–1 Hz).
We have performed the simulations of Equation (1) adding the boundary conditions (Figure 5):
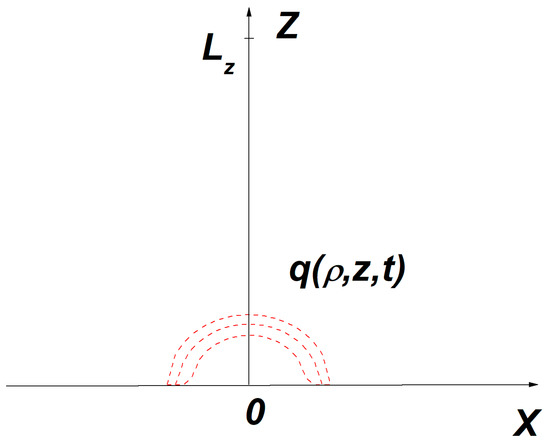
Figure 5.
Geometry of the problem.
The intensity of generation of the ions is
The region of the simulations is 0 < z < Lz, where Lz >> z0. In Figure 6, the typical results of the simulated equations are shown. The used parameters are q0 = 1011 ions/m3/s and z0 = ρ0 = 50 m; the ion mobilities are b+ = 10−3 m2/s/V and b− = −2 × 10⁻³ m2/s/V; the recombination coefficient is α = 10−13 m3/s; and t1 = 50 s and t0 = 30 s. The fair-weather field is taken as E0 = −500 V/m, which is somewhat higher than at the sea level (the site altitude is about 4 km above the sea level).
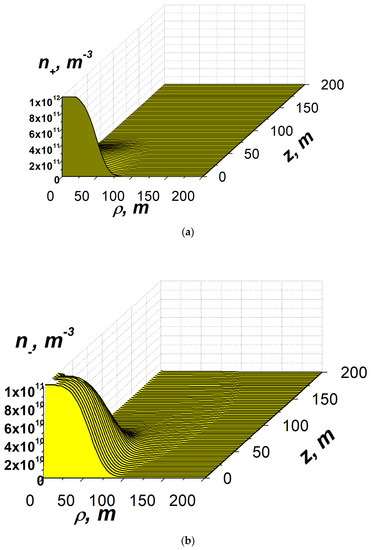
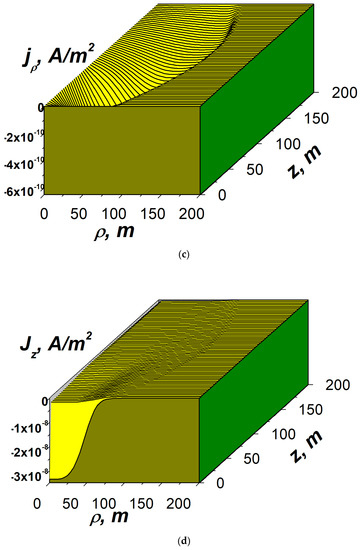
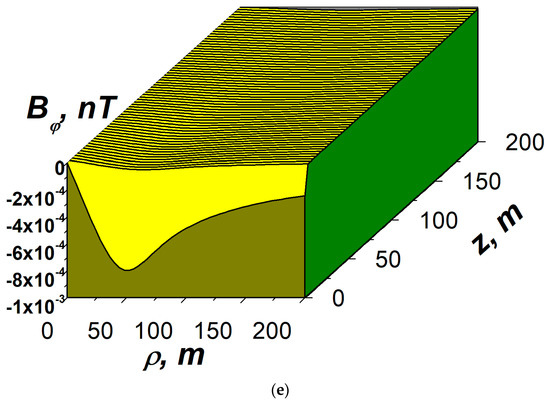
Figure 6.
Typical distributions of concentrations of ions, densities of current, and the magnetic field.
The goal of the simulations is to demonstrate the principal possibility of excitation of the essential different concentrations of the positive and negative ions in the near-Earth layer, the corresponding densities of the electric currents, and the nonzero values of the induced ULF magnetic field. In Figure 6, the results of the simulations are depicted at the time t = 50 s. The part (a) shows the spatial distribution of the concentration of positive ions, (b) is that corresponding to negative ions, parts (c) and (d) are the distributions of the radial and vertical components of the electric current density, and (e) shows the distribution of the azimuthal component of the induced magnetic field Bφ.
5. Discussion
It is well-known that earthquakes (and, in general, seismic phenomena) are the trigger that leads to volcanic eruptions [65,66,67,68]. At the same time, it is not quite clear how this mechanism works nor how to predict the results of its activity. One of the most probable factors that can be used for the target prediction of catastrophic seismological and volcanological processes is the analysis of geophysical fields (first the geomagnetic field) and the concentrations of the radioactive elements in the near-surface layer of the earth crust (geosphere), the hydrosphere, and in the atmosphere. The relationship between these geophysical strata of the earth is quite obvious.
Seropian et al. indicate that earthquake-induced dynamic processes triggered by seismic waves can be divided into three categories—volatile processes, resonance processes, and hydrothermal system triggering. Volatile processes can be associated with an eruption mechanism through bubble nucleation and growth, advective overpressure associated with bubble rise, and falling crystal roofs facilitating vesiculation [65]. In a resonance process, seismic waves can induce sloshing in the reservoir [69], which represents the movement of magma in its reservoir. Finally, hydrothermal systems are also generally well connected to the underlying magmatic reservoir [70]. All the processes noted above are reflected in one way or another in magnetic field anomalies because they are associated with the redistribution of the internal structure of the object, which is the source of the magnetic anomaly. Or, as in the case of the hydrothermal system, there is a variation in the magnetic field characteristic due to changes in the interaction of the magmatic reservoir with the non-magnetic underlying rocks.
On the other hand, high-precision magnetic field measurements may have broader relevance in the study of the Earth’s magnetosphere. Thus, Archer and coauthors [71] predict qualitative characteristics of ionospheric and ground-based magnetic observations based on magneto-hydrodynamics and global magnetosphere-ionosphere modeling. The analysis of dynamical plasma waves in the ultra low frequency (ULF) range (~0.1–100 mHz) is key to studies of such effects. This analysis reveals the features of processes, such as magnetosphere-ionosphere (MI) coupling [72] and geomagnetically induced currents [73].
The three-axial fluxgate magnetometer was used in the magnetic field monitoring described in our paper. Its main characteristics are described in Section 2.1. Geomagnetic field measurements. The use of high-precision equipment in combination with the development of an original modeling technique allowed the study of magnetic field perturbations in the order of 0.001–0.1 nT in the ULF range of 10-3–10-1 Hz to be realized.
The presented work discusses the possibility of using the monitoring of magnetic anomalies and variations in the concentration of radioactive radon gas in the area of the active volcanic system of Popocatepetl.
The simulated values of the induced magnetic fields are within the interval 10−3–10−1 nT. The modest magnitudes of the magnetic field obtained in the current model should not be misleading. They can raise to the values 1–10 nT, when the constant electric field is E0 > 1 kV/m, which can be observed in the mountain regions due to the high altitude above the sea level and the essential non-uniformity of the Earth’s surface there. So, our simulations only demonstrate the principal possibility of generation of magnetic field perturbations due to the near-Earth electrode effect.
The proposed generation mechanism is not unique. The presented model calculates only the part of the electromagnetic noise caused by the radial spread of the charged particles (ions and charged aerosols) produced in the active zones with the normal (Gaussian-like) distribution of the charged particles. High ionization in the atmosphere [60], caused by radon release, changes the atmosphere electric field profile in the conception of the lithosphere-atmosphere coupling proposed by the mentioned authors. Thus, any heterogeneity in the ground surface becomes a source of micro-discharges. These discharges provide a much larger contribution to the noise component of the electromagnetic field than the model considered in this article. Now, the calculation of such a model does not seem technically feasible. In any case, the proposed model is fairly realistic. More inputs are awaited for further developments.
6. Conclusions
The analysis of the geophysical fields in the area of the Popocatepetl volcano revealed some features of their influence on the atmosphere during the formation and development of the large volcano-seismogenic structure. It was found that the noise-like behavior of geomagnetic anomalies can be caused by the ionization following intense radon emission. The perturbation of the magnetic field created by charge outflow currents within the electric field was calculated. It was shown that electric charges are generated by air ionization as a result of radon emanation. The modeling has shown that air ionization leads to magnetic field perturbations in the order of 0.001–0.1 nT in the ULF range of 10−3–10−1 Hz. It was found that the relief features can produce magnetic field perturbations if radon is emanated from mountainous regions with irregular relief.
Author Contributions
Conceptualization, methodology, V.Y., A.K., V.G. and S.P.; software, A.K.; validation, A.K., V.Y., V.G. and S.P.; investigation, A.K., V.Y. and V.G.; resources, V.Y.; writing—original draft preparation, V.Y., A.K. and V.G.; writing—review and editing, V.Y. and S.P.; visualization, V.Y., V.G. and A.K.; supervision, project administration, funding acquisition, V.Y. and A.K. All authors have read and agreed to the published version of the manuscript.
Funding
Financial support for this research was partially provide by the CONACYT-Fondos Sectoriales grant CONACYT project A1-S-29604 to Vsevolod Yutsis.
Institutional Review Board Statement
Not applicable.
Informed Consent Statement
Not applicable.
Data Availability Statement
Not applicable.
Acknowledgments
This paper is devoted to the bright memory of Svetlana Koshevaya, a brilliant scientist, constant colleague, and loving mother. The authors are grateful to the three anonymous reviewers, whose valuable observations and comments allowed us to significantly improve the work and to provide some stimulus for further theoretical and experimental research. In addition, we are grateful to the Scientific Editors of the Special Issue “Feature Papers in Upper Atmosphere” of the journal Atmosphere for inviting us to submit the paper. We would especially like to thank Section Managing Editors for the excellent organization of the work with the authors. Financial, administrative, and technical support for this research was partially provided by Instituto Potosino de Investigación Científica y Tecnológica to Vsevolod Yutsis and by Centro de Investigación en Ingeniería y Ciencias Aplicadas, Universidad Autónoma del Estado de Morelos, to Vladimir Grimalsky.
Conflicts of Interest
The authors declare no conflict of interest.
References
- Braile, L.W.; Keller, G.R.; Hinze, W.J.; Lidiak, E.G. An ancient rift complex and its relation to contemporary seismicity in the New Madrid seismic zone. Tectonics 1982, 1, 225–237. [Google Scholar] [CrossRef]
- LiveScience; Lloyd, R. Source of Major Quakes Discovered Beneath U.S. Heartland. 2 May 2007. Available online: http://www.livescience.com/environment/070502_newmadrid_quake.html (accessed on 9 September 2008).
- Brogi, A.; Capezzuoli, E.; Alçiçek, M.C.; Gandin, A. Evolution of a fault-controlled fissure-ridge type travertine deposit in the western Anatolia extensional province: The Çukurbağ fissureridge (Pamukkale, Turkey). J. Geol. Soc. 2014, 171, 425–441. [Google Scholar] [CrossRef]
- Çakir, Z. Along-strike discontinuity of active normal faults and its influence on quaternary travertine deposition; examples from western Turkey. Turk. J. Earth Sci. 2014, 8, 67–80. [Google Scholar]
- Stein, S.; Cloetingh, S.; Sleep, N.H.; Wortel, R. Passive margin earthquakes, stresses and rheology. In Earthquakes at North-Atlantic Passive Margins: Neotectonics and Postglacial Rebound; Gregerson, S., Basham, P., Eds.; Kluwer: Dordecht, The Netherlands, 1989; pp. 231–260. [Google Scholar]
- Talwani, P. (Ed.) Intraplate Earthquakes; Cambridge University Press & Assessment: Cambridge, UK, 2018; ISBN 978-1-107-04038-0. [Google Scholar]
- Chen, C.; Gilbert, H.; Andronicos, C.; Hamburger, M.W.; Larson, T.; Marshak, S.; Pavlis, G.L.; Yang, X. Shear velocity structure beneath the central United States: Implications for the origin of the Illinois Basin and intraplate seismicity. Geochem. Geophys. Geosyst. 2016, 17, 1020–1041. [Google Scholar] [CrossRef]
- Ghosh, A.; Holt, W.E.; Bahadori, A. Role of large-scale tectonic forces in intraplate earthquakes of Central and Eastern North America. Geochem. Geophys. Geosyst. 2019, 20, 2134–2156. [Google Scholar] [CrossRef]
- Schulte, S.; Mooney, W.D. An updated global earthquake catalogue for stable continental regions: Reassessing the correlation with ancient rifts. Geophys. J. Int. 2005, 161, 707–721. [Google Scholar] [CrossRef]
- Sykes, L. Intraplate seismicity, reactivation of preexisting zones of weakness, alkaline magmatism, and other tectonism postdating continental fragmentation. Rev. Geophys. 1978, 16, 621–688. [Google Scholar] [CrossRef]
- Tarduno, J.A.; Duncan, R.A.; Scholl, D.W.; Cottrell, R.D.; Steinberger, B.; Thordarson, T.; Kerr, B.C.; Neal, C.R.; Frey, F.A.; Torii, M.; et al. The Emperor Seamounts: Southward Motion of the Hawaiian Hotspot Plume in Earth’s Mantle. Science 2003, 301, 1064–1069. [Google Scholar] [CrossRef]
- Soman, V.R. Hot Times in Tectonophysics: Mantle Plume Dynamics and Magmatic Perturbances. J. Environ. Ecol. 2020, 11, 19. [Google Scholar] [CrossRef]
- Koppers, A.; Yamazaki, T.; Geldmacher, J.; Gee, J.; Pressling, N.; Hoshi, H.; Anderson, L.; Beier, C.; Buchs, D.; Chen, L.-H.; et al. Limited latitudinal mantle plume motion for the Louisville hotspot. Nat. Geosci. 2012, 5, 911–917. [Google Scholar] [CrossRef]
- Konrad, K.; Koppers, A.A.P.; Steinberger, B.; Finlayson, V.A.; Konter, J.G.; Jackson, M.G. On the relative motions of long-lived Pacific mantle plumes. Nat. Commun. 2018, 9, 854. [Google Scholar] [CrossRef] [PubMed]
- Bono, R.K.; Tarduno, J.A.; Bunge, H.P. Hotspot Motion caused the Hawaiian-Emperor Bend and LLSVPs are not fixed. Nat. Commun. 2019, 10, 3370. [Google Scholar] [CrossRef] [PubMed]
- Lee, C.T.; Grand, S. Intraplate volcanism. Nature 2012, 482, 314–315. [Google Scholar] [CrossRef] [PubMed]
- Coffin, M.F.; Whittaker, J.M. Intraplate Magmatism. In Encyclopedia of Marine Geosciences; Springer Science+Business Media: Dordrecht, The Netherlands, 2015. [Google Scholar] [CrossRef]
- Aranda-Gómez, J.J.; Luhr, J.F.; Housh, T.B.; Valdez-Moreno, G.; Chávez-Cabello, G. El volcanismo tipo intraplaca del Cenozoico tardío en el centro y norte de México: Una revisión. Boletín Soc. Geológica Mex. 2005, 57, 187–225. [Google Scholar] [CrossRef]
- Díaz-Bravo, B.A.; Gómez-Tuena, A.; Ortega-Obregón, C.; Pérez-Arvizu, O. The origin of intraplate magmatism in the western Trans-Mexican Volcanic Belt. Geosphere 2014, 10, 340–373. [Google Scholar] [CrossRef]
- Kuritani, T.; Kimura, J.-I.; Miyamoto, T.; Wei, H.; Shimano, T.; Maeno, F.; Jin, X.; Taniguchi, H. Intraplate magmatism related to deceleration of upwelling asthenospheric mantle: Implications from the Changbaishan shield basalts, northeast China. Lithos 2009, 112, 247–258. [Google Scholar] [CrossRef]
- Johnston, A.C.; Kanter, L.R. Earthquakes in stable continental crust. Sci. Am. 1990, 262, 42–49. [Google Scholar] [CrossRef]
- Forte, A.M.; Mitrovica, J.X.; Moucha, R.; Simmons, N.A.; Grand, S.P. Descent of the ancient Farallon slab drives localized mantle flow below the New Madrid seismic zone. Geophys. Res. Lett. 2007, 34, L04308. [Google Scholar] [CrossRef]
- Ball, P.W.; White, N.J.; Maclennan, J.; Stephenson, S.N. Global influence of mantle temperature and plate thickness on intraplate volcanism. Nat. Commun. 2021, 12, 2045. [Google Scholar] [CrossRef]
- Klöcking, M.; White, N.J.; Maclennan, J.; McKenzie, D.; Fitton, J.G. Quantitative relationships between basalt geochemistry, shear wave velocity, and asthenospheric temperature beneath western North America. Geochem. Geophys. Geosyst. 2018, 19, 3376–3404. [Google Scholar] [CrossRef]
- Surkov, V.V. Pre-seismic variations of atmospheric radon activity as a possible reason for abnormal atmospheric effects. Ann. Geophys. 2015, 58, A0554. [Google Scholar] [CrossRef]
- Cinelli, G.; Tositti, L.; Capaccioni, B.; Brattich, E.; Mostacci, D. Soil gas radon assessment and development of a radon risk map in Bolsena, Central Italy. Environ. Geochem. Health 2015, 37, 305–319. [Google Scholar] [CrossRef] [PubMed]
- Sharma, S.; Kumar, A.; Mehra, R.; Mishra, R. Assessment of Soil Gas Radon and Exhalation Studies in Lower Himalayan Region of Jammu and Kashmir State, India. Pure Appl. Geophys. 2018, 175, 4411–4426. [Google Scholar] [CrossRef]
- Neri, M.; Ferrera, E.; Giammanco, S.; Currenti, G.; Cirrincione, R.; Patanè, G.; Zanon, V. Soil radon measurements as a potential tracer of tectonic and volcanic activity. Sci. Rep. 2016, 6, 24581. [Google Scholar] [CrossRef]
- Kulalı, F.; Akkurt, I.; Özgür, N.; Sezer, M. The correlation of the seismic activities and radon concentration in soil gas. Arab. J. Geosci. 2018, 11, 447. [Google Scholar] [CrossRef]
- Ferrari, L.; Castillo-Reynoso, J.C.; Orozco-Esquivel, T.; Silva-Fragoso, A. Digital geologic map and geochronologic, geochemical and geothermal database of the south-eastern part of the Sierra Madre Occidental, Mexico. Terra Digit. 2018, 2, 1–6. [Google Scholar] [CrossRef]
- Jácome Paz, M.P.; Pérez-Zarate, D.; Prol-Ledesma, R.M.; González Romo, I.; Rodríguez, A. Geochemical exploration in Mesillas geothermal area, Mexico. Appl. Geochem. 2022, 143, 105376. [Google Scholar] [CrossRef]
- Prol-Ledesma, R.M.; Morán-Zenteno, D.J. Heat flow and geothermal provinces in Mexico. Geothermics 2019, 78, 183–200. [Google Scholar] [CrossRef]
- Arango-Galván, C.; Prol-Ledesma, R.M.; Torres-Vera, M.A. Geothermal prospects in the Baja California Peninsula. Geothermics 2015, 55, 39–57. [Google Scholar] [CrossRef]
- Macías Vásquez, J.L.; Carrasco Núñez, G.; Delgado Granados, H. Mapa de Peligros del Volcán Popocatepetl; Instituto de Geofísica, UNAM: Ciudad De México, México, 1995; Available online: http://tornado.cenapred.unam.mx/es/Instrumentacion/InstVolcaca/MVolcan/ImagenesMVolcan/mapaPeligrosA.jpg (accessed on 15 December 2022).
- Macías, J.L. Geología e historia eruptiva de algunos de los grandes volcanes activos de México. Boletín Soc. Geológica Mex. 2005, 57, 379–424. [Google Scholar] [CrossRef]
- Kotsarenko, A.; Pérez Enríquez, R.; López Cruz-Abeyro, J.A.; Koshova, S.; Grimalsky, V. Analysis of the ULF electromagnetic emission related to seismic activity, Teoloyucan geomagnetic station, 1998–2001. Nat. Hazards Earth Syst. Sci. (NHESS) 2004, 4, 679–684. [Google Scholar] [CrossRef]
- Kotsarenko, A.; Grimalsky, V.; Pérez Enríquez, R.; Valdez-González, C.; Koshevaya, S.; López Cruz-Abeyro, J.A.; Yutsis, V. Volcano Popocatepetl, Mexico: ULF geomagnetic anomalies observed at Tlamacas station during March–July 2005. Nat. Hazards Earth Syst. Sci. (NHESS) 2007, 7, 103–107. [Google Scholar] [CrossRef]
- Kotsarenko, A.; Pérez Enríquez, R.; López Cruz-Abeyro, J.A.; Koshevaya, S.; Grimalsky, V.; Yutsis, V.; Kremenetsky, I. ULF geomagnetic anomalies of possible seismogenic origin observed at Teoloyucan station, México, in 1999–2001: Intermediate and Short-Time Analysis. Tectonophysics 2007, 431, 249–262. [Google Scholar] [CrossRef]
- Kotsarenko, A.; Grimalsky, V.; Pérez Enríquez, R.; Yutsis, V.; Koshevaya, S.; Lopez Cruz-Abeyro, J.A.; Valdez-Gonzalez, C.; Villegas Cerón, R.A. Geomagnetic anomalies observed at volcano Popocatepetl, Mexico. Adv. Geosci. 2008, 14, 21–24. [Google Scholar] [CrossRef][Green Version]
- Kotsarenko, A.; Grimalsky, V.; Yutsis, V.; Medina Pérez, L.I.; Bravo Osuna, A.G.; Koshevaya, S.; Peréz Enríquez, H.R.; Urquiza Beltrán, G.; Villegas Cerón, R.A.; Lopez Cruz Abeyro, J.A.; et al. Experimental studies of anomalous Radon activity in the Tlamacas mountain, volcano Popocatepetl area, Mexico: New tools to study Litosphere-Atmosphere coupling for forecasting volcanic and seismic events. Ann. Geophys. 2012, 55, 109–118. [Google Scholar] [CrossRef]
- Kotsarenko, A.; Yutsis, V.; Grimalsky, V.; Koshevaya, S. Detailed Study of Radon Spatial Anomaly in Tlamacas Mountain Area, Volcano Popocatepetl, Mexico. Open J. Geol. 2016, 6, 158–164. [Google Scholar] [CrossRef]
- Kotsarenko, A.; Yutsis, V.; Grimalsky, V.; Koshevaya, S.; Kotsarenko, Y. Geomagnetic anomalies in the area of volcano Popocatepetl, Mexico. Geofis. Int. 2019, 58, 101–111. [Google Scholar] [CrossRef]
- Kotsarenko, A.; Yutsis, V.; Grimalsky, V.; Koshevaya, S.; Kotsarenko, Y. Anomalous temperature regimen in the near-surface soil layer of Tlamacas hill and its relation to activity of Popocatépetl Volcano, Mexico. BSGF—Earth Sci. Bull. 2020, 191, 3. [Google Scholar] [CrossRef]
- Chi, P.J.; McMAC Team. Observations by Mid-continent Magnetoseismic Chain (McMAC) and their use in space weather research. In Proceedings of the 36th COSPAR Scientific Assembly, Beijing, China, 16–23 July 2006; Available online: http://www.cosis.net/abstracts/COSPAR2006/02530/COSPAR2006-A-02530-1.pdf (accessed on 15 December 2022).
- Iwata, D.; Nagahama, H.; Muto, J.; Yasuoka, Y. Non-parametric detection of atmospheric radon concentration anomalies related to earthquakes. Sci. Rep. 2018, 8, 13028. [Google Scholar] [CrossRef] [PubMed]
- D’Incecco, S.; Petraki, E.; Priniotakis, G.; Papoutsidakis, M.; Yannakopoulos, P.; Nikolopoulos, D. CO2 and Radon Emissions as Precursors of Seismic Activity. Earth Syst. Environ. 2021, 5, 655–666. [Google Scholar] [CrossRef]
- Woith, H. Radon earthquake precursor: A short review. Eur. Phys. J. Spec. Top. 2015, 224, 611–627. [Google Scholar] [CrossRef]
- Alam, A.; Wang, N.; Zhao, G.; Barkat, A. Implication of Radon Monitoring for Earthquake Surveillance Using Statistical Techniques: A Case Study of Wenchuan Earthquake. Geofluids 2020, 2020, 2429165. [Google Scholar] [CrossRef]
- Ingebritsen, S.E.; Manga, M. Hydrogeochemical precursors. Nat. Geosci. 2014, 7, 697–698. [Google Scholar] [CrossRef]
- Barkat, A.; Ali, A.; Hayat, U.; Crowley, Q.G.; Rehman, K.; Siddique, N.; Haidar, T.; Iqbal, T. Time series analysis of soil radon in northern Pakistan: Implications for earthquake forecasting. Appl. Geochem. 2018, 97, 197–208. [Google Scholar] [CrossRef]
- Nazaroff, W.W. Radon transport from soil to air. Rev. Geophys. 1992, 30, 137–160. [Google Scholar] [CrossRef]
- Muto, J.; Yasuoka, Y.; Miura, N.; Iwata, D.; Nagahama, H.; Hirano, M.; Ohmomo, Y.; Mukai, T. Preseismic atmospheric radon anomaly associated with 2018 Northern Osaka earthquake. Sci. Rep. 2021, 11, 7451. [Google Scholar] [CrossRef]
- Zhou, Z.; Tian, L.; Zhao, J.; Wang, H.; Liu, J. Stress-Related Pre-Seismic Water Radon Concentration Variations in the Panjin Observation Well, China (1994–2020). Front. Earth Sci. 2020, 8, 596283. [Google Scholar] [CrossRef]
- Fu, C.; Yang, T.; Tsai, M.; Lee, L.; Liu, T.; Walia, V.; Chen, C.; Chang, W.; Kumar, A.; Lai, T. Exploring the relationship between soil degassing and seismic activity by continuous radon monitoring in the Longitudinal Valley of eastern Taiwan. Chem. Geol. 2017, 469, 163–175. [Google Scholar] [CrossRef]
- Zmazek, B.; Živcic, M.; Todorovski, L.; Džeroski, S.; Janja Vaupotic, J.; Kobal, I. Radon Anomalies in Soil Gas Caused by Seismic Activity. Acta Geotech. Slov. 2004, 1, 13–19. [Google Scholar]
- Zenginerler, Z.; Ertugrul, F.; Yakut, H.; Tabar, E.; Demirci, N.; Gunermelikoglu, K. Measurement of seasonal indoor radon concentration in Sakarya University, Turkey. Acta Phys. Pol. A 2016, 130, 450–452. [Google Scholar] [CrossRef]
- Hoppel, W.A.; Anderson, R.V.; Willett, J.C. Atmospheric Electricity in the Planetary Boundary Layer. In The Earth’s Electrical Envirinment; Studies in Geophysics; National Academy Press: Washington, DC, USA, 1986; pp. 149–165. [Google Scholar]
- Pulinets, S.; Ouzounov, D.; Karelin, A.; Boyarchuk, K. Earthquake Precursors in the Atmosphere and Ionosphere. New Concepts; Springer Nature: Dordrecht, The Netherlands, 2023; 312p. [Google Scholar] [CrossRef]
- Kobeissi, M.A.; Gomez, F.; Tabet, C. Measurement of anomalous radon gas emanation across the Yammouneh Fault in Southern Lebanon: A possible approach to earthquake prediction. Int. J. Disaster Risk Sci. 2015, 6, 250–266. [Google Scholar] [CrossRef]
- Pulinets, S.A.; Boyarchuk, K.A. Ionospheric Precursors of Earthquakes; Springer: Berlin/Heidelberg, Germany; New York, NY, USA, 2004; 315p. [Google Scholar] [CrossRef]
- Pulinets, S.; Budnikov, P.; Karelin, A.; Žalohar, J. Thermodynamic instability of the atmospheric boundary layer stimulated by tectonic and seismic activity. J. Atmos. Sol.-Terr. Phys. 2023, 106050. [Google Scholar] [CrossRef]
- Kikuchi, H. Electrohydrodynamics in Dusty and Dirty Plasmas: Gravito-Electrodynamics and EHD; Springer: Dordrecht, The Netherlands, 2001; 207p. [Google Scholar] [CrossRef]
- Hoppel, W.A. Theory of Electrode Effect. J. Atmosph. Terrestr. Phys. 1967, 29, 709–721. [Google Scholar] [CrossRef]
- Willet, J.C. Fair-Weather Electric Charge Transfer by Convection in an Unstable Boundary Layer. J. Geophys. Res. Ocean. 1979, 84, 703–718. [Google Scholar] [CrossRef]
- Seropian, G.; Kennedy, B.M.; Walter, T.R.; Ichihara, M.; Jolly, A.D. A review framework of how earthquakes trigger volcanic eruptions. Nat. Commun. 2021, 12, 1004. [Google Scholar] [CrossRef]
- Farías, C.; Galván, B.; Miller, S.A. Numerical simulations (2D) on the influence of pre-existing local structures and seismic source characteristics in earthquake-volcano interactions. J. Volcanol. Geotherm. Res. 2017, 343, 192–210. [Google Scholar] [CrossRef]
- Linde, A.T.; Sacks, I.S. Triggering of volcanic eruptions. Nature 1998, 395, 888–890. [Google Scholar] [CrossRef]
- Manga, M.; Brodsky, E. Seismic triggering of eruptions in the far field: Volcanoes and geysers. Annu. Rev. Earth Planet. Sci. 2006, 34, 263–291. [Google Scholar] [CrossRef]
- Namiki, A.; Rivalta, E.; Woith, H.; Walter, T.R. Sloshing of a bubbly magma reservoir as a mechanism of triggered eruptions. J. Volcanol. Geotherm. Res. 2016, 320, 156–171. [Google Scholar] [CrossRef]
- Vargas, C.A.; Koulakov, I.; Jaupart, C.; Gladkov, V.; Gomez, E.; El Khrepy, S.; Al-Arifi, N. Breathing of the Nevado del Ruiz volcano reservoir, Colombia, inferred from repeated seismic tomography. Sci. Rep. 2017, 7, 46094. [Google Scholar] [CrossRef]
- Archer, M.O.; Hartinger, M.D.; Rastätter, L.; Southwood, D.J.; Heyns, M.; Eggington, J.W.B.; Wright, A.N.; Plaschke, F.; Shi, X. Auroral, ionospheric and ground magnetic signatures of magnetopause surface modes. J. Geophys. Res. Space Phys. 2023, 128, e2022JA031081. [Google Scholar] [CrossRef]
- Keiling, A. Alfvén waves and their roles in the dynamics of the earth’s magnetotail: A review. Space Sci. Rev. 2009, 142, 73–156. [Google Scholar] [CrossRef]
- Heyns, M.J.; Lotz, S.I.; Gaunt, C.T. Geomagnetic pulsations driving geomagnetically induced currents. Space Weather 2021, 19, e2020SW002557. [Google Scholar] [CrossRef]
Disclaimer/Publisher’s Note: The statements, opinions and data contained in all publications are solely those of the individual author(s) and contributor(s) and not of MDPI and/or the editor(s). MDPI and/or the editor(s) disclaim responsibility for any injury to people or property resulting from any ideas, methods, instructions or products referred to in the content. |
© 2023 by the authors. Licensee MDPI, Basel, Switzerland. This article is an open access article distributed under the terms and conditions of the Creative Commons Attribution (CC BY) license (https://creativecommons.org/licenses/by/4.0/).