Article

Frost Risk Assessment in Slovenia in the Period of 1981–2020

1
Biotechnical Faculty, University of Ljubljana, Jamnikarjeva 101, 1000 Ljubljana, Slovenia
2
Slovenian Environment Agency, Vojkova 1b, 1000 Ljubljana, Slovenia
*
Author to whom correspondence should be addressed.
Atmosphere 2023, 14(4), 683; https://doi.org/10.3390/atmos14040683
Submission received: 24 February 2023 / Revised: 23 March 2023 / Accepted: 3 April 2023 / Published: 5 April 2023
(This article belongs to the Special Issue Vegetation and Climate Relationships (2nd Edition))

Abstract

:
As spring frost proves to be an increasing risk throughout Slovenia and Europe, a better assessment of frost risk is needed. The statistical approach presented in this article consists of the conditional probability that the last spring frost occurs before budburst or flowering. The analysis was conducted using two separate phenological models and phenological data of various grapevine (Vitis vinifera L.), apple (Malus domestica), and sweet cherry (Prunus avium L.) varieties in locations across Slovenia. The increase in risk of spring frost for grapevine ranged from 1 to 1980, from 0.06 to 12 for apple, and from 1 to 180 for sweet cherry. Overall, the varieties most prone to frost proved to be Refošk (Teran) and Merlot grapevine varieties as well as the Germersdorf sweet cherry variety. We have identified the location in the hilly region with moderate climate where the Bobovec apple variety is grown as the least exposed to frost. Although counterintuitive, the GDD generally proved somewhat more efficient than the two-phase phenological model BRIN, although not in all cases. For the purpose of the study, the phenological models were calibrated, and the model parameters can serve as invaluable information for further research of this topic.

1. Introduction

The most prominent environmental factor for the temporal development of phenological stages is temperature [1], and due to climate change, its impact is accelerating the onset of phenological stages in fruit trees in the majority of the winemaking and fruit-growing regions in Slovenia and worldwide [2,3]. In the last decade, damaging frost events have been occurring with increasing frequency in Slovenia, as in other European countries [4,5], with the greatest losses noted by field experts in 2012 (mid-April frost), 2016 (late April), 2017 (20–22 April), 2020 (late March), and 2021 (6–8 April). Fruit trees can tolerate severe cold in winter; however, winter hardiness of the flower buds gradually decreases during spring phenological development. Consequently, frost damage may occur at temperatures below freezing if the fruit tree is at a sensitive phenological stage, such as budburst or flowering [1,6]. However, in recent years, both increasing and decreasing risks of spring frosts have been reported under future climate conditions [4,5,6,7,8,9,10,11,12]. The phenology of temperate fruit trees is mainly determined by radiative forcing, which is strongly influenced by seasonal changes. The coldest months with a short photoperiod mark a dormant stage characterized by growth arrest and high cold resistance [13]. Because the timing of budburst is determined by the sequential fulfilment of cold requirements and heat requirements for development, adaptation of fruit trees to a cool environment by reducing cold requirements can significantly increase tree susceptibility to crop-destroying spring frosts [14,15].
Following the classical approach, phenological models generally assume that budburst is temperature-regulated and is initiated by a period of sufficient exposure of the plant to cold temperatures (chilling state or dormancy, also endodormancy). It is then followed by a period of exposure of the plant to accumulated heat (forcing state or post-dormancy), which begins to take effect for bud development [16,17]. This stage eventually culminates in budburst after the plant has been exposed to sufficiently warm temperatures. Therefore, the phenological stage of budburst represents a crucial stage in the development of grapevine (Vitis vinifera L.) [3,10,17,18,19]. In other fruit trees such as apple (Malus domestica) [7,9,11,20], peach (Prunus persica) [12,21,22,23], pear (Pyrus communis) [6], and sweet cherry (Prunus avium L.) [4,5], an equally crucial stage exposed to high spring frost risk is flowering. With rising spring temperatures, the water content in buds and shoots increases and the cold resistance of the buds steadily decreases [3,24,25]. In apples, between the bud swell stage and the beginning of apple flowering, the cold resistance of the tree buds decreases, and the temperature for 10% damage increases from LT10 = −9.4 °C to LT10 = −2.2 °C, thus increasing the risk of frost [1]. The critical temperature depends on the phenological stage of the plant and the duration of the frost. In grapevine, the critical temperature for cold damage at budburst is −2 °C, although around 0 °C can cause significant damage to young plant tissues such as buds [1,3]. However, for the Merlot variety, even with 100% frost damage, the plant can still produce about 20–30% of the yield from side branches [1]. For apples, the critical temperature for cold damage is −4 °C and for flowering (first bloom) is −2.2 °C [1]. Varieties most susceptible to spring frost damage in Slovenia include Elstar, Jonagold, and Belle de Boskoop, followed by Jonathan, Gala, Alkmene, Summerred, and Idared; the least susceptible varieties include Golden Delicious and Gloster [1]. Among grapevines, all early-flowering varieties such as Yellow Muscat, Blaufraenkisch, Sipon, Chardonnay, and Gewuerztraminer are frost-sensitive, and among varieties growing in the Mediterranean climate region of Slovenia, Cabernet Sauvignon and Malvasia are slightly frost-sensitive due to their late flowering. The most cold-sensitive varieties are Chardonnay, Pinot blanc, and Barbera. For cherries, the critical temperature for frost damage at the onset of budburst is −4.5 °C and for cold damage at the onset of flowering is −2.2 °C [1].
The most common approach to model budburst, flowering, or other stages is the classical growing degree days (GDD, growing degree days) model [3,5,8]; however, authors are constantly seeking alternative approaches to numerically assess frost risk [10,11,26,27]. One example of an approach by Swiss researchers [5] is to combine the growing degree day model with the estimation of frost risk by calculating the safety margin, which is the time interval between the predicted last flowering day and the last day of spring frost. Another approach to calculating frost risk is represented by the methodology of [28], which defines frost resistance of fruit trees based on the lethal temperature for 50% of the trees contained in the sample (LT50). Other authors also use more advanced and unconventional approaches in their risk assessment, such as machine learning [29] and a coupled stochastic model [30], where the first phase of the process is parameterized by the Ornstein–Uhlenbeck process with linearly increasing spring temperature and the second phase with the thermal time model.
Previous research by the Slovenian Environment Agency showed neither a significant increase nor decrease in frost risk for some of the main Slovenian fruit-growing regions for the period of 2010 onwards [31]. In contrast to these results, the frequency of frost events causing severe damage in Slovenian vineyards and orchards has steadily increased over the last two decades. Therefore, the aim of the present study was to test an alternative methodology for the assessment of frost events. The present study was divided into two parts. First, two different phenological models were applied to the Slovenian observational data. Then, the phenological model best suited for simulating the occurrence of grapevine budburst and flowering in apple and sweet cherry was selected. Secondly, an assessment of frost risk for period 2001–2020 in comparison with the reference period 1981–2000 was made using the methodology described in detail in [3]. The analysis was conducted using phenological data from stations in all major Slovenian wine and fruit-growing regions. This study provides new insights into plant response to climate change in Slovenia, where the diverse characteristics of Alpine, Mediterranean, and continental climates are present.

2. Materials and Methods

2.1. Climate Data

Slovenia is situated in Central Europe and borders Austria, Croatia, Italy, and Hungary, its climate being strongly influenced by the Alps in the north and the Adriatic Sea in the south. In the northeast, the continental type of climate prevails, with the greatest difference between winter and summer temperatures, whereas in the coastal region, Mediterranean climate is present with mild winters and hot summers. Precipitation varies across the country, exceeding 3000 mm in the western regions and dropping to 800 mm in the northeast [31]. According to the most recent objective classification, the climate in Slovenia can be divided into the following 6 climate types: sub-Mediterranean climate region, wet climate of the hilly region, moderate climate of the hilly region, subcontinental climate region, sub-Alpine climate region, and Alpine climate region [32].
For this study, we used historical climate data for the period 1981–2020. As a first guess value for temperature, the gridded observational dataset E-OBS was used [33]. The E-OBS observational data first had to be interpolated to the locations of phenological stations to take into account the effect of elevation on microclimate. The first guess estimate was in the first step corrected with the elevation difference following [34] and finally by a correction obtained from the measurement archive of the Slovenian Environment Agency. The temperature downscaling model used can be described by the following equation:
Tint = TEobs + g × (h − hEobs) + dT
where TEobs is the first guess estimate of temperature from the E-OBS dataset at phenological station locations, g is the monthly mean vertical gradient, h is the actual altitude of the phenological station, hEobs is the altitude in the E-OBS raster at the phenological station location, and dT is the correction term obtained by interpolation from temperature measurement locations (where this deviation was calculated) using the simple inverse distance interpolation method. Therefore, the climate dataset used in this analysis consists of daily historical temperature data interpolated to the locations and altitudes of the phenological stations.

2.2. Phenological Observations

To test the validity of the chosen phenological models, we used a set of observed budburst dates from the Slovenian Environment Agency database of phenological observations. The database consists of observations of the most significant phenological stages for the most common fruit-growing regions in Slovenia, as shown in Figure 1. For the purpose of the analysis, we grouped the chosen phenological stations by their corresponding climate types, according to the most recent objective classification of climate in Slovenia [32]. For grapevine, we analyzed 9 locations classified into subcontinental (Bizeljsko, Slovenske Konjice, Šalovci, Zibika) and sub-Mediterranean climate regions (Portorož, Rižana, Slap, Tomaj). For apple, a total of 18 locations were available, which are spread across the following regions: moderate climate of the hilly region (Lesce, Slovenj Gradec), subcontinental (Bizeljsko, Brod, Bukovci, Bukovžlak, Dobliče, Kadrenci pri Cerkvenjaku, Mokronog, Maribor, Novo mesto, Podlehnik, Rakičan, Slovenske Konjice, Šalovci, Vrhnika, Zibika), and sub-Mediterranean climate regions (Portorož) (Table 1). For sweet cherry, all of the 5 stations are part of the sub-Mediterranean climate region (Bilje, Portorož, Rižana, Slap, Tomaj). In general, the database of budburst and flowering dates covers the period 1981–2010; however, the specific number of observations varies from location to location, as shown in Table 1 below.

2.3. Phenological Models

Based on cumulative heat requirement, the GDD model is the most widely used thermal time model for fruit tree phenology and accounts for the forcing period (post-dormancy period). In other terms, the ending of the dormancy period is defined in advance and fixed on the first consecutive day of the year t0, i.e., 1 January. The equation for the forcing units (Fu) of the GDD model is presented below.
F u = { 0 ;     if   T avg T b T avg T b ;   if   T avg > T b
The day of the budburst t b b takes place once the equation t 0 t bb F u = F crit is satisfied. Because several authors have shown experimentally that the base temperature for budburst of grapevine is around 5 °C [3,17,35], the base temperature Tb is set as Tb = 5 °C for grapevine. The base temperature for apple is Tb = 3 °C and Tb = 4.5 °C for sweet cherry, as the typically applied base temperature in numerous studies ranges between 1.6 and 4 °C for apple [6,10,20] and between 4 and 5 °C for sweet cherry [4,5]. Parameter Tavg represents the mean daily temperature. As parameters Fcrit have not yet been calculated for Slovenian fruit tree varieties, we calculated the parameters from the historical dataset.
A logical upgrade of the GDD model for modeling budburst is the use of more complex thermal time concepts such as the BRIN model [17], in which the budburst process is induced by a two-phased process—a dormancy or cold action period and a post-dormancy or warm action period. More specifically, the BRIN model is derived from a combination of two models used for fruit trees, where the dormancy period is calculated using Bidabe’s Cold Action model [36], and the post-dormancy period is calculated using a growing degree hour approach (GDH) [22,23]. The main advantage of the BRIN model over the classical GDD approach is the variability of the dormancy break, which in the GDD model by definition occurs on the first consecutive day of the year (January 1), and in the BRIN model, the dormancy break occurs once a critical chilling Ccrit has been accumulated starting from the initial day t0 [17]. In the case of the two-phased BRIN model [18,37], the dormancy period break t db occurs once the chilling forcing requirement is satisfied ( t 0 t db C u = C crit ). The start of the dormancy period is set to August 1 (t0) based on numerous studies [38,39], and the chilling units are based on Bidabe’s formula
C u = Q 10 T max 10 + Q 10 T min 10 ,
where Tmin and Tmax are daily minimum and maximum temperatures. The dormancy period is followed by the post-dormancy period, which is approximated by the growing degree hours, accumulated over a day. The forcing unit is then as follows:
F u = { 0 ;          if   T max + T min 2 T b T max + T min 2 ;         if   T b < T max + T min 2 < T B T B T b ;    if   T max + T min 2 T B
The budburst date tbb then occurs when the condition t db t bb F u = F crit is satisfied. The configuration we used in our analysis is based on [3,17]; thus, the chosen parameters are Q 10 = 2.17 ,   T B = 25   ° C ,   T b = 5   ° C for grapevine, T b = 3   ° C for apple, and T b = 4.5   ° C for sweet cherry.

2.4. Statistical Assessment of Frost Risk

The methodology is thoroughly described in [3] and in the first phase focuses on the use of phenological models for the calculation of the budburst date, whereas in the second stage, a calculation of frost probability is in place. The main assumption in this procedure is that the frost event in the case of grapevine is characterized as an event that occurs when budburst occurs before the last frost event [3], while for apple or sweet cherry, it is when flowering occurs before the last frost event [4,6]. The methodology of the authors is thus based on the calculation of (i) the date of budburst and (ii) the date of the last frost for each year of data available at the phenological stations, where frost is defined as Tavg < 2 °C and Tmin < −2 °C. The next assumption is that the day (DOY, “day of year”) of budburst and the last day of frost can be both described by Gaussian probability distributions, i.e.,
p bb ( t ) = 1 σ bb 2 π e ( t m bb ) 2 2 σ bb 2
for budburst and
p lf ( t ) = N f N   1 σ lf 2 π e ( t m lf ) 2 2 σ lf 2
for the day of last frost. Since the probability of the last day of frost is the probability that the DOY of budburst is t = t* and that date falls prior to the last day of frost t* ≤ tlf, it follows that the probability distribution of tardive frost as described in [3] in more detail is
P tf = t * = t 0 t f { p bb ( t * ) [ 1 t = t 0 t * p lf ( t ) ] } .
As mentioned before, in the case of apple or sweet cherry, the equation is P tf = t * = t 0 t f { p fl ( t * ) [ 1 t = t 0 t * p lf ( t ) ] } where p fl is the probability of flowering.

2.5. General Procedure

The main objective of this study was to test an alternative frost risk assessment methodology for several grapevine, sweet cherry, and apple varieties in Slovenia between 1981 and 2020. The first part of the analysis demanded a calculation of a single set of input parameters for the Slovenian grapevine, apple, and sweet cherry varieties. Afterward, the second part of the analysis represented the implication of the statistical model of frost risk, using the outputs of both phenological models. The aforementioned methodology, therefore, demands several sets of climatological and phenological data, which will be described in detail in the following sections.
In order to obtain a set of phenological model parameters for each variety across all locations in Slovenia, calibration of the phenological models was carried out using cross-validation as proposed in [40] and [17]. Specifically, we used leave-one-out cross-validation (LOOCV) by dividing the set of N data values into a subsample of N−1 values on which parameters were calibrated, and a single individual value (i) on which we evaluated the resulting model. The validation results provided an estimate of the phenological model that better fit the observed data. The root mean square error of prediction (RMSEP) statistic was calculated to evaluate the agreement between the modeled and observed budburst (flowering) data, and thus assess the model performance [41].
Nevertheless, the Nelder–Mead optimization method was applied to the entire dataset to fit the model parameters. The algorithm minimized the mean square error (RMSE) function, which represents the squared difference between the observed dates (Oi) and the dates predicted by the model (Pi).
RMSE = 1 N i = 1 N ( P i O i ) 2
A graphical comparison of the modeled and observed time series was also presented, along with an assessment of the statistical significance of the trend in observed budburst data (flowering data) using the Mann–Kendall test.

3. Results

3.1. Calculation of Model Parameters and Assessment of Model Performance

The available historical phenological datasets provided a basis for calculation of the main GDD and BRIN model parameters—Fcrit for the GDD model, as well as Ccrit and Fcrit for BRIN. Based on the results of leave-one-out cross-validation, we chose the model that showed better performance for implementing the statistical model of frost risk.
For grapevine, the GDD model with the chosen base temperature of 5 °C generally provided better results than the BRIN model for all varieties except Refošk–Teran (Table 2; Figure 2). The best agreement between the historical and model data was obtained for the Chardonnay variety, which is grown in the subcontinental climate in Slovenia (location Šalovci).
The GDD3 and BRIN (base temperature 3 °C) phenological models showed the highest performance for the Jonagold apple variety at location Bizeljsko, which represents the subcontinental climate type in Slovenia (Table A1; Figure 3). In general, the GDD model provided results that better matched phenological measurements for four out of six varieties (Elstar, Golden Delicious, Jonagold, and Jonathan) while BRIN excelled in predicting flowering for the remaining two varieties (Bobovec and Idared).
For sweet cherry (Table A2; Figure 4), GDD4.5 (base temperature 4.5 °C) performed better than BRIN for three out of four varieties, and hence, the best agreement was discovered for the Early Bigi variety, grown in the sub-Mediterranean climate (location Tomaj).
The results of the Mann–Kendall trend test performed for the observed budburst dates (whole period) show a statistically significant downward trend for the majority of the grapevine varieties, as shown for the Refošk–Teran variety grown in the sub-Mediterranean climate region and the Laški Rizling variety from the subcontinental climate region (Figure 2a,b).
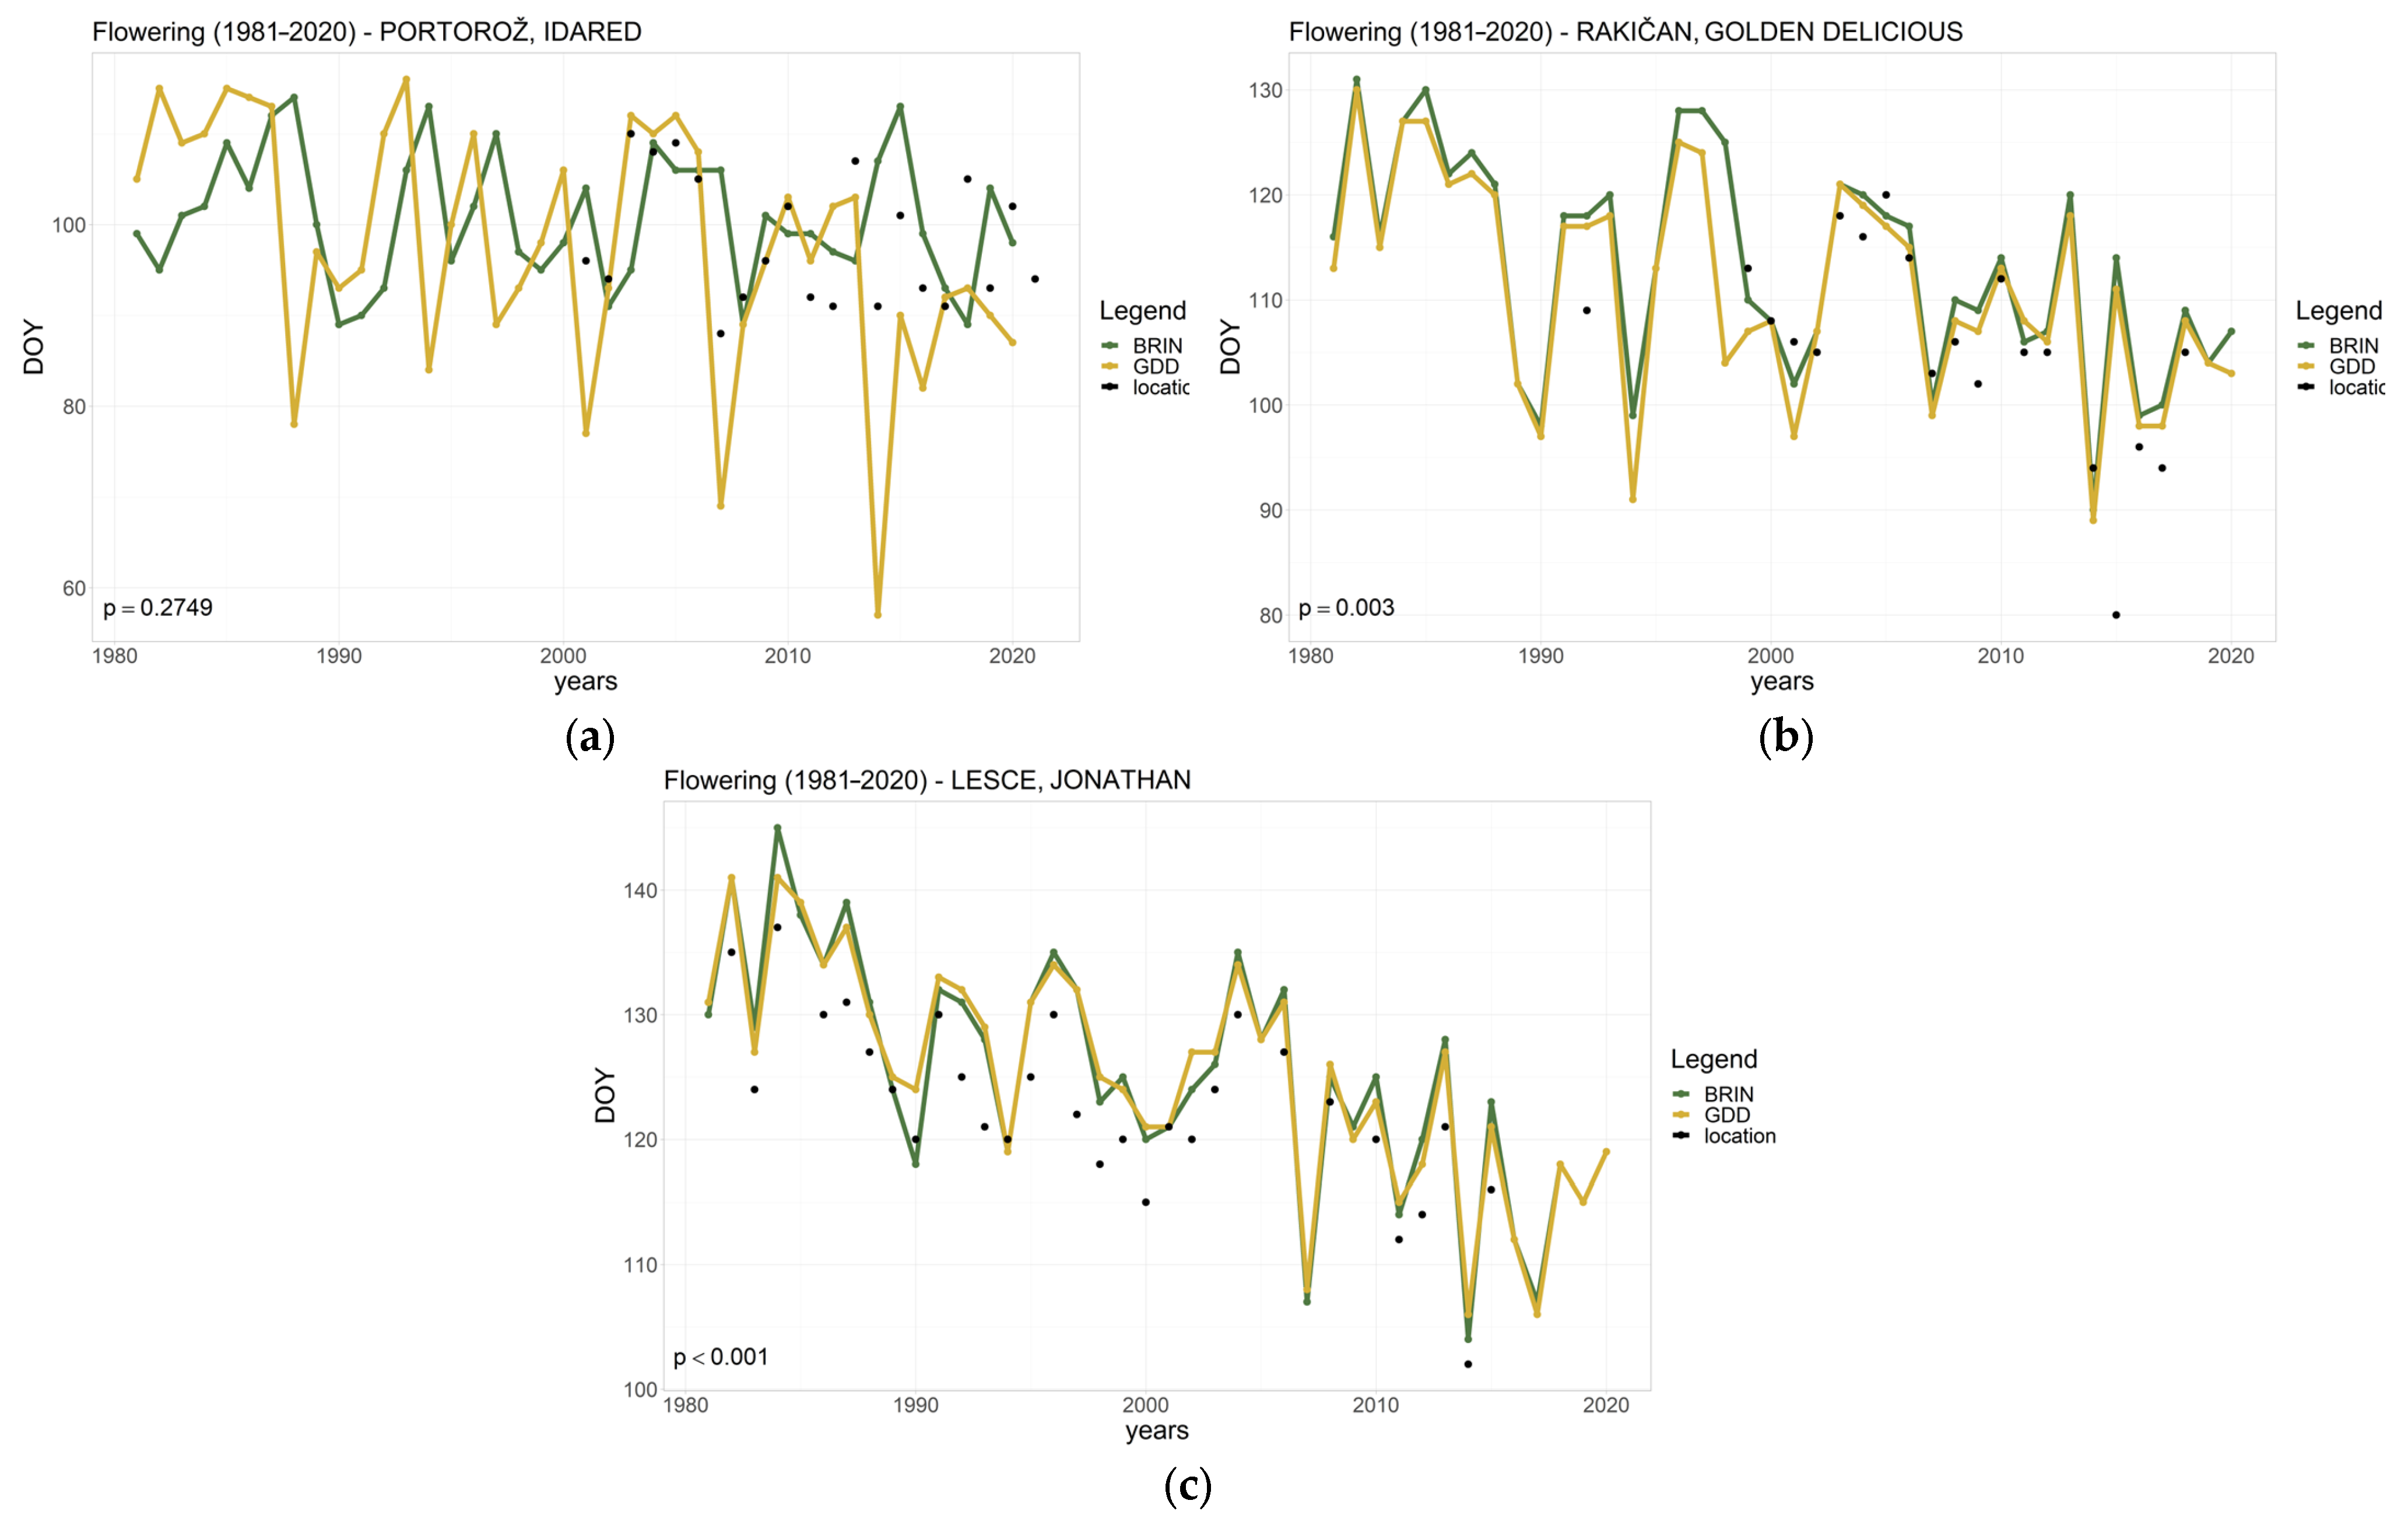
Similarly, for approximately half of the locations with various apple varieties, the Mann–Kendall test of trend shows a statistically significant downward trend in observed budburst dates towards earlier dates in the year. Examples of the Idared variety (sub-Mediterranean climate), Golden Delicious variety (subcontinental climate), and Jonathan variety (moderate climate of the hilly region) are shown in Figure 3a–c.
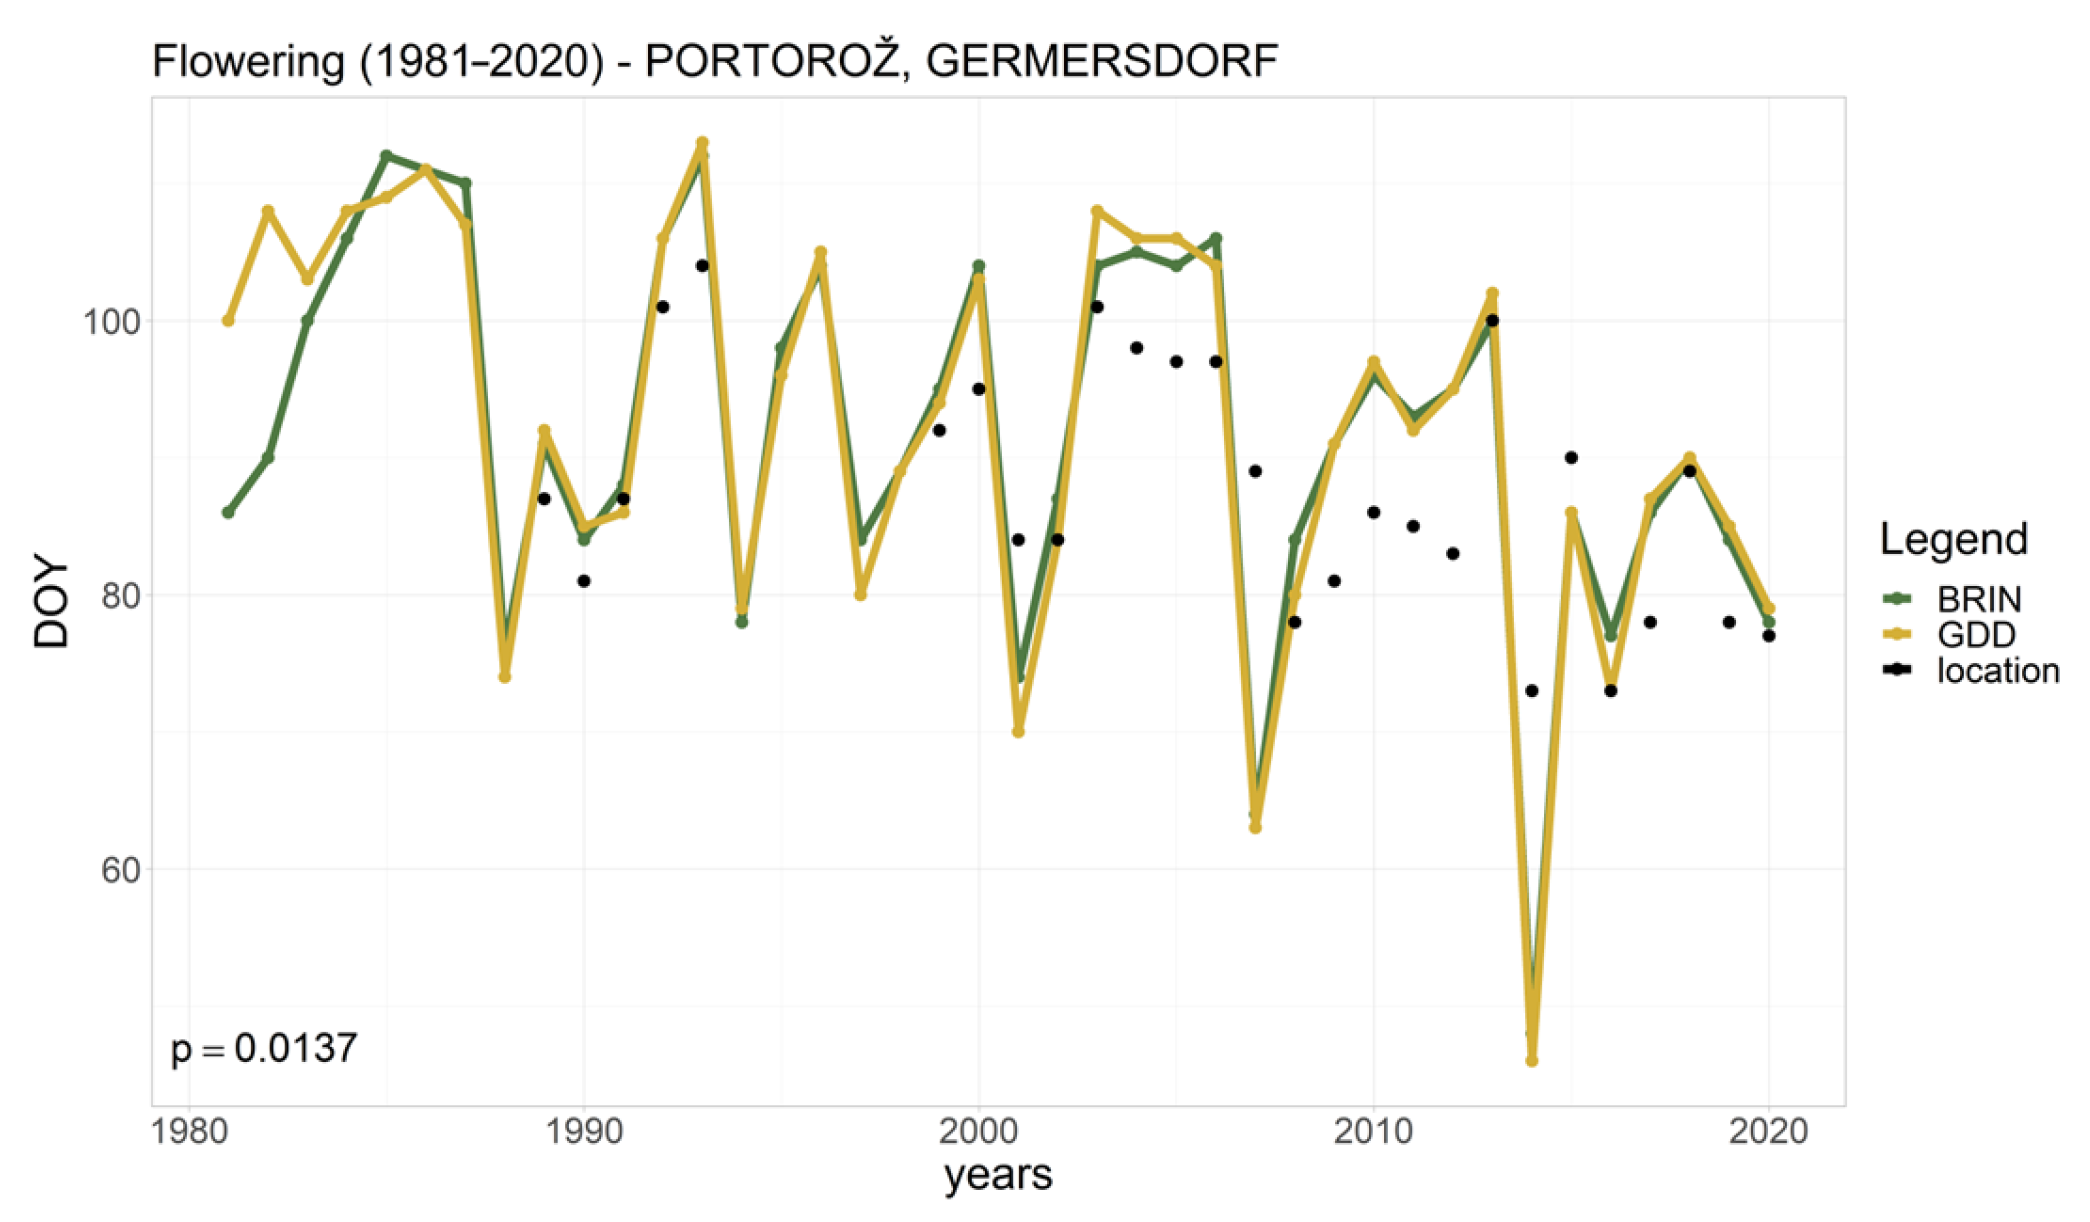
An example of fairly good agreement between model and historical data is shown in Figure 4 for the Germersdorf sweet cherry variety at a sub-Mediterranean climate location (Portorož), where the GDD model results best fit the budburst records, which cover the longest period of 27 years. Nonetheless, for the majority of the chosen sweet cherry varieties, the results show no statistically significant trend in observed budburst dates.
The calculated mean GDD and BRIN model parameters for the analyzed grapevine, apple, and sweet cherry varieties are presented in Table 3, Table A3 and Table A4, respectively. The budburst dates of grapevine varieties Refošk–Teran, Laški Rizling, and Chardonnay calculated by the GDD5 model coincide with the modeled budburst dates of the BRIN model. For other varieties, either BRIN (Malvasia) or GDD5 (Merlot) simulate a slightly premature budburst in regard to the other phenological model (Table 3). In the case of apple varieties, the GDD3 model agrees very well with the budburst date as modeled by BRIN for three out of six varieties (Jonathan, Elstar, Idared). For the remaining three varieties, GDD3 predicts a slightly earlier budburst than BRIN (Bobovec, Golden Delicious, and Jonagold), the difference in budburst dates not being larger than one day (Table A3). Similarly, in the case of sweet cherry varieties, the GDD4.5 model appears to plausibly represent the budburst date as modeled by BRIN. Taking into consideration the fairly small dataset available for some of the varieties (Jonagold apple variety, Early Bigi, and Van sweet cherry varieties), the budburst dates modeled by both phenological models coincide relatively well (Table A4). Nevertheless, only the better fitting model, either GDD or BRIN, was used as a reference model for the second part of the analysis and the computation of frost risk.

3.2. Frost Risk Comparison between Periods 2001–2020 and 1981–2000

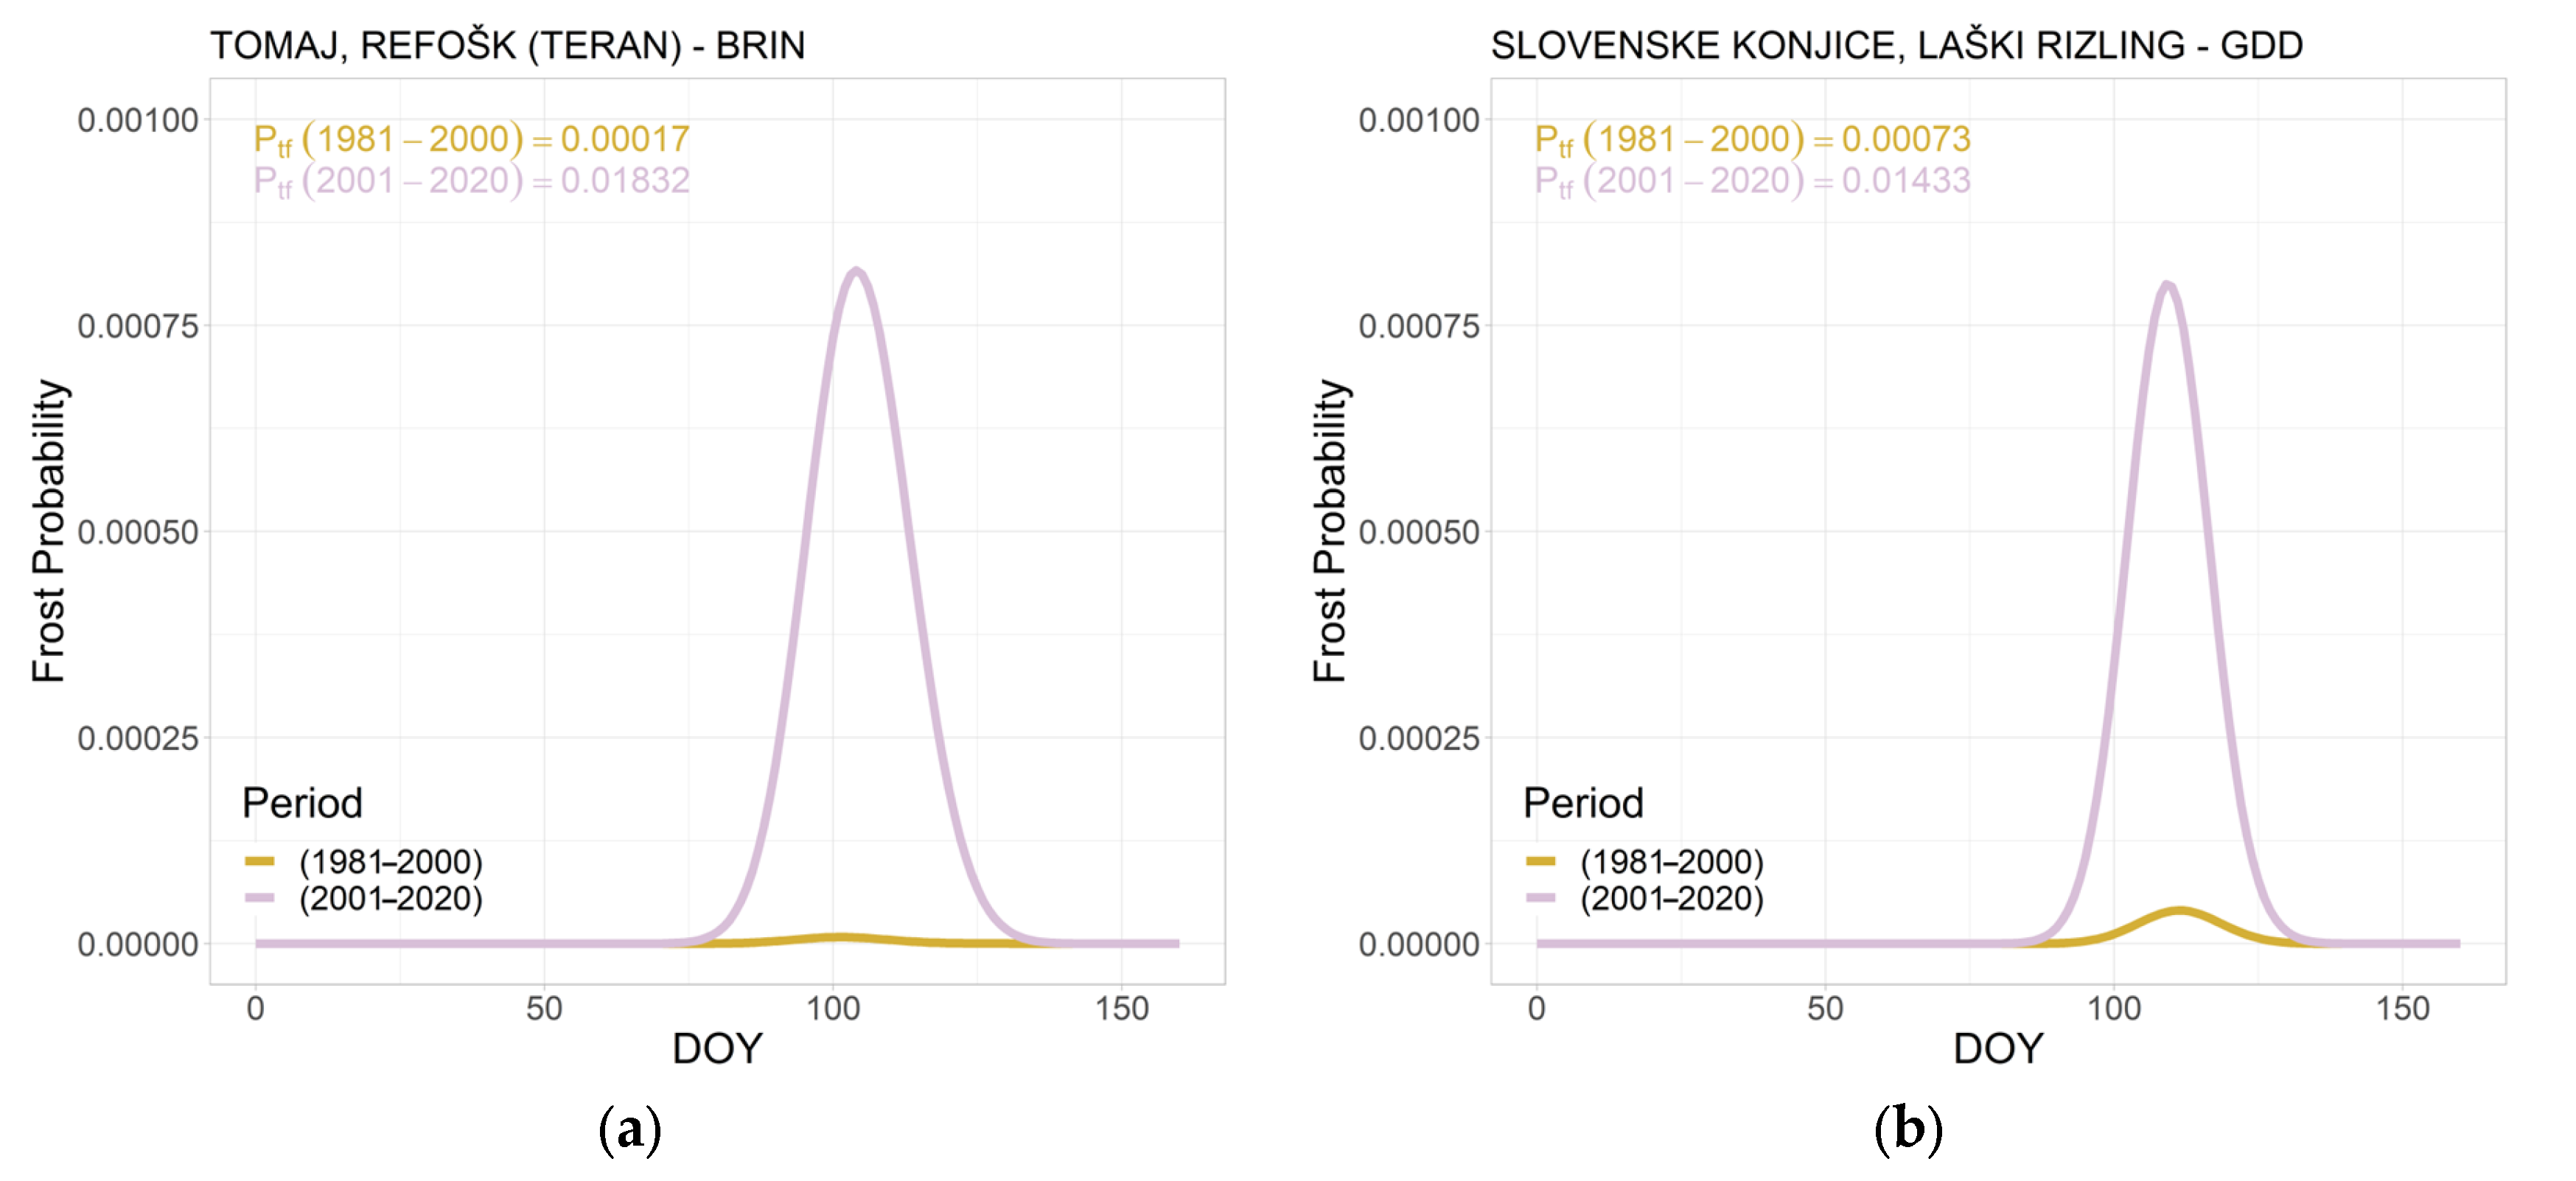
To evaluate the change in the probability of frost occurrence, we analyzed two different periods featuring the mean climate, represented by the 20-year periods 1981–2000 and 2001–2020. In Figure 5, examples of a calculated probability of frost occurrence for the chosen periods and representative phenological models are shown. For some of the locations with the sub-Mediterranean climate type, we note an increase in frost risk of up to 1980 times in the period 2001–2020 compared to the reference period (Malvasia at Portorož, Merlot at Bilje and Slap, Refošk–Teran at Tomaj (Figure 5a)), whereas for other locations, the frost risk in 2001–2020 was unchanged (Malvasia and Refošk–Teran at Rižana). For the locations in the wine-making region with the subcontinental climate type, the risk of spring frost in 2001–2020 is 2–20 times higher than in 1981–2000, as shown for the example of Laški Rizling (Figure 5b).
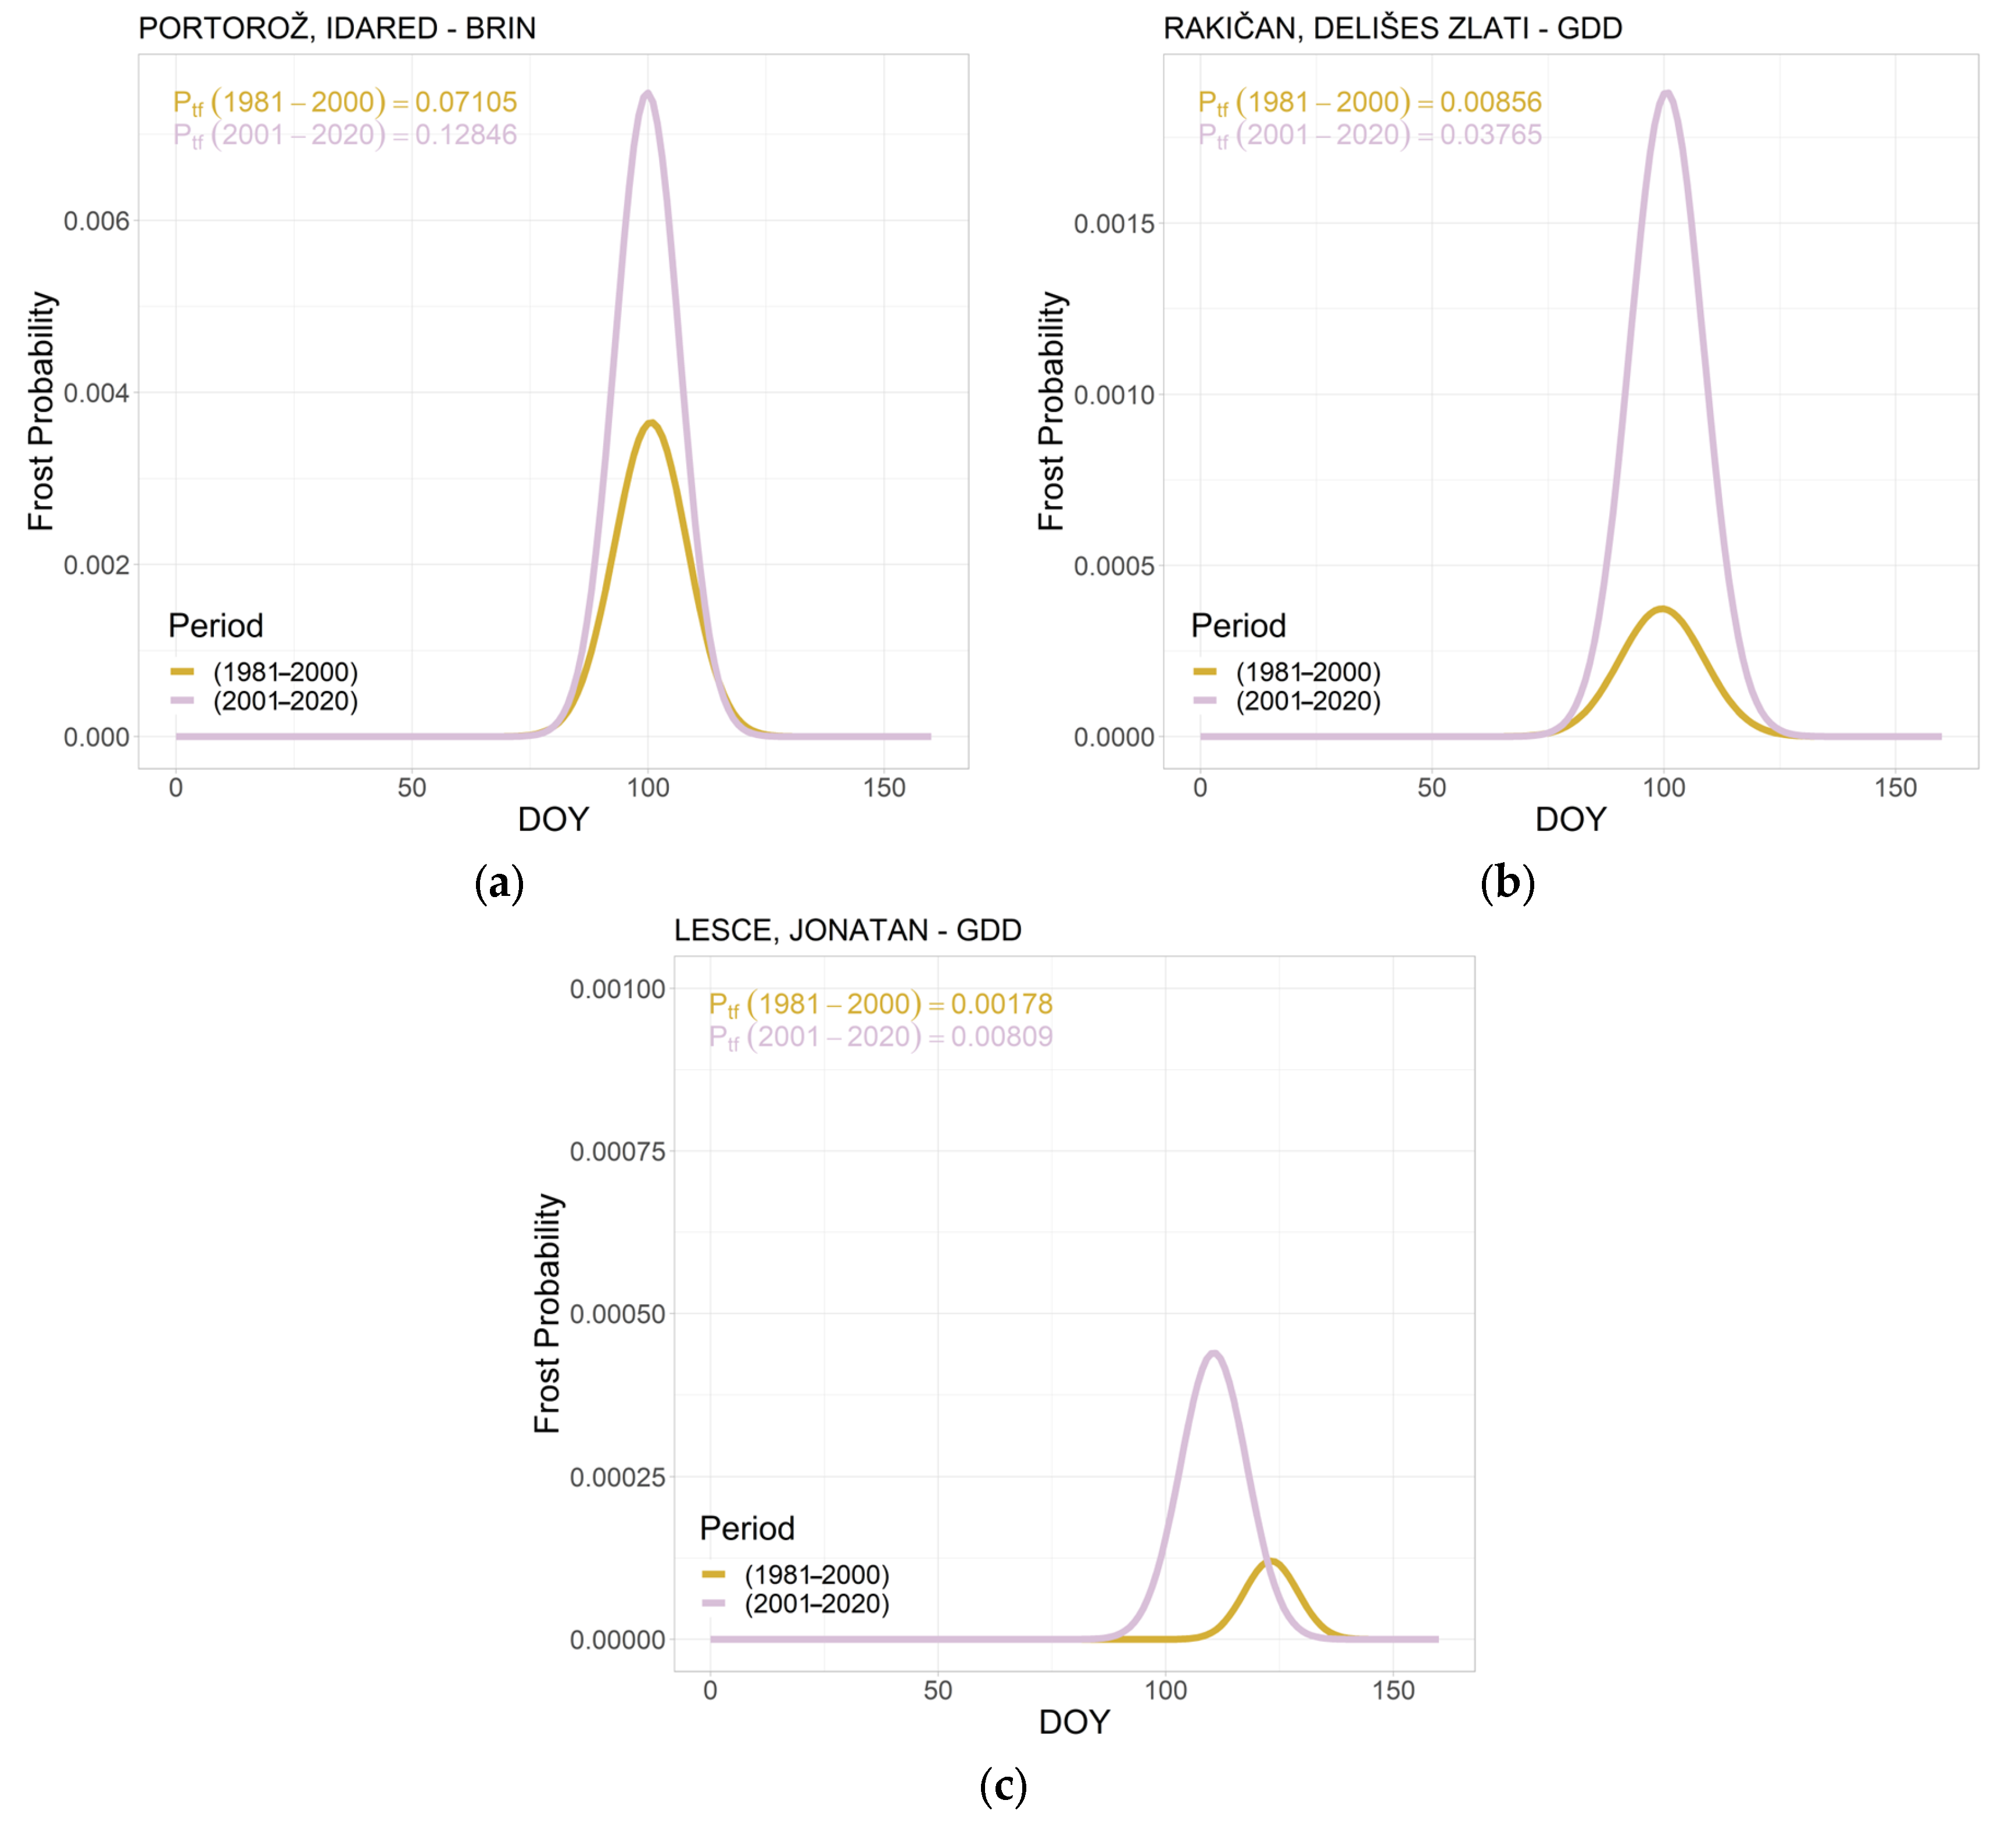
Beyond the exception of the varieties grown in the hilly region with moderate climate (Bobovec variety at location Šmartno pri Slovenj Gradcu and Jonathan variety at location Lesce) (Figure 6c), the calculated risk of spring frost for apple appears to be moderately increased in 2001–2020 compared to 1981–2000 (Figure 6a,b), with a factor of increase from around 2 to 12 compared to the reference period. Moreover, results among locations slightly vary. The highest increase in frost risk was noted for the Jonathan variety at locations Novo mesto, Rakičan, and Vrhnika, Bobovec variety at Dobliče, and Elstar variety at location Maribor, with all of the locations having subcontinental climate (Figure 6b). For the one location (Portorož) with sub-Mediterranean climate, where the Idared apple variety is grown, the increase in frost risk was shown to be around 2 times higher in 2001–2020 than in 1981–2000 (Figure 6a).
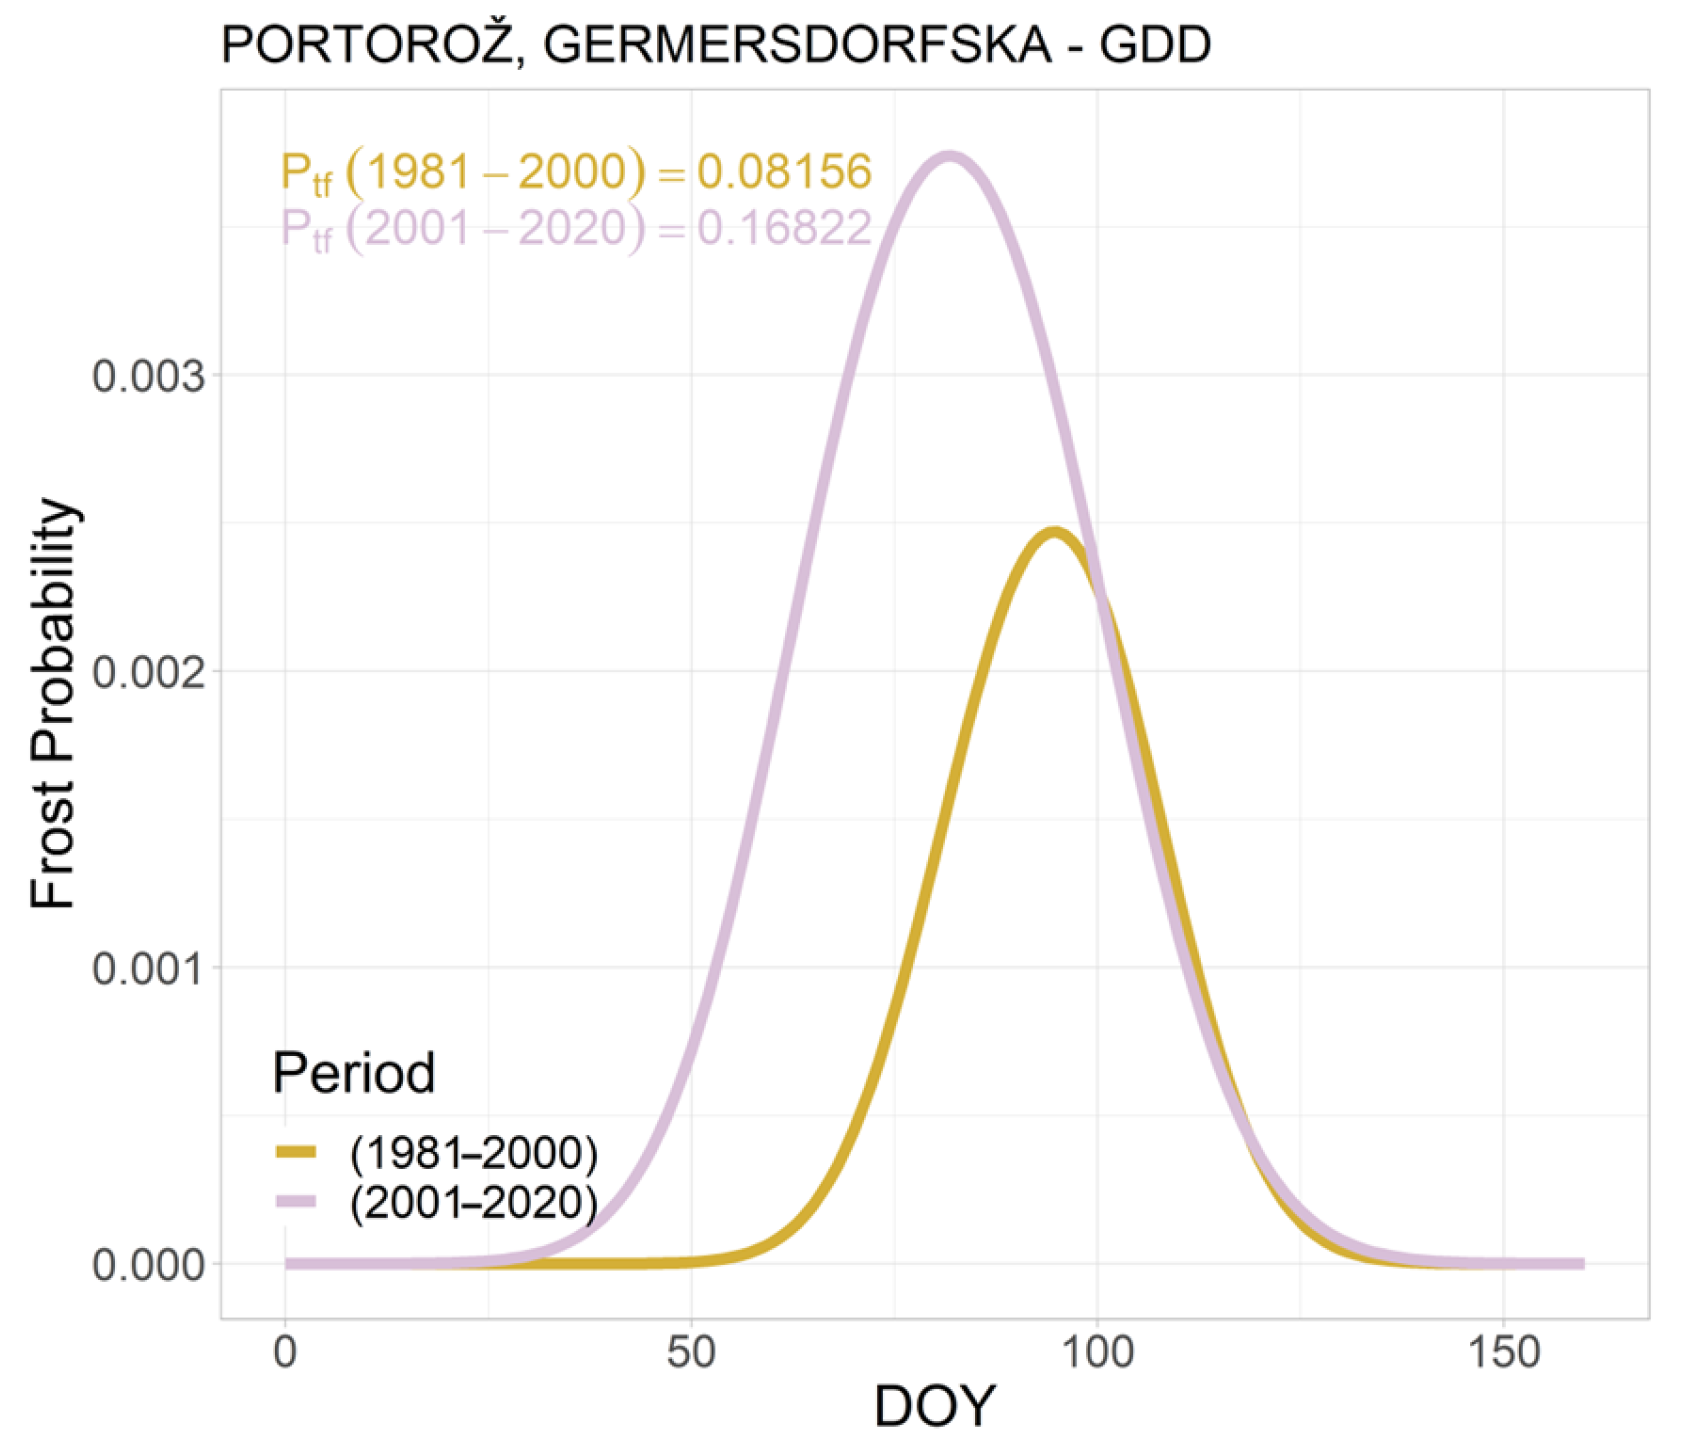
Similarly, as already illustrated for grapevine and apple, the calculated probability of spring frost in sweet cherry varieties is shown to be up to 180 times higher in 2001–2020 compared to the reference period 1981–2000, as shown in Figure 7 for the example of the Germersdorf variety at location Portorož. The Germersdorf variety is monitored at locations Bilje, Portorož, and Rižana. The chosen example represents the results of calculations based on the longest available sweet cherry variety dataset (Figure 7). In Portorož, frost risk appears to be approximately five times higher in the period 2001–2020 than in 1981–2000.
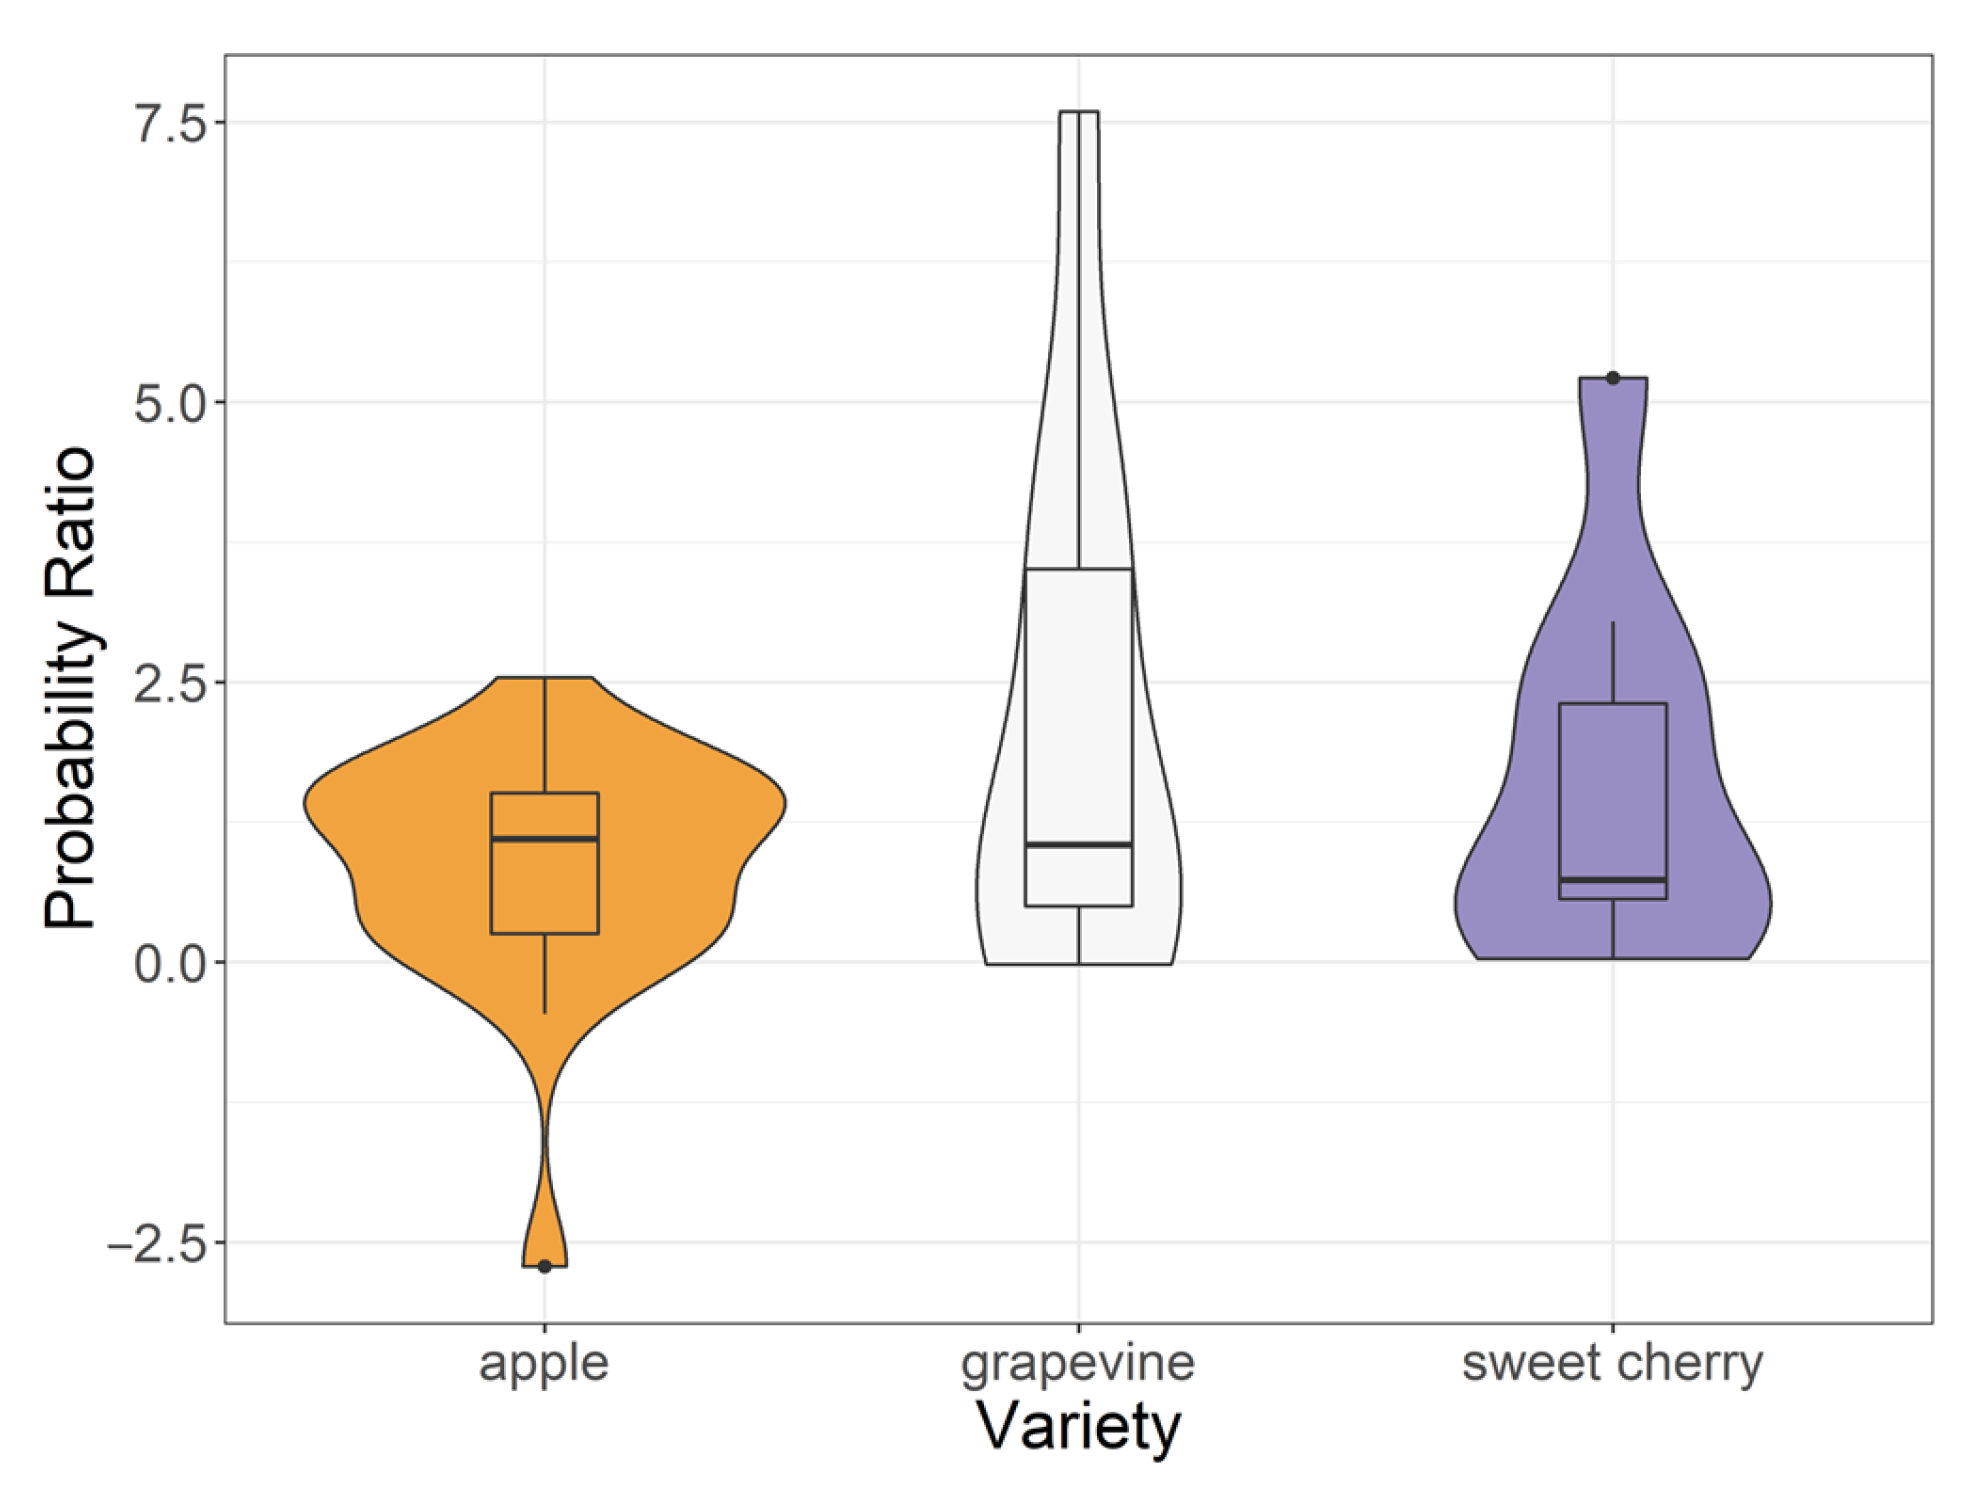
A broader insight into the results of all analyzed locations for representative grapevine, apple, and sweet cherry varieties is presented in Figure 8. The outliers represent locations Šmartno pri Slovenj Gradcu (Bobovec apple variety), with the ratio of probabilities equal to 0.06; Bilje for the Merlot grapevine variety, with an increase in the probability equal to 1980 times greater risk in 2001–2020; and Bilje for the Germersdorf sweet cherry variety, with the ratio of probabilities equal to 180.

4. Discussion

In the first part of the study, we applied two of the commonly used phenological models, the growing degree days model (GDD) and an advanced BRIN model, which takes into account the dormancy period, to simulate budburst (grapevine) and flowering (apple and sweet cherry). Contrary to the results presented in [17] and our initial expectations, GDD reproduced better results for the budburst of the majority of the analyzed grapevine varieties, as was the case for the majority of apple and sweet cherry varieties. Nevertheless, for some varieties (e.g., Idared and Bobovec apple varieties, Refošk–Teran grapevine variety), BRIN provided a better prediction of budburst (flowering dates), which reveals the necessity of using several phenological models of various complexities in such studies, as was also noted by several authors [42,43].
Existing assessments for Slovenia show that an advance in blossom of 4 to 10 days can be expected under a 1 °C rise in April and May temperature, which can pose a high threat for losses in yield due to frost damage [1]. However, no specific study has been made assessing the risk of spring frost from the perspectives of climatological data and phenological observations, providing an assessment of frost risk for specific fruit tree varieties. Concerning spring frost risk for grapevines, the leading research is carried out in France and Switzerland [3,5,17,18,44]. Other authors that researched the effect of climate change on grapevine phenological stages [19] estimated that the flowering dates of the Pinot noir variety in Burgundy could in 2031–2040 advance by 8 to 12 days in reference to the period 1970–1979, which agrees with our calculations of the downward trend for the majority of grapevine varieties. Our results of a downward trend in flowering of several apple varieties similarly coincide with another study [7] that assessed spring frost risk in a changing climate in Italy and calculated a slightly decreasing trend for the decades 1991–2056, while a scenario of increased risk seemed unlikely.
As previous attempts of frost risk assessment for Slovenia showed no projected change in frost risk for the main Slovenian fruit-growing regions [31], whereas the observations proved contradictory outcomes, the second part of our study included frost risk assessment. The assessment was based on the phenological model that showed better agreement with the phenological observations. In general, we observed increased frost risk for virtually all fruit tree varieties. Among the least susceptible were shown to be the Jonatan and Bobovec apple varieties grown in locations with a moderate climate. In these cases, the modeled results showed that the risk of spring frost in 2001–2020 is unaltered or slightly lower than for the reference period. Based on our analysis results, the most prone to frost among grapevine varieties were Merlot at both analyzed locations (Bilje and Slap), Malvasia at location Portorož, and Refošk–Teran at location Tomaj. In the latter case, we found an increased risk of up to 600 times higher probability for a spring frost in the period of 2001–2020 compared to the reference period. On the other hand, the risk of spring frost in apple did not increase as significantly. Specifically, for apple varieties, the risk of spring frost was shown to be from 2 to 12 times higher in the analyzed 20-year period compared to the reference period. In the case of the analyzed sweet cherry varieties, the risk was shown to be up to 180 times higher in 2001–2020 compared to 1981–2000. In comparison, for fruit trees in Switzerland, authors also confirm [5] that the change in risk varies regionally, arguing that it has only increased at higher elevations. To produce a direct comparison with the varieties of Slovenia would be difficult as Slovenian vineyards and fruit-growing regions are typically in locations at slightly lower elevations than in Switzerland. On the other hand, the results presented could be extended to neighboring regions with temperate climates and similar growing conditions, such as regions in Austria, northern Italy, and Croatia. For example, studies of frost risk are being carried out for the wine-growing region of Istria in Croatia, where the Refošk–Teran, Malvazija, Merlot, Chardonnay, and other grape varieties are grown [45], and a comparison of the frost risk calculated using the methodology of this study and other methods would be of great importance. The model used in this study could also be calibrated for specific grapevine or fruit tree varieties in other climates.

5. Conclusions

The results of the statistical assessment of frost risk were shown for the representative grapevine, apple, and sweet cherry varieties over regions of Slovenia with sub-Mediterranean and subcontinental climates, and moderate climates of the hilly region. We calculated a significant increase in frost risk for the majority of grapevine and virtually all sweet cherry tree varieties for the period 2001–2020 in comparison to 1981–2000. The results for apple showed a moderate increase for the locations in the sub-Mediterranean and subcontinental climate regions, whereas no change or a slight decrease was evident in the moderate climate of the hilly region.
Apart from the location of Rižana, climate-wise, the locations with the biggest frost risk in Slovenia were shown to be the locations in regions with sub-Mediterranean climate, although we found increased frost risk in the locations with subcontinental climate as well. The least impacted proved to be the locations Šmartno pri Slovenj Gradcu (in the hilly region with moderate climate) and Podlehnik (in the region with subcontinental climate). The calculated input parameters of the phenological models GDD and BRIN, presented in the first part of the analysis, will enable numerous comprehensive studies of budburst or flowering for a wide range of grapevine, apple, and sweet cherry varieties. Nonetheless, a general improvement of the model parameter results is expected provided that the datasets of phenological observations lengthen, most notable being the datasets of the following varieties with less than three decades of phenological observations: Chardonnay (grapevine), Jonagold (apple), Elstar (apple), and two sweet cherry varieties—Van and Early Bigi.
In addition, the calculated increase in spring frost risk demonstrates the response of fruit trees to climate change and can serve as a monitoring method for further research of the effects of spring temperatures on frost events. In view of the results of this study, calculation of frost projections for the analyzed grapevine and fruit tree varieties is needed for Slovenia for the 21st century. Furthermore, an extension of this study to other Slovenian fruit tree varieties would be of great importance to the agricultural advisory services, one of whose tasks is to inform farmers about economically efficient planting regimes to avoid losses due to frost damage.

Author Contributions

Conceptualization, Z.Ž. and T.P.; methodology, Z.Ž.; software, Z.Ž.; validation, Z.Ž.; formal analysis, Z.Ž.; resources, G.G.; data curation, G.G.; writing—original draft preparation, Z.Ž.; writing—review and editing, T.P., G.G. and A.S.; visualization, Z.Ž.; supervision, T.P. and A.S.; project administration, T.P.; funding acquisition, T.P. and A.S. All authors have read and agreed to the published version of the manuscript.

Funding

This project received funding from the Ministry of Environment and Spatial Planning Climate Change Funding Programme, from the Slovenian Research Agency program under grant agreement P4-0085, and from the Slovenian Research Agency young researcher grant to Z.Ž.

Institutional Review Board Statement

Not applicable.

Informed Consent Statement

Not applicable.

Data Availability Statement

The datasets used and analyzed in this study are available in the article/from the corresponding author on request.

Acknowledgments

The authors are grateful to the Slovenian Environment Agency for providing the observational data.

Conflicts of Interest

The authors declare no conflict of interest.

Appendix A

Table A1. Mean and standard deviation of observed historical flowering dates for the available sample sizes of several apple varieties, and the performance of GDD and BRIN models in modeling flowering dates. The assessment was made by calculating the root mean square error of prediction (RMSEP) and index of agreement (d) for the modeled and observed flowering dates. In both models, the base temperature is Tb = 3 °C.
VarietyLocation
(Climate Type)
Sample SizeMean FL
(DOY ± SD)
GDD3
RMSEP
BRIN
RMSEP
JonathanBizeljsko (SC)27108 ± 67.799.77
Bukovžlak (SC)39112 ± 8
Kadrenci pri C. (SC)39108 ± 10
Lesce (MCHR)30122 ± 7
Mokronog (SC)32117 ± 7
Novo mesto (SC)35108 ± 9
Maribor (SC)11112 ± 10
Sl. konjice (SC)17113 ± 10
Rakičan (SC)15114 ± 9
Šalovci (SC)38114 ± 8
Vrhnika (SC)39115 ± 8
Zibika (SC)39109 ± 9
JonagoldBizeljsko (SC)796 ± 73.5515.25
BobovecBrod (SC)39108 ± 1716.4811.08
Dobliče (SC)34112 ± 8
Podlehnik (SC)20112 ± 9
Šmartno pri S.G. (MCHR)35118 ± 8
Golden DeliciousBukovci (SC)13110 ± 77.6110.02
Rakičan (SC)20105 ± 9
ElstarBukovci (SC)13106 ± 55.638.17
Maribor (SC)13111 ± 5
IdaredMaribor (SC)14102 ± 612.869.26
Portorož (SM)2098 ± 7
Table A2. Mean and standard deviation of observed historical flowering dates for the available sample sizes of several sweet cherry varieties, and the performance of GDD and BRIN models in modeling flowering dates. The assessment was made by calculating the root mean square error of prediction (RMSEP) and index of agreement (d) for the modeled and observed flowering dates. In both models, the base temperature is Tb = 4.5 °C.
VarietyLocation
(Climate Type)
Sample SizeMean FL
(DOY ± SD)
GDD4.5
RMSEP
BRIN
RMSEP
GermersdorfBilje (SM)2594 ± 811.4312.28
Portorož (SM)2787 ± 9
Rižana (SM)1994 ± 6
Early Bigi
Unknown
Tomaj (SM)17101 ± 67.708.14
Portorož (SM)7100 ± 3
VanTomaj (SM)15104 ± 1012.5910.61
Rižana (SM)12100 ± 7
Slap (SM)1893 ± 7
GermersdorfBilje (SM)2594 ± 87.9611.11
Table A3. Values of calculated parameter sets for several apple varieties and the two chosen phenological models used in this analysis: GDD and BRIN (both with Tb = 3 °C).
VarietySample SizeGDD3BRIN
FcritZDflCcritFcritZDfl
Jonathan361313.97113171.26343.56113
Jonagold7300.8897180.45325.7998
Bobovec128327.80113184.91348.00114
Golden Delicious33301.88107184.37331.06108
Elstar26330.01110175.37357.01110
Idared34369.38100184.96308.30100
Table A4. Values of calculated parameter sets for several sweet cherry varieties and the two chosen phenological models used in this analysis: GDD and BRIN (both with Tb = 4.5 °C).
VarietySample SizeGDD4.5BRIN
FcritZDflCcritFcritZDfl
Germersdorf61226.8292120.27262.3593
Early Bigi17204.26102140.25250.18101
Unknown34223.71104165.08214.55102
Van18198.1095186.22182.3094

References

  1. Soršak, A.; Kobal, M.Z.G.; Kodrič, I.; Koron, D.D. Tehnološka Navodila za Zaščito pred Spomladansko Pozebo v Sadjarstvu. 2018. Available online: https://www.kgzs.si/kgzs/kmetijsko-svetovanje/e-knjiznica/e-knjiznica-zapis/tehnoloska-navodila-za-zascito-pred-spomladansko-pozebo-v-sadjarstvu (accessed on 23 March 2022).
  2. IPCC. 2021: Summary for Policymakers. In Climate Change 2021: The Physical Science Basis. Contribution of Working Group I to the Sixth Assessment Report of the Intergovernmental Panel on Climate Change; Cambridge University Press: Cambridge, UK; New York, NY, USA, 2021. [Google Scholar]
  3. Sgubin, G.; Swingedouw, D.; Dayon, G.; García de Cortázar-Atauri, I.; Ollat, N.; Pagé, C.; van Leeuwen, C. The Risk of Tardive Frost Damage in French Vineyards in a Changing Climate. Agric. For. Meteorol. 2018, 250–251, 226–242. [Google Scholar] [CrossRef]
  4. Chmielewski, F.-M.; Götz, K.-P.; Weber, K.C.; Moryson, S. Climate Change and Spring Frost Damages for Sweet Cherries in Germany. Int. J. Biometeorol. 2018, 62, 217–228. [Google Scholar] [CrossRef]
  5. Eccel, E.; Rea, R.; Caffarra, A.; Crisci, A. Risk of Spring Frost to Apple Production under Future Climate Scenarios: The Role of Phenological Acclimation. Int. J. Biometeorol. 2009, 53, 273–286. [Google Scholar] [CrossRef]
  6. Drepper, B.; Gobin, A.; Van Orshoven, J. Spatio-Temporal Assessment of Frost Risks during the Flowering of Pear Trees in Belgium for 1971–2068. Agric. For. Meteorol. 2022, 315, 108822. [Google Scholar] [CrossRef]
  7. Lhotka, O.; Brönnimann, S. Possible Increase of Vegetation Exposure to Spring Frost under Climate Change in Switzerland. Atmosphere 2020, 11, 391. [Google Scholar] [CrossRef] [Green Version]
  8. Masaki, Y. Future Risk of Frost on Apple Trees in Japan. Clim. Change 2020, 159, 407–422. [Google Scholar] [CrossRef]
  9. Meier, M.; Fuhrer, J.; Holzkämper, A. Changing Risk of Spring Frost Damage in Grapevines Due to Climate Change? A Case Study in the Swiss Rhone Valley. Int. J. Biometeorol. 2018, 62, 991–1002. [Google Scholar] [CrossRef] [Green Version]
  10. Pfleiderer, P.; Menke, I.; Schleussner, C.-F. Increasing Risks of Apple Tree Frost Damage under Climate Change. Clim. Change 2019, 157, 515–525. [Google Scholar] [CrossRef] [Green Version]
  11. Vanalli, C.; Casagrandi, R.; Gatto, M.; Bevacqua, D. Shifts in the Thermal Niche of Fruit Trees under Climate Change: The Case of Peach Cultivation in France. Agric. For. Meteorol. 2021, 300, 108327. [Google Scholar] [CrossRef]
  12. Vitasse, Y.; Schneider, L.; Rixen, C.; Christen, D.; Rebetez, M. Increase in the Risk of Exposure of Forest and Fruit Trees to Spring Frosts at Higher Elevations in Switzerland over the Last Four Decades. Agric. For. Meteorol. 2018, 248, 60–69. [Google Scholar] [CrossRef]
  13. Faust, M.; Erez, A.; Rowland, L.J.; Wang, S.Y.; Norman, H.A. Bud Dormancy in Perennial Fruit Trees: Physiological Basis for Dormancy Induction, Maintenance, and Release. HortScience 1997, 32, 623–629. [Google Scholar] [CrossRef] [Green Version]
  14. Bielenberg, D.G.; Gasic, K. Peach [Prunus Persica (L.) Batsch] Cultivars Differ in Apparent Base Temperature and Growing Degree Hour Requirement for Floral Budburst. Front. Plant Sci. 2022, 13, 76. [Google Scholar] [CrossRef]
  15. Chuine, I. A Unified Model for Budburst of Trees. J. Theor. Biol. 2000, 207, 337–347. [Google Scholar] [CrossRef] [PubMed]
  16. Chuine, I.; Kramer, K.; Hänninen, H. Plant Development Models. In Phenology: An Integrative Environmental Science; Schwartz, M.D., Ed.; Tasks for Vegetation Science; Springer: Dordrecht, The Netherlands, 2003; pp. 217–235. ISBN 978-94-007-0632-3. [Google Scholar]
  17. García de Cortázar-Atauri, I.; Brisson, N.; Gaudillere, J.P. Performance of Several Models for Predicting Budburst Date of Grapevine (Vitis vinifera L.). Int. J. Biometeorol. 2009, 53, 317–326. [Google Scholar] [CrossRef] [PubMed]
  18. García de Cortázar-Atauri, I.; Brisson, N.; Seguin, B.; Gaudillere, J.P.; Baculat, B. Simulation of Budbreak Date for Vine. The BRIN Model. Some Applications in Climate Change Study. In Proceedings of the XIV International GESCO Viticulture Congress, Geisenheim, Germany, 23–27 August 2005; pp. 485–490. [Google Scholar]
  19. Xu, Y.; Castel, T.; Richard, Y.; Cuccia, C.; Bois, B. Burgundy Regional Climate Change and Its Potential Impact on Grapevines. Clim. Dyn. 2012, 39, 1613–1626. [Google Scholar] [CrossRef]
  20. Putti, G.L.; Petri, J.L.; Mendez, M.H.; Leite, G.B. Necessidades térmicas para indução da brotação de diferentes cultivares de macieira. Agropecuária Catarin. 2006, 19, 71–74. [Google Scholar]
  21. Marra, F.; Inglese, P.; Dejong, T.; Johnson, R.S. Thermal Time Requirement and Harvest Time Forecast for Peach Cultivars with Different Fruit Development Periods. Acta Hortic. 2002, 592, 523–529. [Google Scholar] [CrossRef] [Green Version]
  22. Richardson, E.A.; Seeley, S.D.; Walker, D.R. A Model for Estimating the Completation of Rest for Redhaven and Elberta Peach Trees. Hortic. Sci. 1974, 9, 331–332. [Google Scholar]
  23. Richardson, E.; Seeley, S.; Walker, D.; Anderson, J.; Ashcroft, G.L. Pheno-Climatography of Spring Peach Bud Development. Hortic. Sci. 1975, 10, 236–237. [Google Scholar]
  24. Proebsting, E.L.J.; Mills, H.H. Low Temperature Resistance of Developing Flower Buds of Six Deciduous Fruit Species. J. Am. Soc. Hortic. Sci. 1978, 103, 192–198. [Google Scholar] [CrossRef]
  25. Trought, M.; Howell, G.; Cherry, N. Practical Considerations for Reducing Frost Damage in Vineyards; Lincoln University: Chester County, PA, USA, 1999. [Google Scholar]
  26. Caffarra, A.; Eccel, E. Increasing the Robustness of Phenological Models for Vitis vinifera Cv. Chardonnay. Int. J. Biometeorol. 2010, 54, 255–267. [Google Scholar] [CrossRef]
  27. Stella, T.; Webber, H.; Olesen, J.E.; Ruane, A.C.; Fronzek, S.; Bregaglio, S.; Mamidanna, S.; Bindi, M.; Collins, B.; Faye, B.; et al. Methodology to Assess the Changing Risk of Yield Failure Due to Heat and Drought Stress under Climate Change. Environ. Res. Lett. 2021, 16, 104033. [Google Scholar] [CrossRef]
  28. Vitra, A.; Lenz, A.; Vitasse, Y. Frost Hardening and Dehardening Potential in Temperate Trees from Winter to Budburst. New Phytol. 2017, 216, 113–123. [Google Scholar] [CrossRef] [PubMed] [Green Version]
  29. Diniz, É.S.; Lorenzon, A.S.; de Castro, N.L.M.; Marcatti, G.E.; dos Santos, O.P.; de Deus Júnior, J.C.; Cavalcante, R.B.L.; Fernandes-Filho, E.I.; Hummeldo Amaral, C. Forecasting Frost Risk in Forest Plantations by the Combination of Spatial Data and Machine Learning Algorithms. Agric. For. Meteorol. 2021, 306, 108450. [Google Scholar] [CrossRef]
  30. Rigby, J.R.; Porporato, A. Spring Frost Risk in a Changing Climate. Geophys. Res. Lett. 2008, 35, 12703. [Google Scholar] [CrossRef]
  31. Bertalanič, R.; Dolinar, M. Ocena podnebnih sprememb v Sloveniji do konca 21. stoletja: Sintezno poročilo; Ministrstvo za Okolje in Prostor, Agencija Republike Slovenije za Okolje: Ljubljana, Slovenia, 2018; ISBN 978-961-6024-80-8. [Google Scholar]
  32. Kozjek, K.; Dolinar, M.; Skok, G. Objective Climate Classification of Slovenia. Int. J. Climatol. 2017, 37, 848–860. [Google Scholar] [CrossRef]
  33. Cornes, R.C.; van der Schrier, G.; van den Besselaar, E.J.M.; Jones, P.D. An Ensemble Version of the E-OBS Temperature and Precipitation Data Sets. J. Geophys. Res. Atmos. 2018, 123, 9391–9409. [Google Scholar] [CrossRef] [Green Version]
  34. Huld, T.; Pinedo Pascua, I. Spatial Downscaling of 2-Meter Air Temperature Using Operational Forecast Data. Energies 2015, 8, 2381–2411. [Google Scholar] [CrossRef] [Green Version]
  35. Moncur, M.W.; Rattigan, K.; Mackenzie, D.H.; Intyre, G.N.M. Base Temperatures for Budbreak and Leaf Appearance of Grapevines. Am. J. Enol. Vitic. 1989, 40, 21–26. [Google Scholar] [CrossRef]
  36. Bidabe, B. Contrôle de l’époque de floraison du pommier par une nouvelle conception de l’action de températures. C. R. Acad. Agric. Fr. 1965, 49, 934–945. [Google Scholar]
  37. Liennard , M. Contribution à L’étude de la Prévision de la Précocité de Floraison et du Déterminisme Climatique des Nécroses Florales de l’Abricotier, Prunus armeniaca L., dans le Contexte des Changements Climatiques; Institut National d’Horticulture: Angers, France, 2002. [Google Scholar]
  38. Pouget, R. Le Débourrement Des Bourgeons de La Vigne: Méthode de Prévision et Principes d’établissement d’une Échelle de Précocité de Débourrement. OENO One 1988, 22, 105–123. [Google Scholar] [CrossRef]
  39. Luedeling, E.; Schiffers, K.; Fohrmann, T.; Urbach, C. PhenoFlex—An Integrated Model to Predict Spring Phenology in Temperate Fruit Trees. Agric. For. Meteorol. 2021, 307, 108491. [Google Scholar] [CrossRef]
  40. Wallach, D.; Makowski, D.; Jones, J.W.; Brun, F. Chapter 7—Calibration of System Models. In Working with Dynamic Crop Models, 3rd ed.; Wallach, D., Makowski, D., Jones, J.W., Brun, F., Eds.; Academic Press: Cambridge, MA, USA, 2019; pp. 251–274. ISBN 978-0-12-811756-9. [Google Scholar]
  41. Willmott, C.J. On the Validation of Models. Phys. Geogr. 1981, 2, 184–194. [Google Scholar] [CrossRef]
  42. Parker, A.K.; De Cortázar-Atauri, I.G.; Van Leeuwen, C.; Chuine, I. General Phenological Model to Characterise the Timing of Flowering and Veraison of Vitis vinifera L. Aust. J. Grape Wine Res. 2011, 17, 206–216. [Google Scholar] [CrossRef]
  43. Chuine, I.; Bonhomme, M.; Legave, J.-M.; García de Cortázar-Atauri, I.; Charrier, G.; Lacointe, A.; Améglio, T. Can Phenological Models Predict Tree Phenology Accurately in the Future? The Unrevealed Hurdle of Endodormancy Break. Glob. Change Biol. 2016, 22, 3444–3460. [Google Scholar] [CrossRef]
  44. Duchêne, E.; Huard, F.; Dumas, V.; Schneider, C.; Merdinoglu, D. The challenge of adapting grapevine varieties to climate change. Clim. Res. 2010, 41, 193–204. [Google Scholar] [CrossRef] [Green Version]
  45. Omazić, B.; Blašković, L.; Prtenjak, M.T.; Bubola, M.; Karoglan, M.; Anić, M. Future Change in Viticulture Phenological Stages and Early Frost Risk in Istria Region, Croatia. In Proceedings of the EMS Annual Meeting 2022, Bonn, Germany, 5–9 September 2022. [Google Scholar] [CrossRef]
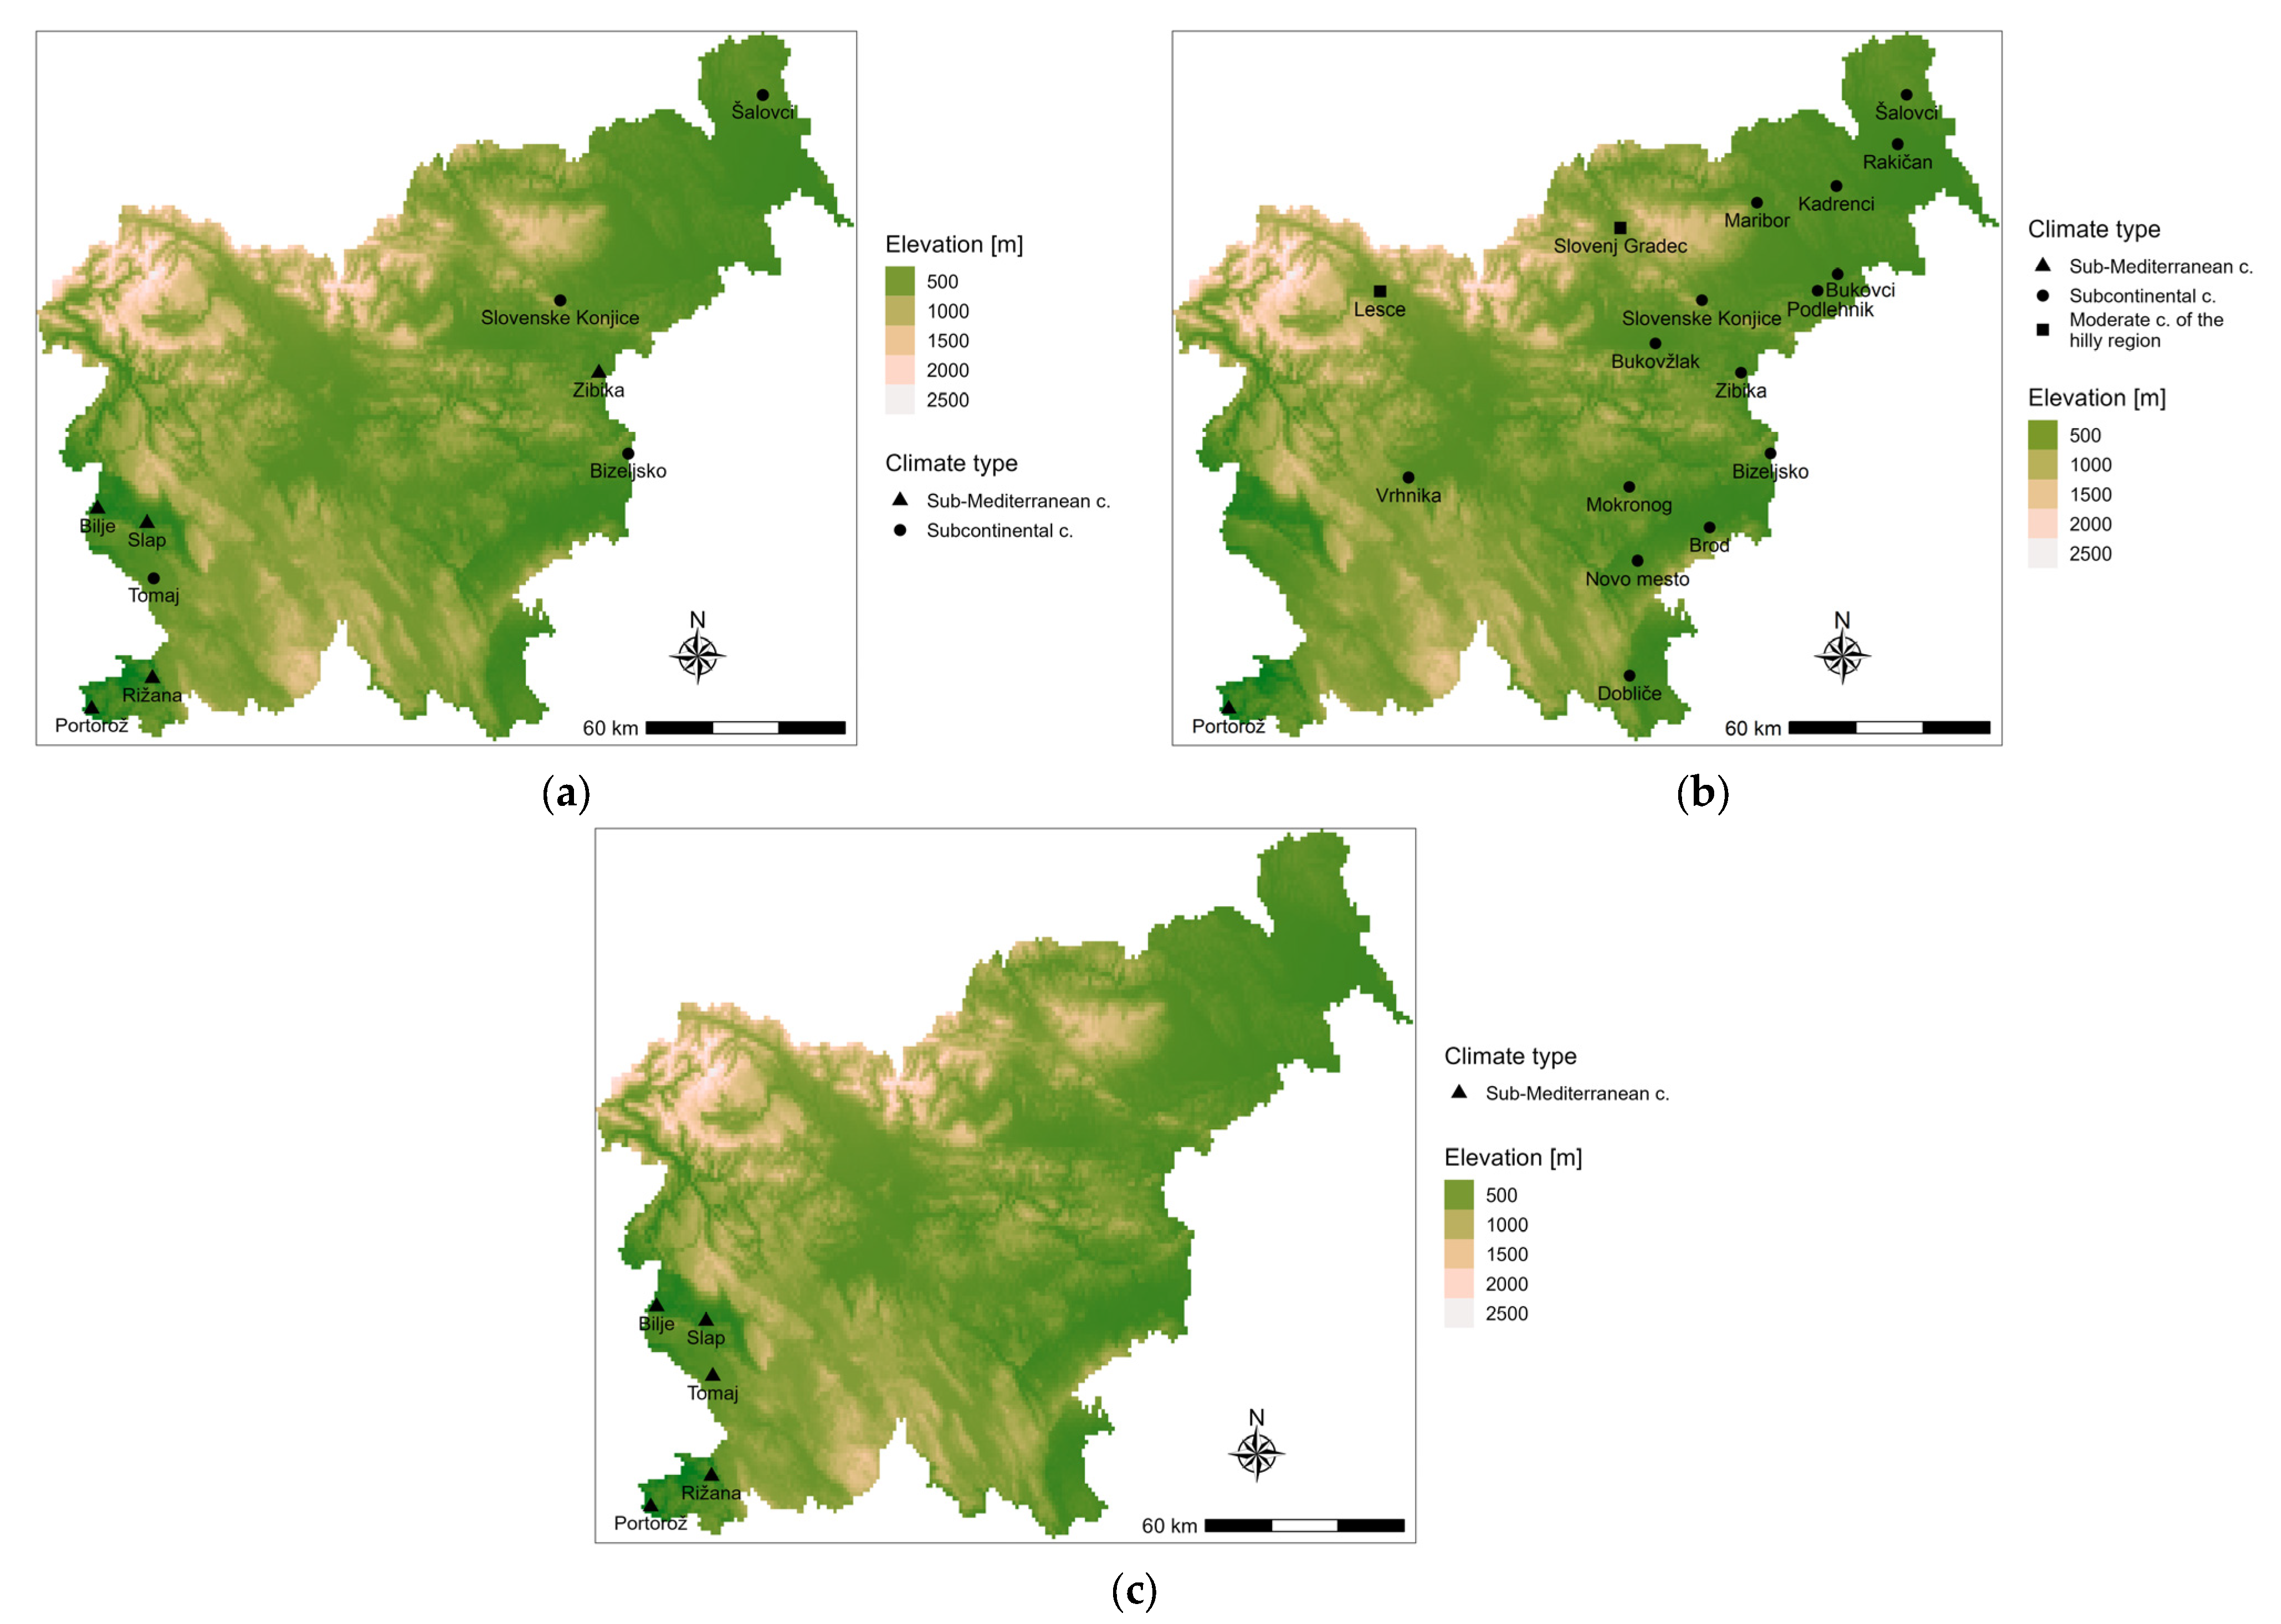
Figure 1. A topographic map of Slovenia (altitude in meters) and the locations of phenological stations where historical observations of the budburst day were available for our analysis. The stations are indicated by points for (a) grapevine, (b) apple, and (c) sweet cherry.
Atmosphere 14 00683 g001
Figure 2. Modeled and observed budburst dates of two grapevine varieties: (a) Refošk–Teran variety at location Tomaj (sub-Mediterranean climate); and (b) Laški Rizling variety at location Slovenske Konjice (subcontinental climate). Yellow lines indicate results obtained with GDD, green lines indicate results obtained with BRIN, and black dots indicate the observed budburst date according to the Slovenian Environment Agency dataset. Added is the statistical significance (p) of the trend in observed budburst dates, calculated with the Mann–Kendall test, and day of year is denoted as DOY.
Atmosphere 14 00683 g002
Figure 3. Modeled and observed budburst dates of three apple varieties: (a) Idared at location Portorož (sub-Mediterranean climate); (b) Golden Delicious variety at location Rakičan (subcontinental climate); and (c) Jonathan variety at location Lesce (moderate climate of the hilly region). Yellow lines indicate results obtained with GDD, green lines indicate results obtained with the model, and black dots indicate the observed budburst date according to the Slovenian Environment Agency dataset. Added is the statistical significance (p) of the trend in observed budburst dates, calculated with the Mann–Kendall test, and day of year is denoted as DOY.
Atmosphere 14 00683 g003
Figure 4. Modeled and observed budburst dates of the Germersdorf sweet cherry variety in Portorož, with the sub-Mediterranean climate type. Yellow lines indicate results obtained with GDD, green lines indicate results obtained with BRIN, and black dots indicate the observed budburst date according to the Slovenian Environment Agency dataset. Added is the statistical significance (p) of the trend in observed budburst dates, calculated with the Mann–Kendall test, and day of year is denoted as DOY.
Atmosphere 14 00683 g004
Figure 5. Two examples of modeled results of the probability of spring frost for the analyzed wine-making regions of Slovenia by their climate type: (a) sub-Mediterranean climate and the Refošk–Teran variety (Tomaj); and (b) subcontinental climate and the Laški Rizling variety (Slovenske Konjice). GDD5 model results are presented for both varieties.
Atmosphere 14 00683 g005
Figure 6. Three examples of modeled results of the probability of spring frost for the analyzed apple-growing regions of Slovenia by their climate type: (a) sub-Mediterranean climate and the Idared variety (Portorož); (b) subcontinental climate and the Golden Delicious variety (Rakičan); and (c) moderate climate of the hilly region and the Jonathan variety (Lesce).
Atmosphere 14 00683 g006
Figure 7. An example of modeled GDD results for the probability of spring frost in the analyzed cherry-growing region of Slovenia with sub-Mediterranean climate and the Germersdorf variety.
Atmosphere 14 00683 g007
Figure 8. Violin plot of the modeled probability of spring frost ratio between Ptf(2001–2020) and Ptf(1981–2000) for the analyzed grapevine, apple, and sweet cherry varieties, in logarithmic scale. Additionally presented is the boxplot of the ratio values.
Atmosphere 14 00683 g008
Table 1. Summary of the phenological database used in the analysis—observations of budburst dates by location of phenological stations, period, and climate type classification of the locations.
Fruit TreePhenological StageVarietyStation Name (Period)Location (Latitude, Longitude, Altitude)Climate Type
Grapevine
(Vitis
vinifera L.)
BudburstRefošk–TeranRižana (1981–2020)(45°32’ N, 13°50’ E, 80 m)Sub-Mediterranean
Tomaj (1981–1983,
1985–2012, 2020)
(45°45’ N, 13°51’ E, 326 m)Sub-Mediterranean
MalvasiaPortorož (1985–2006)(45°28’ N, 13°36’ E, 2 m)Sub-Mediterranean
Rižana (1981–2020)(45°32’ N, 13°50’ E, 80 m)Sub-Mediterranean
MerlotBilje (1990, 1994–2008,
2011–2020)
(45°53’ N, 13°37 E, 55 m)Sub-Mediterranean
Slap (1984–2006, 2018–2020)(45°52’ N, 13°49’ E, 169.2 m)Sub-Mediterranean
Laški RizlingBizeljsko (1982–2012, 2014–2020)(46°00’ N, 15°41’ E, 176 m)Subcontinental
Slovenske Konjice
(1981–2008, 2010–2015)
(46°19’ N, 15°25’ E, 332 m)Subcontinental
Zibika (1982–1984, 1986,
1988–1993, 1995–2020)
(46°10’ N, 15°34’ E, 235 m)Subcontinental
ChardonnayŠalovci (2002–2018, 2020)(46°45’ N, 16°14’ E, 347 m)Subcontinental
Apple
(Malus
domestica)
FloweringJonathanBizeljsko (1986–2012)(46°00’ N, 15°41’ E, 176 m)Subcontinental
Bukovžlak (1982–2021)(46°14’ N, 15°15’ E, 266 m)Subcontinental
Kadrenci pri Cerkvenjaku (1981–2021)(46°33’ N, 15°57’ E, 316 m)Subcontinental
Lesce (1982–1984,
1986–2015)
(46°20’ N, 14°10’ E, 515 m)Moderate climate of the hilly region
Mokronog (1982–2008,
2010–2013)
(45°56’ N, 15°08’ E, 251 m)Subcontinental
Maribor (1981–1991)(46°31’ N, 15°38’ E, 275 m)Subcontinental
Novo mesto (1981–2017)(45°48’ N, 15°10’ E, 157 m)Subcontinental
Rakičan (1981–1984, 1986–1996)(46°38’ N, 16°11’ E, 190 m)Subcontinental
Slovenske Konjice (1981–1997)(46°19’ N, 15°25’ E, 332 m)Subcontinental
Šalovci (1981–2018)(46°45’ N, 16°14’ E, 347.5 m)Subcontinental
Vrhnika (1981–1986, 1988–2021)(45°57’ N, 14°17’ E, 293 m)Subcontinental
Zibika (1981–2021)(46°10’ N, 15°34’ E, 235 m)Subcontinental
JonagoldBizeljsko (2014–2021)(46°00’ N, 15°41’ E, 176 m)Subcontinental
BobovecBrod (1981–2021)(45°51’ N, 15°27’ E, 147 m)Subcontinental
Dobliče (1981, 1989–2020)(45°33’ N, 15°09’ E, 157 m)Subcontinental
Podlehnik (1981, 1982,
1984–1987, 1989, 2002–2015)
(46° 20’ N, 15° 52’ E, 320 m)Subcontinental
Slovenj Gradec (1981, 1983,
1985, 1987, 1989–2021)
(46°29’ N, 15°06’ E, 455 m)Moderate climate of the hilly region
Golden DeliciousBukovci (1996–2008)(46°23’ N, 15°57’ E, 216 m)Subcontinental
Rakičan (1992, 1999–2012,
2014–2018)
(46°38’ N, 16°11’ E, 190 m)Subcontinental
ElstarBukovci (2008–2021)(46°23’ N, 15°57’ E, 216 m)Subcontinental
Maribor (1992–2004)(46°31’ N, 15°38’ E, 275 m)Subcontinental
IdaredMaribor (2005–2018)(46°31’ N, 15°38’ E, 275 m)Subcontinental
Portorož (2001–2021)(45°28’ N, 13°36’ E, 2 m)Sub-Mediterranean
Sweet cherry (Prunus avium L.)FloweringGermersdorfPortorož (1989–1993, 1999–2020)(45°28’ N, 13°36’ E, 2 m)Sub-Mediterranean
Rižana (2001–2015, 2017–2020)(45°32’ N, 13°50’ E, 80 m)Sub-Mediterranean
Bilje (1981–1982, 1987–1988, 1993, 2004–2020)(45°53’ N, 13°37 E, 55 m)Sub-Mediterranean
Early BigiTomaj (1996–2012)(45°45’ N, 13°51’ E, 326 m)Sub-Mediterranean
UnknownTomaj (1981–1995)(45°45’ N, 13°51’ E, 326 m)Sub-Mediterranean
Portorož (1984–1995)(45°28’ N, 13°36’ E, 2 m)Sub-Mediterranean
Rižana (1984–1995)(45°32’ N, 13°50’ E, 80 m)Sub-Mediterranean
VanSlap (1992–2006, 2018–2019)(45°52’ N, 13°49’ E, 169 m)Sub-Mediterranean
Table 2. Mean and standard deviation of observed historical budburst dates for the available sample sizes of several grapevine varieties, and the performance of GDD5 and BRIN models in modeling budburst dates. The assessment was made by calculating the root mean square error of prediction (RMSEP) for the modeled and observed budburst dates. In both models, the base temperature is Tb = 5 °C.
VarietyLocation
(Climate Type)
Sample SizeMean BB
(DOY ± SD)
GDD5
RMSEP
BRIN
RMSEP
Refošk–TeranRižana (SM)40110 ± 710.799.89
Tomaj (SM)32117 ± 6
MalvasiaPortorož (SM)22107 ± 77.809.70
Rižana (SM)40116 ± 6
MerlotBilje (SM)26108 ± 76.197.59
Slap (SM)26111 ± 6
Laški RizlingBizeljsko (SC)38117 ± 95.148.57
S. Konjice (SC)34117 ± 6
Zibika (SC)36117 ± 6
ChardonnayŠalovci (SC)18113 ± 54.199.26
Table 3. Values of calculated parameter sets for several grapevine varieties and the two chosen phenological models used in this analysis: GDD5 and BRIN (both with Tb = 5 °C).
VarietySample SizeGDD5BRIN
FcritZDbbCcritFcritZDbb
Refošk–Teran72293.67114197.32257.07114
Malvasia62350.16115194.96268.83113
Merlot52276.09110204.52257.17111
Laški Rizling98267.19119200.98265.11119
Chardonnay18230.19113177.97241.41113
Disclaimer/Publisher’s Note: The statements, opinions and data contained in all publications are solely those of the individual author(s) and contributor(s) and not of MDPI and/or the editor(s). MDPI and/or the editor(s) disclaim responsibility for any injury to people or property resulting from any ideas, methods, instructions or products referred to in the content.