Abstract
With rapid urbanization, hazardous environmental exposures such as air, noise, plastic, soil and water pollution have emerged as a major threat to urban health. Recent studies show that 9 out of 10 people worldwide breathe contaminated air contributing to over 7 million premature deaths annually. Internet of Things (IoT) and Artificial Intelligence (AI)-based environmental sensing and modelling systems have potential for contributing low-cost and effective solutions by providing timely data and insights to inform mitigation and management actions. While low and middleincome countries are among those most affected by environmental health risks, the appropriateness and deployment of IoT and AI systems in low-resource settings is least understood. Motivated by this knowledge gap, this paper presents a design space for a custom environmental sensing and management system designed and developed to fill the data gaps in low-resource urban settings with a particular focus on African cities. The paper presents the AirQo system, which is the first instance of the design space requirements. The AirQo system includes: (1) autonomous AirQo sensors designed and customised to be deployed in resource constrained environments (2) a distributed sensor network that includes over 120 static and mobile nodes for air quality sensing (3) AirQo network manager tool for tracking and management of installation and maintenance of nodes, (4) AirQo platform that provides calibration, data access and analytics tools to support usage among policy makers and citizens. Case studies from African cities that are using the data and insights for education, awareness and policy are presented. The paper provides a template for designing and deploying a technology-driven solution for cities in low resource settings.
1. Introduction
With rapid urbanization in Sub-Saharan Africa (SSA), hazardous environmental exposures such as air, noise and plastic pollution have emerged as a major threat to cities to become prosperous and resilient. People living in cities are in particular at a greater risk of exposure to unhealthy levels of air pollution. Recent World Health Organisation (WHO) report indicates that 99 percent of the global population breathe polluted air [1]. Furthermore, air pollution exposure is linked to over 7 million deaths per year worldwide, the majority happen in low- and middle-income countries [1].
Despite the greater risk associated with the air pollution exposures in urban spaces, there are scarcity of data on the scale and magnitude of air pollution in many cities in low- and middle-income countries. Traditional air pollution measurement approaches rely on expensive ground monitoring stations that cost thousands of dollars to set up and maintain [2,3,4]. In this paper, we explore the potential of emerging technologies such as low-cost air quality sensing, Internet of Things (IoT), and artificial intelligence as novel approaches to improving the monitoring and data access and their contribution to building sustainable and resilient urban spaces with a focus on low-resource settings.
Smart technology solutions have potential for accelerating actions that can be taken to tackle environmental and public health challenges in urban spaces. When harnessed appropriately smart city solutions can help track more precisely the magnitude and scale of environment exposures as well as track the progress and inform actions being taken in addressing the challenges and contribute to sustainable cities [5,6,7].
However, deployment and adoption of smart city solutions including Internet of Things, machine learning and artificial intelligence are less harnessed in many developing cities. Deployment and adoption of smart city solutions in many cities in low- and middle-income countries is a complex endeavour and is often impeded by a number of contextual challenges such as infrastructure bottlenecks, environmental conditions, incompatibility of the technology solutions and the city needs, cost and capacity. These factors negatively affect the deployment and implementation systems and technologies that are conceived for other contexts because the assumptions may not hold. For example, an environmental sensing system should take into account the available data communication and energy infrastructure, otherwise data completeness and device up-time can affect the reliability of the system.
Distributed low-cost air quality sensors have recently gained momentum as a complementary approach to the traditional air quality measurement instruments [8,9]. Datasets from low-cost sensor networks provide opportunity to measure at a larger spatial scale and can help inform understanding of environmental trends at a higher resolution. Traditional instruments have limited spatial coverage and heterogeneity and are inadequate for understanding air pollution exposures at individual and community level [9]. The limitations of traditional air quality monitoring have inspired the emergency of low-cost sensor approaches. Low-cost air quality sensors are leading to a paradigm shift in air quality monitoring enabling synergetic efforts between communities and the government to tackle air pollution in a city. Snyder et al. [8] predicted this paradigm, while Labzovskii et al. [10] demonstrated this shift in a practical case study of a decentralised urban air quality monitoring system. Other studies and systems that have explored for low-cost air monitoring approaches include CAIRSENSE [11], DYNAMAP [12], SentinAir [13], HazeWatch [9], MAQUMON [14], CommonSense [15], and APS [16]. The majority of these systems focus on evaluation of specific technical aspects of low-cost sensors like quality assurance, performance and feasibility.
In this paper, we present the AirQo system, an air quality smart sensing and management system that has been conceived from the ground-up with the understanding of the unique and contextual needs of African cities to generate evidence and facilitate actions for improving air quality management in urban spaces. Low-resource settings are typically characterised by many constraints ranging from limited capacity and fewer trained personnel, limited infrastructure for power, data transmission, limited funding, fewer or absence of high-end equipment, among others. The AirQo system has been deployed in major cities in East Africa and is being scaled to more cities in the African region. The digital air quality platforms are being used to facilitate citizen awareness on air quality issues, provide access to data and evidence for decision makers and used for skilling and training of students and researchers from several disciplines including Engineering, Computer Science, Public Health, among others. To our knowledge the AirQo system is the largest sensing network in production low-resource settings and thus uncovers new design and deployment requirements. Moreover, the AirQo system is linked to actions that can be taken by communities and city leaders.
2. The Design Space for an Urban Air Sensing System
This section presents the design space for an air quality monitoring and management system for cities in emerging economies and low-resource settings. Urban spaces in low-resource settings have unique characteristics and challenges related to diverse technology and power infrastructure and access, informal and upscale settlements, population density, capacity, transport systems and varying levels of pollution profiles and diverse sources. Taken together these challenges and characteristics pose new design requirements for a smart city solution for environmental issues like air and noise pollution. The design space is informed by experiences from an iterative process of design, development and implementation of AirQo [2,17], one of Africa’s largest technology-driven air quality monitoring and management system for urban spaces in low-resource settings. The design and development of the AirQo system has undergone a series of iterations and evolution following agile development methodology and practices of user-centered design [18,19]. Figure 1 presents an overview of the air quality sensing and management system. The key stakeholders and users being citizens and communities in African cities, decision makers and authorities, and researchers in local universities embedded in these cities. In Figure 1 the arrows illustrate the interaction among the different stakeholders in the ecosystem. The local University and innovators that are embedded in the city have the understanding of the technology as well as the local context and thus are well positioned to translate the needs of the city and communities into products. Citizens and communities are also critical in the product development and engineering cycle through co-creation and co-design.
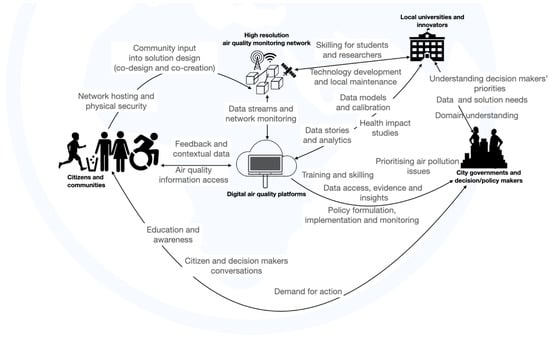
Figure 1.
A conceptual design of an air quality sensing and management system urban environments.
2.1. Design Requirements for an Urban Air Quality Sensing System for Low Resource Settings
Throughout the design and development process, we identified and documented key design requirements for an effective air quality sensing and management systems aimed at having a direct impact to the United Nations Sustainable Development Goals of reducing emissions in cities as well as their impacts on human health. Table 1 provides an outline of the key design requirements (DR) for a smart city solution for air quality sensing and management in a low-resource urban setting. The design considerations are presented as a series of steps rather than the order of importance. The DRs range from air quality monitoring network design and setup, to deployment options, data transmission, network operations and adaptation to the deployment conditions, quality assurance of the data and network operations, engagement of the communities, and linking the data and digital tools to action.

Table 1.
Design considerations for an urban air quality sensing system in a low-resource setting.
2.1.1. DR1: Low-Cost and High Resolution Air Quality Sensing
Traditional air quality monitoring relies on reference grade monitors that have high precision and accuracy, for example, beta attenuation monitor (BAM) and tapered element oscillating microbalance (TEOM) [20]. However, these are expensive to setup [4,13,21], require specialised technical capacity to maintain, and require stable infrastructure for power connectivity and data transmission. For example, setup of a reference grade monitor in an African city context may require extension of electricity grid and data communication network infrastructure. Outdoor deployment for a reference grade monitor also requires consideration of physical security to minimise the risk of vandalism and loss. This can limit the choice of deployment sites to only those where security is guaranteed and there is access to power grid and communication infrastructure. Furthermore, sites with existing power and communication infrastructure may not necessarily be representative of the community, and so installing monitors in those locations can result in bias in the measurements. These challenges make traditional air quality sensing systems impractical for many settings in low-resource settings, particularly African urban spaces. Also because of the high cost of setup and maintenance, installation of reference grade monitors at a higher density is often not feasible even in the rich-resource settings.
The need for high resolution sensing is also motivated by the high variability of pollution profiles in urban spaces. Pollution profiles in African urban spaces can vary greatly due to the localised pollution drivers such as cooking and waste burning [2,22]. As such an air quality sensing system designed for African urban spaces should be deployed at high resolution to achieve hyper-local air quality monitoring. High resolution monitoring can also be used to promote awareness about air pollution issues and its effects [23]. For high resolution monitoring to be achieved it requires that the cost of monitoring devices and network setup and maintenance be considerably affordable. The exact resolution of an air quality sensing system should be informed by a scoping exercise to meet the monitoring goals. Sensor placement optimisation approaches should be explored to ensure that the air quality sensing network achieves the monitoring goals while at the same time optimising the cost of monitoring.
2.1.2. DR2: Designing for Portability and Flexible Deployment Options
Air quality sensing devices should be designed to meet the physical installation requirements in low-resource urban spaces. It should be possible to mount devices on the available infrastructure, including streetlight poles, schools, retail shops, trees, temporary structures, homes, or custom poles. Devices should be easy to move from location to location to meet the emerging needs, for example, moving a monitor to a new location of interest in the cases where there might be limited sensors or changing the device location because the device host has changed premises. The air sensors should also be designed to allow for mounting on mobile objects to allow for wide sensing with fewer monitors. Mobile sensing has been explored previously as a means to increase coverage of monitoring [24,25]. Particularly, in the African urban spaces there is potential to leverage mobile monitoring, for example, the use motorcycle taxis and citizens to reach wider coverage of sensing with fewer resources. The deployment needs in these contexts may vary location by location, requiring retrofitting (i.e., customisation to fit the deployment environments) using locally available materials. Whenever possible local technicians can be used to support fabrication of custom mounts for the locations in their community to ensure context-specific deployment and installation needs. This can greatly reduce the cost of shipping and transporting installation and deployment materials and also promotes local-buy-in and ownership.
2.1.3. DR3: Flexible Power and Communication Options
An environment sensing system designed for deployment in urban settings in many African countries needs to take into account the varying power and communication challenges. Access to the main electricity grid is not always guaranteed and can also be characterised by power cuts [26]. The sensing devices need to be designed to allow for flexible power options, for example, solar and main grid [27]. Devices need to have optimised battery storage and usage to allow for operation in the case of power cuts or absence of solar energy in the night hours. Incentive mechanisms need to be explored for cases where devices are powered by the main electricity grid owned by the private owners. Potential incentives include education and awareness, recognition of the community members as key stakeholders or compensation to the power costs. In the case of mobile monitoring, specialised power charging modules need to be designed. These requirements are unique to the urban spaces in low-resource settings. For example, when deploying air quality sensors on motorcycles, we find that many lack well-maintained functional batteries and thus the charging system must be designed around the alternator instead of battery or both. Motorcycle taxis often take very short trips and thus the charging system should be designed to address these unique requirements.
Autonomous data transmission is necessary for environmental sensing systems to minimise the cost and resources required for manual data collection. The Internet communication infrastructure in low-resource and emerging urban spaces is often characterised by unreliable connectivity. Slow and intermittent communications are the rule rather than an exception. Wireless connectivity is not practical and alternative communication options need to be explored. Cellular connectivity is present in many African urban spaces including rural setups and thus 2G cellular communication should be included as default option for these settings. To minimise data loss local storage and bulk data transmission options should also be key design requirements for smart environmental sensing systems in these contexts.
2.1.4. DR4: Resilience to Local Environmental Conditions
In African urban spaces, air quality sensing systems are deployed in outdoor settings characterised by high levels of pollution concentrations not common in the northern hemisphere and other settings [2,28,29]. High pollution levels have been found to affect the performance of low-cost sensors [30,31]. These environments may also be characterised by extreme tropical weather conditions and high levels of dust from unpaved roads. These conditions tend to affect the performance of air quality sensing systems and thus the design and setup needs to take into consideration these requirements. The air filters and inlets for these settings need to be designed to minimise the environmental impacts from dust, weather and insect infiltration. However, such design considerations should not affect the effectiveness of the sensors. Due to high levels of humidity specialised heating components may need to be designed. Jayaratne et al. [32] investigated the effect of humidity on the performance of low-cost air particle sensors. The operating outdoor conditions such as temperature ranges for the internal and external components should also be considered. Reference grade monitors or devices designed for other settings may need to be adapted to work in these unique conditions. Devices deployed in these settings will require regular preventive maintenance and therefore such devices need to be designed to allow for easy maintenance.
2.1.5. DR5: Embedded Quality Assurance and Calibration Methods
Environmental sensing systems deployed in outdoor urban spaces require mechanisms to ensure reliability, availability and quality of the data. An air quality sensor network cannot be entirely left to the community to maintain and do quality assurance. Therefore, a key consideration for low-cost sensor networks is calibration, in order to improve their accuracy and reliability [33,34,35,36]. In addition, the sensor network requires regular maintenance. In addition, local technical capacity needs to be built to ensure sustainability and reduced maintenance cost of sensors. This could be done through institutions such as universities, vocational schools, or private technicians within the areas of deployment. Therefore, these should be embedded in the design of the air quality sensing and management systems throughout the development and implementation processes. At the sensor development stage, in-lab analysis and co-location is necessary to ensure that all sensors behave the same way and are consistent. After production in-field comparison should also be considered to understand how the outdoor environment affects the operation of the sensors. A co-location in the outdoor environments should be considered as part of the calibration and field comparison. In the case of limited access to reference monitors, datasets from environments with similar contexts can be considered. Also mobile co-location can be considered where a device is transported to a nearby reference monitor, for example, by use of motorcycle taxis without having a fixed installation.
2.1.6. DR6: Community-Oriented and Active Engagements
Citizens and community members should have an active role in the design and implementation of a smart city sensing system for it to be sustainable and achieve uptake targets. Citizens can give input for example through co-design workshops on how air pollution affects them and desired options to consume data and hardware products. Citizens can host devices on their premises and provide device security. Citizens can host air quality sensors on their premises or their motorcycle in the case of mobile monitoring. Hosting of the sensor device should involve training and education on the purpose and goals of the air quality sensing system and how they benefit. When empowered, hosts of a sensor network can serve as champions in their communities and advocates for cleaner air. This initial engagement can also help to create demand for the resulting data and insights from the collected measurements. Where sensors are placed in schools, the air quality sensing system can be used to create awareness while data and sensors can be used in teaching mathematics and science subjects. Retention and sustained active engagement may require mechanism design approaches for example through incentives and rewards and analysis of barriers to participation [37]. In addition, communities may serve as a supplementary “sensor” of the environment, providing contextual metadata that this not trivial to collect using autonomous sensors. Members of the public can use their mobile phones to capture pictures and meta-data of air pollution events in their neighborhoods whenever high spikes are observed from the air quality sensing system. This can increase awareness of the causes of the pollution in the community. The additional datasets can be used to improve modelling and prediction of pollution events. Prediction and calibration models tend to perform poorly with the pollution spikes caused by local events, for example, spontaneous waste burning events are difficult to predict. The collection of additional metadata from community members can be used to enhance performance and accuracy of the prediction model for localised pollution events.
2.1.7. DR7: Digital Platforms to Drive Action and Policy
Environmental sensing systems collect huge amounts of datasets, which are in raw formats and are not of utility to the citizens or decision makers. Custom digital platforms need to be designed to increase timely access to air quality information and also link the data to action and facilitate data-driven decision making for leaders, communities, and citizens [38,39,40]. The data needs vary from a stakeholder group to another and thus segmentation of the potential users is necessary. For example, city urban planning and environmental managers may require trends and insights of variations of air quality in space and time, region-by-region comparison that can be best delivered through a web-based analytics platform. School teachers and parents require timely and near-real time information on air quality around schools or homes to understand the pollution exposures of their children. Joggers and cyclists require real-time information to find the cleanest route to be delivered to them via a mobile application on their smartwatch or smartphone. Restaurants and hotels may require API access to embedded the air quality information in their existing digital products. The access channels should also be taken into consideration to increase access and offer personalised air quality information to different user segments [41]. For example, people without smartphones could be reached through leaders in their communities or alternative communication channels such as campaigns, SMS, and radio.
3. Demonstration: The AirQo System in Selected African Cities
The above design space requirements have informed and inspired the design and implementation of the AirQo system. The AirQo system is a large-scale custom air quality sensing and management solution designed to be responsive to the needs and requirements of urban spaces in low-source settings. The AirQo system adheres to the design space requirements described above DR1–DR7. Initiated in 2015, the AirQo system has been implemented in major cities in Uganda, East Africa including: (1) Kampala, which is Uganda’s largest and capital city with a population of over 1.6 million people and (2) Jinja, which is a city in Eastern Uganda with a population of over 0.3 million people and, (3) Fort Portal, a city with a population of over 0.06 million people and located in the South Western region of the country [42]. The AirQo system includes a network of over 120 sensors. The remainder of this section presents the key components of the AirQo system as the first instance of the design space for an air quality monitoring and management system for urban spaces in low-resource settings.
3.1. The AirQo Monitor
The AirQo monitor is a custom air quality monitoring device designed to be responsive to design space requirements: DR1: Low-cost and high resolution air quality sensing; DR2: Portability and flexible deployment options; DR3: Flexible power and communication options; and DR4 Resilience to local environmental conditions. One of the primary air quality indicators defined by the WHO is particulate matter due to the well studied impacts on health. AirQo devices measure both particulate matter PM and particulate matter PM with an effective range of 0–500 g/m. The device also measures other variables necessary for modelling and analysis such as longitude, latitude, internal (within the device) and external air temperature, relative humidity, and atmospheric pressure. The AirQo device is designed to support flexible power options for solar energy, mains, and capability to change from other available sources, for example, motorcycle alternator. Figure 2 shows the AirQo device. The AirQo device sensors use laser scattering technique for the measurement of particle size and concentration for PM and PM in g/m. Each device includes dual PMS5003 (https://www.plantower.com/en/products_33/74.html, accessed on 4 January 2023) sensors for measurement of PM and PM for quality assurance and redundancy purposes. The acceptable threshold of in device dual sensor correlation is ≥0.99 and . Sensors can be flagged for maintenance and/or corrective actions can be applied if correlation and values are out range of the set threshold. AirQo devices use cloud-based machine learning methods for calibration and improve the accuracy of measurements for PM and PM to the RMSE of 7.2 g/m and 7.9 g/m, respectively. The details of the evaluation of the accuracy and calibration of AirQo devices are presented in [33,43].

Figure 2.
A design of a portable low-cost air quality monitor. (a) AirQo monitor. (b) AirQo solar mount.
Dust from unpaved roads is one of the major contributors to particulate matter in many African urban spaces. However, dust deposition on sensors can lead to degradation. Resilience to degradation from dust and other outdoor conditions such as insect infestations is achieved through device design options including the choice of orientation of the sensors, air flow management, casing venting placement and alignment. The orientation of sensors and other components is optimized to minimize dust deposition on critical sensor components such as laser and photodiode. The device is designed to minimize air flow looping by separating the dual insets from dual outset with the sensing region. The casing venting is designed to be larger than sensor venting to reduce resistance in airflow. This is taken into account for both on the inset venting and outset venting. Combined sensor flow rate is 0.2 L/min. The casing venting placement is critical to further minimize dust deposition within the sensors. The design of the AirQo device also considers casing venting alignment versus the sensor venting. We also take a fine height offset from the casing venting to the sensor venting. The internal particle sensors have a mean time to failure (MTTF) of 3 years.
The 3D printed enclosures of the AirQo devices have gone through iterations of refinements, incorporating feedback from the communities, users and as well as the above portability and deployment requirements. For the mobile monitoring a custom mounting was designed with the local welding community to match the available installation options on the motorcycle. The position of the monitoring device on the motorcycle is aimed at understanding the exposure of the rider and passenger while minimising the direct emissions from the bike’s tailpipe.
The data from the AirQo monitor is transmitted in near real-time to the cloud-based air quality data store. Each AirQo sensor transmits data on average every 90 s. Sensors can be optimised to transmit data in bulk where time sensitive data transmission is not a critical requirement. Bulk data transmission also improves the battery life. For each data record, the location of the pollution measurement is transmitted along with other secondary data such as battery levels used for network monitoring and maintenance. The monitor is designed to transmit data over the GSM network. The monitor relies on TCP/HTTP/HTTPS protocols to transfer and receive data accordingly. In addition, the AirQo monitor provides an option for local data storage. The AirQo monitor periodically writes data to a Micro SD card. The raw data is periodically subjected to the calibration system that is introduced in Section 3.3 and discussed in detail in [33]. The AirQo monitor is designed to provide a high resolution dataset over a 24 h period. To allow for this the monitor can be powered off mains and solar. The AirQo monitor has power input of 6V 1A. The consideration for the solar setup includes 2P 3.7V 4AH battery and 6V 1.25A panel.
3.2. The AirQo Network
The AirQo monitors are deployed in selected urban spaces to form a high resolution air monitoring network. The objectives of the AirQo system include: (1) collection of high resolution (spatial and temporal at average of 90 s) data on the scale and magnitude of air pollution, (2) improving accuracy of data from low-cost sensors through calibration, (3) building a set of digital air quality tools and platforms to provide insights and evidence for decision making (4) using the data and platform to raise awareness and inform actions to mitigate air pollution. In the AirQo system, monitors are mounted on static or mobile objects including motorcycle taxis (Figure 3). Mobile monitoring is important to study pollution exposures and variations in the unique transport systems used in African urban spaces. For example, mounting of AirQo devices on motorcycle taxis (or boda-bodas) has allowed for understanding of exposures to emissions for the riders and passengers while at the same time providing high spatial coverage with fewer resources. To fulfil the requirement of DR1 Low-cost and high resolution air quality sensing, there is need to ensure that the air monitoring system is optimised for spatial resolution as well as the cost of setting up the network. From the experience of deploying AirQo sensors in cities a common question is “How many devices are sufficient for a given city?”. There is a risk of oversampling leading to higher cost or under-sampling leading to under-representation of the city. For the data to be useful and help drive localised actions air quality, there is need for a high resolution and a long term monitoring. This is important because it provides a representation of the state of air quality in a given geographical area of a city while adhering to the design requirement of DR1 Low-cost and high resolution air quality sensing.
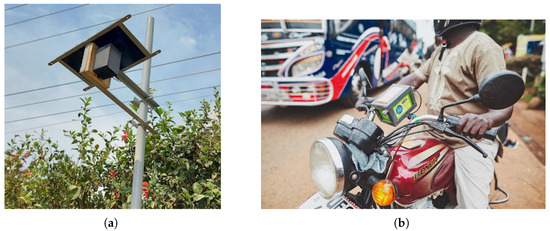
Figure 3.
Flexible deployment options for high resolution air quality sensing. (a) Static pole deployment. (b) Mobile deployment.
To this end, the AirQo system includes a sensor placement model that determines the optimal number of clusters for deployment in a given geographical area [44]. The implementation of the sensor placement should be incremental in nature to allow for additional of new sensing devices depending on the need and available resources. The model uses a range of datasets and features including the geographical boundaries at the parish level (for the case of Ugandan cities), population density, household density, waste management practices in a given area, vegetation cover, km of road, power and fuel type. The output of the model is clusters of parishes with similar characteristics. Parishes in the same cluster are likely to have similar measurements and trends. The number of clusters is optimized to the available number of sensors. The sensor placement model is incorporated and deployed in the AirQo platform [44].
Figure 4 shows the output of the sensor placement model as applied to a selected urban city in Uganda. The colours represent city regions which are clustered as having similar properties (e.g., greenness and road density) while the black color dots in Figure 4a represent proposed sites for the available number of sensors. As new sensors are acquired the model can suggest new sites in regions with fewer installations as shown by the red color dots in Figure 4b.
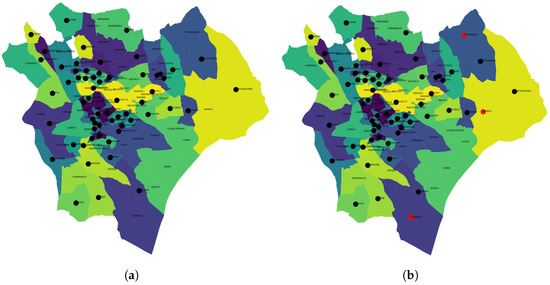
Figure 4.
Proposed installation sites that are recommended by the sensor placement model. (a) Initial sensor placement. (b) Refined sensor placement.
The automated placement is followed by the physical on ground validation of the suggested installation points to meet the need of practicability and feasibility. For example, the suggested location needs to meet the physical security and accessibility needs. Upon confirmation of the site, metadata about the site is collected to feed into the data models for the digital platforms. Examples of metadata include potential sources of air pollution in the area, distance from the road, installation height, contacts of the device host, and the power option selected.
3.3. Data Calibration and Quality Assurance
In order to meet the design space requirement DR5: Embedded quality assurance and calibration methods the AirQo systems has regular data calibration based machine learning approaches such as random forest, lasso regression model, and gradient boosting for calibration [45]. The calibration in the AirQo system is based on co-location data of low-cost monitors and reference grade monitors (BAM1022) for PM and PM. The calibration model is developed using machine learning methods based on datasets from field co-locations. The key features considered for the model include hourly average for PM and PM, atmospheric temperature, and relative humidity. The AirQo sensor evaluation and calibration process is presented in [33]. The AirQo calibration model has also been packaged to support third-party low-cost sensor calibration in the AirQalibrate product (https://airqalibrate.airqo.net/, accessed on 4 January 2023). Figure 5 shows the in-field comparison of data from the low-cost sensor network and the reference grade monitor for PM deployed in an urban setting in Kampala, Uganda. Before calibration the correlation and RMSE between low-cost sensors and reference monitor are 0.9 and 18.58 g/m, respectively (Figure 5a). After application of the calibration algorithm the correlation and RMSE improved to 0.96 and 7.22 g/m respectively for PM (Figure 5b). The calibration for PM resulted in improved RMSE from 13.4 g/m to 7.9 g/m using lasso regression models (Figure 6b) [33]. These calibration tools and methods should be part of the data pipeline and in the digital platforms to facilitate continuous data calibration and quality assurance. A long term calibrated dataset from the AirQo network is described and available in [46].
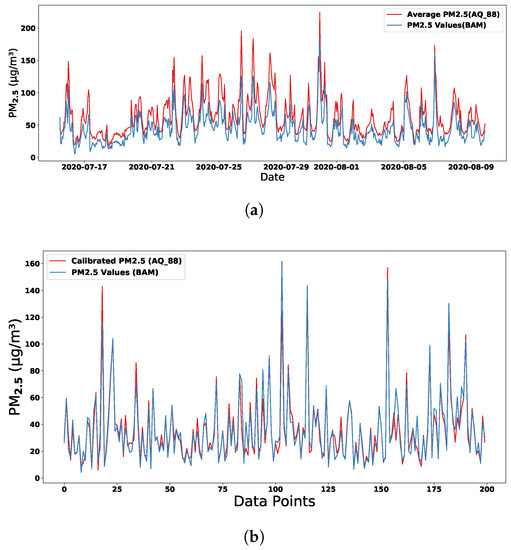
Figure 5.
Calibration of low-cost air quality sensors using machine learning methods. (a) In-field comparison of AirQo low-cost sensors and reference grade before calibration. (b) PM Calibrated low-cost sensor data vs reference grade monitor.
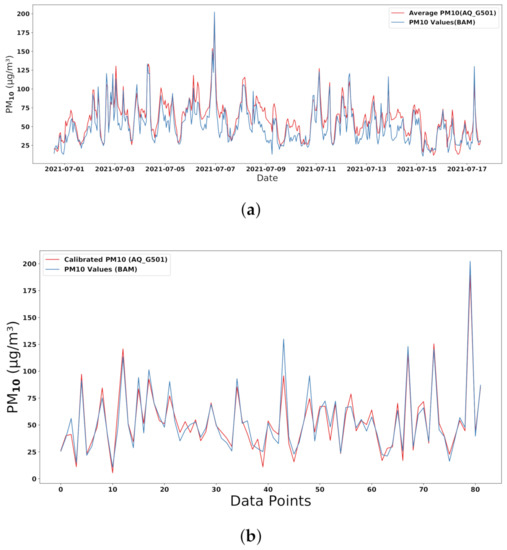
Figure 6.
Calibration of PM low-cost air quality sensors using machine learning methods. (a) In-field comparison of AirQo low-cost sensors and reference grade before calibration for PM. (b) PM Calibrated low-cost sensor data vs reference grade monitor.
3.4. Digital Air Quality Platforms
In order to meet the design space requirement of DR7: digital platforms to drive action and policy, the AirQo systems has implemented a set of digital tools and platforms that fuse and extract insights from the various datasets in the data store. The AirQo digital platforms are designed to be extensible to allow for plugging-in of new datasets from other sensor networks as they become available. The design of the AirQo digital platforms follows the micro-service architecture, which allows for separation of concerns and functionalities into independent modules that exchange data through application programming interfaces (APIs). The raw data from the sensor network is sent in a cloud-based IoT data store for pre-processing that is fed into the calibration model. The resulting calibrated dataset is maintained in a separate datastore that is accessible via APIs for the different micro-services. Micro-services define specific functionality for example the AirQo platform for data access and analytics, the AirQo mobile app for presentation of air quality information in historical, location-based and near-real-time, and the network management tool for network monitoring and support. The digital tools consume the same data model but may process and render the data differently, similar to the model-view-controller model.
The following sections describe the key modules of the digital tools in the AirQo system.
3.4.1. The AirQo Platform
The AirQo platform (https://platform.airqo.net, accessed on 4 January 2023) targets decision makers (city authorities, environmental officers, politicians), researchers and advanced users. Figure 7 shows the AirQo digital analytics platform. The platform tool was developed in consultation with the city authorities from the selected cities in East Africa. The platform provides the ability to view calibrated datasets in different forms. It provides default analytics such as average pollution measurements clustered by locations within a given geographical area of a city. It also incorporates spatial and temporal insights as well as prediction in time and space for locations of interest. Users also have the ability to create custom charts for given locations, date ranges, and pollutants of interest. For advanced users and researchers the platform provides capability to download calibrated datasets in csv format for external data analysis and modelling. Through the platform, advanced users can request access to the AirQo API for data extraction using a programming language of choice.
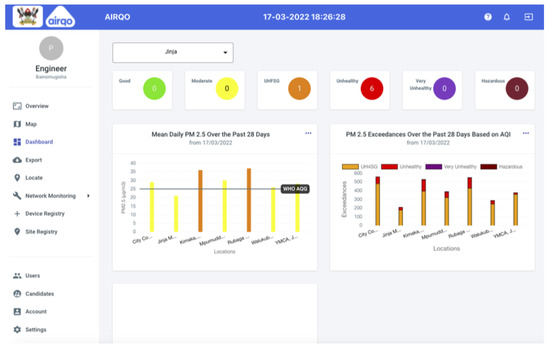
Figure 7.
Digital platforms providing trends and analysis of air quality for diverse locations in a city. The tool targets decision makers in a city to gain insights on how different parts of the city compare over a specified period of time.
3.4.2. The AirQo Mobile App
The air quality mobile app is designed and tailored for use by members of the public including parents, teachers, environmental champions, and community leaders. The mobile app (Figure 8) provides users options to view air quality insights per location of interest for the current time and forecast. The mobile app provides timely air quality information and has custom actions for users aimed at raising awareness and improving air quality. For example, depending on the advisory the user is provided with the actions they can do to minimise exposure or contribute to improving air quality in their space. The AirQo mobile app is available at Google play store and Apple App store for Android OS and iOS, respectively.
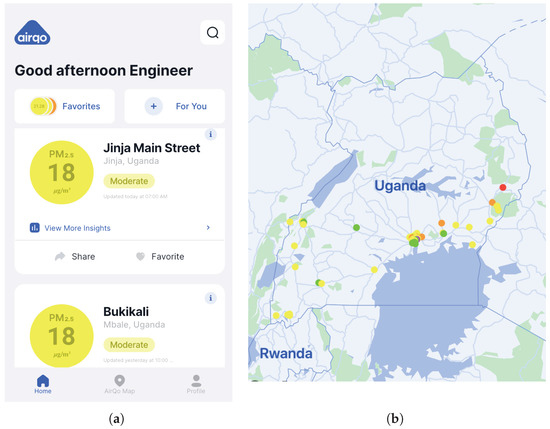
Figure 8.
A snapshot of the air quality data insights from the AirQo mobile app. The data is colored with advisory to inform decision making to minimise or reduce exposure to air pollution. Users have an option to favorite specific sites of interest for quick access. (a) AirQo mobile app targeting the public users. (b) Visualisation of AirQo sites across Uganda.
3.4.3. The AirQo Network Manager
As the air quality monitoring network scales, there is a need for a tool to track and manage devices, for example, sensors that are due for maintenance or not operating as expected. To address this need, the AirQo system includes a network management tool. The AirQo network manager provides capabilities to register new devices that are ready for deployment, record metadata on the site of installation, details about the sensor, host of the device, and the maintenance history. The network manager tool provides network-wide statistics and analysis that are necessary for management of a city air quality sensor network. The tool provides reports on the network up-time, individual sensor maintenance history, battery life and other parameters necessary for troubleshooting common sensor and network failures. The key target users of the tool are network technicians and people responsible for overseeing an urban air quality sensing system.
3.5. Linking Data and Technology to Action
One of the key objectives of the AirQo system is to translate the data and insights into action that can impact on improving air quality in urban spaces (DR7: digital platforms to drive action and policy). This is being achieved through amplifying access to the digital tools presented above as well deliberate offline actions that use data. The strategies used include citizen education, awareness, and policy engagements. Citizen education and awareness are achieved through use of data to conduct annual air quality awareness week with stakeholders from government and academia [47]. This is achieved through focus group discussions and data communication sessions that bring together participants from communities, local leaders, and industries within a specific geographical area. During the sessions key findings from the collected data and insights are shared. Further, citizen engagement is through engagement of air quality champions and community leaders who are provided access to the AirQo mobile app, educated about air pollution and use the data to drive change in their communities [48]. City technical persons are trained on the use of data and digital tools in managing the city urban environment and utilising evidence for decision making processes related to air quality management. For policy engagement, the data from the AirQo system is used to provide baseline data for formulating and monitoring of the national level or city-level air quality standards and action plans.
4. Discussion and Future Work
The AirQo system presented in this paper demonstrates the design and development of a smart city solution that is implemented in and for contexts of African urban spaces. A recent extensive scoping study [49] emphasized the need for contextualized strategies and systems to tackle air pollution in African cities. The design considerations put forward in this paper is a step towards such strategies. The technology and approaches presented have potential to be transferable to other cities in low-resource settings with similar contexts. Urban spaces in these settings share similar context with respect to the pollution profiles, transport systems, informal settlements and policy frameworks. For an urban sensing system to achieve the design impact, it should consider the seven design space requirements of: DR1: Low-cost and high resolution air quality sensing; DR2: Designing for portability and flexible deployment options; DR3: Flexible power and communication options; DR4: Resilience to local environmental conditions; DR5: Embedded quality assurance and calibration methods; DR6: Community-oriented and active engagements; DR7: Digital platforms to drive action and policy. Digital technology cannot achieve the desired impact in isolation and thus it is important to complement digital technology with “offline” activities that aim to widen access to data insights and information considering that many users and target stakeholders may lack access to Internet and smartphone devices in these contexts. The need for air quality sensing is present in many urban spaces and as such the sensing networks should be scaled to several urban spaces that meet the monitoring criteria, for example, dependent on the population density, pollution profile and risk. As next steps, the AirQo system is being scaled to more cities on the continent with the target more cities in Africa. Lessons gathered from scaling up of the AirQo system will further enrich and validate the design space requirements put forward in this paper. In order to impact on the air quality, approaches to enhance citizen engagement and behaviour change need to be further investigated. The datasets and tools from the AirQo systems also provide a baseline for further research on the impacts of air quality on health and economic outcomes. For example, previously the data from the AirQo system has supported studies on understanding the air pollution impacts on city competitiveness [50], macro predictions that fuse ground monitored data with other datasets [51], prediction and modelling studies [43], assessing pollution vulnerability for African cities [52], understanding impacts of air pollution on mobility [53,54], and characterisation of air pollution profiles for African cities [2]. Other areas of future work include investigation of incentive mechanisms to encourage use of data and behaviour change among citizens and decision makers. For example, the digital tools could be integrated with means to enable citizens to keep track and share individual actions done to contribute to cleaner air in their community. Reward system could be designed basing on the quality and effectiveness of individual contributions.
Author Contributions
E.B. (lead author) overall conceptualisation, writing, investigation, analysis, supervision, project administration, funding acquisition. J.S. contribution to the software and hardware development; D.O. review, project administration and network planning. All authors have read and agreed to the published version of the manuscript.
Funding
This work was supported by Google.org grant 1904-57882, EPSRC/GCRF grant EP/T00343 X/1, Belgium through the Wehubit programme implemented by Enabel Wehubit Grant Agreement BEL1707111-AP-05-20.
Institutional Review Board Statement
Not applicable.
Informed Consent Statement
Not applicable.
Data Availability Statement
The datasets used and/or analysed during the current study available at https://platform.airqo.net, accessed on 4 January 2023. Other relevant historical datasets available [46].
Acknowledgments
Authors would like to appreciate the feedback and discussions from the AirQo team and partners from government, academia, private sector and civil society. The authors appreciate the feedback received from the anonymous reviewers that helped improve the paper.
Conflicts of Interest
The authors declare no conflict of interest. The funders had no role in the design of the study; in the collection, analyses, or interpretation of data; in the writing of the manuscript; or in the decision to publish the results.
References
- WHO. Billions of People Still Breathe Unhealthy Air: New WHO Data. 2014. Available online: https://www.who.int/news/item/04-04-2022-billions-of-people-still-breathe-unhealthy-air-new-who-data (accessed on 4 January 2023).
- Okure, D.; Ssematimba, J.; Sserunjogi, R.; Gracia, N.L.; Soppelsa, M.E.; Bainomugisha, E. Characterization of Ambient Air Quality in Selected Urban Areas in Uganda Using Low-Cost Sensing and Measurement Technologies. Environ. Sci. Technol. 2022, 56, 3324–3339. [Google Scholar] [CrossRef] [PubMed]
- Brauer, M.; Guttikunda, S.K.; Nishad, K.A.; Dey, S.; Tripathi, S.N.; Weagle, C.; Martin, R.V. Examination of monitoring approaches for ambient air pollution: A case study for India. Atmos. Environ. 2019, 216, 116940. [Google Scholar] [CrossRef]
- Li, H.Z.; Gu, P.; Ye, Q.; Zimmerman, N.; Robinson, E.S.; Subramanian, R.; Apte, J.S.; Robinson, A.L.; Presto, A.A. Spatially dense air pollutant sampling: Implications of spatial variability on the representativeness of stationary air pollutant monitors. Atmos. Environ. X 2019, 2, 100012. [Google Scholar] [CrossRef]
- Basiri, M.; Azim, A.Z.; Farrokhi, M. Smart City Solution for Sustainable Urban Development. Eur. J. Sustain. Dev. 2017, 6, 71. [Google Scholar] [CrossRef]
- Angelidou, M.; Psaltoglou, A.; Komninos, N.; Kakderi, C.; Tsarchopoulos, P.; Panori, A. Enhancing sustainable urban development through smart city applications. J. Sci. Technol. Policy Manag. 2017, 9, 146–169. [Google Scholar] [CrossRef]
- Kandt, J.; Batty, M. Smart cities, big data and urban policy: Towards urban analytics for the long run. Cities 2021, 109, 102992. [Google Scholar] [CrossRef]
- Snyder, E.G.; Watkins, T.H.; Solomon, P.A.; Thoma, E.D.; Williams, R.W.; Hagler, G.S.W.; Shelow, D.; Hindin, D.A.; Kilaru, V.J.; Preuss, P.W. The Changing Paradigm of Air Pollution Monitoring. Environ. Sci. Technol. 2013, 47, 11369–11377. [Google Scholar] [CrossRef]
- Sivaraman, V.; Carrapetta, J.; Hu, K.; Luxan, B.G. HazeWatch: A participatory sensor system for monitoring air pollution in Sydney. In Proceedings of the 38th Annual IEEE Conference on Local Computer Networks—Workshops, Sydney, NSW, Australia, 21–24 October 2013; pp. 56–64. [Google Scholar] [CrossRef]
- Labzovskii, L.D.; Hey, J.V.; Romanov, A.A.; Golovatina-Mora, P.; Belikov, D.; Lashkari, A.; Kenea, S.T.; Hekman, E. Who should measure air quality in modern cities? The example of decentralization of urban air quality monitoring in Krasnoyarsk (Siberia, Russia). Environ. Sci. Policy 2023, 140, 93–103. [Google Scholar] [CrossRef]
- Jiao, W.; Hagler, G.; Williams, R.; Sharpe, R.; Brown, R.; Garver, D.; Judge, R.; Caudill, M.; Rickard, J.; Davis, M.; et al. Community Air Sensor Network (CAIRSENSE) project: Evaluation of low-cost sensor performance in a suburban environment in the southeastern United States. Atmos. Meas. Tech. 2016, 9, 5281–5292. [Google Scholar] [CrossRef]
- Sevillano, X.; Socoró, J.C.; Alías, F.; Bellucci, P.; Peruzzi, L.; Radaelli, S.; Coppi, P.; Nencini, L.; Cerniglia, A.; Bisceglie, A.; et al. DYNAMAP—Development of low cost sensors networks for real time noise mapping. Noise Mapp. 2016, 3, 172–189. [Google Scholar] [CrossRef]
- Suriano, D. A portable air quality monitoring unit and a modular, flexible tool for on-field evaluation and calibration of low-cost gas sensors. HardwareX 2021, 9, e00198. [Google Scholar] [CrossRef] [PubMed]
- Völgyesi, P.; Nádas, A.; Koutsoukos, X.D.; Lédeczi, Á. Air Quality Monitoring with SensorMap. In Proceedings of the 2008 International Conference on Information Processing in Sensor Networks (IPSN 2008), St. Louis, MO, USA, 22–24 April 2008; pp. 529–530. [Google Scholar]
- Dutta, P.; Aoki, P.M.; Kumar, N.; Mainwaring, A.; Myers, C.; Willett, W.; Woodruff, A. Common Sense: Participatory Urban Sensing Using a Network of Handheld Air Quality Monitors. In SenSys09: Proceedings of the 7th ACM Conference on Embedded Networked Sensor Systems, Berkeley, CA, USA, 4–6 November 2009; Association for Computing Machinery: New York, NY, USA, 2009; pp. 349–350. [Google Scholar] [CrossRef]
- Fu, H.L.; Chen, H.C.; Lin, P. APS: Distributed air pollution sensing system on Wireless Sensor and Robot Networks. Comput. Commun. 2012, 35, 1141–1150. [Google Scholar] [CrossRef]
- AirQo. AirQo, Africa’s Leading Air Quality Monitoring and Management System. 2022. Available online: https://airqo.africa (accessed on 4 January 2023).
- Maruping, L.M.; Venkatesh, V.; Agarwal, R. A Control Theory Perspective on Agile Methodology Use and Changing User Requirements. Inf. Syst. Res. 2009, 20, 377–399. [Google Scholar] [CrossRef]
- Sanders, E.B.N. From user-centered to participatory design approaches. In Design and the Social Sciences; CRC Press: Boca Raton, FL, USA, 2002; pp. 18–25. [Google Scholar]
- Hauck, H.; Berner, A.; Gomiscek, B.; Stopper, S.; Puxbaum, H.; Kundi, M.; Preining, O. On the equivalence of gravimetric PM data with TEOM and beta-attenuation measurements. J. Aerosol Sci. 2004, 35, 1135–1149. [Google Scholar] [CrossRef]
- Castell, N.; Dauge, F.R.; Schneider, P.; Vogt, M.; Lerner, U.; Fishbain, B.; Broday, D.; Bartonova, A. Can commercial low-cost sensor platforms contribute to air quality monitoring and exposure estimates? Environ. Int. 2017, 99, 293–302. [Google Scholar] [CrossRef] [PubMed]
- Petkova, E.P.; Jack, D.W.; Volavka-Close, N.H.; Kinney, P.L. Particulate matter pollution in African cities. Air Qual. Atmos. Health 2013, 6, 603–614. [Google Scholar] [CrossRef]
- Perelló, J.; Cigarini, A.; Vicens, J.; Bonhoure, I.; Rojas-Rueda, D.; Nieuwenhuijsen, M.J.; Cirach, M.; Daher, C.; Targa, J.; Ripoll, A. Large-scale citizen science provides high-resolution nitrogen dioxide values and health impact while enhancing community knowledge and collective action. Sci. Total. Environ. 2021, 789, 147750. [Google Scholar] [CrossRef]
- Wallace, J.; Corr, D.; Deluca, P.; Kanaroglou, P.S.; McCarry, B.E. Mobile monitoring of air pollution in cities: The case of Hamilton, Ontario, Canada. J. Environ. Monit. 2009, 11 5, 998–1003. [Google Scholar] [CrossRef]
- Elen, B.; Peters, J.; Poppel, M.V.; Bleux, N.; Theunis, J.; Reggente, M.; Standaert, A. The Aeroflex: A Bicycle for Mobile Air Quality Measurements. Sensors 2013, 13, 221–240. [Google Scholar] [CrossRef]
- Awokola, B.I.; Okello, G.; Mortimer, K.J.; Jewell, C.P.; Erhart, A.; Semple, S. Measuring Air Quality for Advocacy in Africa (MA3): Feasibility and Practicality of Longitudinal Ambient PM2.5 Measurement Using Low-Cost Sensors. Int. J. Environ. Res. Public Health 2020, 17, 7243. [Google Scholar] [CrossRef]
- Zennaro, M.; Bagula, A.; Nkoloma, M. From Training to Projects: Wireless Sensor Networks in Africa. In Proceedings of the 2012 IEEE Global Humanitarian Technology Conference, Seattle, WA, USA, 21–24 October 2012; pp. 417–422. [Google Scholar] [CrossRef]
- Amegah, A.K.; Agyei-Mensah, S. Urban air pollution in Sub-Saharan Africa: Time for action. Environ. Pollut. 2017, 220, 738–743. [Google Scholar] [CrossRef] [PubMed]
- Kirenga, B.; Meng, Q.; van Gemert, F.; Aanyu-Tukamuhebwa, H.; Chavannes, N.; Katamba, A.; Obai, G.; Molen, T.; Schwander, S.; Mohsenin, V. The State of Ambient Air Quality in Two Ugandan Cities: A Pilot Cross-Sectional Spatial Assessment. Int. J. Environ. Res. Public Health 2015, 12, 8075–8091. [Google Scholar] [CrossRef] [PubMed]
- Liu, H.Y.; Schneider, P.; Haugen, R.; Vogt, M. Performance Assessment of a Low-Cost PM2.5 Sensor for a near Four-Month Period in Oslo, Norway. Atmosphere 2019, 10, 41. [Google Scholar] [CrossRef]
- Khreis, H.; Johnson, J.; Jack, K.; Dadashova, B.; Park, E.S. Evaluating the Performance of Low-Cost Air Quality Monitors in Dallas, Texas. Int. J. Environ. Res. Public Health 2022, 19, 1647. [Google Scholar] [CrossRef] [PubMed]
- Jayaratne, R.; Liu, X.; Thai, P.; Dunbabin, M.; Morawska, L. The influence of humidity on the performance of a low-cost air particle mass sensor and the effect of atmospheric fog. Atmos. Meas. Tech. 2018, 11, 4883–4890. [Google Scholar] [CrossRef]
- Adong, P.; Bainomugisha, E.; Okure, D.; Sserunjogi, R. Applying machine learning for large scale field calibration of low-cost PM2.5 and PM10 air pollution sensors. Appl. AI Lett. 2022, 3, e76. [Google Scholar] [CrossRef]
- Maag, B.; Zhou, Z.; Thiele, L. A survey on sensor calibration in air pollution monitoring deployments. IEEE Internet Things J. 2018, 5, 4857–4870. [Google Scholar] [CrossRef]
- Spinelle, L.; Gerboles, M.; Villani, M.G.; Aleixandre, M.; Bonavitacola, F. Field calibration of a cluster of low-cost available sensors for air quality monitoring. Part A: Ozone and nitrogen dioxide. Sens. Actuators B Chem. 2015, 215, 249–257. [Google Scholar] [CrossRef]
- Giordano, M.R.; Malings, C.; Pandis, S.N.; Presto, A.A.; McNeill, V.F.; Westervelt, D.M.; Beekmann, M.; Subramanian, R. From low-cost sensors to high-quality data: A summary of challenges and best practices for effectively calibrating low-cost particulate matter mass sensors. J. Aerosol Sci. 2021, 158, 105833. [Google Scholar] [CrossRef]
- Wehn, U.; Almomani, A. Incentives and barriers for participation in community-based environmental monitoring and information systems: A critical analysis and integration of the literature. Environ. Sci. Policy 2019, 101, 341–357. [Google Scholar] [CrossRef]
- Silva, J.; Lucas, P.; Araújo, F.; Silva, C.; Gil, P.; Cardoso, A.; Arrais, J.; Ribeiro, B.; Coutinho, D.; Salgueiro, P.; et al. An Online Platform For Real-Time Air Quality Monitoring. In Proceedings of the 2019 5th Experiment International Conference (Exp.at’19), Funchal, Portugal, 12–14 June 2019; pp. 320–325. [Google Scholar] [CrossRef]
- Kosmidis, E.; Syropoulou, P.; Tekes, S.; Schneider, P.; Spyromitros-Xioufis, E.; Riga, M.; Charitidis, P.; Moumtzidou, A.; Papadopoulos, S.; Vrochidis, S.; et al. hackAIR: Towards Raising Awareness about Air Quality in Europe by Developing a Collective Online Platform. ISPRS Int. J. Geo-Inf. 2018, 7, 187. [Google Scholar] [CrossRef]
- Kumar, P.; Morawska, L.; Martani, C.; Biskos, G.; Neophytou, M.; Sabatino, S.D.; Bell, M.; Norford, L.; Britter, R. The rise of low-cost sensing for managing air pollution in cities. Environ. Int. 2015, 75, 199–205. [Google Scholar] [CrossRef]
- Schulte, K. ‘Real-time’ air quality channels: A technology review of emerging environmental alert systems. Big Data Soc. 2022, 9, 1–25. [Google Scholar] [CrossRef]
- Uganda Buereau of Statistics (UBOS). Statistical Abstract, 2020; UBOS: Kampala, Uganda, 2020. [Google Scholar]
- Coker, E.S.; Amegah, A.K.; Mwebaze, E.; Ssematimba, J.; Bainomugisha, E. A land use regression model using machine learning and locally developed low cost particulate matter sensors in Uganda. Environ. Res. 2021, 199, 111352. [Google Scholar] [CrossRef] [PubMed]
- AirQo. Locate: AirQo Sensor Placement. 2022. Available online: https://docs.airqo.net/airqo-handbook (accessed on 4 January 2023).
- Bonaccorso, G. Machine Learning Algorithms: A Reference Guide to Popular Algorithms for Data Science and Machine Learning; Packt Publishing: Birmingham, UK, 2017. [Google Scholar]
- Sserunjogi, R.; Ssematimba, J.; Okure, D.; Ogenrwot, D.; Adong, P.; Muyama, L.; Nsimbe, N.; Bbaale, M.; Bainomugisha, E. Seeing the air in detail: Hyperlocal air quality dataset collected from spatially distributed AirQo network. Data Brief 2022, 44, 108512. [Google Scholar] [CrossRef] [PubMed]
- NEMA. Stakeholders Call for Multi-Sectoral Approach to Reduce Air Pollution. 2021. Available online: https://nema.go.ug/sites/default/files/Air%20Quality%20Awareness%20Week%20Statement.pdf (accessed on 4 January 2023).
- AirQo. Helping Communities Combat Air Pollution through Digital Technologies. 2022. Available online: https://blog.airqo.net/helping-communities-combat-air-pollution-through-digital-technologies-6a5924a1e1e (accessed on 4 January 2023).
- Okello, G.; Nantanda, R.; Awokola, B.; Thondoo, M.; Okure, D.; Tatah, L.; Bainomugisha, E.; Oni, T. Air quality management strategies in Africa: A scoping review of the content, context, co-benefits and unintended consequences. Environ. Int. 2023, 171, 107709. [Google Scholar] [CrossRef] [PubMed]
- Bank, W. Pollution Management and the Making of Prosperous. 2020. Available online: https://documents1.worldbank.org/curated/en/716251593371242345/pdf/Final-Report.pdf (accessed on 4 January 2023).
- Atuhaire, C.; Gidudu, A.; Bainomugisha, E.; Mazimwe, A. Determination of Satellite-Derived PM2.5 for Kampala District, Uganda. Geomatics 2022, 2, 125–143. [Google Scholar] [CrossRef]
- Clarke, K.; Ash, K.; Coker, E.S.; Sabo-Attwood, T.; Bainomugisha, E. A Social Vulnerability Index for Air Pollution and Its Spatially Varying Relationship to PM2.5 in Uganda. Atmosphere 2022, 13, 1169. [Google Scholar] [CrossRef]
- Galiwango, R.; Bainomugisha, E.; Kivunike, F.; Kateete, D.P.; Jjingo, D. Air pollution and mobility patterns in two Ugandan cities during COVID-19 mobility restrictions suggest the validity of air quality data as a measure for human mobility. Environ. Sci. Pollut. Res. 2022, 1–16. [Google Scholar] [CrossRef]
- Green, P.; Okure, D.; Adong, P.; Sserunjogi, R.; Bainomugisha, E. Exploring PM2.5 variations from calibrated low-cost sensor network in Greater Kampala, during COVID-19 imposed lockdown restrictions: Lessons for Policy. Clean Air J. 2022, 32, e10906. [Google Scholar] [CrossRef]
Disclaimer/Publisher’s Note: The statements, opinions and data contained in all publications are solely those of the individual author(s) and contributor(s) and not of MDPI and/or the editor(s). MDPI and/or the editor(s) disclaim responsibility for any injury to people or property resulting from any ideas, methods, instructions or products referred to in the content. |
© 2023 by the authors. Licensee MDPI, Basel, Switzerland. This article is an open access article distributed under the terms and conditions of the Creative Commons Attribution (CC BY) license (https://creativecommons.org/licenses/by/4.0/).