A Low-Cost Calibration Method for Temperature, Relative Humidity, and Carbon Dioxide Sensors Used in Air Quality Monitoring Systems
Abstract
1. Introduction
2. Materials and Methods
2.1. Sensors Used with the Low-Cost Monitoring System
2.2. Design of a Low-Calibration Laboratory
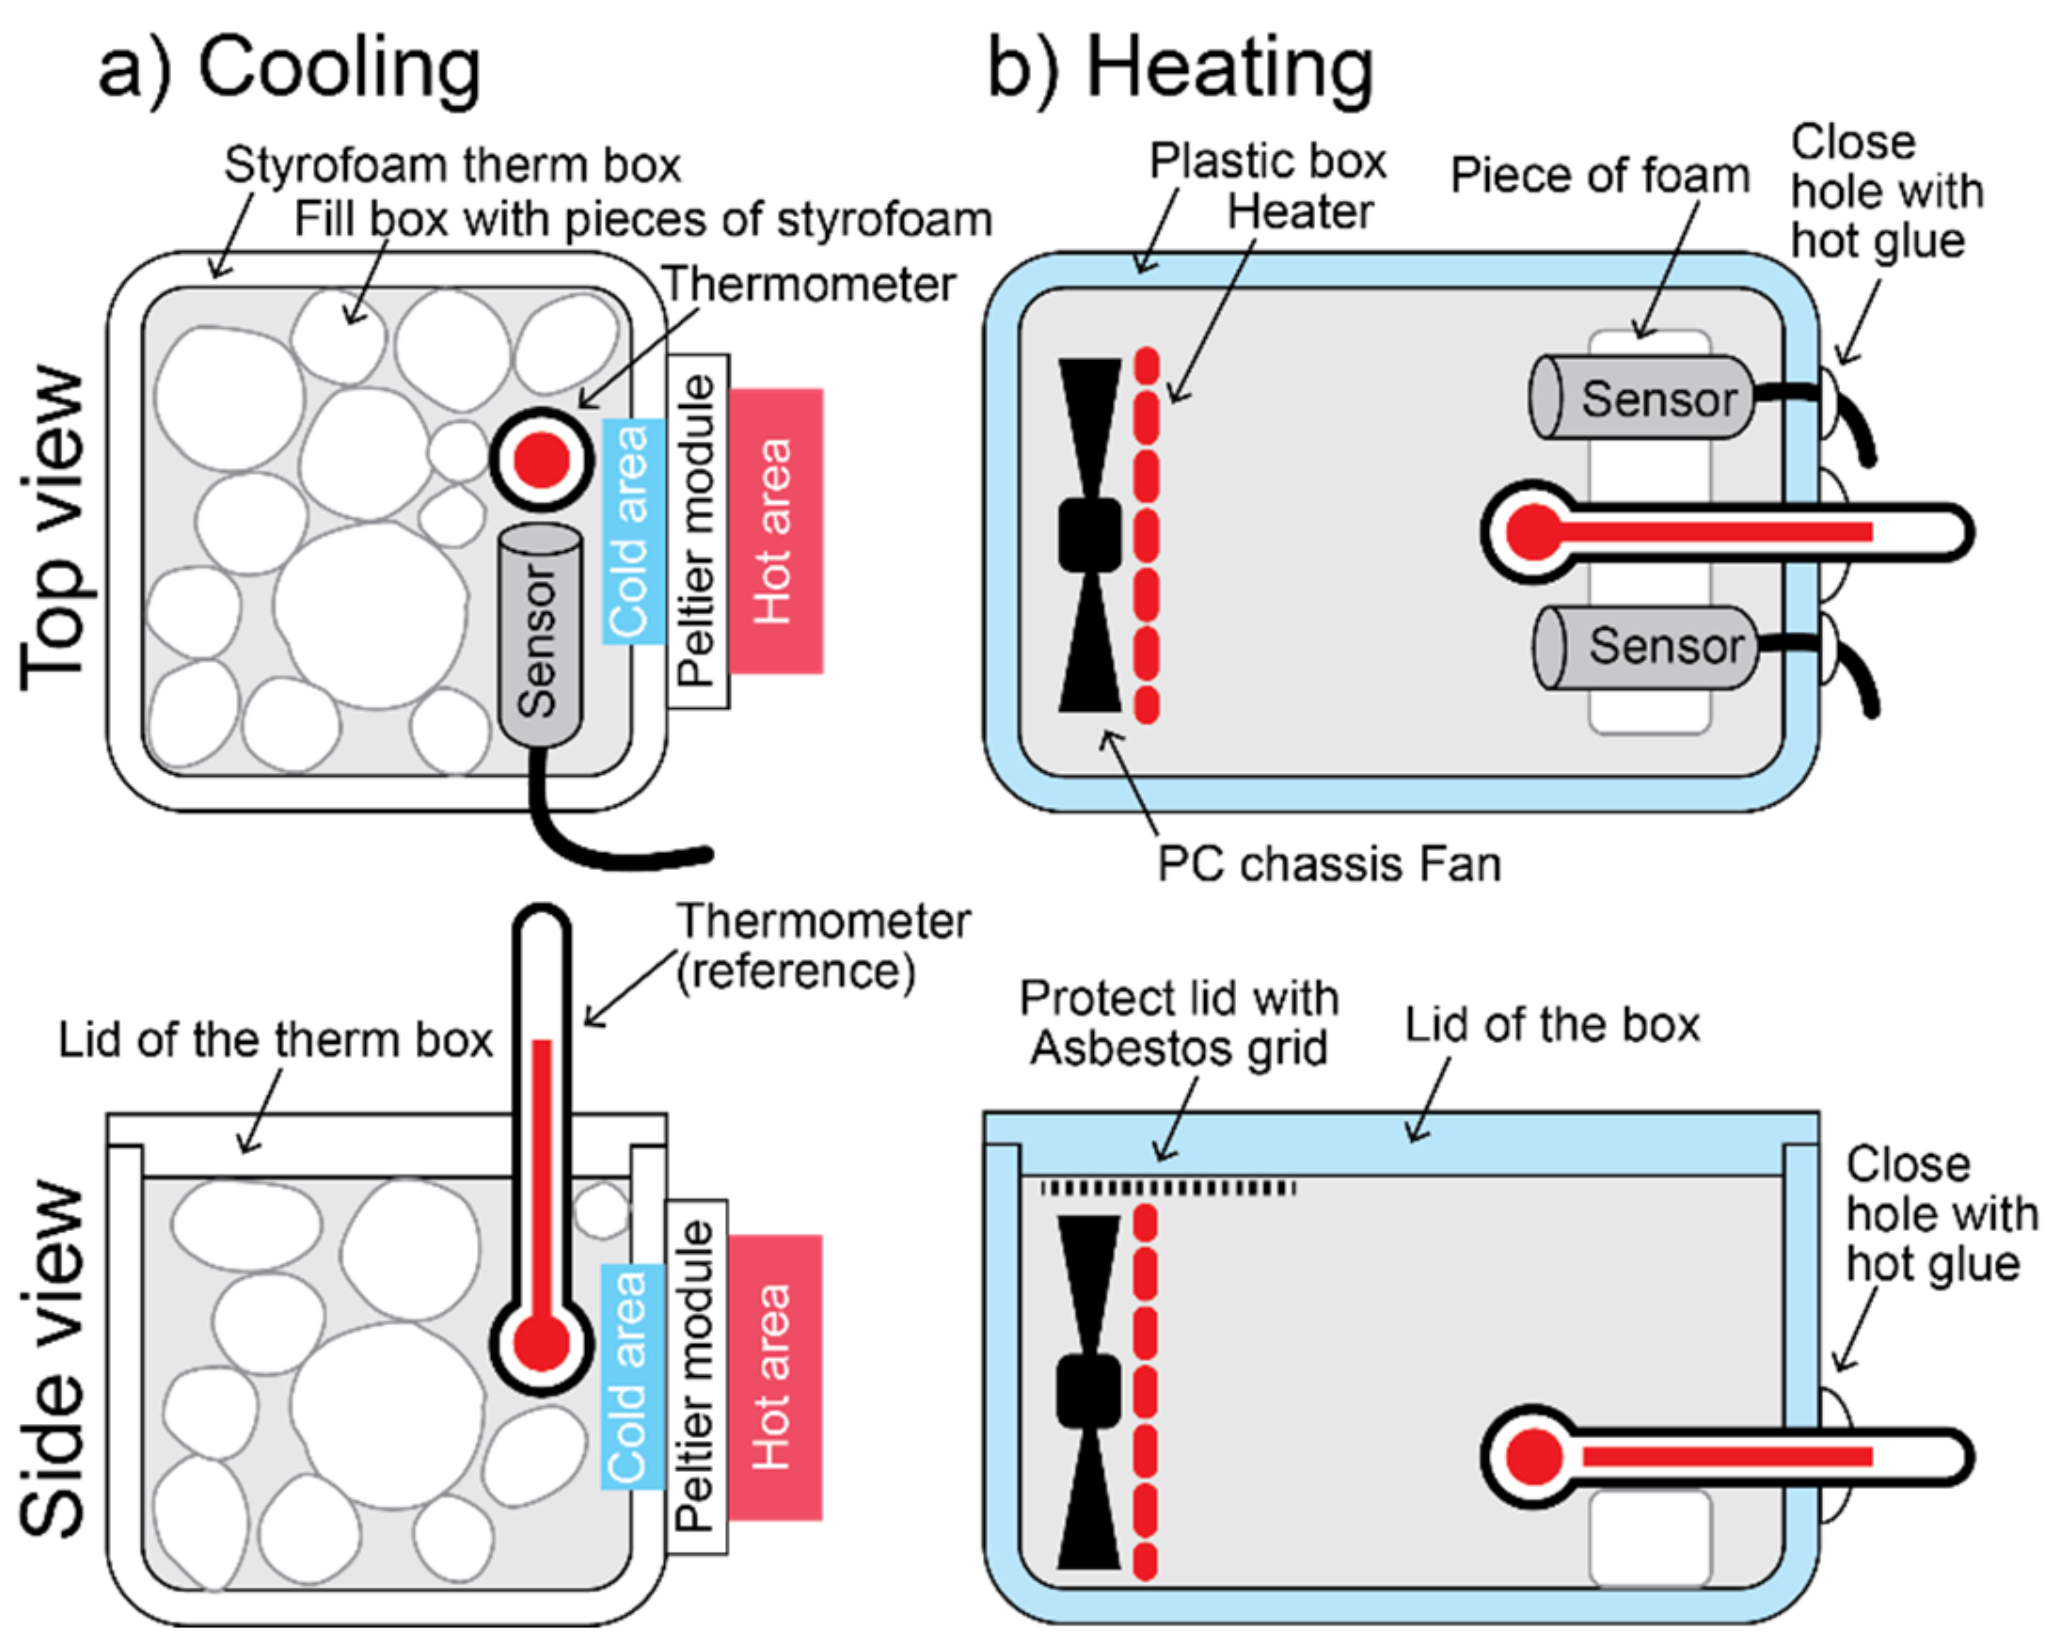
2.3. Temperature Calibration
2.4. Relative Humidity Calibration
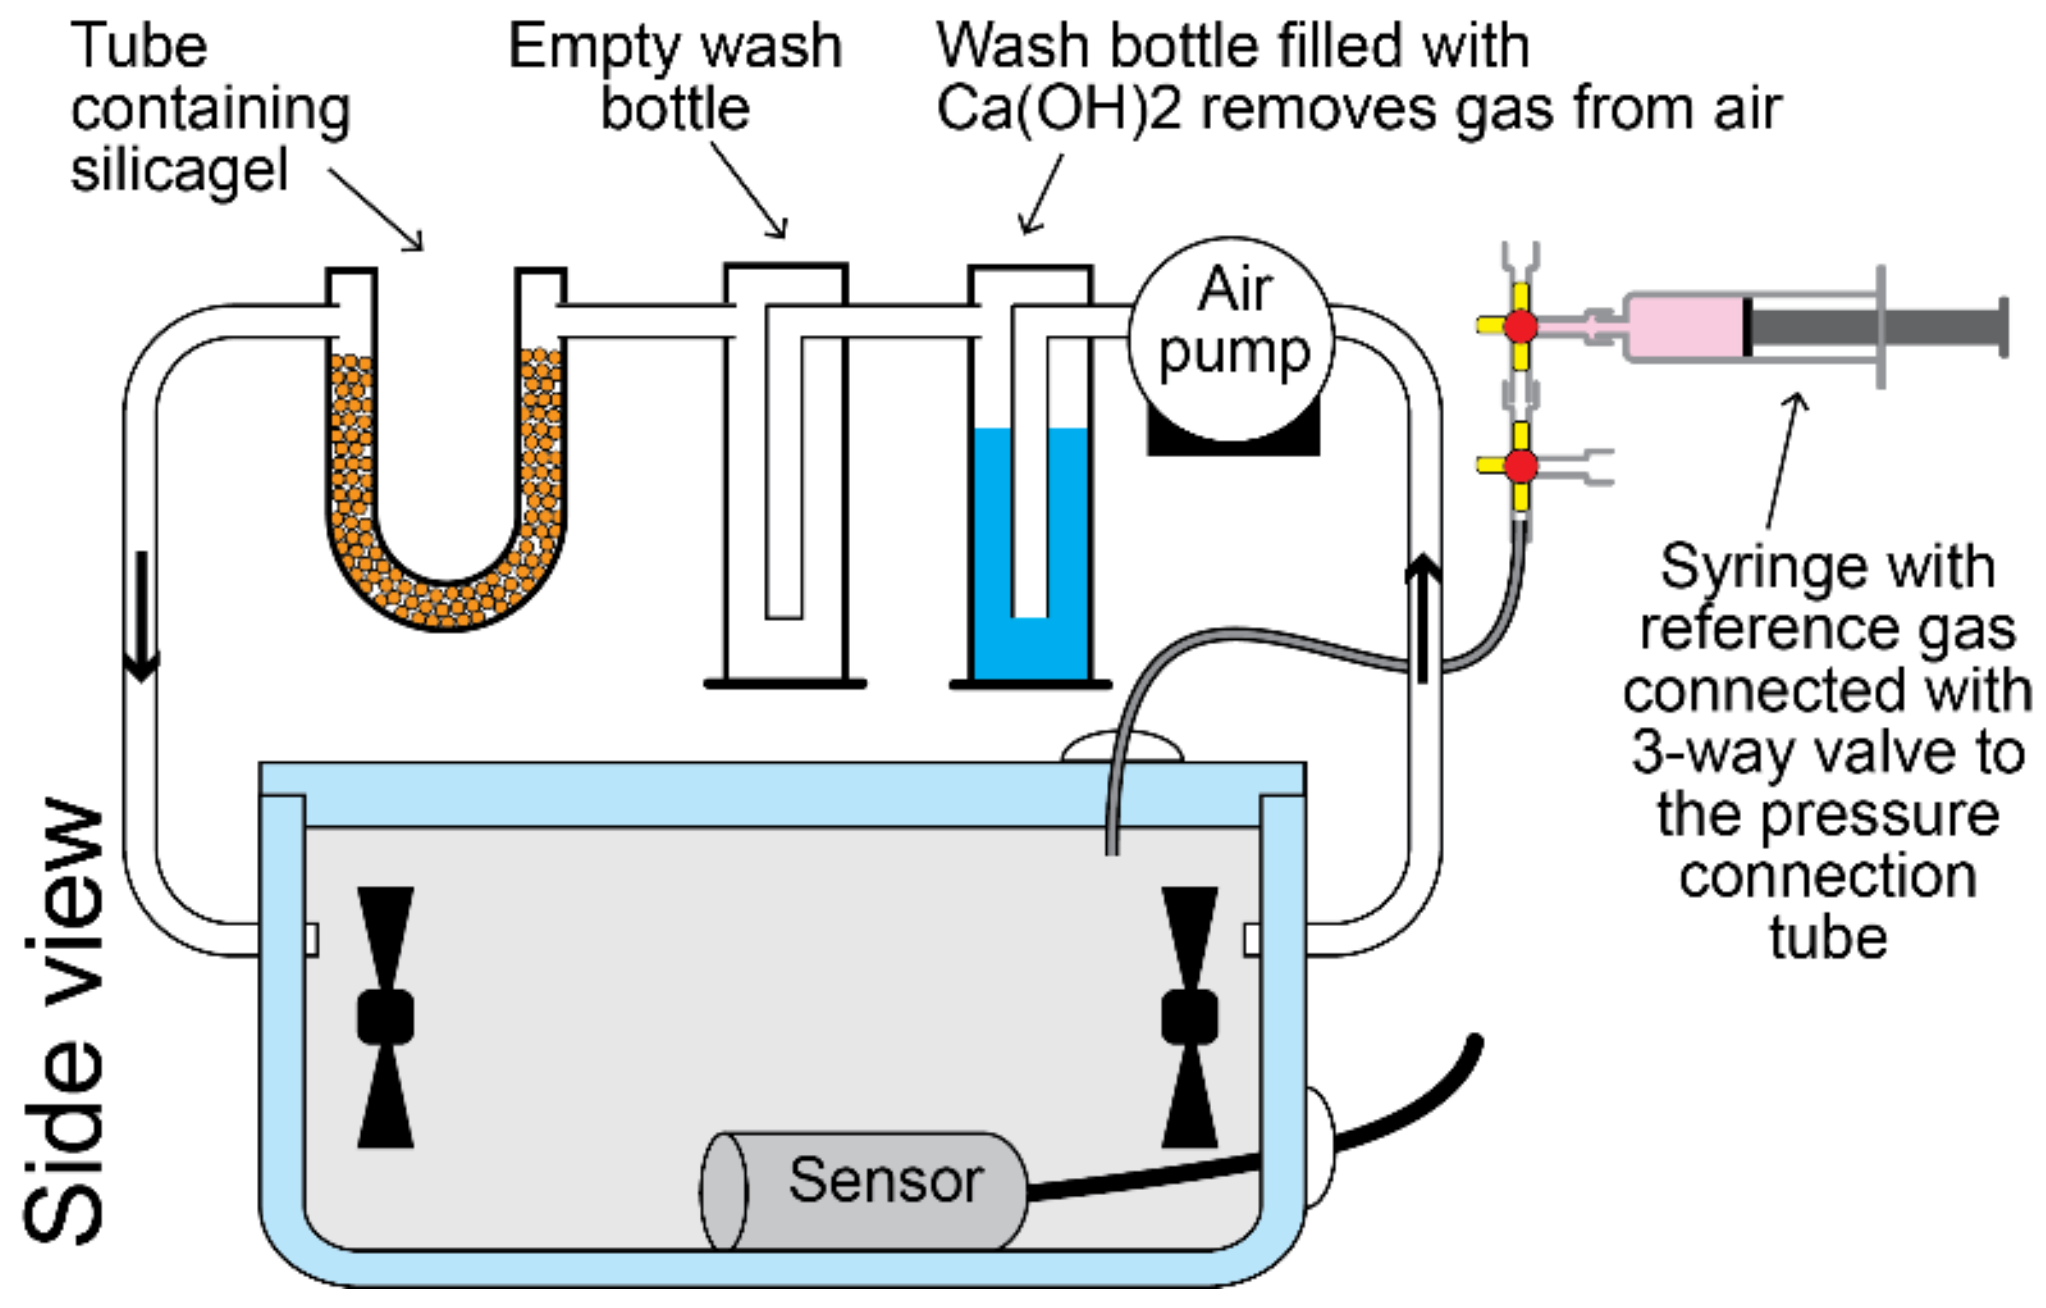
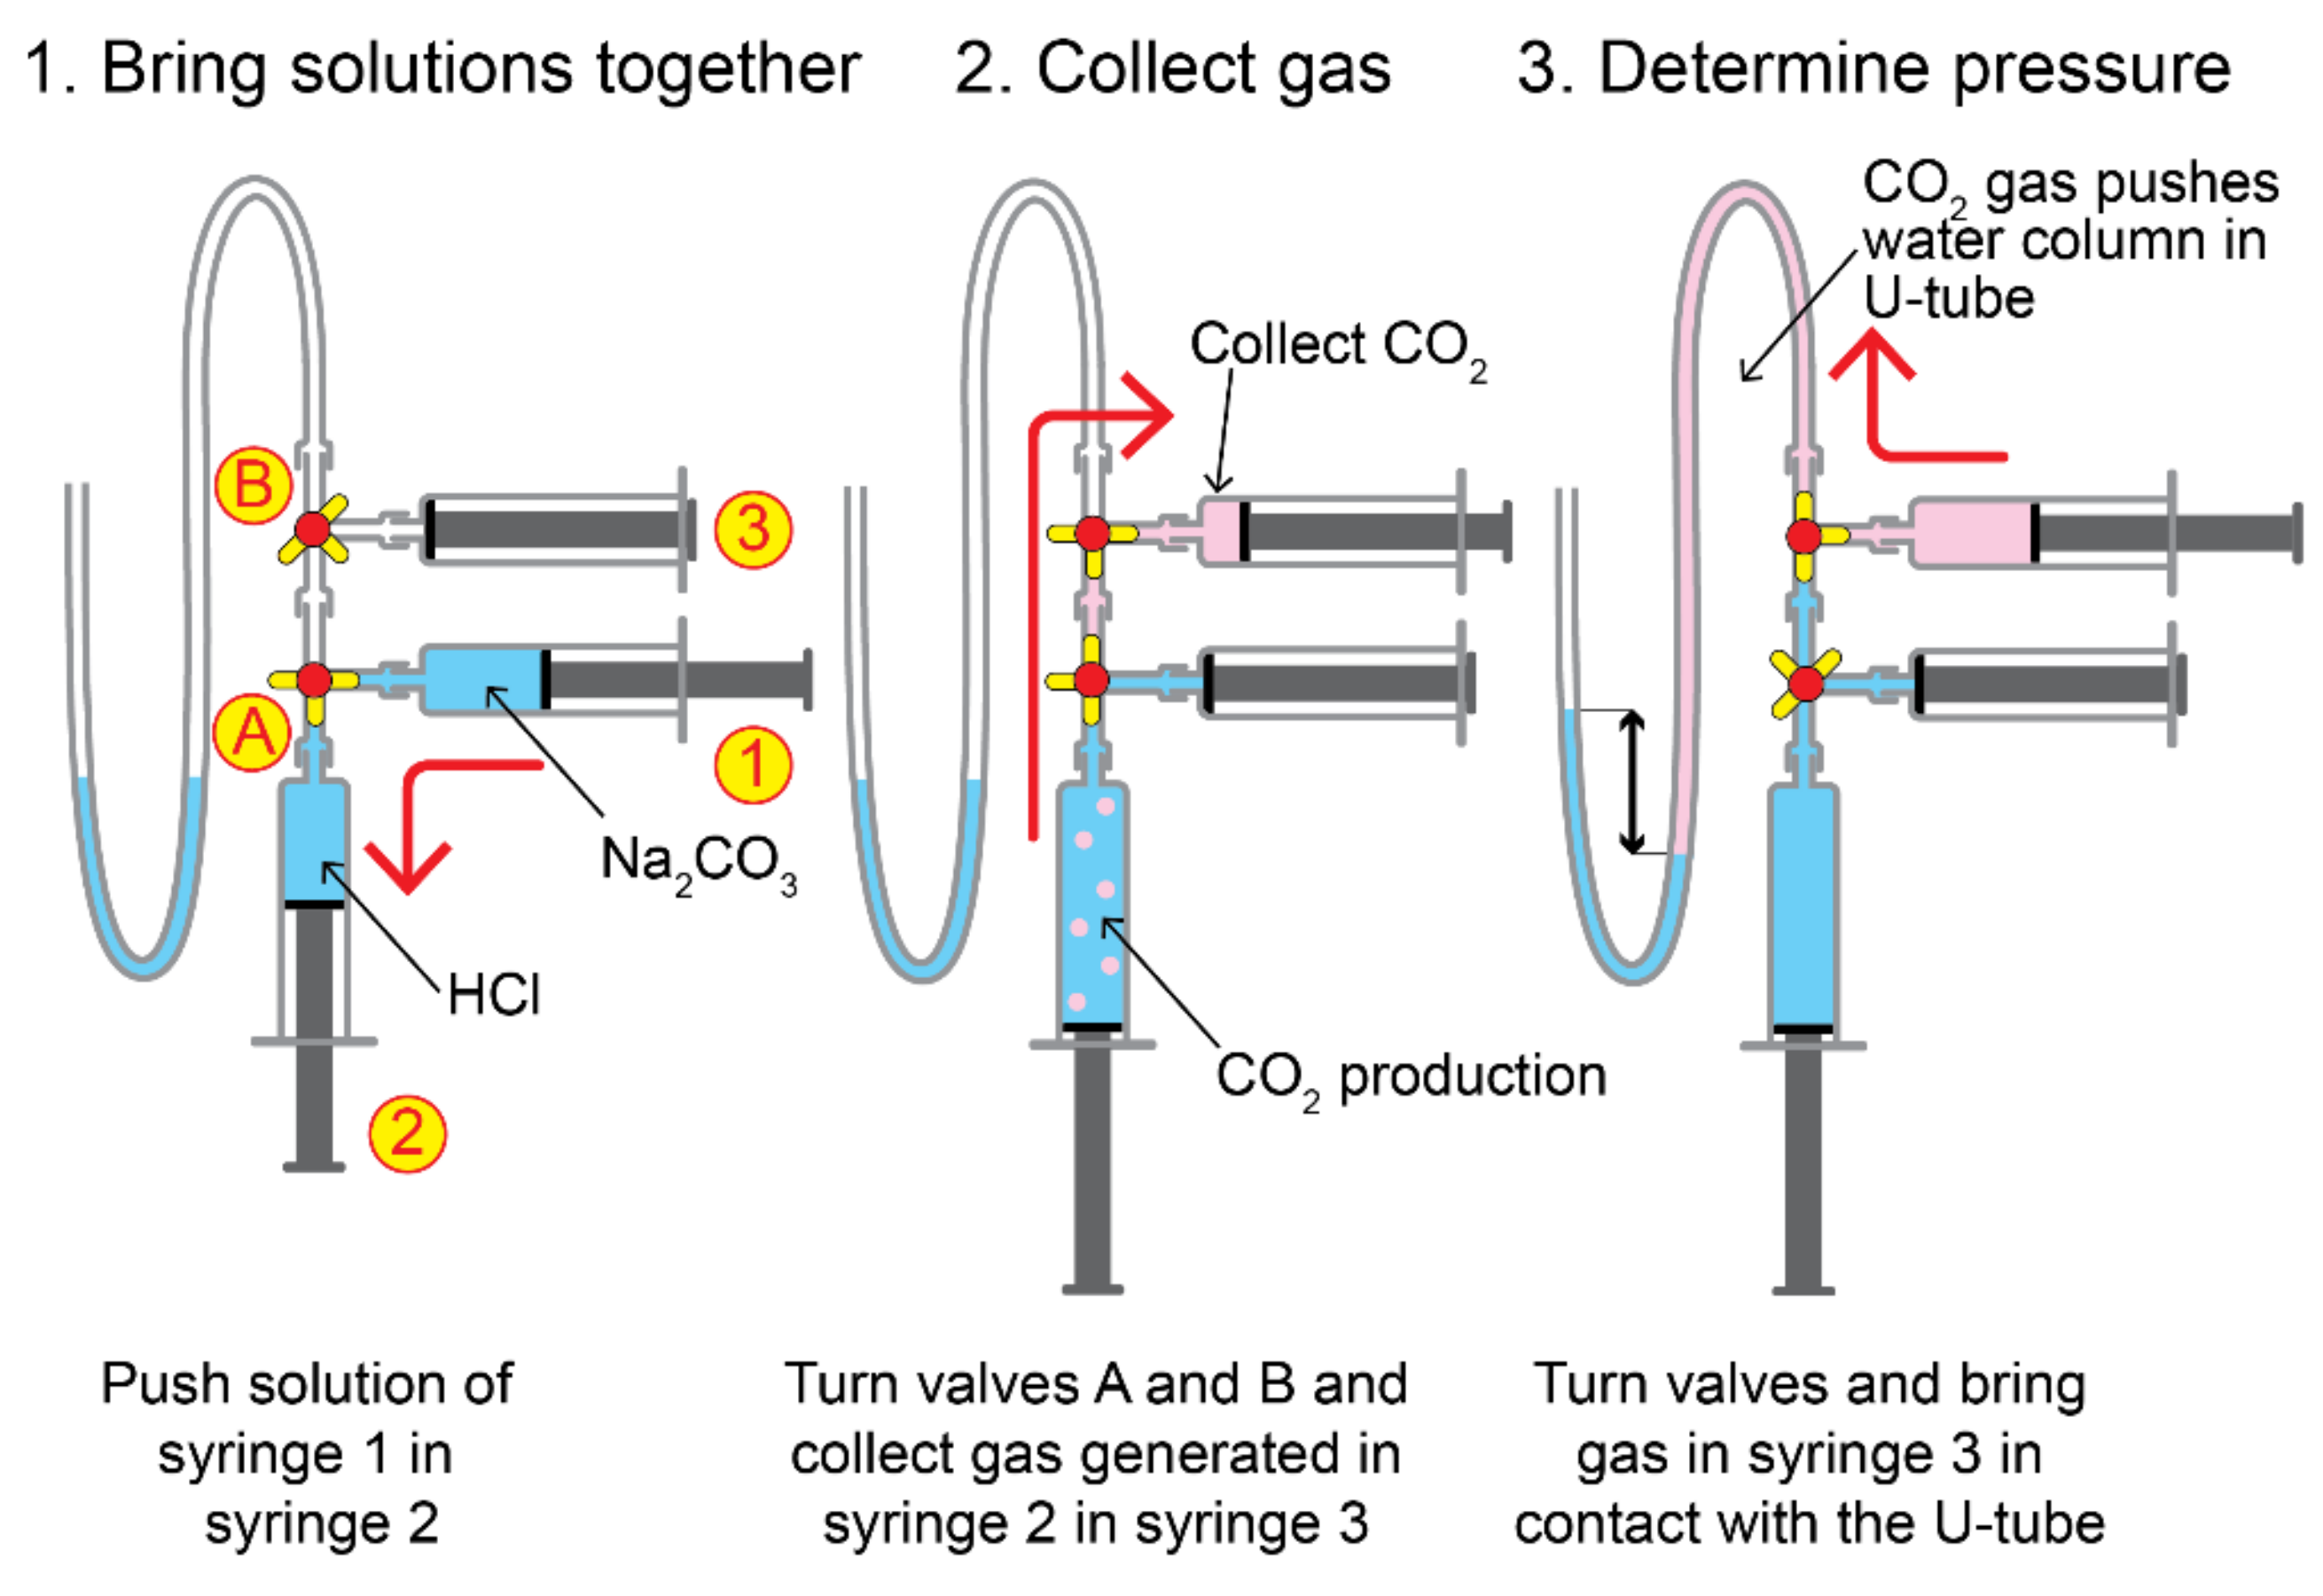
2.5. Calibration of Gas Sensors
2.6. Reliability of Low-Cost Calibration Methods
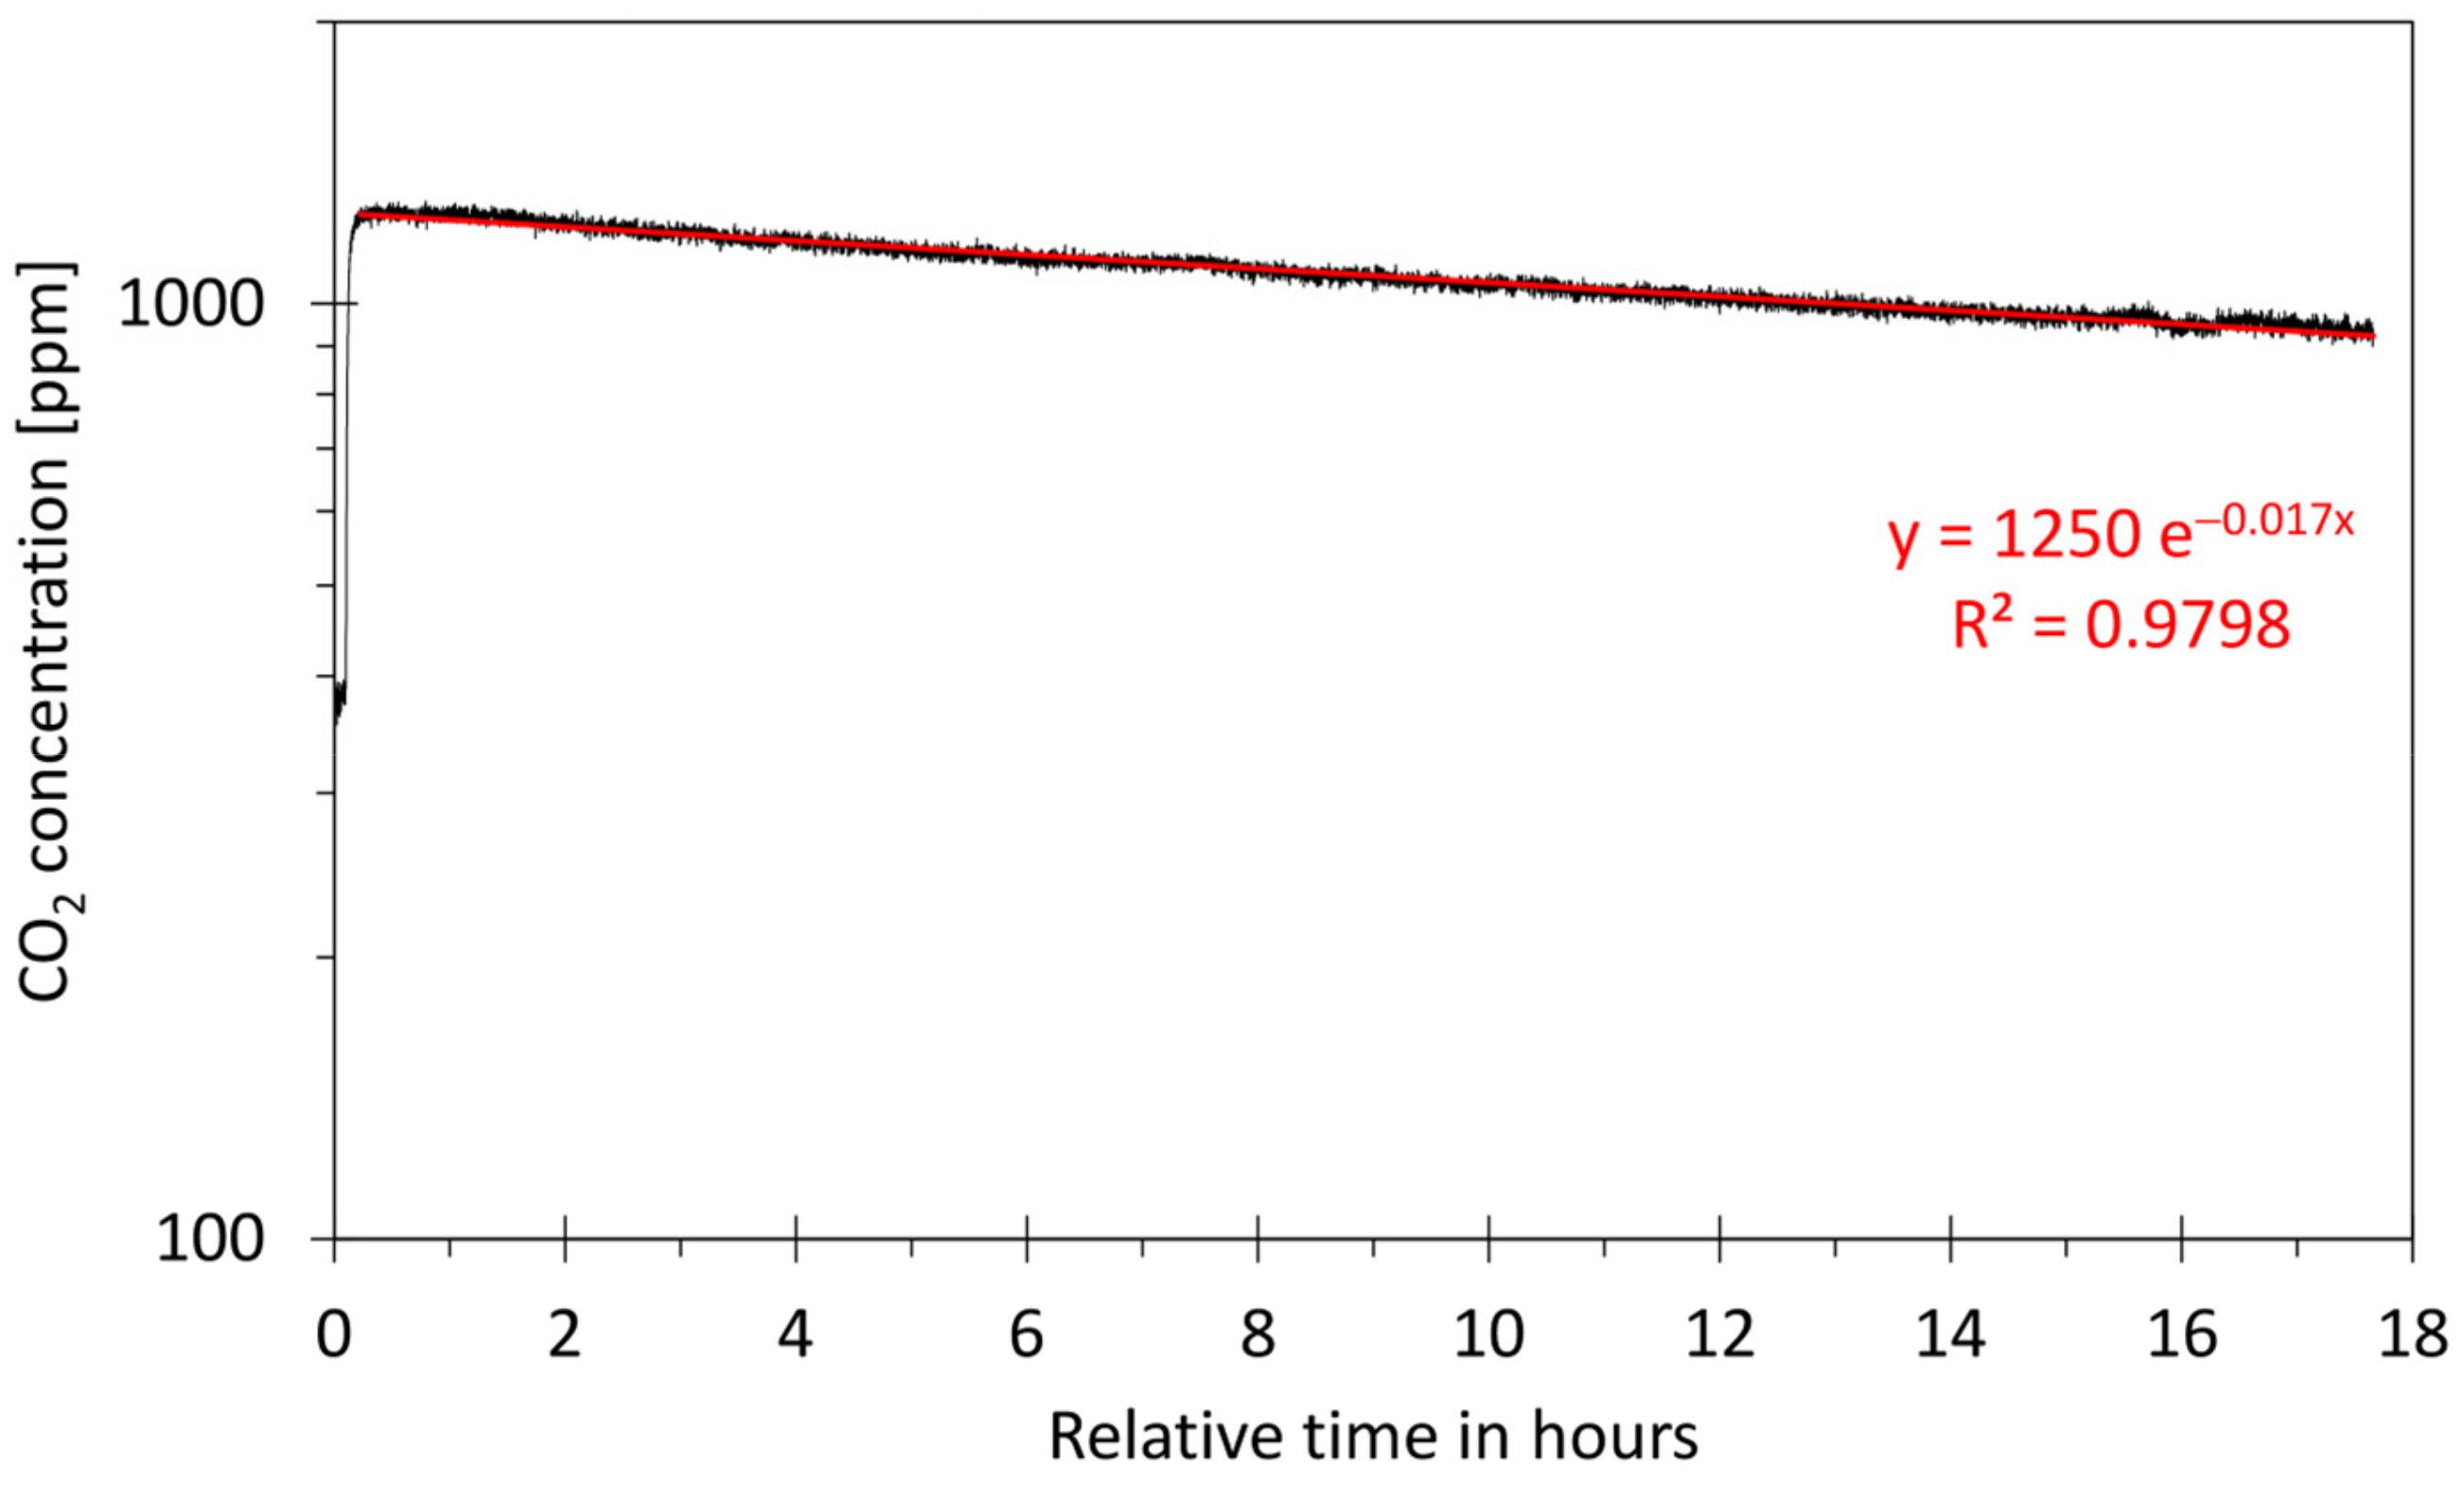
- Airtightness of the calibration box: When the calibration box is not completely airtight, the calibration conditions will gradually degrade over time. To evaluate the importance of leakages, the tracer gas method was used. For this, the background concentration of CO2 in ambient air was measured first. Then, about 5 mL of CO2 was introduced into the calibration box using a syringe so that the CO2 concentration inside the box was substantially higher than outside the box. After some minutes, the sensor reached a stable value. The exponential decay of the tracer gas in the box was monitored for a period of about 20 h. The air exchange rate, which is expressed in air change per hour (h−1), was calculated with the formulas given in the Supplementary Material [77,78,79,80,81,82]. A calibration box that was sufficiently airtight throughout the calibration experiment (<5% of the total volume) is an indication that the method used was sufficiently valid;
- Similarity with the factory-calibration: Some sensors, such as the ones measuring T, RH, or CO2, are often factory-calibrated. Although their calibration is often not well documented and unreliable [83], the measurements can be expected to have at least some similarity to the reference values. Therefore, the calibration curve is expected to be linear with an intercept and a slope around 0 and 1, respectively. A strong deviation from that expectation is an indication that something is wrong with the calibration (or with the sensor). This test is only valid for new sensors because they age over time and their calibration will change;
- Similarity with the reference: For some calibration methods, the parameter to be measured is changed according to a predefined test program. A strong deviation of the sensor from the imposed test program is an indication that something is wrong;
- Similarity between different sensors: If identical sensors or a set of factory-calibrated sensors are simultaneously calibrated, then minor differences between the calibration curves are expected;
- Replicability of the calibration method: When a calibration method is applied on different sensors of the same type using different calibration boxes, different equipment, and different regions (i.e., what is the effect of the high RH in a tropical climate?), the calibration curves are expected to be similar. The occurrence of significant differences between the experiments indicate a lack of replicability;
- Similarity with a golden standard: The calibration of the T/RH sensors was also performed by VITO, Belgium, using a closed stainless-steel exposure test chamber (Weiss Technik, Germany) with a total internal volume of the chamber at 1.0 m³. During the performed tests, the exposure test chamber was supplied with a constant and controlled flow of clean humidified air. The environmental conditions inside the chamber were constantly controlled and changed according to a test program to realize a consecutive series of T and RH levels. The homogeneity of the chamber’s inner atmosphere was provided by an active mixer installed next to the inlet of the chamber. The T and RH inside the exposure test chamber were continuously monitored and recorded using integrated and calibrated T/RH monitors mounted near the exhaust of the chamber. The reference monitoring devices are yearly calibrated by Weiss. During the development stage of low-cost calibration methods, it is useful to compare low-cost calibrations with reference calibrations that are considered as the golden standard. The more resemblances there are between both calibration curves, the more reliable the low-cost calibration method is.
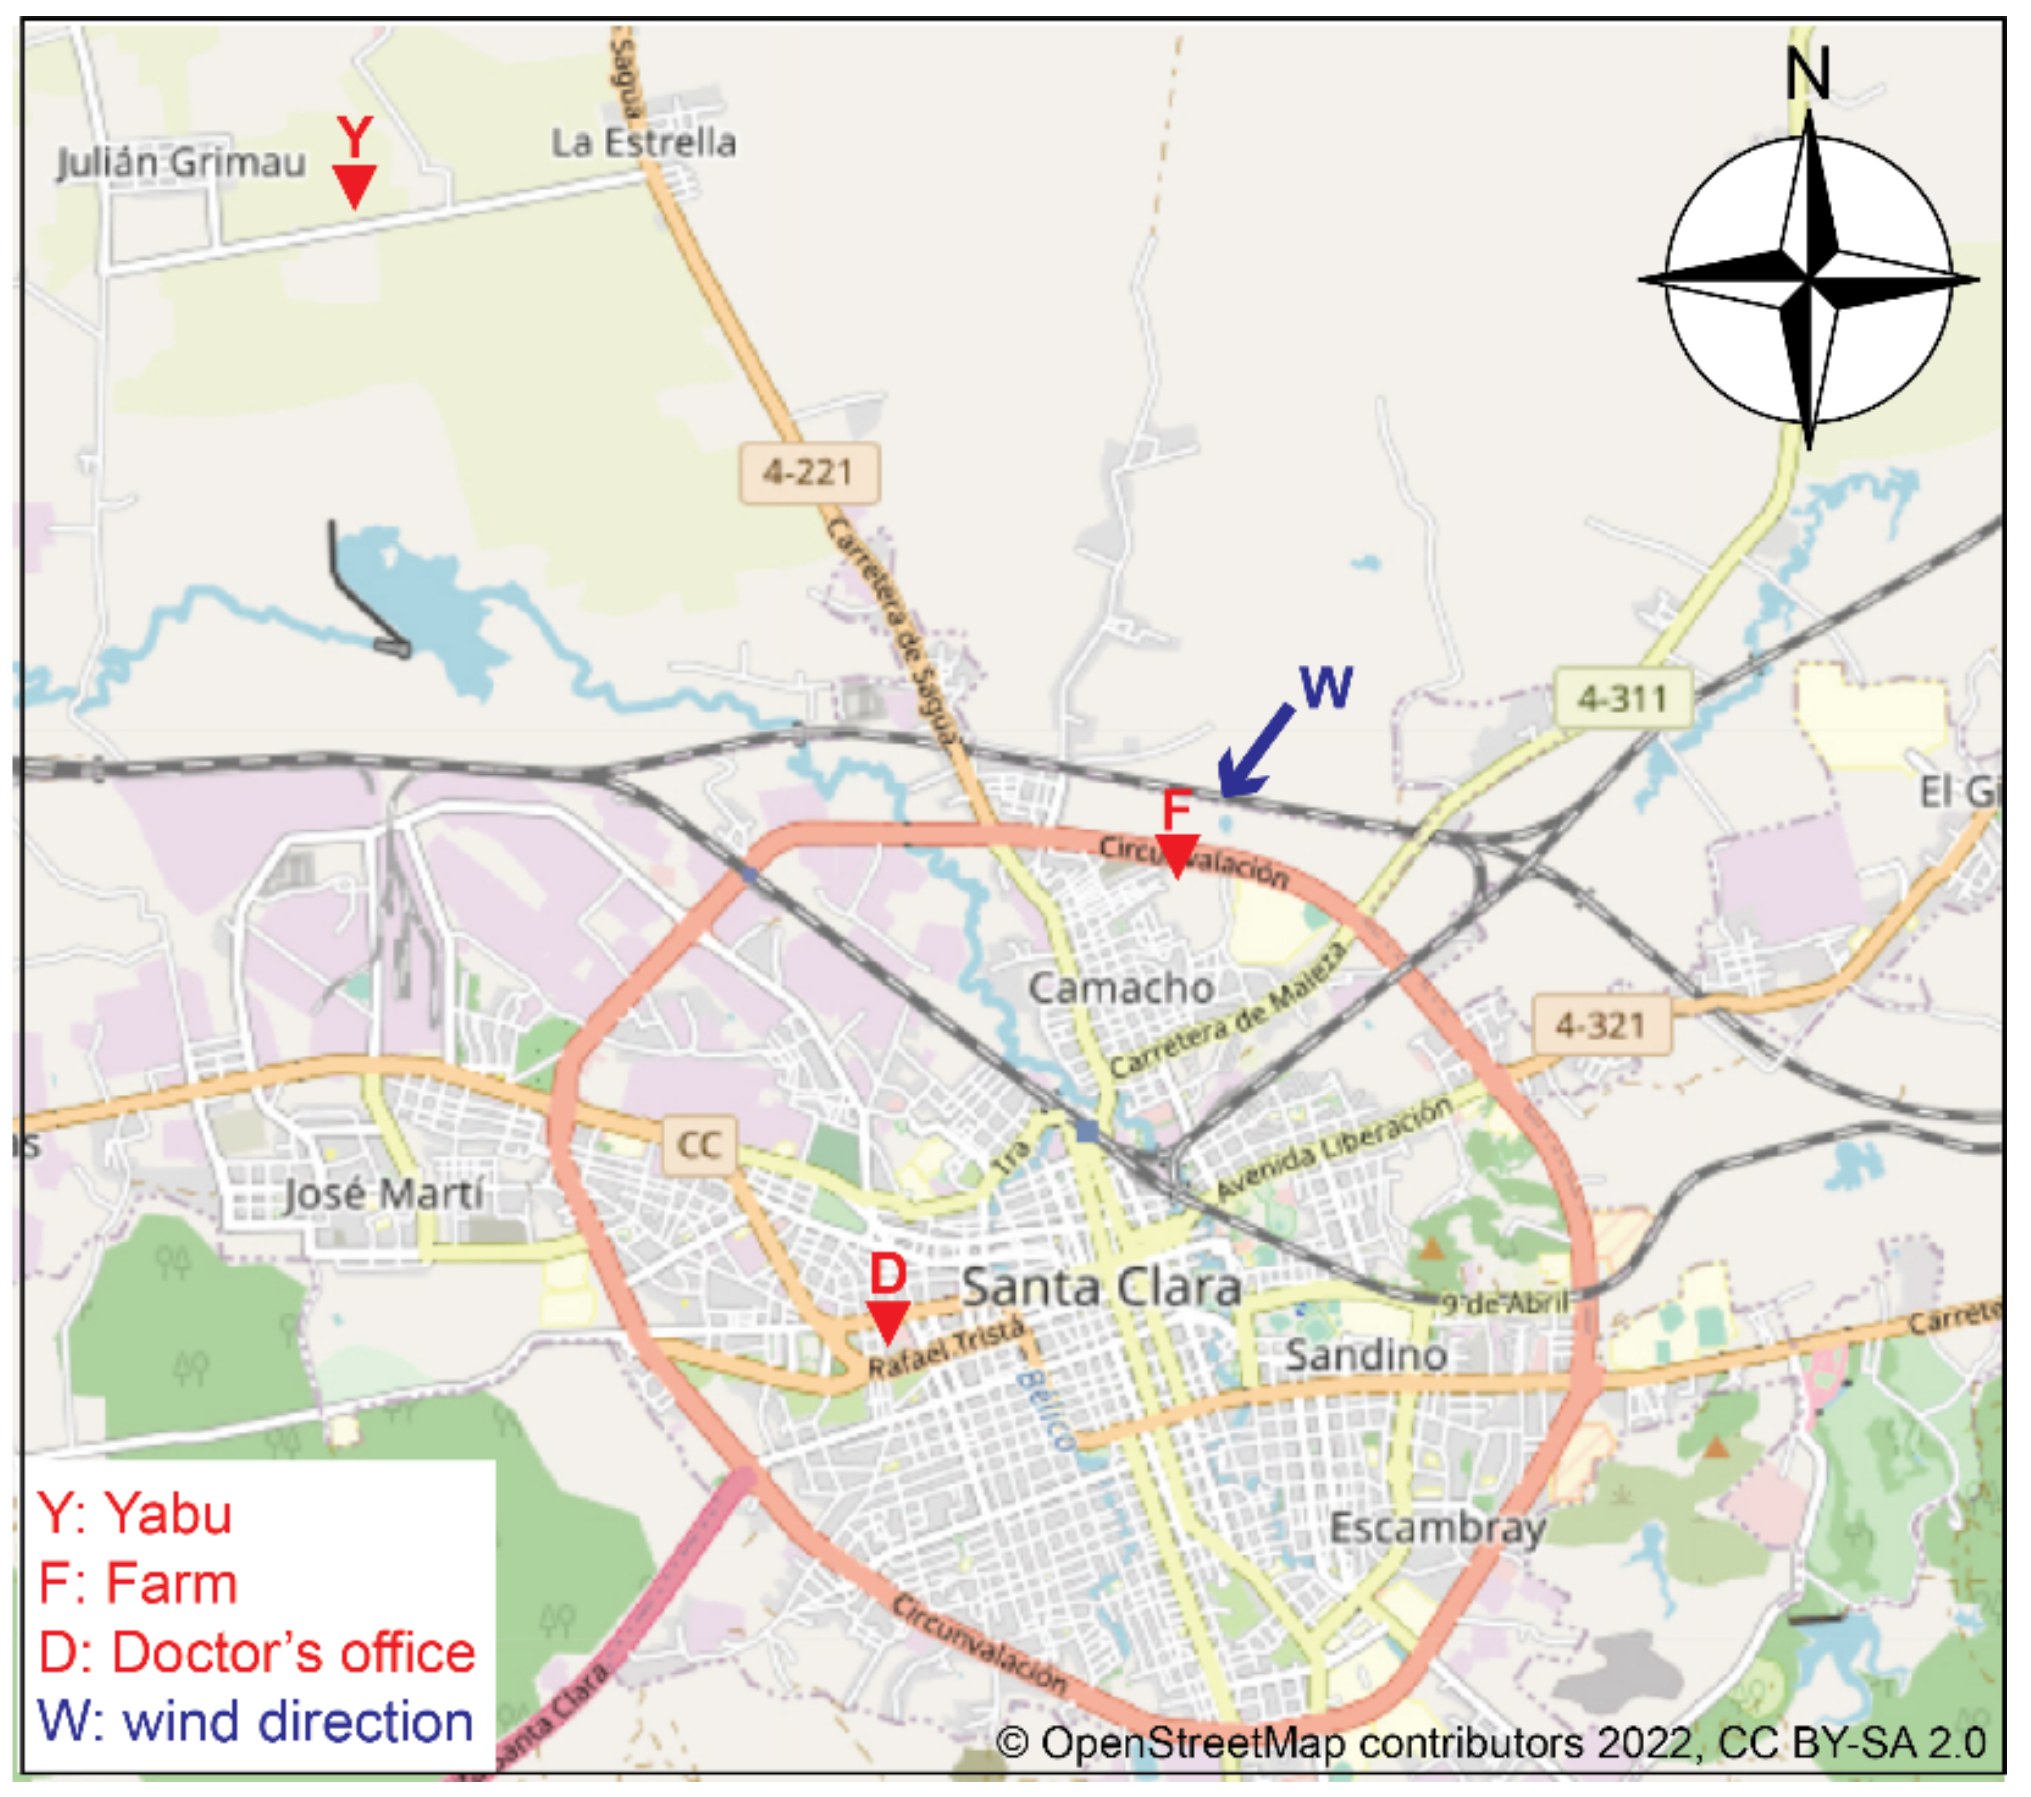
2.7. Field Study
3. Results and Discussion
3.1. Airtightness of the Calibration Boxes
3.2. Temperature Calibration
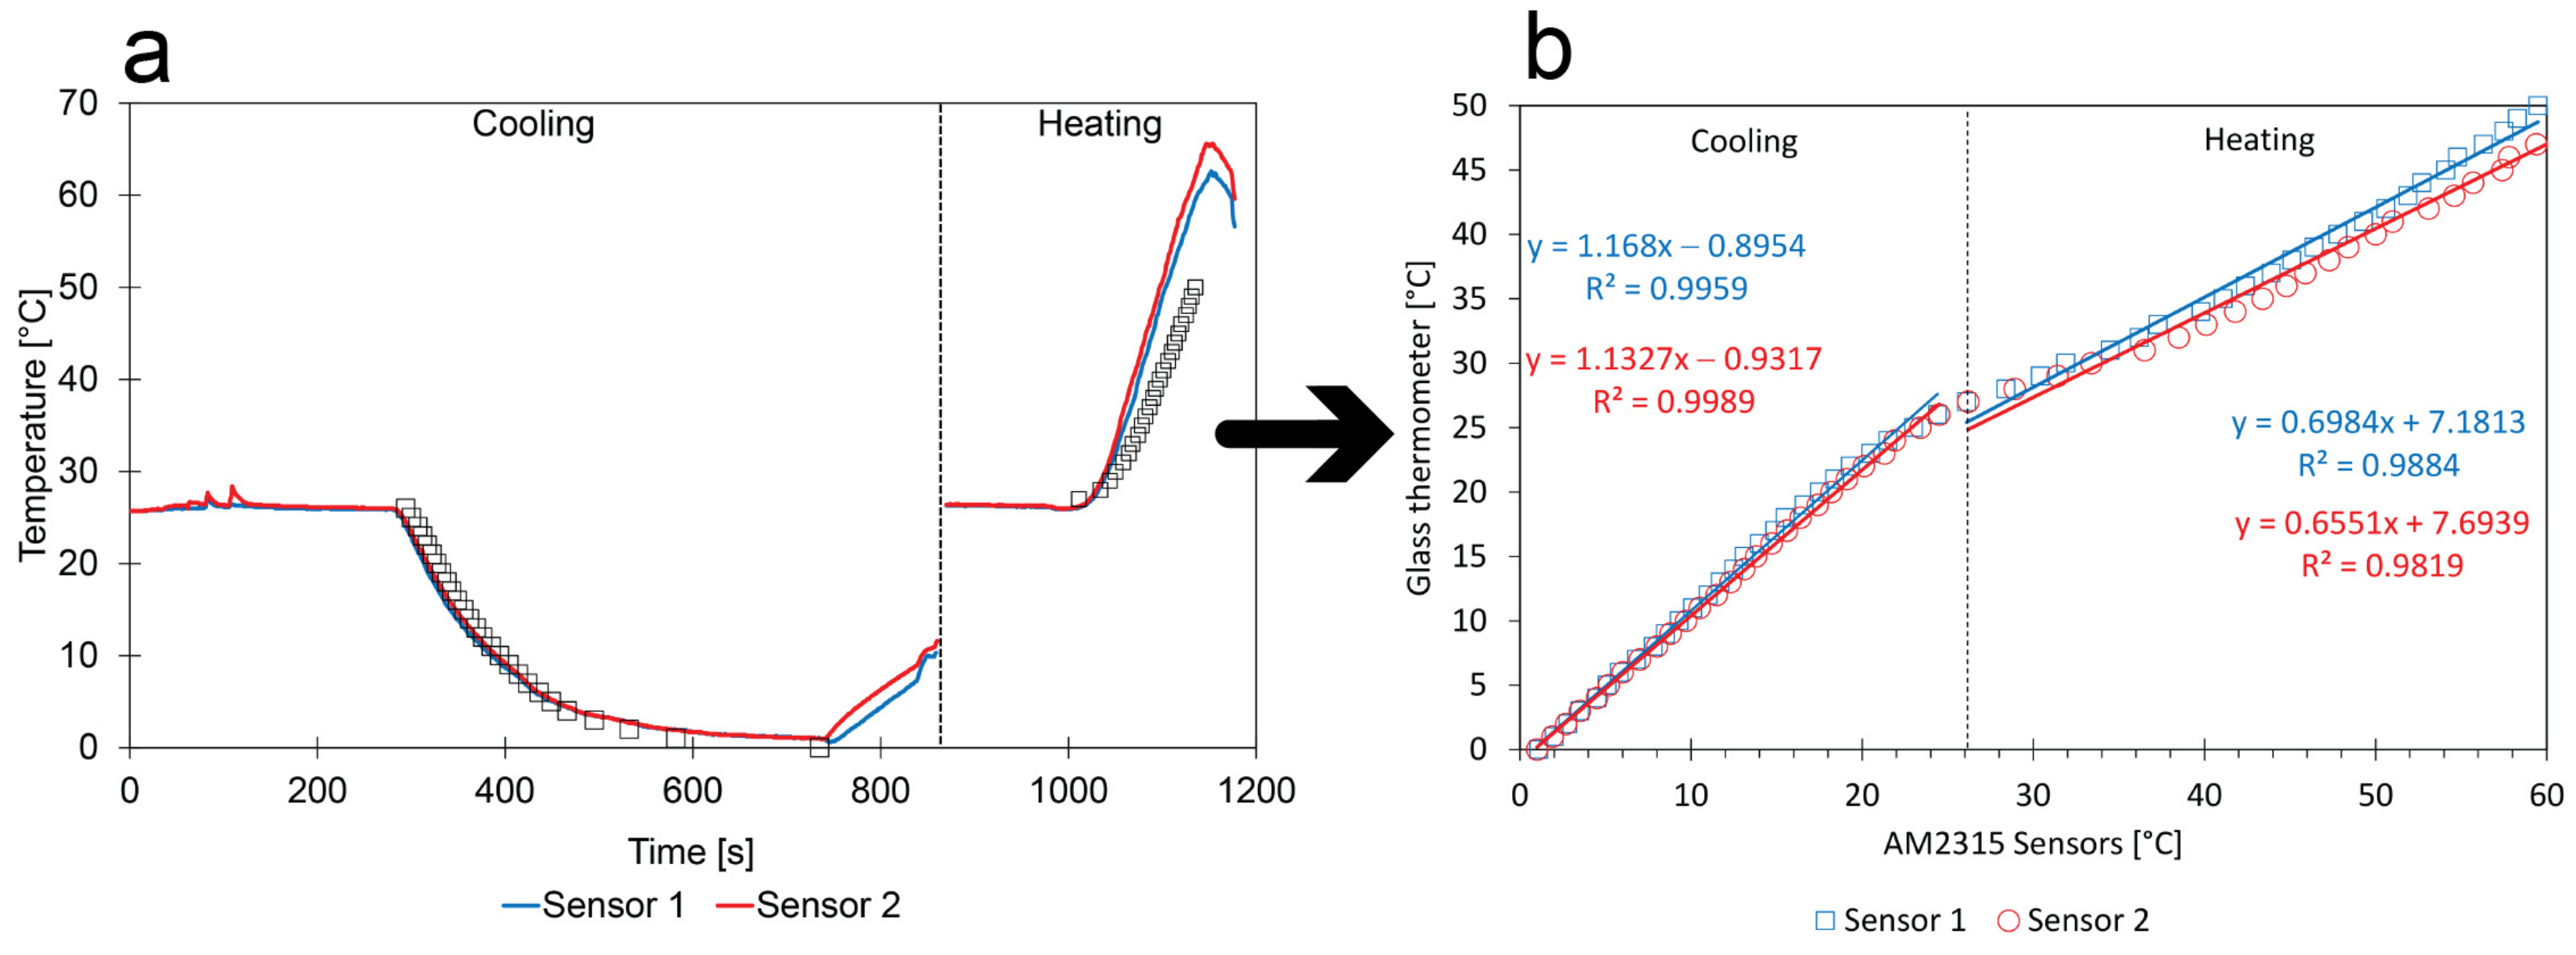
- Calibration method: The uncontrolled test program could be monitored with a glass thermometer. The calibration curve was obtained by plotting the sensor measurements with the corresponding glass thermometer measurements observed at the same moment;
- Low impact of random errors: The scattering of the calibration points around the linear regressions is small, suggesting that the method resulted in small random errors;
- Comparison between sensors: There is a good similarity between the calibration curves of the two different sensors. Even when the calibration contains a constant error, it is still possible to compensate for calibration differences between sensors;
- Comparison with factory-calibration: In the early stage of the lifetime of factory-calibrated sensors, the low-cost calibration and factory-calibration should match. For the cooling process, this was indeed the case, but not for the heating process;
- Comparison with the reference: During the heating process, there is no close similarity between sensor and glass thermometer measurements (see Figure 7a). In principle, a polynomial regression with order 3 can be used to describe the entire set of calibration points in Figure 7b covering the total range of 0–63 °C (i.e., correlation coefficient: 0.9979 and 0.9987 for sensors 1 and 2, respectively). However, the indicators used to evaluate the calibration methods suggest that the reliability of the heating process must be checked more closely.
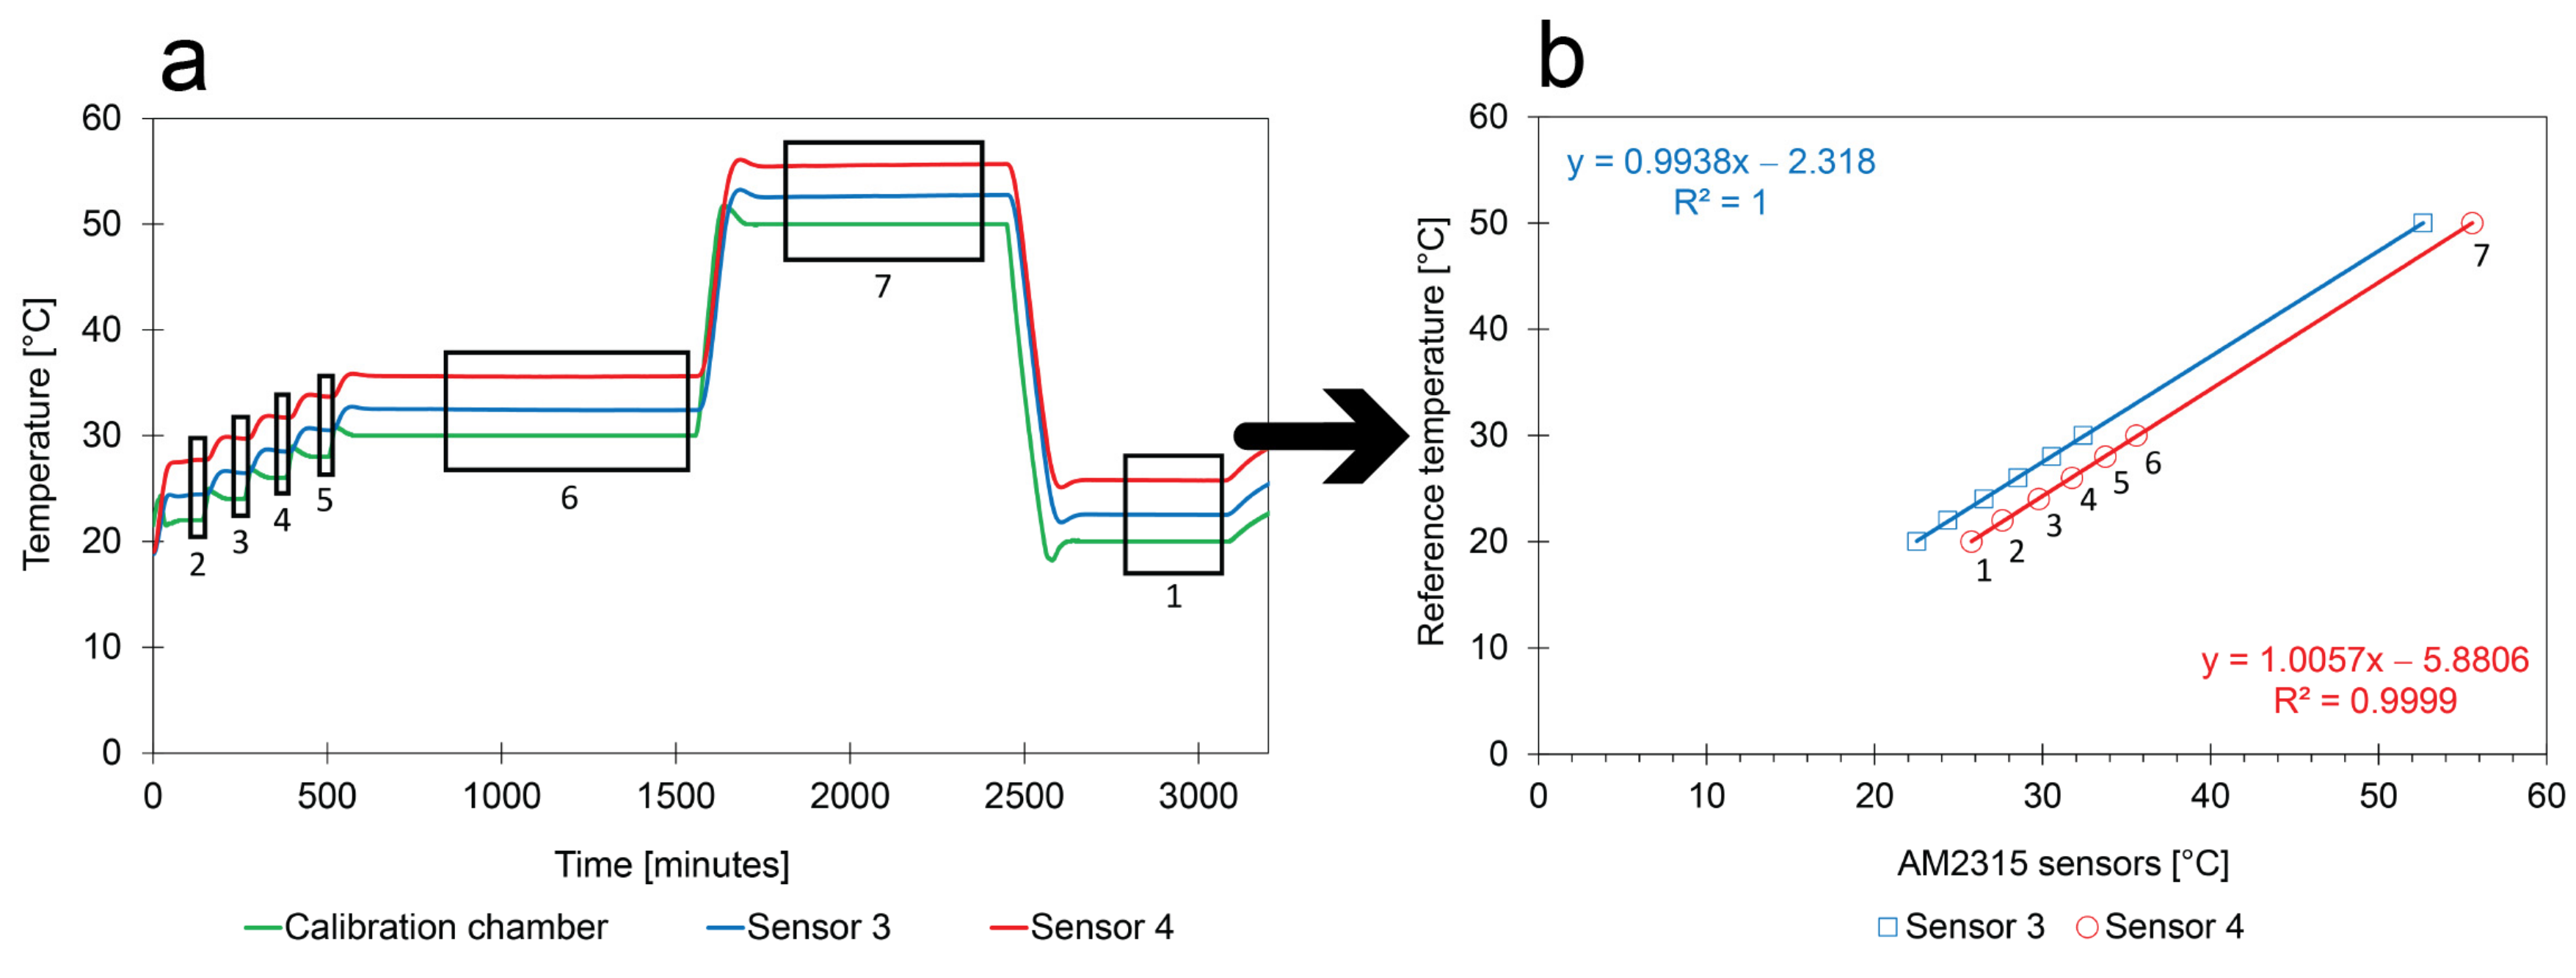
- Calibration method: Only a limited number of periods have a stable but known T. These periods are numbered in Figure 8. The average temperatures were calculated for the second half of the plateaus because the chamber and the sensors needed some time to reach equilibrium;
- Comparison between sensors and with reference: The behavior of the sensors and the test program as measured by the reference instrument show similar trends over time. In addition, there is a similarity between the calibration curves of the two different sensors (i.e., a linear trend, a slope of around 1). However, the intercepts are clearly different from 0, suggesting that the quality of pre-calibrated sensors needs to be improved before they can be used in the field tests. In addition, it shows that the calibration during the heating process shown in Figure 7 is incorrect. The other indicators appear to be sensitive enough to identify the calibration error.
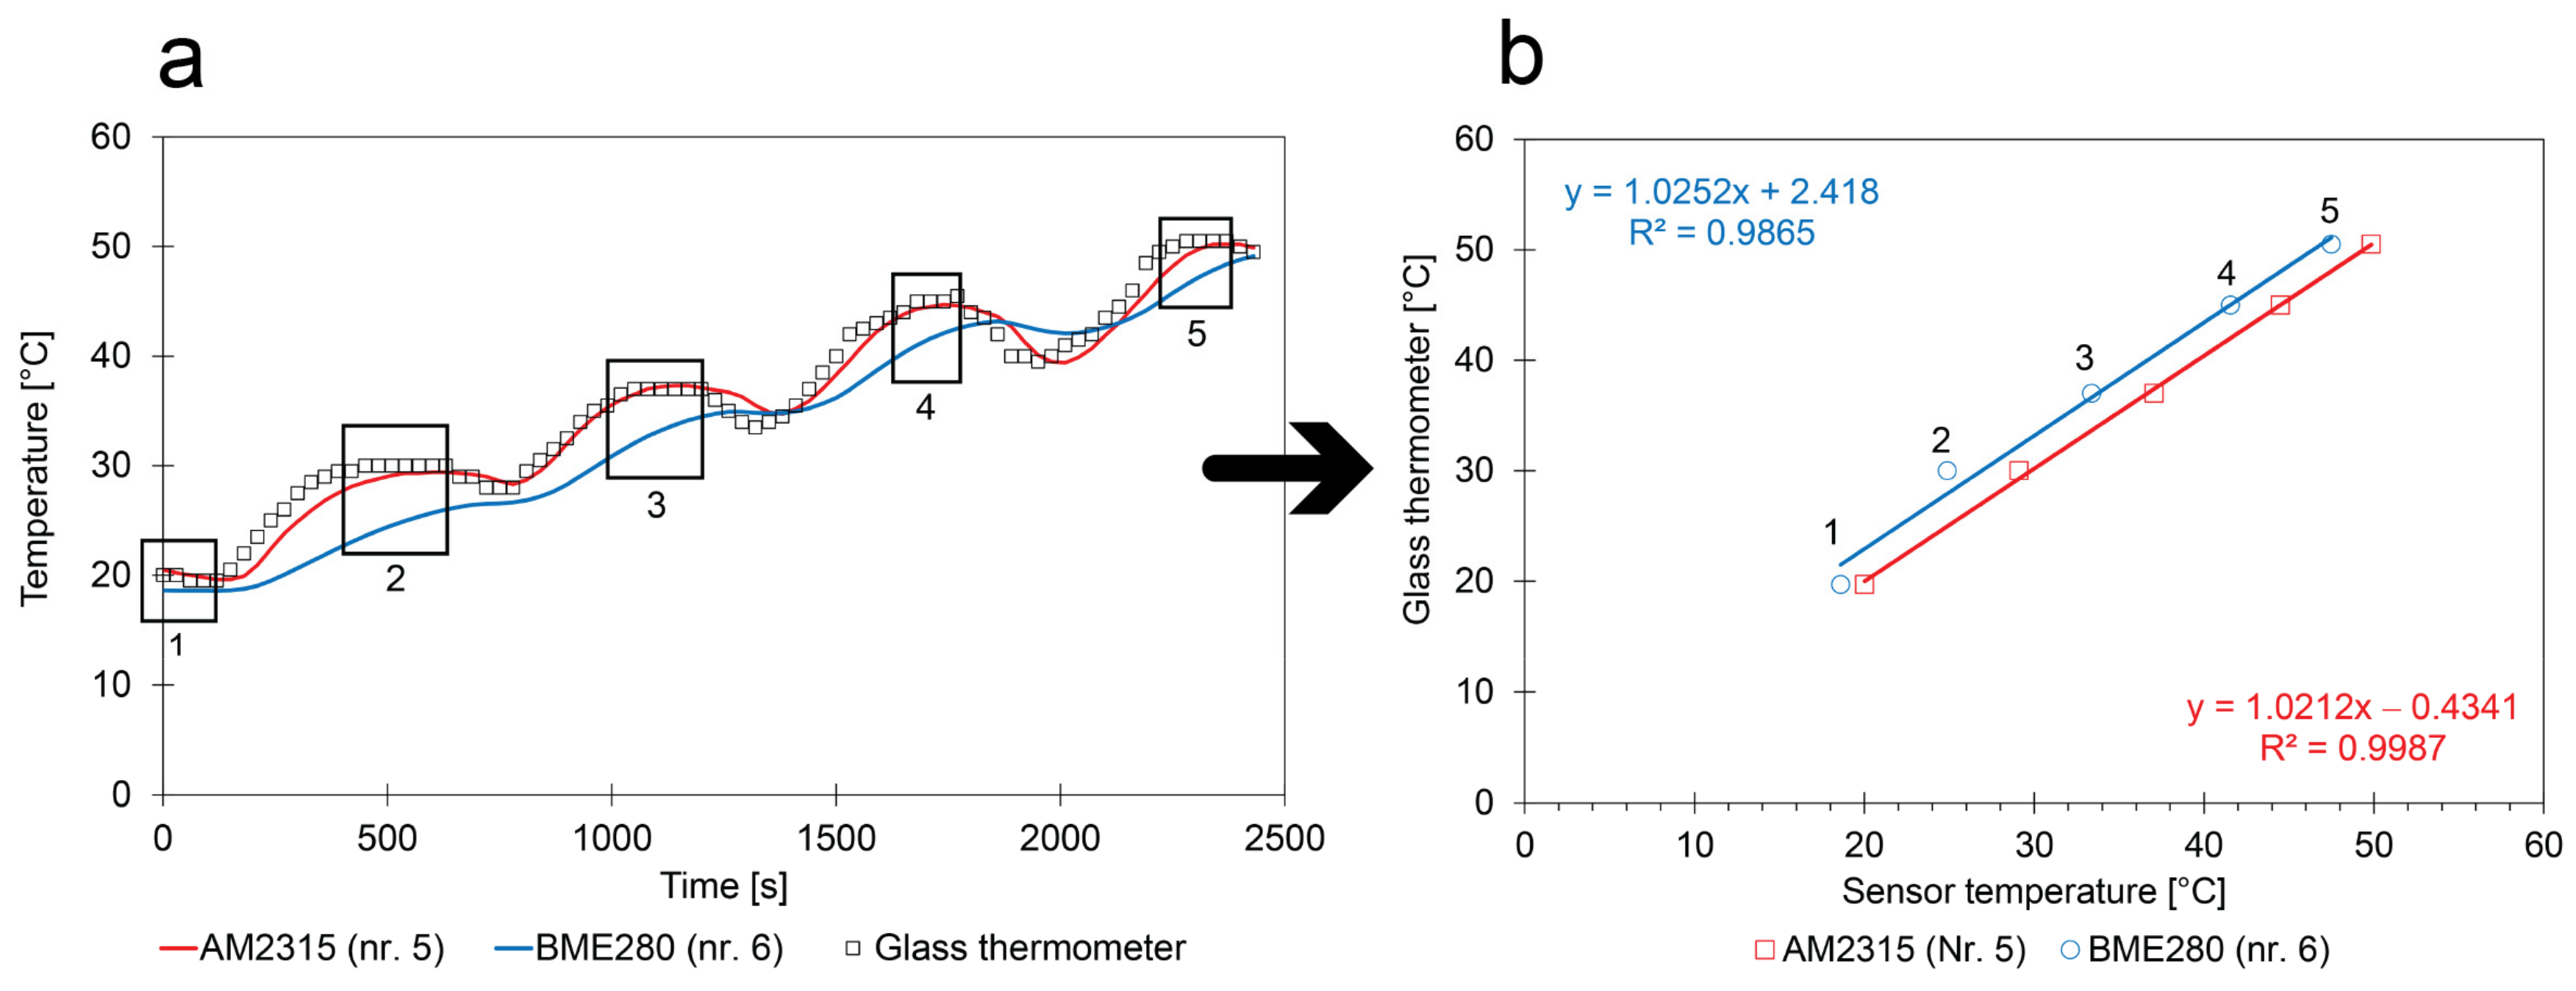
- Absolute calibration method: The calibration relies on the calculation of the average T within the short periods where the T is stable. These periods are numbered in Figure 9. The average temperatures are compared with the glass thermometer measurements;
- Relative calibration method: When sensors experience the same conditions during the same calibration experiment, differences between them can be compensated. This compensation is even possible when the low-cost calibration method is unable to accurately determine the absolute values. Consequently, differences in trends from two monitoring campaigns performed in parallel during the field study can be studied in a reliable way;
- Comparison with the reference: The experiments suggest that the behavior of the sensors in comparison with the reference show several small differences. The AM2315 follows the values obtained with the glass thermometer with some delay (see Figure 9a). The BME280 sensor appears to be less sensitive to the changes in the calibration box;
- Comparison between sensors: The slopes of the calibration curves of the two factory-calibrated sensors were close to 1 and the intercepts had a small deviation from 0. The calibration curves also showed more similarities with the ones obtained with cooling (see Figure 7). This indicates that cooling or heating rates should be sufficiently small to obtain a correct calibration;
- Replicability of the calibration method: The same calibration method was used to calibrate a set of low-cost sensors in different regions (Figure 7 in Cuba; Figure 9 in Belgium) using different calibration boxes and with different equipment. Except for the heating process shown in Figure 7, they all gave a linear regression with similarities to the factory calibration. No obvious differences between the low-cost calibration and the golden standard (Figure 8 performed in Belgium) could be observed. This means that the calibration method resulted in reproducible results and that factory calibrations can be improved.
3.3. Relative Humidity Calibration
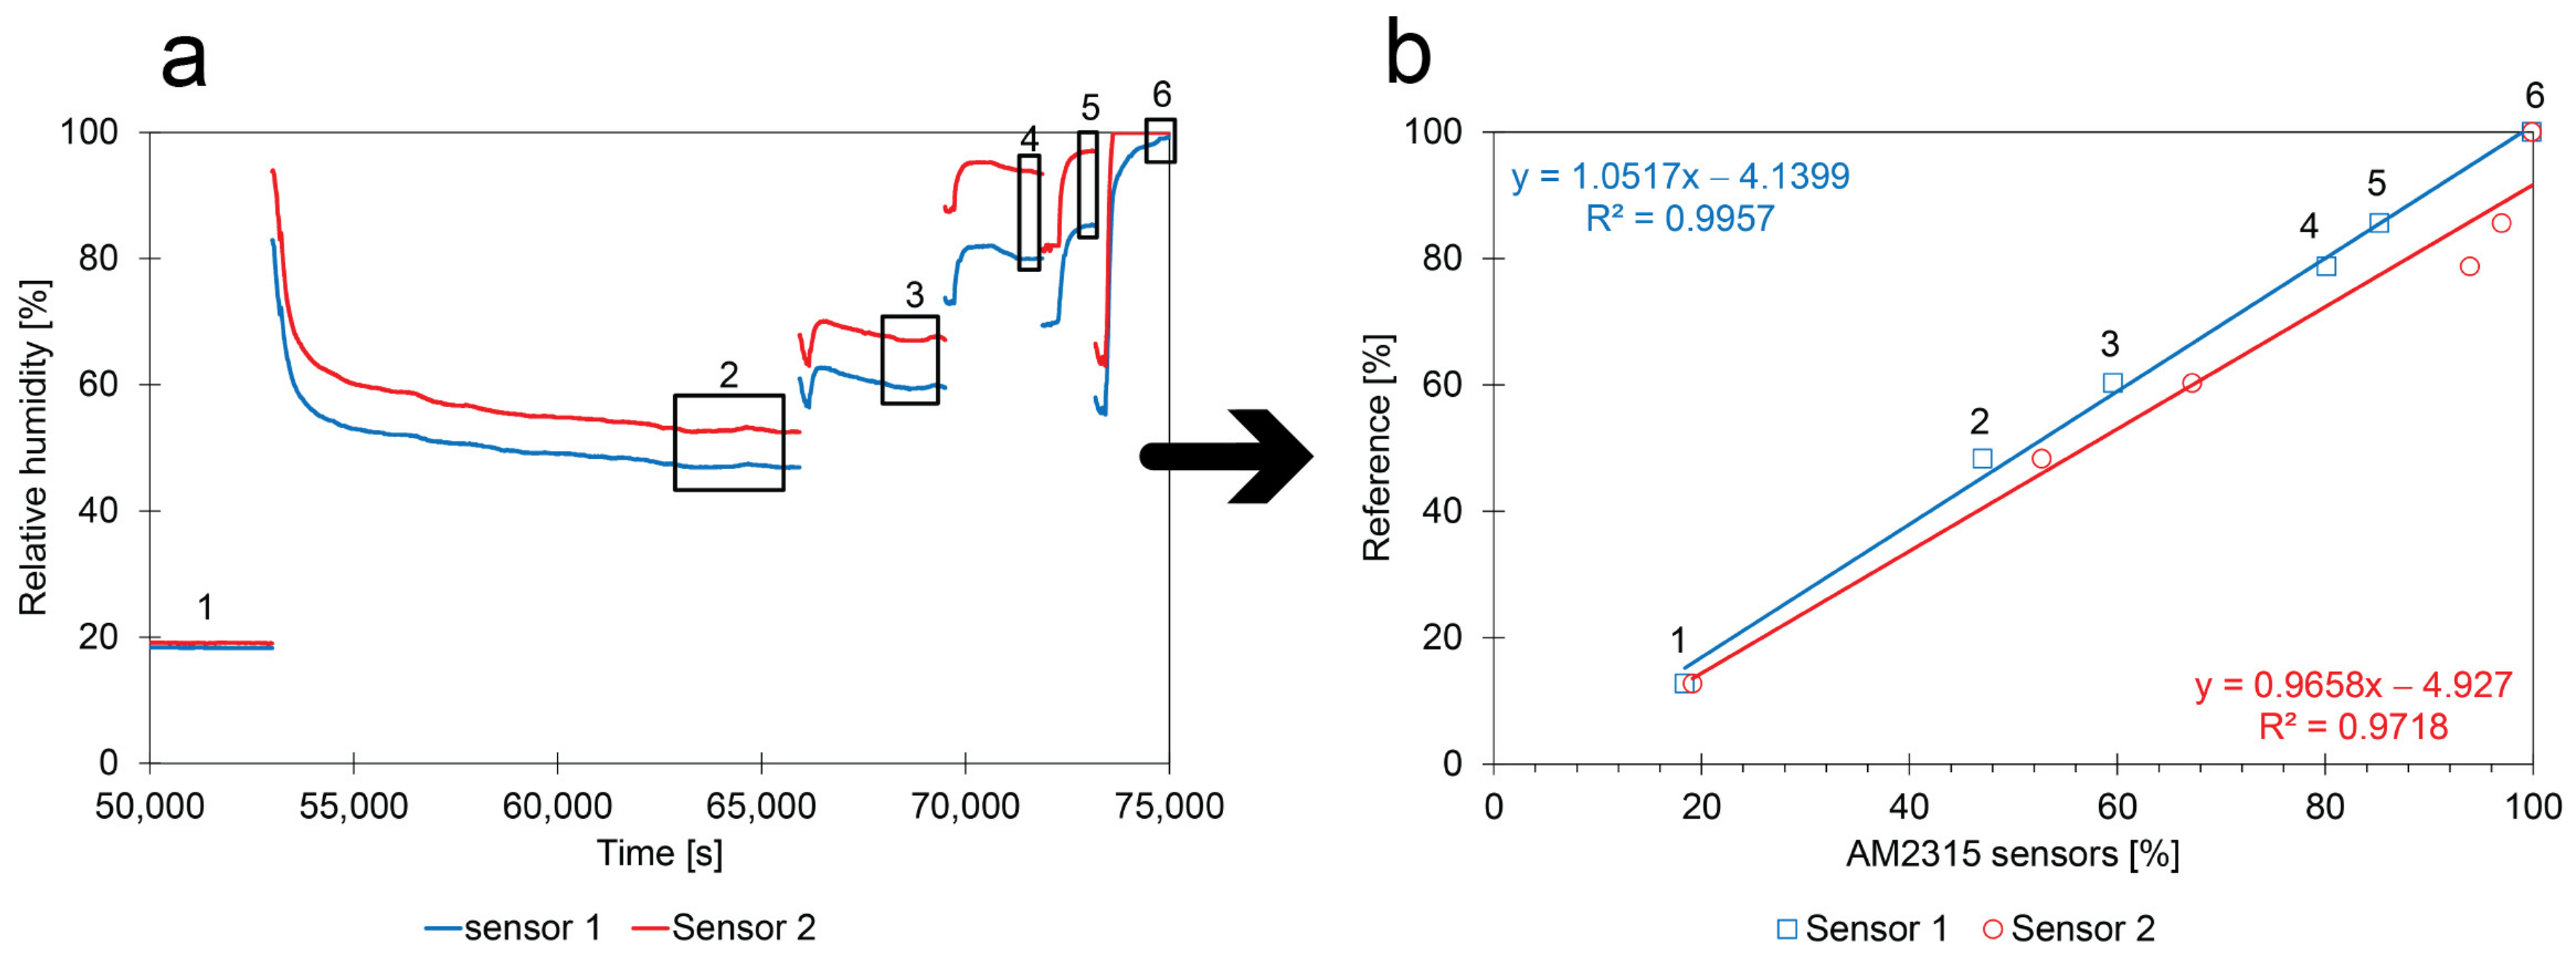
- Calibration method: The calibration experiments in Figure 10a were stopped once the RH reached a stable value. The average value was calculated from the stable periods shown in the numbered boxes and compared with the theoretical values that were obtained with the glycerol solution. The results show that the calibration performed by the manufacturer can be improved with low-cost calibration experiments (at least in a relative way);
- Low random error: The calibration points follow a linear trend, suggesting that the contribution of random errors is low;
- Comparison between sensors: The linear calibration functions of both sensors show similarities. The slopes of the calibration curves are close to 1 as expected. The intercepts are similar, but deviate from zero.
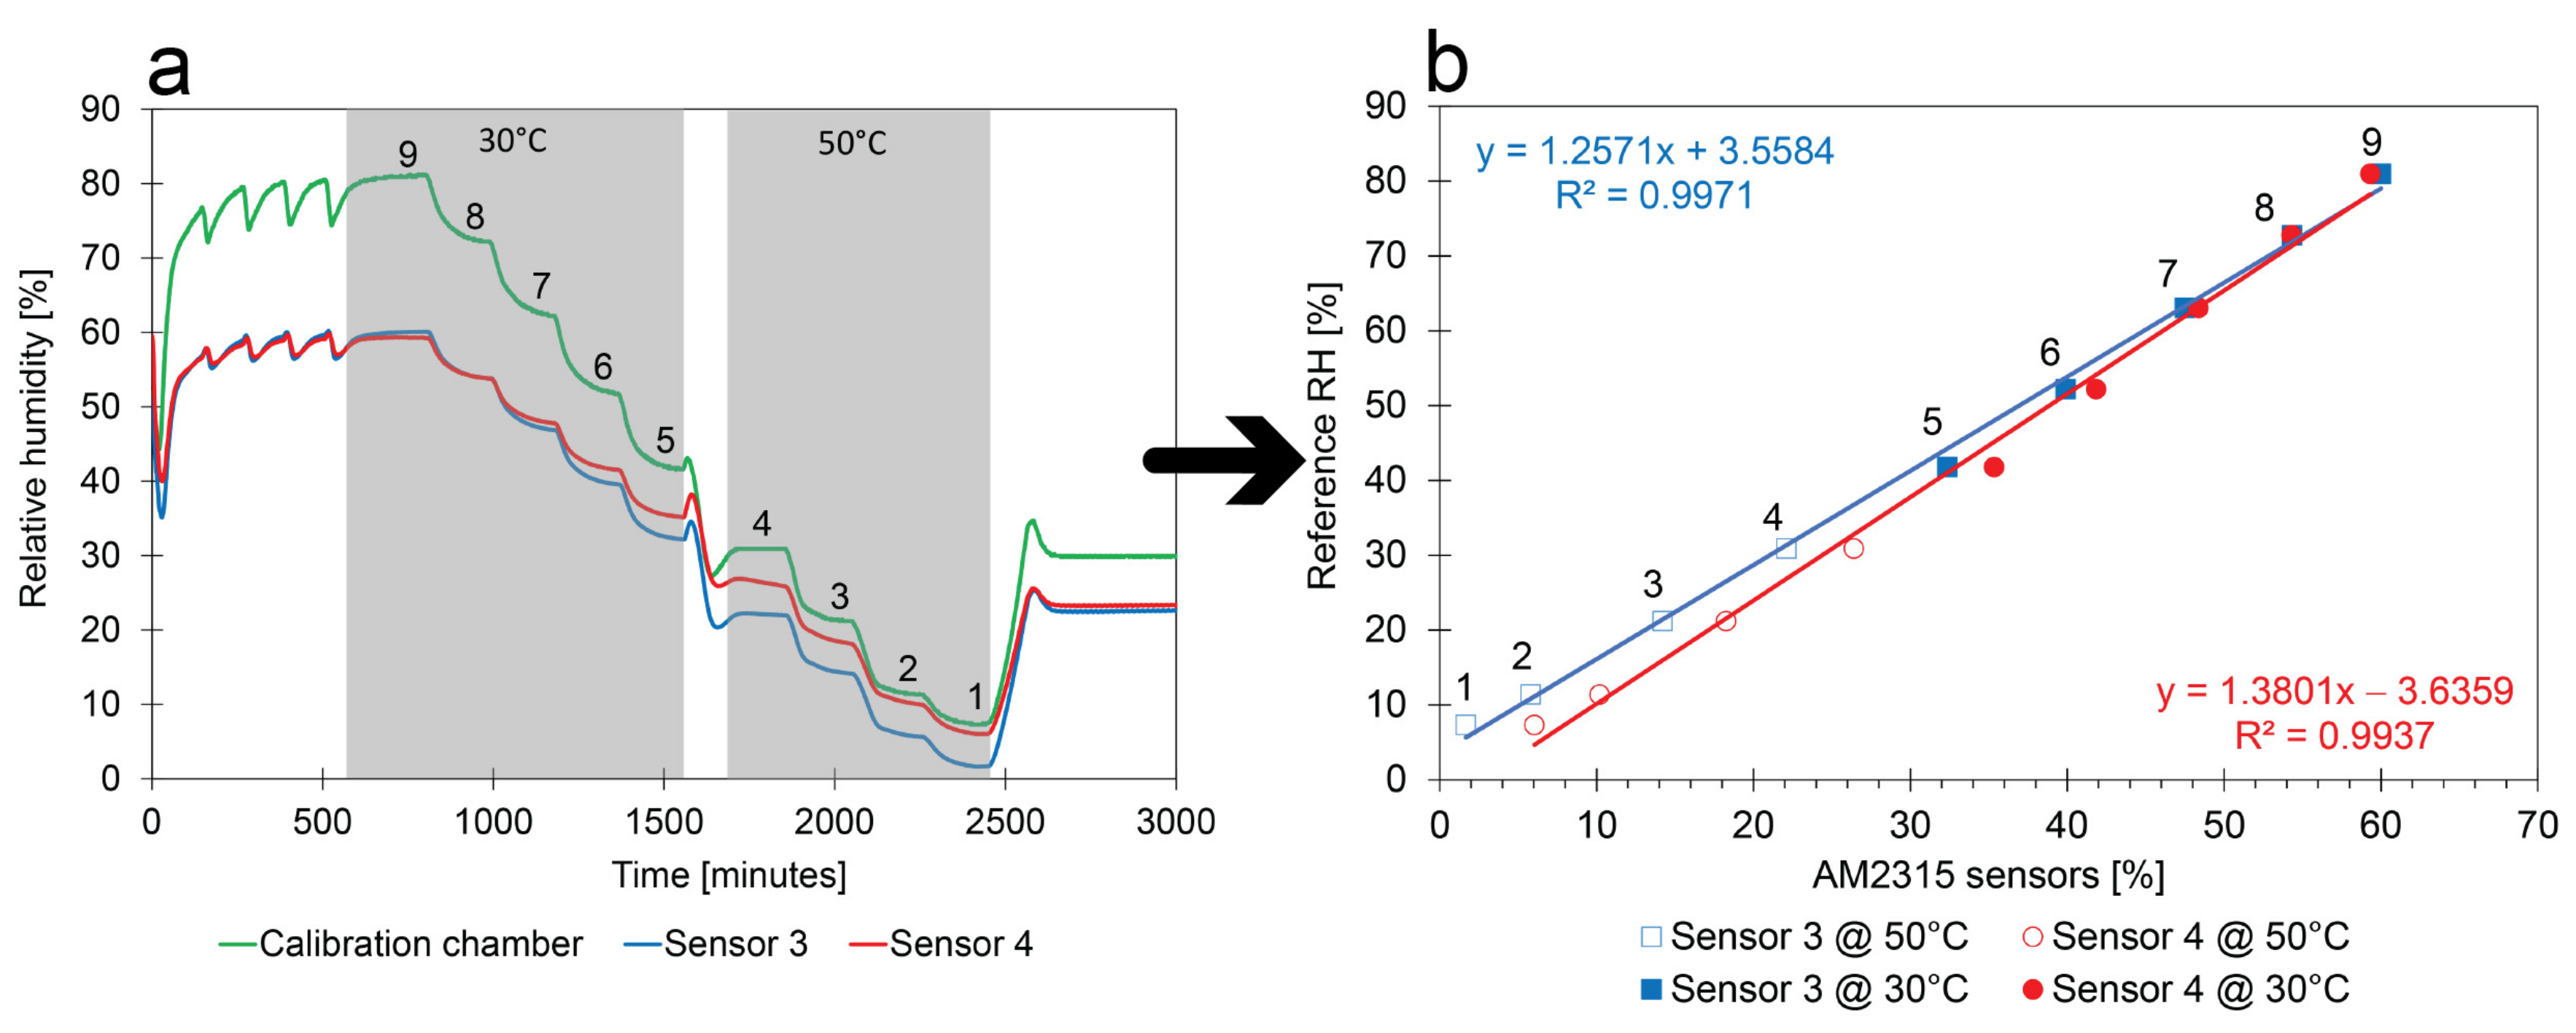
- Calibration method:Figure 11b shows the linear calibration of the sensors. The calibration points show the relation between the average values of the numbered plateaus in Figure 11a and the corresponding RH measured by the climate chamber. Only the second half of the plateaus were considered because they were more stable;
- Comparison between sensors: The slope and intercept of both sensors are similar but different enough to require additional calibration before they can be used in field measurements. In addition, the slope and intercept are close to the ones determined with the low-cost calibration methods. It should be remarked that the set of calibration points determined at 30 °C and the set of 50 °C do not entirely match the linear regression. There is a small impact of the T on the RH measurements;
- Replicability of the calibration method: The calibration method has been tested on several sensors of the same type. The same calibration box and equipment have been used to independently perform the six experiments of Figure 10a. Calibration is also performed with a golden standard. No obvious differences could be observed between the linear regressions. The similarities show that the low-cost RH calibration is sufficiently reliable and that factory calibrations of the sensors can be improved.
3.4. CO2 Calibration
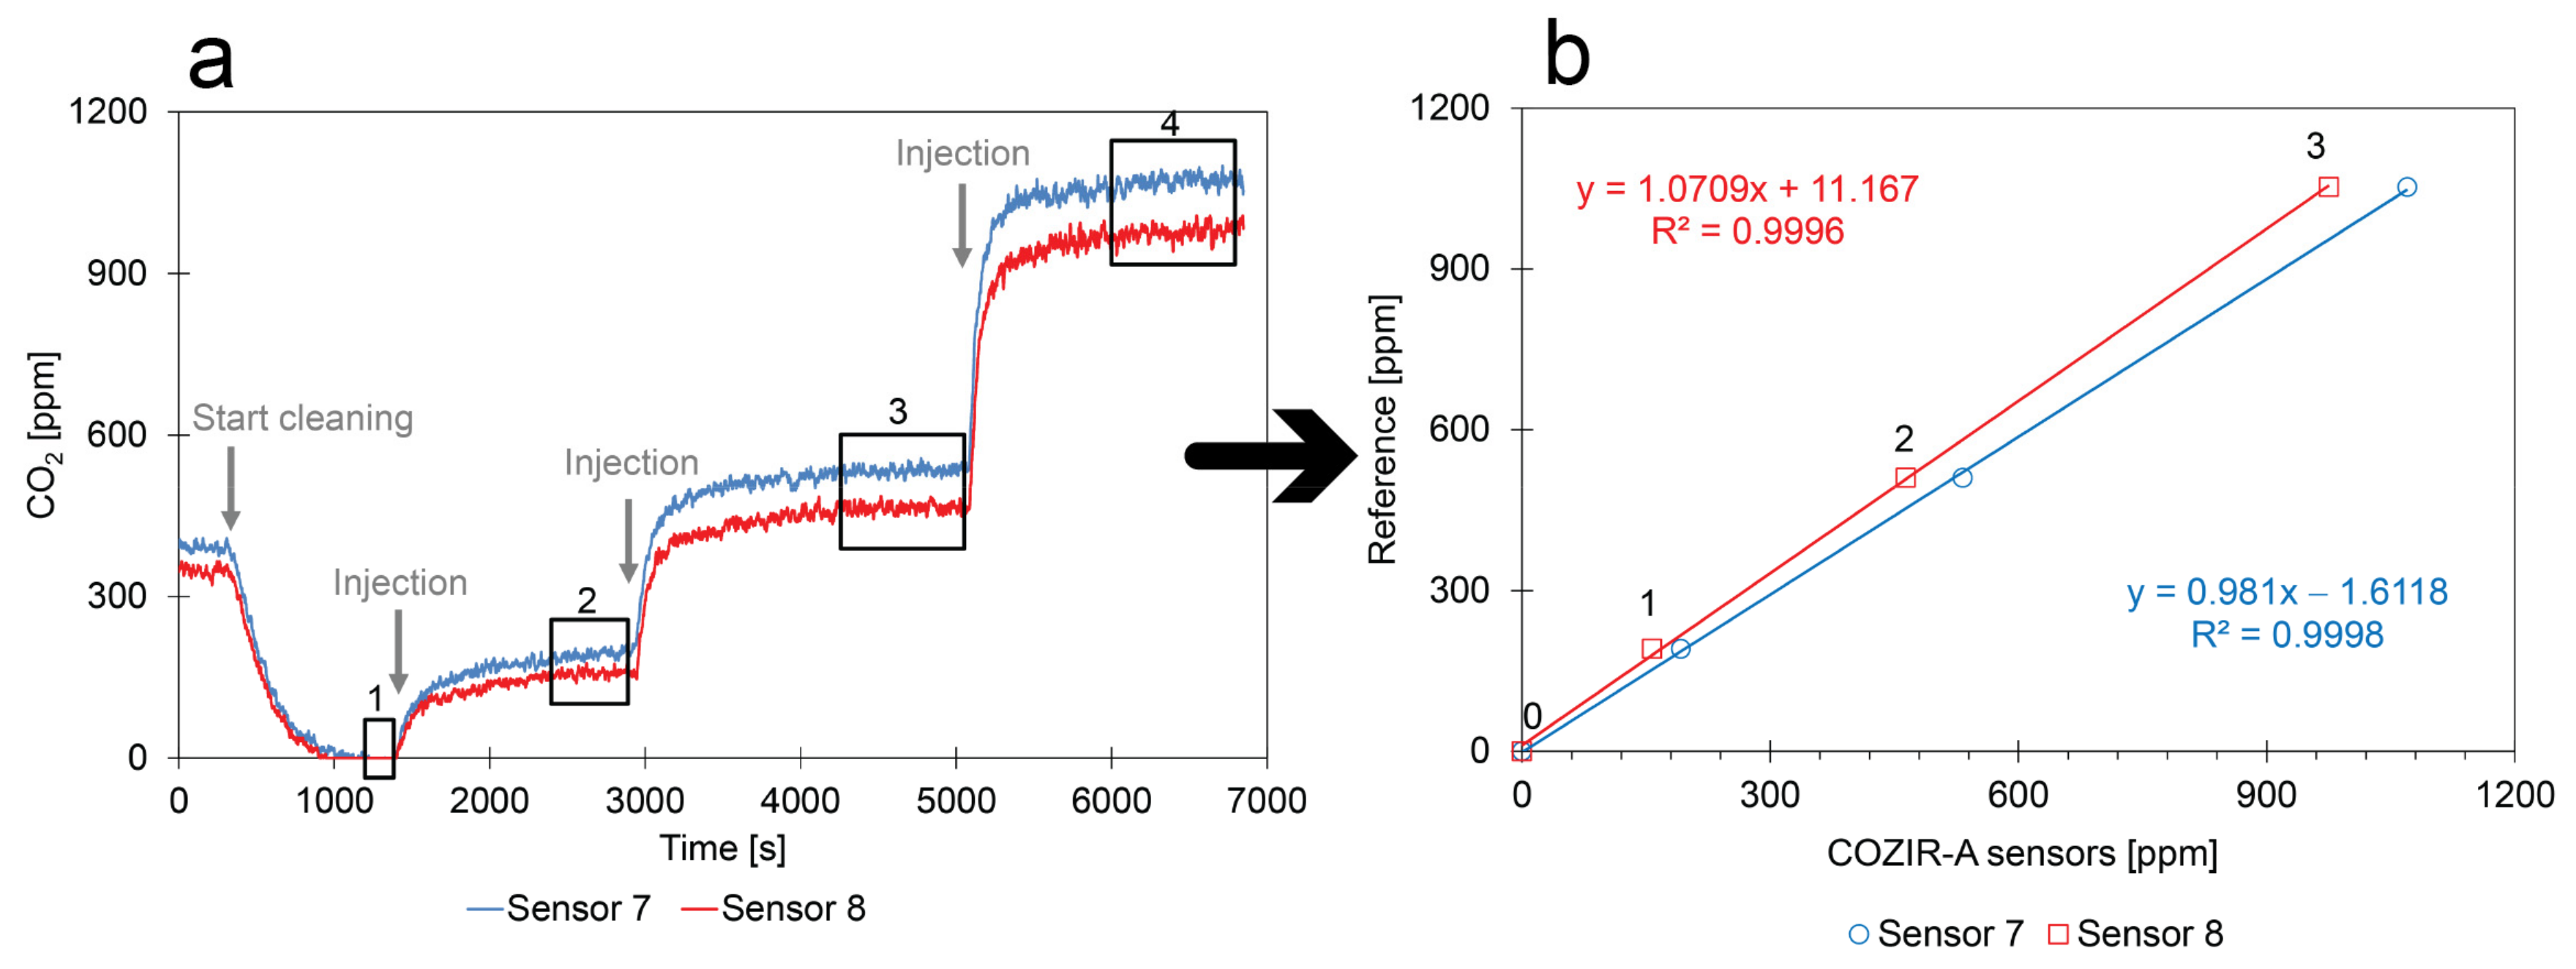
- Calibration method: Because all CO2 inside the closed box was removed and because known amounts of CO2 were injected into the box, the staircase function was fully controlled. However, only the concentrations of the plateaus could be calculated from the injected amounts and used for calibration. Consequently, the average values of the numbered rectangles in Figure 12a were used for calibration;
- Limited random errors: The mathematical relation of the calibration points can be described by linear regression (see Figure 12b). This suggests that the contribution of random errors during the experiment is low;
- Comparison between sensors: Figure 12a shows that both sensors follow the same trend, but that they respond slightly differently to the same environment.
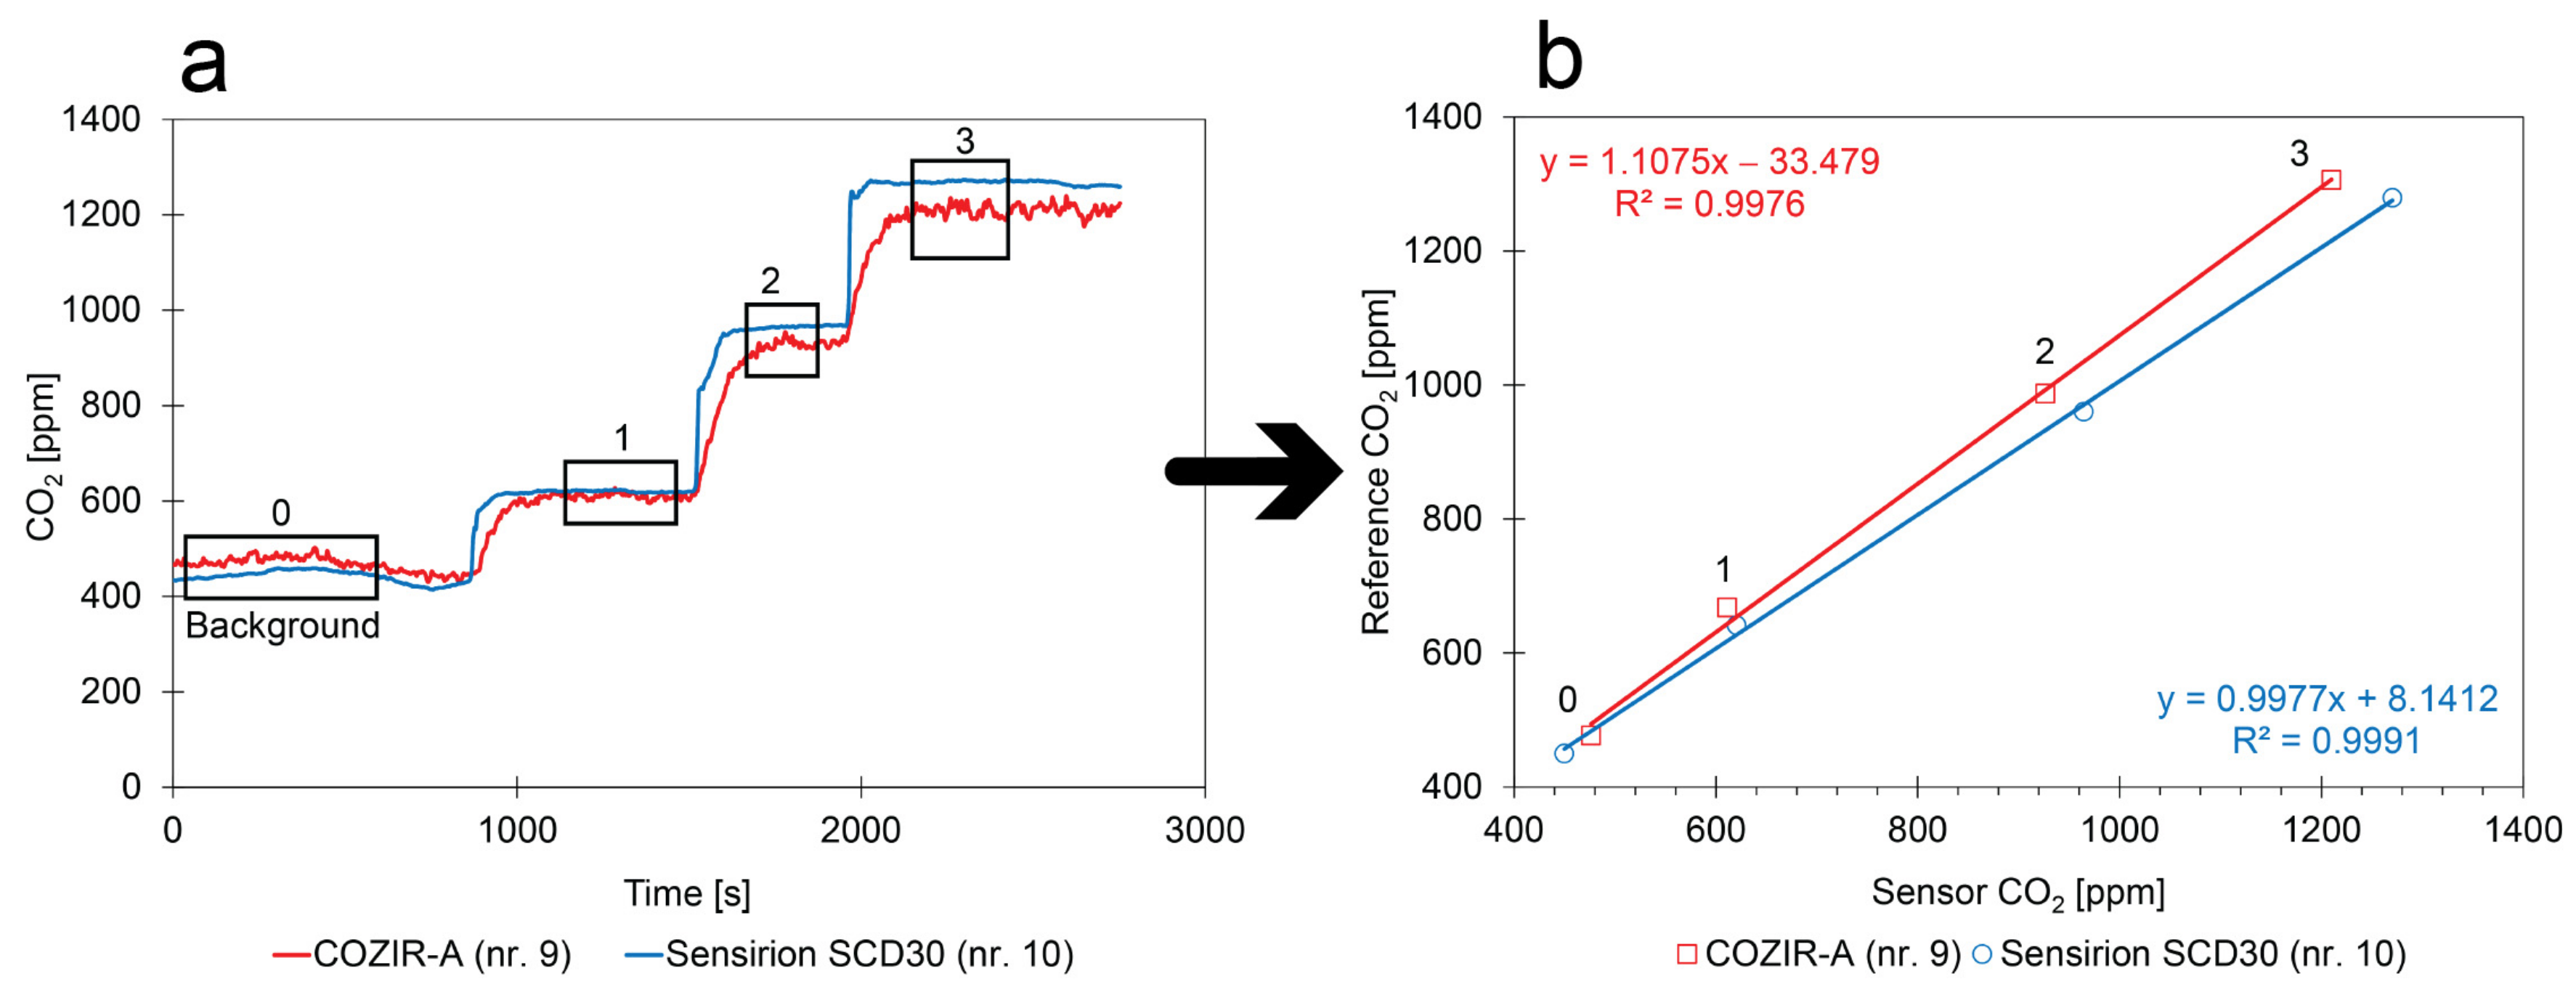
- Calibration method: The two factory-calibrated sensors measured a different background concentration (rectangle 0 in Figure 13a) in the closed box (COZIR-A: 476 ppm; Sensirion SCD30: 450 ppm). From the measured background concentrations and the calculated concentrations that were introduced, the reference concentrations of rectangles 1, 2, and 3 could be determined;
- Comparison between sensors: Although the intercept of the calibration curves might contain a small but constant error due to an error in the measurement of the background concentration, the slopes can be accurately determined;
- Replicability of the calibration method: Different kinds of factory-calibrated sensors have been tested with two different calibration methods. The linear regressions given in Figure 12 and Figure 13 show sufficient similarities to conclude that the low-cost CO2 calibration methods are sufficiently reliable and that the factory calibration of the sensors can be improved.
3.5. Results of the Field Study
4. Conclusions
Supplementary Materials
Author Contributions
Funding
Institutional Review Board Statement
Informed Consent Statement
Data Availability Statement
Acknowledgments
Conflicts of Interest
References
- Mannucci, P.; Franchini, M. Health Effects of Ambient Air Pollution in Developing Countries. IJERPH 2017, 14, 1048. [Google Scholar] [CrossRef] [PubMed]
- Chen, B.H.; Hong, C.L.; Pandey, M.R.; Smith, K.R. Indoor Air Pollution in Developing Countries. World Health Stat. Q. 1990, 43, 127–137. [Google Scholar] [PubMed]
- Pinder, R.W.; Klopp, J.M.; Kleiman, G.; Hagler, G.S.W.; Awe, Y.; Terry, S. Opportunities and Challenges for Filling the Air Quality Data Gap in Low- and Middle-Income Countries. Atmos. Environ. 2019, 215, 116794. [Google Scholar] [CrossRef] [PubMed]
- Ibrahim, M.F.; Hod, R.; Nawi, A.M.; Sahani, M. Association between Ambient Air Pollution and Childhood Respiratory Diseases in Low- and Middle-Income Asian Countries: A Systematic Review. Atmos. Environ. 2021, 256, 118422. [Google Scholar] [CrossRef]
- Helmut, M. Air Pollution in Cities. Atmos. Environ. 1999, 33, 4029–4037. [Google Scholar]
- Hodoli, C.G.; Coulon, F.; Mead, M.I. Source Identification with High-Temporal Resolution Data from Low-Cost Sensors Using Bivariate Polar Plots in Urban Areas of Ghana. Environ. Pollut. 2023, 317, 120448. [Google Scholar] [CrossRef]
- deSouza, P.; Nthusi, V.; Klopp, J.; Shaw, B.; Ho, W.; Saffell, J.; Jones, R.; Ratti, C. A Nairobi Experiment in Using Low Cost Air Quality Monitors. Clean Air J. 2017, 27, 12–42. [Google Scholar] [CrossRef]
- Abraham, S.; Li, X. A Cost-Effective Wireless Sensor Network System for Indoor Air Quality Monitoring Applications. Procedia Comput. Sci. 2014, 34, 165–171. [Google Scholar] [CrossRef]
- Aguiar, E.F.K.; Roig, H.L.; Mancini, L.H.; de Carvalho, E.N.C.B. Low-Cost Sensors Calibration for Monitoring Air Quality in the Federal District—Brazil. JEP 2015, 6, 173–189. [Google Scholar] [CrossRef]
- Zimmerman, N.; Presto, A.A.; Kumar, S.P.N.; Gu, J.; Hauryliuk, A.; Robinson, E.S.; Robinson, A.L.; Subramanian, R. A Machine Learning Calibration Model Using Random Forests to Improve Sensor Performance for Lower-Cost Air Quality Monitoring. Atmos. Meas. Tech. 2018, 11, 291–313. [Google Scholar] [CrossRef]
- Morawska, L.; Thai, P.K.; Liu, X.; Asumadu-Sakyi, A.; Ayoko, G.; Bartonova, A.; Bedini, A.; Chai, F.; Christensen, B.; Dunbabin, M.; et al. Applications of Low-Cost Sensing Technologies for Air Quality Monitoring and Exposure Assessment: How Far Have They Gone? Environ. Int. 2018, 116, 286–299. [Google Scholar] [CrossRef]
- Schalm, O.; Cabal, A.; Anaf, W.; Leyva Pernia, D.; Callier, J.; Ortega, N. A Decision Support System for Preventive Conservation: From Measurements towards Decision Making. Eur. Phys. J. Plus 2019, 134, 74. [Google Scholar] [CrossRef]
- Anaf, W.; Leyva Pernia, D.; Schalm, O. Standardized Indoor Air Quality Assessments as a Tool to Prepare Heritage Guardians for Changing Preservation Conditions Due to Climate Change. Geosci. J. 2018, 8, 276. [Google Scholar] [CrossRef]
- Gaudenzi Asinelli, M.; Serra Serra, M.; Molera Marimòn, J.; Serra Espaulella, J. The SmARTS_Museum_V1: An Open Hardware Device for Remote Monitoring of Cultural Heritage Indoor Environments. HardwareX 2018, 4, e00028. [Google Scholar] [CrossRef]
- CEN EN 15757:2010. Conservation of Cultural Property: Specifications for Temperature and Relative Humidity to Limit Climate-Induced Mechanical Damage in Organic Hygroscopic Materials. European Committee for Standardization (CEN): Brussels, Belgium, 2010.
- Silva, H.E.; Coelho, G.B.A.; Henriques, F.M.A. Climate Monitoring in World Heritage List Buildings with Low-Cost Data Loggers: The Case of the Jerónimos Monastery in Lisbon. JOBE 2020, 28, 101029. [Google Scholar] [CrossRef]
- Tarasick, D.W.; Smit, H.G.J.; Thompson, A.M.; Morris, G.A.; Witte, J.C.; Davies, J.; Nakano, T.; Van Malderen, R.; Stauffer, R.M.; Johnson, B.J.; et al. Improving ECC Ozonesonde Data Quality: Assessment of Current Methods and Outstanding Issues. Earth Space Sci 2021, 8, e2019EA000914. [Google Scholar] [CrossRef]
- Van Malderen, R.; De Muer, D.; De Backer, H.; Poyraz, D.; Verstraeten, W.W.; De Bock, V.; Delcloo, A.W.; Mangold, A.; Laffineur, Q.; Allaart, M.; et al. Fifty Years of Balloon-Borne Ozone Profile Measurements at Uccle, Belgium: A Short History, the Scientific Relevance, and the Achievements in Understanding the Vertical Ozone Distribution. Atmos. Chem. Phys. 2021, 21, 12385–12411. [Google Scholar] [CrossRef]
- Rodriguez-Vasquez, K.A.; Cole, A.M.; Yordanova, D.; Smith, R.; Kidwell, N.M. AIRduino: On-Demand Atmospheric Secondary Organic Aerosol Measurements with a Mobile Arduino Multisensor. J. Chem. Educ. 2020, 97, 838–844. [Google Scholar] [CrossRef]
- Mijling, B.; Jiang, Q.; de Jonge, D.; Bocconi, S. Field Calibration of Electrochemical NO2 Sensors in a Citizen Science Context. Atmos. Meas. Tech. 2018, 11, 1297–1312. [Google Scholar] [CrossRef]
- Watne, Å.K.; Linden, J.; Willhelmsson, J.; Fridén, H.; Gustafsson, M.; Castell, N. Tackling Data Quality When Using Low-Cost Air Quality Sensors in Citizen Science Projects. Front. Environ. Sci. 2021, 9, 733634. [Google Scholar] [CrossRef]
- Wallace, L.; Bi, J.; Ott, W.R.; Sarnat, J.; Liu, Y. Calibration of Low-Cost PurpleAir Outdoor Monitors Using an Improved Method of Calculating PM. Atmos. Environ. 2021, 256, 118432. [Google Scholar] [CrossRef]
- Karaoghlanian, N.; Noureddine, B.; Saliba, N.; Shihadeh, A.; Lakkis, I. Low Cost Air Quality Sensors “PurpleAir” Calibration and Inter-Calibration Dataset in the Context of Beirut, Lebanon. Data Br. 2022, 41, 108008. [Google Scholar] [CrossRef] [PubMed]
- Karagulian, F.; Barbiere, M.; Kotsev, A.; Spinelle, L.; Gerboles, M.; Lagler, F.; Redon, N.; Crunaire, S.; Borowiak, A. Review of the Performance of Low-Cost Sensors for Air Quality Monitoring. Atmosphere 2019, 10, 506. [Google Scholar] [CrossRef]
- Narayana, M.V.; Jalihal, D.; Nagendra, S.M.S. Establishing A Sustainable Low-Cost Air Quality Monitoring Setup: A Survey of the State-of-the-Art. Sensors 2022, 22, 394. [Google Scholar] [CrossRef] [PubMed]
- Singh, D.; Dahiya, M.; Kumar, R.; Nanda, C. Sensors and Systems for Air Quality Assessment Monitoring and Management: A Review. J. Environ. Manag. 2021, 289, 112510. [Google Scholar] [CrossRef] [PubMed]
- Chojer, H.; Branco, P.T.B.S.; Martins, F.G.; Alvim-Ferraz, M.C.M.; Sousa, S.I.V. Development of Low-Cost Indoor Air Quality Monitoring Devices: Recent Advancements. Sci. Total Environ. 2020, 727, 138385. [Google Scholar] [CrossRef] [PubMed]
- Bigi, A.; Mueller, M.; Grange, S.K.; Ghermandi, G.; Hueglin, C. Performance of NO, NO2 Low Cost Sensors and Three Calibration Approaches within a Real World Application. Atmos. Meas. Tech. 2018, 11, 3717–3735. [Google Scholar] [CrossRef]
- Bean, J.K. Evaluation Methods for Low-Cost Particulate Matter Sensors. Atmos. Meas. Tech. 2021, 14, 7369–7379. [Google Scholar] [CrossRef]
- Concas, F.; Mineraud, J.; Lagerspetz, E.; Varjonen, S.; Liu, X.; Puolamäki, K.; Nurmi, P.; Tarkoma, S. Low-Cost Outdoor Air Quality Monitoring and Sensor Calibration: A Survey and Critical Analysis. ACM Trans. Sens. Netw. (TOSN) 2021, 17, 1–44. [Google Scholar] [CrossRef]
- Venkatraman Jagatha, J.; Klausnitzer, A.; Chacón-Mateos, M.; Laquai, B.; Nieuwkoop, E.; van der Mark, P.; Vogt, U.; Schneider, C. Calibration Method for Particulate Matter Low-Cost Sensors Used in Ambient Air Quality Monitoring and Research. Sensors 2021, 21, 3960. [Google Scholar] [CrossRef]
- Artinano, B.; Narros, A.; Diaz, E.; Gomez, F.J.; Borge, R. Low-Cost Sensors for Urban Air Quality Monitoring: Preliminary Laboratory and in-Field Tests within the TECNAIRE-CM Project. In Proceedings of the 2019 5th Experiment International Conference (exp.at’19), Funchal, Portugal, 12–14 June 2019; pp. 462–466. [Google Scholar]
- Schalm, O.; Carro, G.; Lazarov, B.; Jacobs, W.; Stranger, M. Reliability of Lower-Cost Sensors in the Analysis of Indoor Air Quality on Board Ships. Atmosphere 2022, 13, 1579. [Google Scholar] [CrossRef]
- Mao, K.; Xu, J.; Jin, R.; Wang, Y.; Fang, K. A Fast Calibration Algorithm for Non-Dispersive Infrared Single Channel Carbon Dioxide Sensor Based on Deep Learning. Comput. Commun. 2021, 179, 175–182. [Google Scholar] [CrossRef]
- Schwartz, B. The Paradox of Choice: Why More Is Less; Harper Perennial: New York, NY, USA, 2005. [Google Scholar]
- Villanueva, F.; Ródenas, M.; Ruus, A.; Saffell, J.; Gabriel, M.F. Sampling and Analysis Techniques for Inorganic Air Pollutants in Indoor Air. Appl. Spectrosc. Rev. 2022, 57, 531–579. [Google Scholar] [CrossRef]
- Samad, A.; Obando Nuñez, D.R.; Solis Castillo, G.C.; Laquai, B.; Vogt, U. Effect of Relative Humidity and Air Temperature on the Results Obtained from Low-Cost Gas Sensors for Ambient Air Quality Measurements. Sensors 2020, 20, 5175. [Google Scholar] [CrossRef]
- Wei, P.; Ning, Z.; Ye, S.; Sun, L.; Yang, F.; Wong, K.; Westerdahl, D.; Louie, P. Impact Analysis of Temperature and Humidity Conditions on Electrochemical Sensor Response in Ambient Air Quality Monitoring. Sensors 2018, 18, 59. [Google Scholar] [CrossRef]
- Wahlborg, D.; Björling, M.; Mattsson, M. Evaluation of Field Calibration Methods and Performance of AQMesh, a Low-Cost Air Quality Monitor. Environ. Monit. Assess. 2021, 193, 251. [Google Scholar] [CrossRef]
- Gonzalez, A.; Boies, A.; Swason, J.; Kittelson, D. Field Calibration of Low-Cost Air Pollution Sensors. Atmos. Meas. Tech. Discuss. 2019, 12, 1–17. [Google Scholar] [CrossRef]
- Borrego, C.; Costa, A.M.; Ginja, J.; Amorim, M.; Coutinho, M.; Karatzas, K.; Sioumis, T.; Katsifarakis, N.; Konstantinidis, K.; De Vito, S.; et al. Assessment of Air Quality Microsensors versus Reference Methods: The EuNetAir Joint Exercise. Atmos. Environ. 2016, 147, 246–263. [Google Scholar] [CrossRef]
- Drewnick, F.; Böttger, T.; von der Weiden-Reinmüller, S.-L.; Zorn, S.R.; Klimach, T.; Schneider, J.; Borrmann, S. Design of a Mobile Aerosol Research Laboratory and Data Processing Tools for Effective Stationary and Mobile Field Measurements. Atmos. Meas. Tech. 2012, 5, 1443–1457. [Google Scholar] [CrossRef]
- Arroyo, P.; Gómez-Suárez, J.; Suárez, J.I.; Lozano, J. Low-Cost Air Quality Measurement System Based on Electrochemical and PM Sensors with Cloud Connection. Sensors 2021, 21, 6228. [Google Scholar] [CrossRef]
- Ionascu, M.-E.; Castell, N.; Boncalo, O.; Schneider, P.; Darie, M.; Marcu, M. Calibration of CO, NO2, and O3 Using Airify: A Low-Cost Sensor Cluster for Air Quality Monitoring. Sensors 2021, 21, 7977. [Google Scholar] [CrossRef] [PubMed]
- Smith, K.R.; Edwards, P.M.; Ivatt, P.D.; Lee, J.D.; Squires, F.; Dai, C.; Peltier, R.E.; Evans, M.J.; Sun, Y.; Lewis, A.C. An Improved Low-Power Measurement of Ambient NO2 and O3 Combining Electrochemical Sensor Clusters and Machine Learning. Atmos. Meas. Tech. 2019, 12, 1325–1336. [Google Scholar] [CrossRef]
- Wijeratne, L.O.H.; Kiv, D.R.; Aker, A.R.; Talebi, S.; Lary, D.J. Using Machine Learning for the Calibration of Airborne Particulate Sensors. Sensors 2019, 20, 99. [Google Scholar] [CrossRef] [PubMed]
- Greenspan, L. Humidity Fixed Points of Binary Saturated Aqueous Solutions. J. Res. Natl. Bur. Stan. Sect. A 1977, 81A, 89. [Google Scholar] [CrossRef]
- Carotenuto, A.; Dell’Isola, M. An Experimental Verification of Saturated Salt Solution-Based Humidity Fixed Points. Int. J. Thermophys. 1996, 17, 1423–1439. [Google Scholar] [CrossRef]
- Lu, T.; Chen, C. Uncertainty Evaluation of Humidity Sensors Calibrated by Saturated Salt Solutions. Measurement 2007, 40, 591–599. [Google Scholar] [CrossRef]
- Dubovikov, N.I.; Podmurnaya, O.A. Measuring the Relative Humidity over Salt Solutions. Meas. Tech. 2001, 44, 1260–1261. [Google Scholar] [CrossRef]
- Young, J.F. Humidity Control in the Laboratory Using Salt Solutions—A Review. J. Appl. Chem. 2007, 17, 241–245. [Google Scholar] [CrossRef]
- Eggert, G. Saturated Salt Solutions in Showcases: Humidity Control and Pollutant Absorption. Herit. Sci. 2022, 10, 54. [Google Scholar] [CrossRef]
- Winston, P.W.; Bates, D.H. Saturated Solutions For the Control of Humidity in Biological Research. Ecology 1960, 41, 232–237. [Google Scholar] [CrossRef]
- ASTM E 104-85. Standard Practice for Maintaining Constant Relative Humidity by Means of Aqueous Solutions, ASTM International: West Conshohocken, PA, USA, 1996.
- Forney, C.F.; Brandl, D.G. Control of Humidity in Small Controlled-Environment Chambers Using Glycerol-Water Solutions. HortTechnology 1992, 2, 52–54. [Google Scholar] [CrossRef]
- Volk, A.; Kähler, C.J. Density Model for Aqueous Glycerol Solutions. Exp. Fluids 2018, 59, 75. [Google Scholar] [CrossRef]
- Glycerine Producers’ Association. Physical Properties of Glycerine and Its Solutions; Glycerine Producers’ Association: New York, NY, USA, 1963. [Google Scholar]
- Hook, M.D.; Mayer, M. Miniature Environmental Chambers for Temperature Humidity Bias Testing of Microelectronics. Rev. Sci. Instrum. 2017, 88, 034707. [Google Scholar] [CrossRef]
- ASTM D 5032-97, Standard Practice for Maintaining Constant Relative Humidity by Means of Aqueous Glycerin Solutions. American Society for Testing and Materials: West Conshohocken, PA, USA, 1998.
- Bosart, L.W.; Snoddy, A.O. New Glycerol Tables. Ind. Eng. Chem. 1927, 19, 506–510. [Google Scholar] [CrossRef]
- Alyea, H.N. Syringe Gas Generators. J. Chem. Educ. 1992, 69, 65. [Google Scholar] [CrossRef]
- Gonzalez-Rivero, R.A.; Álvarez-Cruz, A.; Alejo-Sanchez, D.; Morales-Perez, M.C.; Martinez, A.; Schalm, O. Calibration of a Low-Cost Sensor for SO2 Monitoring in a Rural Area of Cienfuegos; Cayo Santa Maria, Universidad Central “Marta Abreu” de Las Villas: Las Villas, Cuba, 2022. [Google Scholar]
- Crossno, S.K.; Kalbus, L.H.; Kalbus, G.E. Determinations of Carbon Dioxide by Titration: New Experiments for General, Physical, and Quantitative Analysis Courses. J. Chem. Educ. 1996, 73, 175. [Google Scholar] [CrossRef]
- Yim, B.; Sim, Y.-A.; Kim, S.-T. Evaluation of Short-Term CO2 Passive Sampler for Monitoring Atmospheric CO2 Levels. ksccr 2016, 7, 1–8. [Google Scholar] [CrossRef]
- Passaretti Filho, J.; da Silveira Petruci, J.F.; Cardoso, A.A. Development of a Simple Method for Determination of NO2 in Air Using Digital Scanner Images. Talanta 2015, 140, 73–80. [Google Scholar] [CrossRef]
- Ugucione, C.; Gomes Neto, J.d.A.; Cardoso, A.A. Método colorimétrico para determinação de dióxido de nitrogênio atmosférico com preconcentração em coluna de c-18. Quím. Nova 2002, 25, 352–357. [Google Scholar] [CrossRef]
- Felix, E.P.; Cardoso, A.A. Colorimetric Determination of Ambient Ozone Using Indigo Blue Droplet. J. Braz. Chem. Soc. 2006, 17, 296–301. [Google Scholar] [CrossRef]
- Rodrigues, B.A.; Pitombo, L.R.M.; Cardoso, A.A. Study on the Use of Oxidant Scrubbers for Elimination of Interferences Due to Nitrogen Dioxide in Analysis of Atmospheric Dimethylsulfide. J. Braz. Chem. Soc. 2000, 11, 71–77. [Google Scholar] [CrossRef]
- Felix, E.P.; Cardoso, A.A. A Method for Determination of Ammonia in Air Using Oxalic Acid-Impregnated Cellulose Filters and Fluorimetric Detection. J. Braz. Chem. Soc. 2012, 23, 142–147. [Google Scholar] [CrossRef]
- Martinez, A.; Hernandez-Rodriguez, E.; Hernandez, L.; Schalm, O.; Gonzalez-Rivero, R.A.; Alejo-Sanchez, D. Design of a Low-Cost System for the Measurement of Variables Associated with Air Quality. IEEE Embedded Syst. Lett. 2022, 14, 1. [Google Scholar] [CrossRef]
- Hernández Rodríguez, E.; Schalm, O.; Martínez, A. Development of a Low-Cost Measuring System for the Monitoring of Environmental Parameters That Affect Air Quality for Human Health. ITEGAM-JETIA 2020, 6, 22–27. [Google Scholar] [CrossRef]
- Hernandez-Rodriguez, E.; Kairuz-Cabrera, D.; Martinez, A.; Gonzalez-Rivero, R.A.; Schalm, O. Low-Cost Portable System for the Estimation of Air Quality; Cuban National Bureau of Standards: La Habana, Cuba, 2022. [Google Scholar]
- Jacob, L.A. A Simple and Inexpensive Gas Trap or Gas Inlet for Microscale Work. J. Chem. Educ. 1992, 69, A313. [Google Scholar] [CrossRef]
- Najdoski, M. Gas Chemistry: A Microscale Kipp Apparatus. Chem. Educ. 2011, 5, 295–298. [Google Scholar]
- Najdoski, M.; Stojkovikj, S. A Simple Microscale Gas Generation Apparatus. J. Sci. Educ. 2014, 1, 49–50. [Google Scholar]
- Najdoski, M.; Stojkovikj, S.; Cyril, S. Cost Effective Microscale Gas Generation Apparatus. Chemistry 2010, 19, 444–449. [Google Scholar]
- Thickett, D.; David, F.; Luxford, N. Air Exchange Rate—The Dominant Parameter for Preventive Conservation? Conservator 2005, 29, 19–34. [Google Scholar] [CrossRef]
- Charlesworth, P.S. Air Exchange Rate and Airtightness Measurement Techniques—An Applications Guide; Air Infiltration and Ventilation Centre: Coventry, UK, 1988. [Google Scholar]
- You, Y.; Niu, C.; Zhou, J.; Liu, Y.; Bai, Z.; Zhang, J.; He, F.; Zhang, N. Measurement of Air Exchange Rates in Different Indoor Environments Using Continuous CO2 Sensors. J. Environ. Sci. 2012, 24, 657–664. [Google Scholar] [CrossRef]
- Calver, A.; Holbrook, A.; Thickett, D.; Weintraub, S. Simple Methods to Measure Air Exchange Rates and Detect Leaks in Display and Storage Enclosures. In Proceedings of the 14th triennial meeting the Hague Preprints, The Hague, Netherlands, 12–16 September 2005; pp. 597–609. [Google Scholar]
- ASTM E741. Standard Test Method for Determining Air Change in a Single Zone by Means of a Tracer Gas Dilution. American Society for Testing and Materials: West Conshohocken, PA, USA, 2006.
- Tétreault, J.; Hagan, E. Airtightness Measurement of Display Cases and Other Enclosures—Technical Bulletin 38; Technical Bulletins; Canadian Conservation Institute: Ottawa, ON, Canada, 2022; p. 91. [Google Scholar]
- Báthory, C.; Kiss, M.L.; Trohák, A.; Dobó, Z.; Palotás, Á.B. Preliminary Research for Low-Cost Particulate Matter Sensor Network. E3S Web Conf. 2019, 100, 00004. [Google Scholar] [CrossRef]
- Alejo, D.; Morales, M.C.; de la Torre, J.B.; Grau, R.; Bencs, L.; Van Grieken, R.; Van Espen, P.; Sosa, D.; Nuñez, V. Seasonal Trends of Atmospheric Nitrogen Dioxide and Sulfur Dioxide over North Santa Clara, Cuba. Environ. Monit. Assess. 2013, 185, 6023–6033. [Google Scholar] [CrossRef]
- NC 111: 2004. Calidad Del Aire—Reglas Para la Vigilancia de la Calidad del Aire en Asentamientos Humanos. Cuban National Bureau of Standards: La Habana, Cuba, 2004.


| Nr. | Sensor | Parameter | Calibration Method | Experiment | Location | Calibration Data |
|---|---|---|---|---|---|---|
| 1 | AM2315 | T | Low-cost calibration | Figure 7 | Cuba | 8 December 2020 |
| 2 | AM2315 | T | Low-cost calibration | Figure 7 | Cuba | 8 December 2020 |
| 3 | AM2315 | T | Controlled climate chamber | Figure 8 | Belgium | 28 October 2021–2 November 2021 |
| 4 | AM2315 | T | Controlled climate chamber | Figure 8 | Belgium | 28 October 2021–2 November 2021 |
| 5 | AM2315 | T | Low-cost calibration, heating | Figure 9 | Belgium | 22 November 2022 |
| 6 | BME280 | T | Low-cost calibration, heating | Figure 9 | Belgium | 22 November 2022 |
| 1 | AM2315 | RH | Low-cost calibration | Figure 10 | Cuba | 21 September 2020–24 September 2020 |
| 2 | AM2315 | RH | Low-cost calibration | Figure 10 | Cuba | 21 September 2020–24 September 2020 |
| 3 | AM2315 | RH | Controlled climate chamber | Figure 11 | Belgium | 28 October 2021–2 November 2021 |
| 4 | AM2315 | RH | Controlled climate chamber | Figure 11 | Belgium | 28 October 2021–2 November 2021 |
| 7 | COZIR-A | CO2 | Low-cost calibration | Figure 12 | Cuba | 28 October 2020 |
| 8 | COZIR-A | CO2 | Low-cost calibration | Figure 12 | Cuba | 28 October 2020 |
| 9 | COZIR-A | CO2 | Low-cost calibration | Figure 13 | Cuba | 27 April 2022 |
| 10 | SCD30 | CO2 | Low-cost calibration | Figure 13 | Cuba | 27 April 2022 |
| Role | Provider | Description | Amount | Price (€) |
|---|---|---|---|---|
| General purpose | Amazon (München, Germany) | Hot glue gun to close holes and attach components and glue sticks | 1 | 30 |
| Amazon | Gimlet drill set with a diameter of 2.5–5 mm to make holes in the plastic box | 1 | 10 | |
| VWR (Leuven, Belgium) | Precision balance SE 422 with readability of 0.01 g (inv. nr. 611-3299) | 1 | 350 | |
| Temperature calibration | Ikea (Antwerp, Belgium) | Food container with lid, 5.2 l (inv. nr. 692.768.07) | 1 | 8 |
| Amazon | Digital LED Thermostat Temperature Controller with Sensor Probe, MH1210A Mini (12 VDC) | 1 | 18 | |
| Amazon | Axial fan SUNON 12 VDC, 0.58 W, 60 × 60 × 15 mm (inv. nr. MF60151V31000UA99) | 2 | 7 | |
| RS online (Brussels, Belgium) | RS PRO Mica Heating Pad, 80 W, 230 V AC (inv. nr. 790-4842) | 1 | 34 | |
| VWR | Glass thermometer with range 0–70 °C (inv. nr. 620-0889) | 1 | 56 | |
| Amazon | WiMas Peltier TEC1-12706 Thermoelectric Cooler | 1 | 23 | |
| Relative humidity calibration | Sigma Aldrich (Darmstadt, Germany) | Glycerol ReagentPlus, ≥99.0%, 1 L (inv. nr. G7757-1L) | 1 | 103 |
| VWR | Blaubrand Calibrated pycnometer of 10 mL (inv. nr. 614-0702) | 1 | 53 | |
| VWR | Petri dish in glass with a diameter of 150 mm | 1 | 16 | |
| Gas calibration | Pressure connection tube, 1.5 × 2.8 mm, Luer lock connector | 1 | 1 | |
| Amazon | Polytetrafluoroethylene (PTFE)/Teflon tube with an outer diameter of 6 mm and an inner diameter of 4 mm. | 1 | 13 | |
| Amazon | DEWIN Micro Vacuum Pump, Mini Motor for Air Pump, DC 12 V | 1 | 12 | |
| Mouser, Eindhoven, Netherlands | DIN-Rail Power Supply of Traco power 88%, 12 V, 6.7 A, 80 W, Adjustable (inv. nr. TIB 080-112EX) | 1 | 108 | |
| VWR | Gas washing bottles, Drechsel pattern, VitraPOR® (inv. nr. ROBU40100) | 2 | 82 | |
| VWR | U-shaped drying tube in glass with a length of 100 mm (inv. nr. LENZ05339010) | 1 | 24 | |
| VWR | Supelco silicagel of 1 kg in a glass bottle (inv. nr.: 717185-1KG) | 1 | 93 | |
| Gas production | Amazon | Terumo syringe, Luer lock, no needle, volume: 5 mL, box of 100 | 1 | 14 |
| 3-Way Blue Sterile Stopcock for Intravenous Drips | 2 | 1 | ||
| Minimum volume extension tube, 180 cm, Luer Lock, Dead Space = 1.2 mL | 1 | 3 |
| Code | Site | Position | Sampling Period | Sampling Rate | Variables | Sensor Nr. |
|---|---|---|---|---|---|---|
| Y | Yabu | 22°45′58.23″ N, 80°02′21.15″ W | 14–29 February 2020 | 300 s | T (°C), RH (%) | 1 |
| F | Farm | 22°42′63.74″ N, 79°96′38.64″ W | 4–6 March 2020 | 7 s | T (°C), RH (%) | 2 |
| CO2 (ppm) | 3 | |||||
| D | Doctor’s office | 22°40′36.78″ N, 79°97′58.19″ W | 4–6 March 2020 | 7 s | T (°C), RH (%) | 1 |
| CO2 (ppm) | 4 |
| Variable | Measuring Point | Total Data Points | Average | Maximum | Minimum | Standard Deviation | Asymmetry Coefficient |
|---|---|---|---|---|---|---|---|
| T (°C) | Yabu | 4869 | 27 | 32.4 | 12.9 | 3.1 | −0.58 |
| Farm | 99,837 | 28 | 43.0 | 20.6 | 5.6 | 0.99 | |
| Doctor’s ofice | 27,734 | 33 | 38.6 | 28.1 | 2.9 | 0.41 | |
| RH (%) | Yabu | 4869 | 65 | 83.5 | 20.5 | 9.7 | −0.73 |
| Farm | 99,837 | 43 | 78.9 | 21.7 | 17.3 | −0.21 | |
| Doctor’s ofice | 27,734 | 62 | 92.5 | 31.2 | 16.0 | −0.03 | |
| CO2 (ppm) | Farm | 99,837 | 485 | 637.0 | 417.3 | 36.5 | 1.12 |
| Doctor’s ofice | 27,734 | 570 | 671.9 | 493.1 | 23.6 | −0.44 |
Disclaimer/Publisher’s Note: The statements, opinions and data contained in all publications are solely those of the individual author(s) and contributor(s) and not of MDPI and/or the editor(s). MDPI and/or the editor(s) disclaim responsibility for any injury to people or property resulting from any ideas, methods, instructions or products referred to in the content. |
© 2023 by the authors. Licensee MDPI, Basel, Switzerland. This article is an open access article distributed under the terms and conditions of the Creative Commons Attribution (CC BY) license (https://creativecommons.org/licenses/by/4.0/).
Share and Cite
González Rivero, R.A.; Morera Hernández, L.E.; Schalm, O.; Hernández Rodríguez, E.; Alejo Sánchez, D.; Morales Pérez, M.C.; Nuñez Caraballo, V.; Jacobs, W.; Martinez Laguardia, A. A Low-Cost Calibration Method for Temperature, Relative Humidity, and Carbon Dioxide Sensors Used in Air Quality Monitoring Systems. Atmosphere 2023, 14, 191. https://doi.org/10.3390/atmos14020191
González Rivero RA, Morera Hernández LE, Schalm O, Hernández Rodríguez E, Alejo Sánchez D, Morales Pérez MC, Nuñez Caraballo V, Jacobs W, Martinez Laguardia A. A Low-Cost Calibration Method for Temperature, Relative Humidity, and Carbon Dioxide Sensors Used in Air Quality Monitoring Systems. Atmosphere. 2023; 14(2):191. https://doi.org/10.3390/atmos14020191
Chicago/Turabian StyleGonzález Rivero, Rosa Amalia, Luis Ernesto Morera Hernández, Olivier Schalm, Erik Hernández Rodríguez, Daniellys Alejo Sánchez, Mayra C. Morales Pérez, Vladimir Nuñez Caraballo, Werner Jacobs, and Alain Martinez Laguardia. 2023. "A Low-Cost Calibration Method for Temperature, Relative Humidity, and Carbon Dioxide Sensors Used in Air Quality Monitoring Systems" Atmosphere 14, no. 2: 191. https://doi.org/10.3390/atmos14020191
APA StyleGonzález Rivero, R. A., Morera Hernández, L. E., Schalm, O., Hernández Rodríguez, E., Alejo Sánchez, D., Morales Pérez, M. C., Nuñez Caraballo, V., Jacobs, W., & Martinez Laguardia, A. (2023). A Low-Cost Calibration Method for Temperature, Relative Humidity, and Carbon Dioxide Sensors Used in Air Quality Monitoring Systems. Atmosphere, 14(2), 191. https://doi.org/10.3390/atmos14020191


