1. Introduction
Ambient (external) air pollution is now the primary environmental factor impacting human health [
1], estimated to be responsible for 4.2 million deaths in 2019 [
2]. In Brazil, wildfires represent a significant source of air pollutant emissions, particularly fine particulate matter (PM
2.5) [
3]. The public health impact of wildfires in Brazil has long been analysed [
4], with increasingly improved estimates of short- and long-term implications for morbidity and mortality [
5,
6]. One factor that limits the precision of these estimates is the lack of in loco monitoring data. Although several major metropolitan areas in Brazil possess state-of-the-art air quality monitoring networks, those regions most heavily impacted by wildfires—mainly the northern and midwestern regions—in large part do not [
7]. This lack of information limits the viability of timely environmental health surveillance interventions as well as the development of well-informed public policies to address wildfire-related air degradation in these areas. Remotely sensed estimates of pollutants such as PM
2.5 are useful in this context but lack the spatiotemporal resolution needed for more finely tuned estimates of exposure.
One city in Brazil that lacks adequate air quality monitoring is the nation’s capital, Brasília. Located in the Brazilian savanna region (the Cerrado biome), Brasília has a population of 2,817,068 residents and covers an area of 5760 square kilometres [
8], resulting in one of the highest population densities in the country by state. Previous work investigating air pollution in Brasília has focused on source apportionment through land-use regression models [
9] and chemical analyses of high-volume sample materials of PM in Brasília and has linked episodes of poor air quality in the city to burning events in the Cerrado [
10]. This complements other research in this area which has shown that smoke emitted during the Brazilian wildfire season can travel long distances, leading to air pollution episodes in cities hundreds of kilometres away [
11].
The city’s environmental regulatory agency conducts monthly air quality monitoring at six sites throughout the capital, measuring levels of inhalable particulate matter (PM
10) and total suspended particles (TSP) by using high-volume samplers. A technique that dates back to the 1960s [
12], high-volume sampling remain a valid approach to determining particulate concentrations [
13]. However, the required sampling period and the need to retrieve and weight the samples limit the temporal coverage that can be achieved through such devices as well as the availability of data in a timely manner.
Low-cost air quality sensors have been publicly available for several years, and their introduction to the environmental science field has given new tools to urban decision and policy makers, presenting a wide array of opportunities and challenges [
14]. The ability to deploy spatially dense networks of air quality sensors that transmit unprecedented volumes of data in real time, much of which is publicly available, has resulted in new paradigms for hyperlocal air pollution mapping [
15]. While not capable of providing the same level of validity as regulatory-grade monitoring stations, these technologies have their own benefits, such as being easy to deploy in the field and requiring little or no technical support to operate. Most are also able to make readings at a high frequency and transmit them in real time, which is particularly important in detecting and responding to air pollution episodes. Many low-cost sensors have also undergone independent testing to compare their performance to reference monitors.
Low-cost sensors have been deployed in multiple cases to detect wildfire smoke, with one study reporting good performance during collocation with reference monitors during the 2018–19 wildfire seasons [
16]. In this study, the PurpleAir Sensor (hereafter PA sensor) showed the highest correlation with the collocated reference monitor, although it is noted that the sensor tends to overestimate PM
2.5 at concentrations over 200 µg/m
3. In another study, which used the same Plantower measuring device, He et al. were able to detect the impact of wildfire smoke in Seattle on both outdoor and indoor PM
2.5 concentrations during a particular episode in the 2020 wildfire season [
17]. Other work in this area conducted in Brasília has, in fact, employed the use of low-cost sensors and calibrated them using the current high-volume samplers [
18]. This study builds on this work by using an extended sampling period and incorporating measurements of PM
2.5.
The main goal of this study was to obtain particulate matter measurements during the period from 2022 to 2023 in Brasília. Specifically, the study aimed to describe PM2.5 concentrations throughout the year analysed as well as the spatial distribution of wildfires during this period and assess the contribution of such biomass burning events to the concentrations observed at the study site. The data collected show elevated levels of particulate matter during periods that correspond to the Brazilian wildfire season and indicate a significant contribution of biomass burning to PM2.5 concentrations in the city.
2. Materials and Methods
2.1. Overview
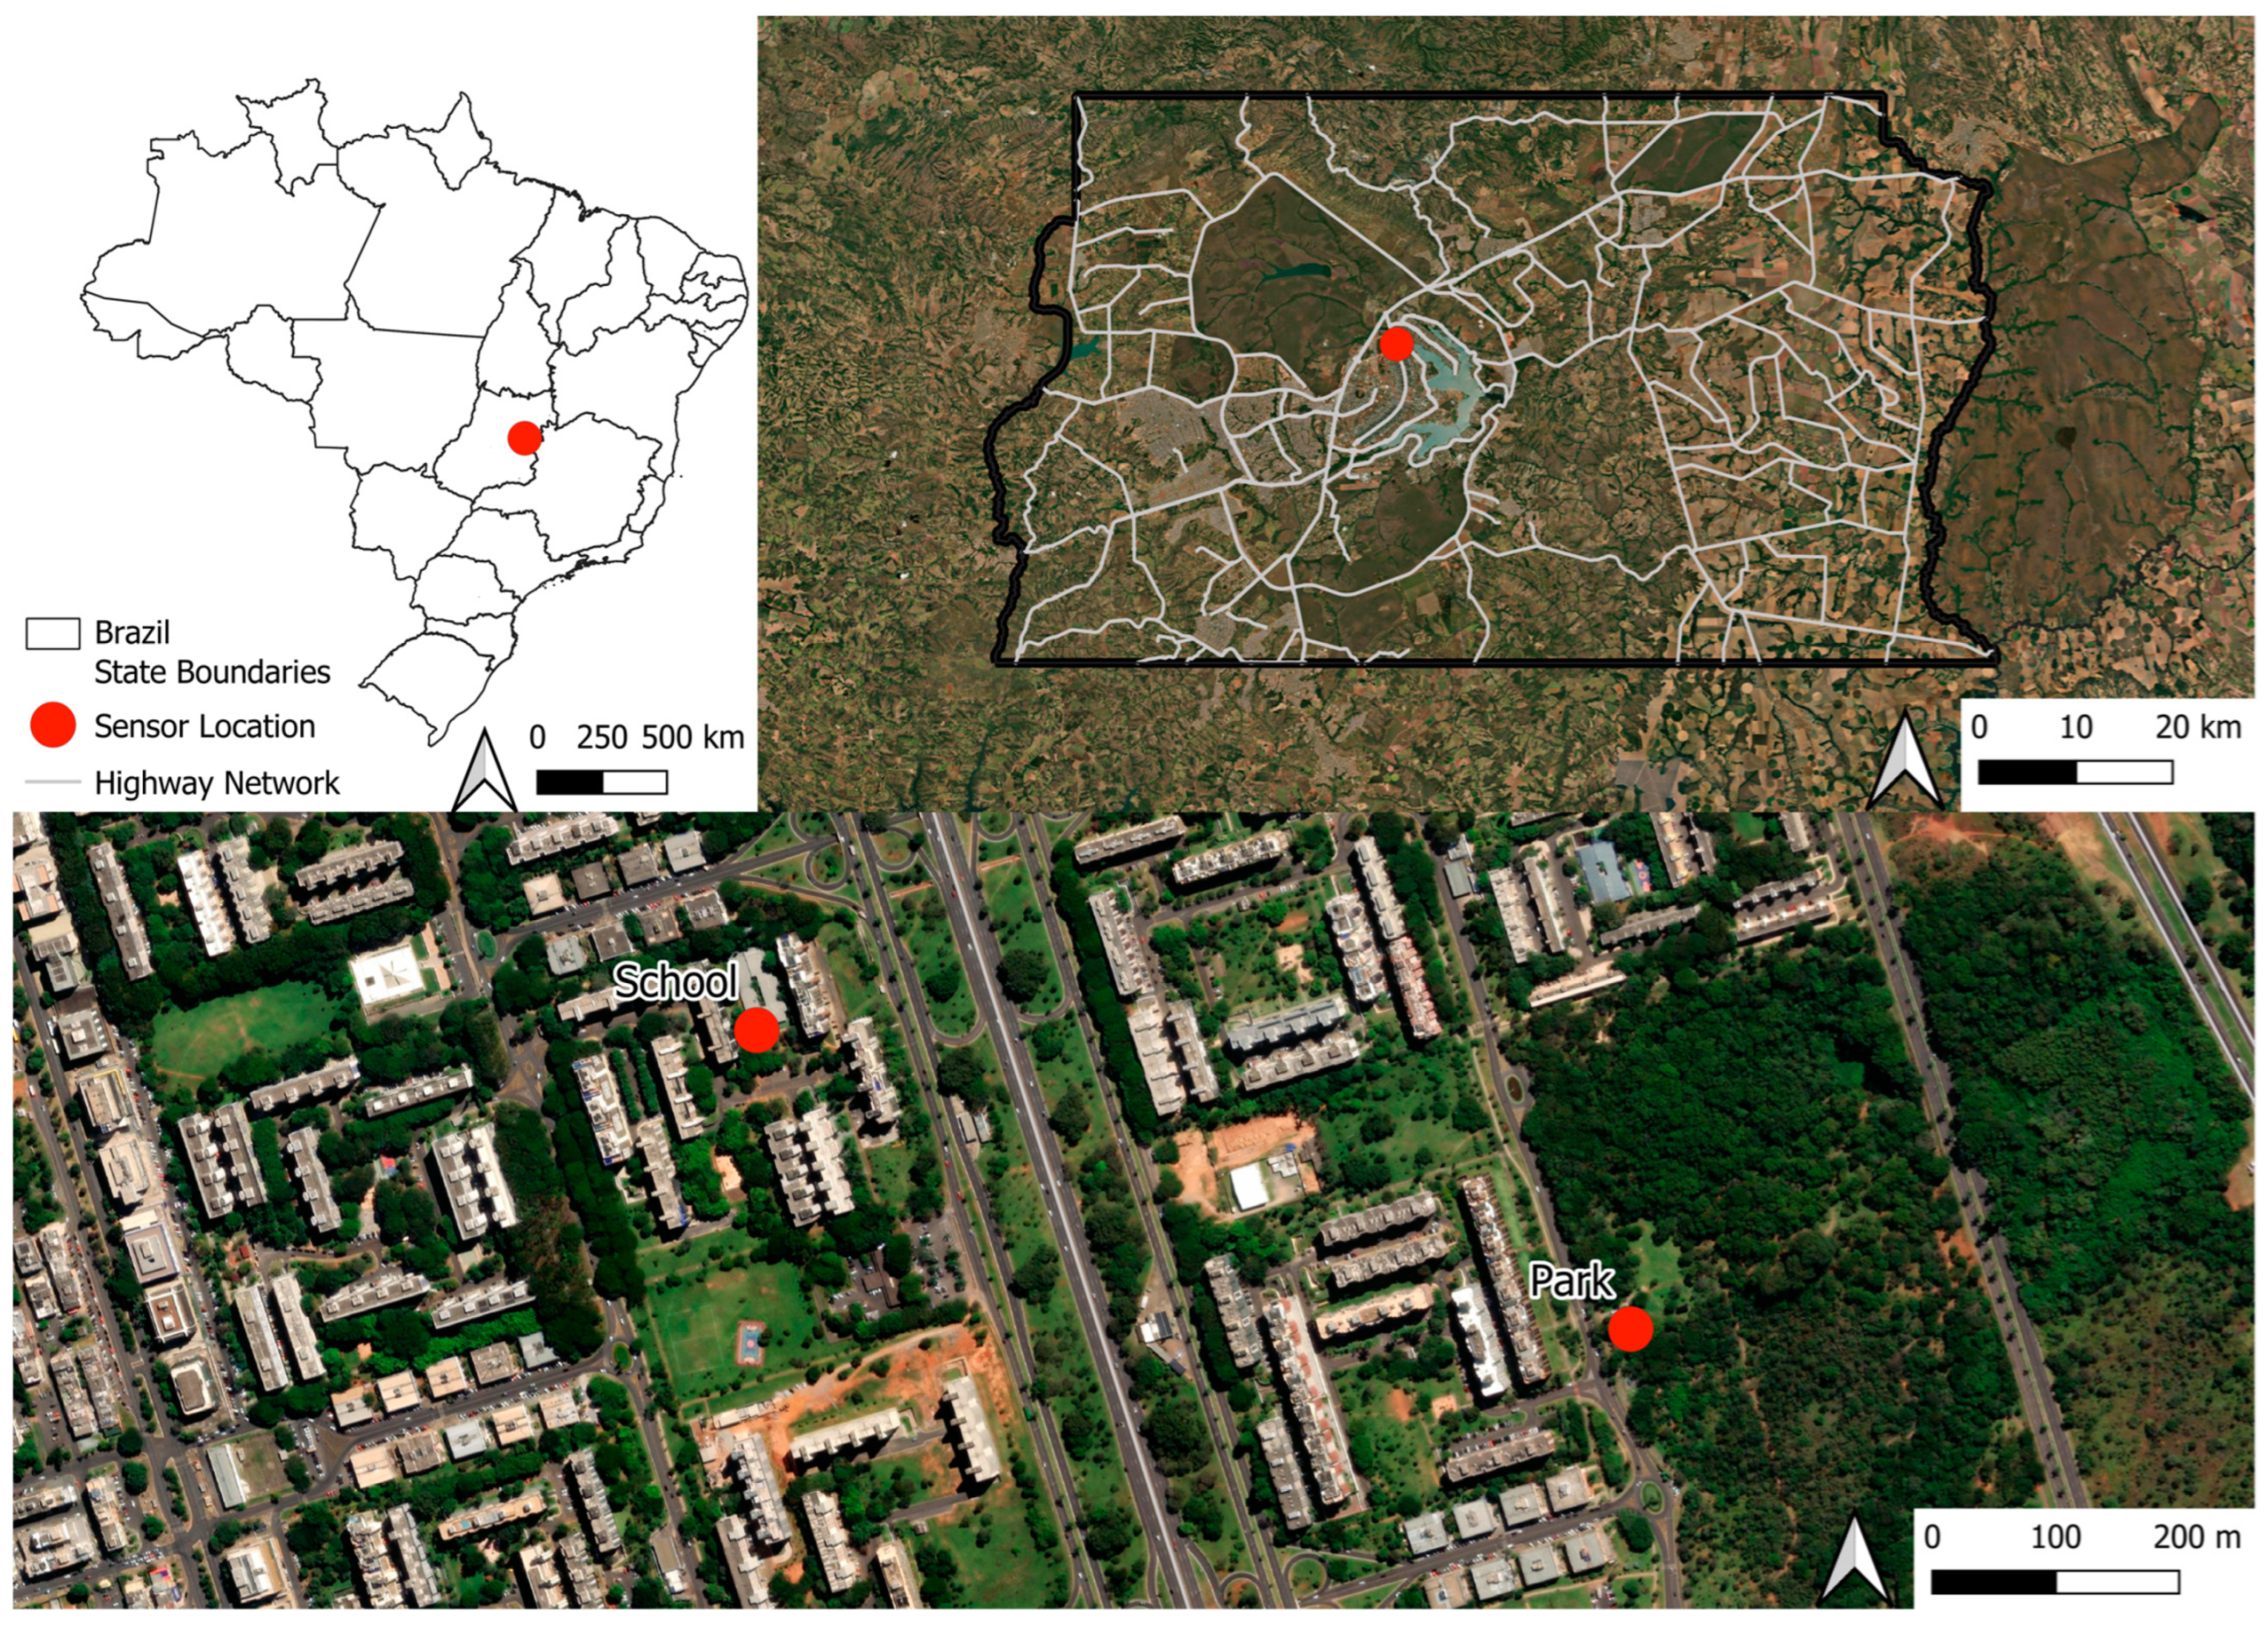
In this study, we deployed two PurpleAir PA-II-SD model sensors to measure air quality in Brasília, in the Federal District of Brazil. While one was located within a city park, the other was located in a populous neighbourhood and closer to major highways; these locations were selected to assess the impact that green/blue areas may have on mitigating particulate matter concentrations [
19,
20]. The data collected over the course of one year were analysed using R Studio to describe temporal PM
2.5 variations and then combined with particle trajectory analysis using the Hysplit model to assess possible source contributions.
2.2. Sensor Installation
Two PA sensors were acquired for this study. This model of sensor was chosen because of its relatively low cost and practicality as well its history of use in previous studies. The PA sensor has a retail cost of approximately USD 300 and does not require calibration or maintenance after installation, provided the instruments are functioning normally. Instruments that meet the EPA’s monitoring standards for Federal Reference Methods and Federal Equivalent Methods, for comparison, have costs that can range from USD 15,000 to 40,000. Additionally, these instruments are rarely used as stand-alone devices, generally requiring robust on-site infrastructure as well as dedicated staff for calibration and quality checks.
The PA sensors use a pair of Plantower PMS5003 laser particle counters and convert their readings into particulate matter concentrations (µg/m
3). The PMS5003 instrument draws air by fan through a set of inlet holes at 0.1 L/min and then routes the air stream through a chamber perpendicular to a laser. Here, a sensor captures 90° light scattering of the laser by converting scattered light to voltage pulses. The particle count values (scattering signal pulses) are transformed into mass readings in µg/m
3 through a proprietary algorithm developed by Plantower. Although the instruments operate at a frequency of 10 s, the highest-resolution readings recorded by the sensor are 2 min averaged data, unless the user manually modifies the sensor [
21,
22]. The sensor uses a separate instrument (BOSCH BME688) to measure meteorological parameters.
Table S1 provides an overview of the PA sensor characteristics and limitations, as reported by the manufacturer.
Although previous studies have successfully deployed PA sensors in remote areas using solar arrays, we opted to use existing electrical infrastructure at both sites. The PA sensor is equipped with an SD card, which stores all measurements, but is also capable of transmitting data continuously to the PurpleAir network through Wi-Fi connection. We connected the sensor to existing Wi-Fi networks at both sites; in addition to allowing for remote data verification, this has the benefit of creating a publicly available repository of data.
Both sensors were installed in the North Wing of Brasília, in the Federal District of Brazil. The first sensor (hereafter ‘park sensor’) was installed on a supporting post of an outdoor pavilion at a municipal park (Olhos d’Água) on 15 April 2022. Several candidate sites were evaluated for the second sensor (hereafter ‘school sensor’), which was eventually installed on a pillar at the entrance to a public elementary school (Escola Classe 115 Norte) on 30 August 2022. Although the SD cards were the primary data access tool, both sensors were connected to onsite Wi-Fi networks for transmission to the PurpleAir platform.
2.3. Site Description
The park sensor is located in a forested municipal park that contains a series of walking paths. The park is 28 hectares in size, includes a small pond (Lagoa do Sapo) and receives around 1000 visitors per weekday (1500/day on the weekend). Due to the limited range of the Wi-Fi network, as well as the need to keep the sensor protected from the elements, the park sensor was installed on an open wood shelter near the park’s main office and is located approximately 30 m from a moderate-traffic arterial avenue. The school sensor is located in a municipal elementary school in the same neighbourhood of Brasília (Asa Norte–North Wing), adjacent to local residential access routes. The park sensor and the school sensor are located approximately 360 and 140 m, respectively, from the major freeway that transects the pilot plan sector of Brasília.
Figure 1 shows the location of both sites within the Federal District of Brazil.
2.4. Air Quality Data Analysis
One full year of raw data from the two sensors were analysed for this study, covering the period from 1 September 2022 to 31 August 2023. To limit data gaps, most data were collected directly from the sensors’ SD cards, although data from the period from 11 August to 31 August 2023 were downloaded using the PurpleAir Data Download Tool and combined with the SD card readings. All data were compiled and manipulated as described below using R Studio. Due to the occasional unreliability of Wi-Fi signals, the transmitted datasets are generally less complete; however, even the SD card readings were impacted by occasional power outages.
Data obtained directly from the SD cards were more complete, with the data obtained online showing more incomplete readings for the school site. However, the data downloaded for this period still have an acceptable number of readings, as presented in
Table 1.
The meteorological parameters measured by the PA sensor are temperature, humidity, dewpoint and pressure, while particulate matter readings are available for three size fractions, being PM1.0, PM2.5 and PM10. For each of these, the readings are available for two correction factors, recommended for applications in indoor (CF = 1) and outdoor (CF = atm) settings. The PA sensor has duplicate particulate measuring instruments for increased redundancy, resulting in two channels (a and b) for each particulate matter parameter. For this study, we used the PM2.5 (cf = 1, a and b channels) and relative humidity data.
The data were organized into 5 min averages for all parameters analysed. Due to an apparent sensor malfunction, the school data included two gaps, during which relative humidity was not recorded by the sensor. The larger of the gaps occurred during the period from early January to mid-February, after which the meteorological sensor resumed reading as normal. This gap resulted in 2.5 × 10⁴ missing 5 min averaged relative humidity readings for the school sensor data. The relative humidity data from the two sensors are highly correlated (p < 0.0001), with values being slightly higher at the park site compared to those at the school site, which is to be expected given the surrounding greenspace. A linear correlation model was, thus, used to fill these gaps using data from the park sensor.
Data cleaning steps were applied to ensure agreement between the two channels of each sensor. The hourly average was calculated for each channel, as well as the total difference and percent difference between the two channels. Hourly average readings were removed if the two channels did not agree by both more than 5 µg/m
3 and by more than 70% [
23]. This cleaning process resulted in the removal of 5 h readings, which are highlighted in
Figure S4.
The a and b channels were averaged to produce a single PM
2.5 time series for each site. The resulting data consisted of 1.05 × 10
5 5 min averaged values for the one-year period analysed for each site. The correction factor developed by the United States Environmental Protection Agency (EPA) was then applied to generate EPA-corrected PM
2.5 values, using the formula below.
The correction factor developed by Barkjohn et al. for PM2.5 data was derived from PA sensors.
This correction factor was developed by Barkjohn et al. through comparisons of PA data to reference regulatory monitoring data and reduces error and bias compared to the raw cf = 1 output [
21].
Once all monitoring data were combined and corrected, the R package Openair [
24] was used to generate graphs showing average daily and hourly concentrations. This package has many functionalities and has been used in conjunction with PurpleAir data to describe temporal and spatial variations in particulate matter concentrations for similar applications [
25,
26]. For the Hysplit analyses (below), the data from both sensors were averaged to obtain a single series for the city.
2.5. Wildfire Hotspot Analysis
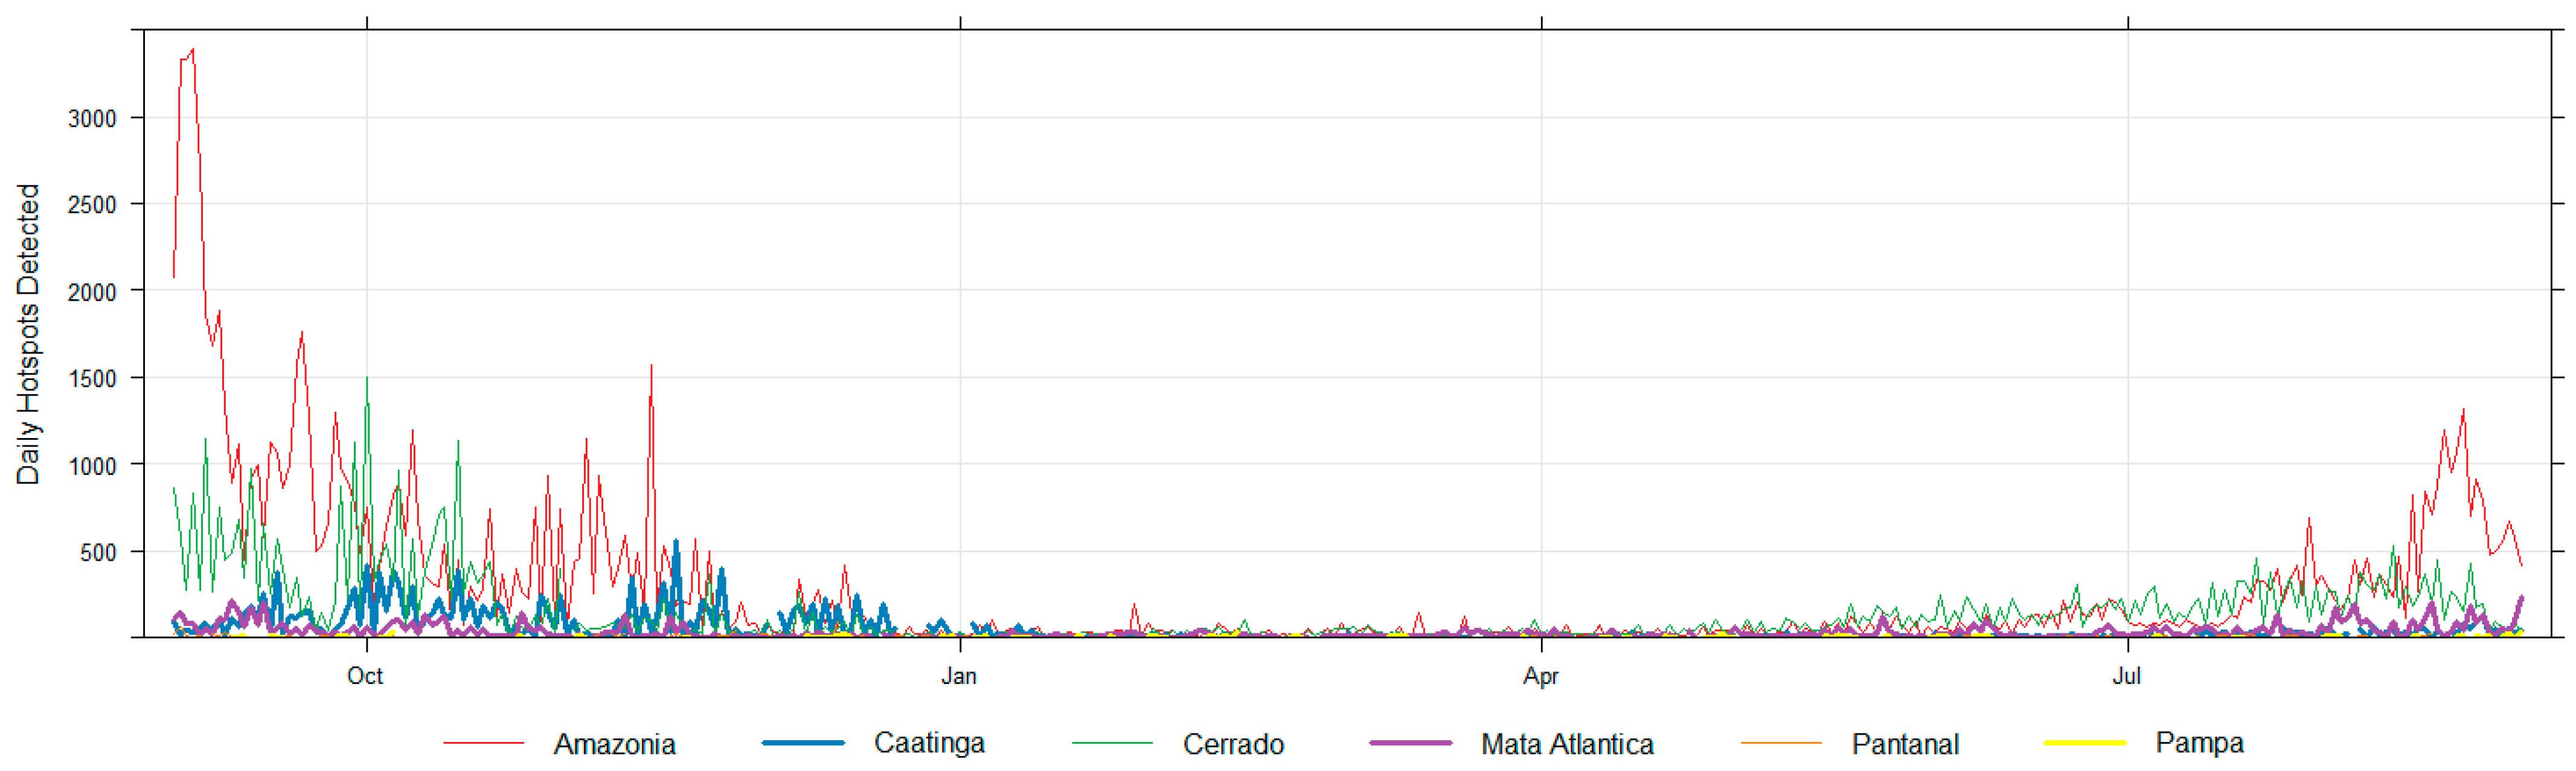
To describe wildfire distribution throughout the study period, wildfire hotspot detection data were acquired from the Brazilian Space Research Institute (Instituto Nacional de Pesquisa Espacial—INPE) platform BDQueimadas for the whole study period. The ‘reference satellite’ was selected for the wildfire hotspot detection data. The satellite uses data from Aqua’s MODIS sensor, specifically data that correspond to the afternoon period in Brazil [
27,
28]. The wildfire hotspot data were then separated by biome and graphed using the same Openair package.
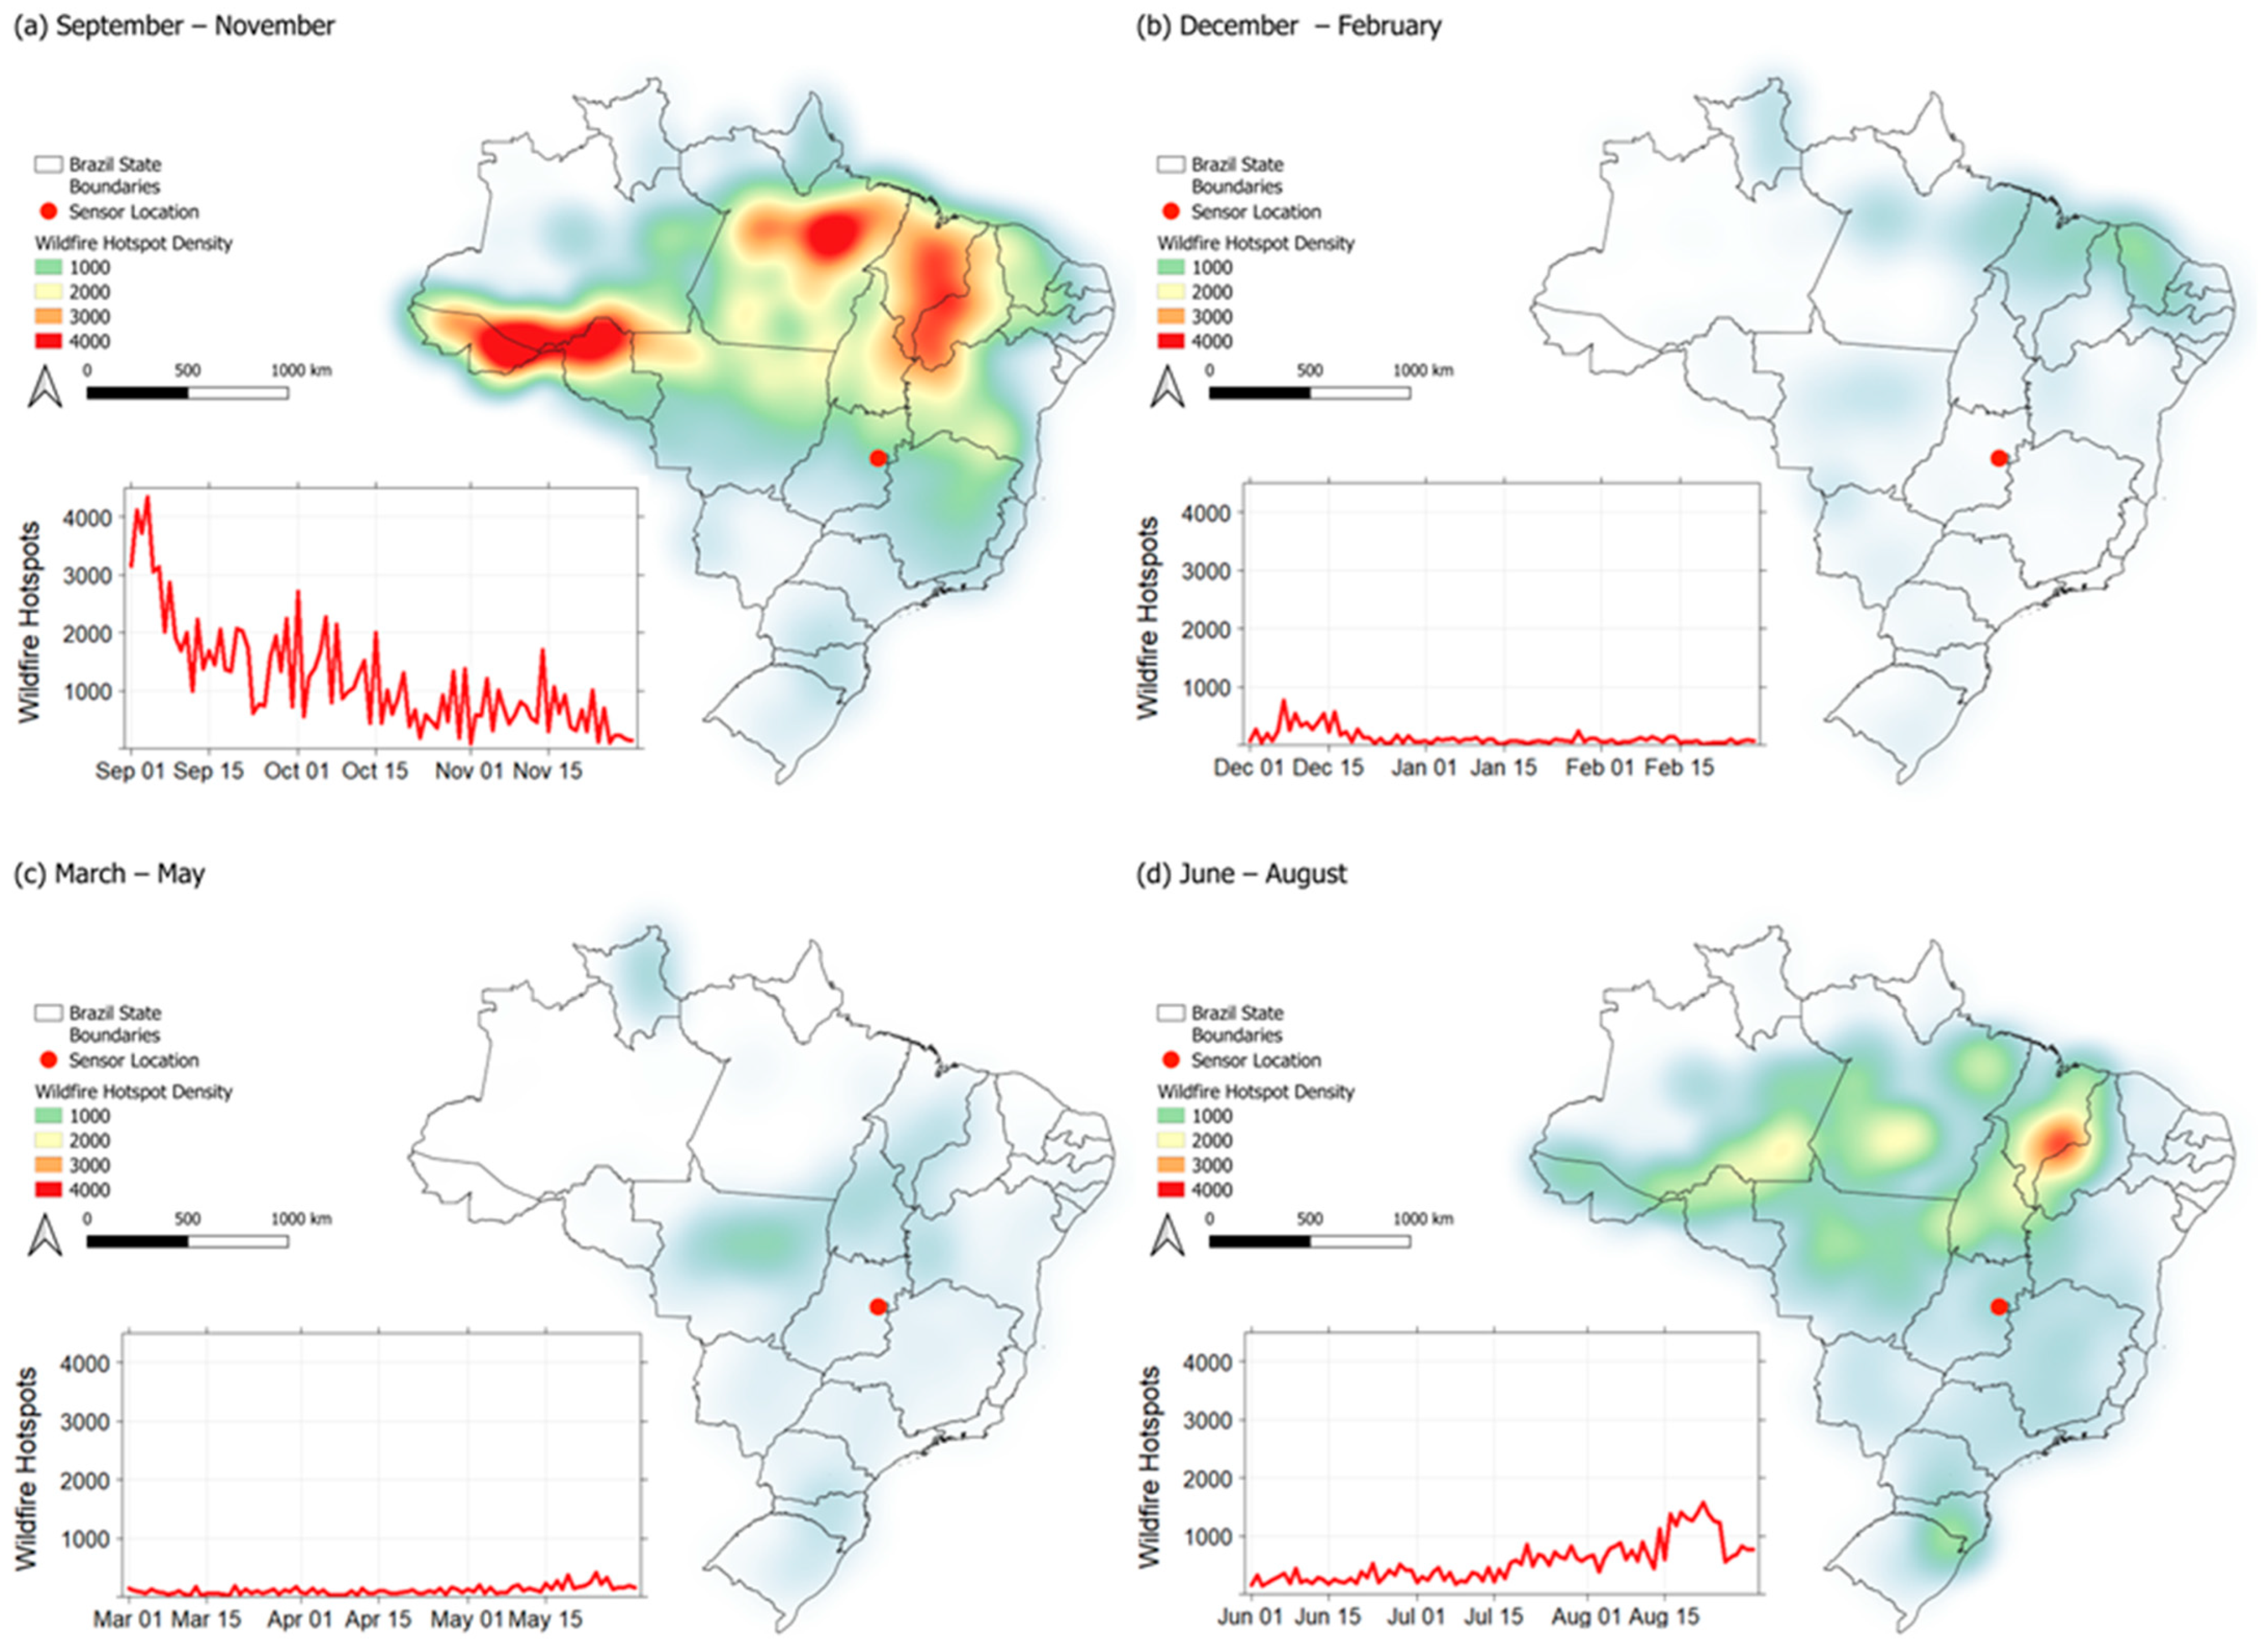
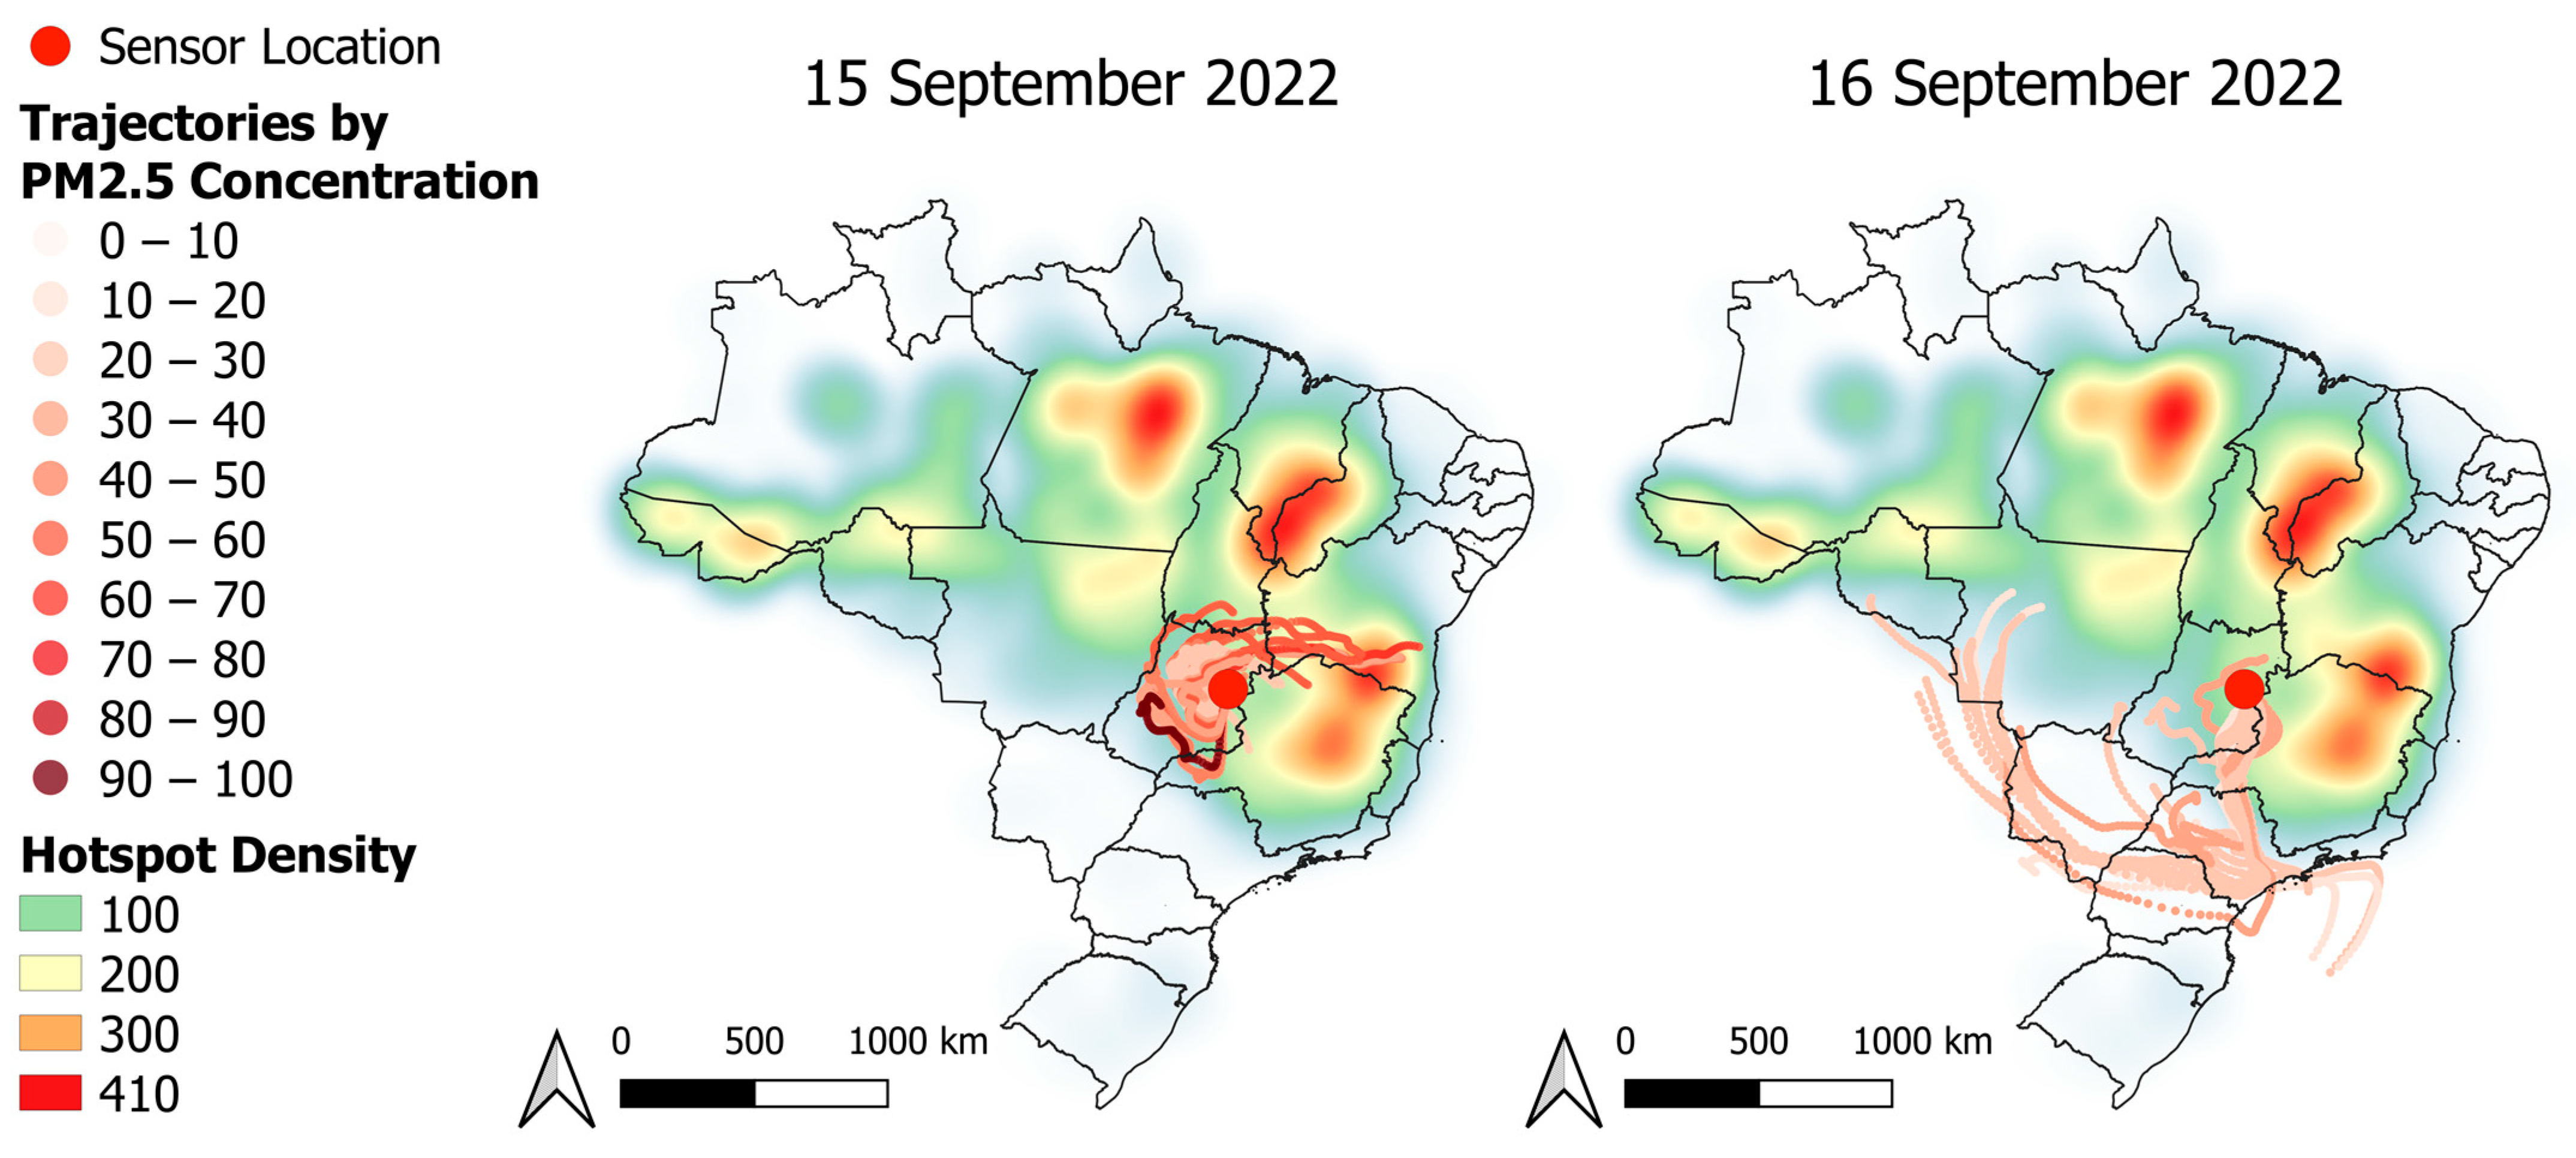
To visualize wildfire hotspot density throughout the year, the wildfire hotspots detected during the study period were broken into yearly quarters and raster files were created by applying a kernel function to the wildfire hotspot shapefile (radius used: 300 km). For the day that corresponded to the highest concentrations observed, five days of accumulated wildfire hotspot data were mapped using the same kernel function, alongside the Hysplit trajectories for that day (see below).
Lastly, 5-day averages of hotspots detected in Brazil were calculated for each day in the study period and compared to 5-day averages of PM2.5 using a standard Pearson correlation test.
2.6. Hysplit Analyses
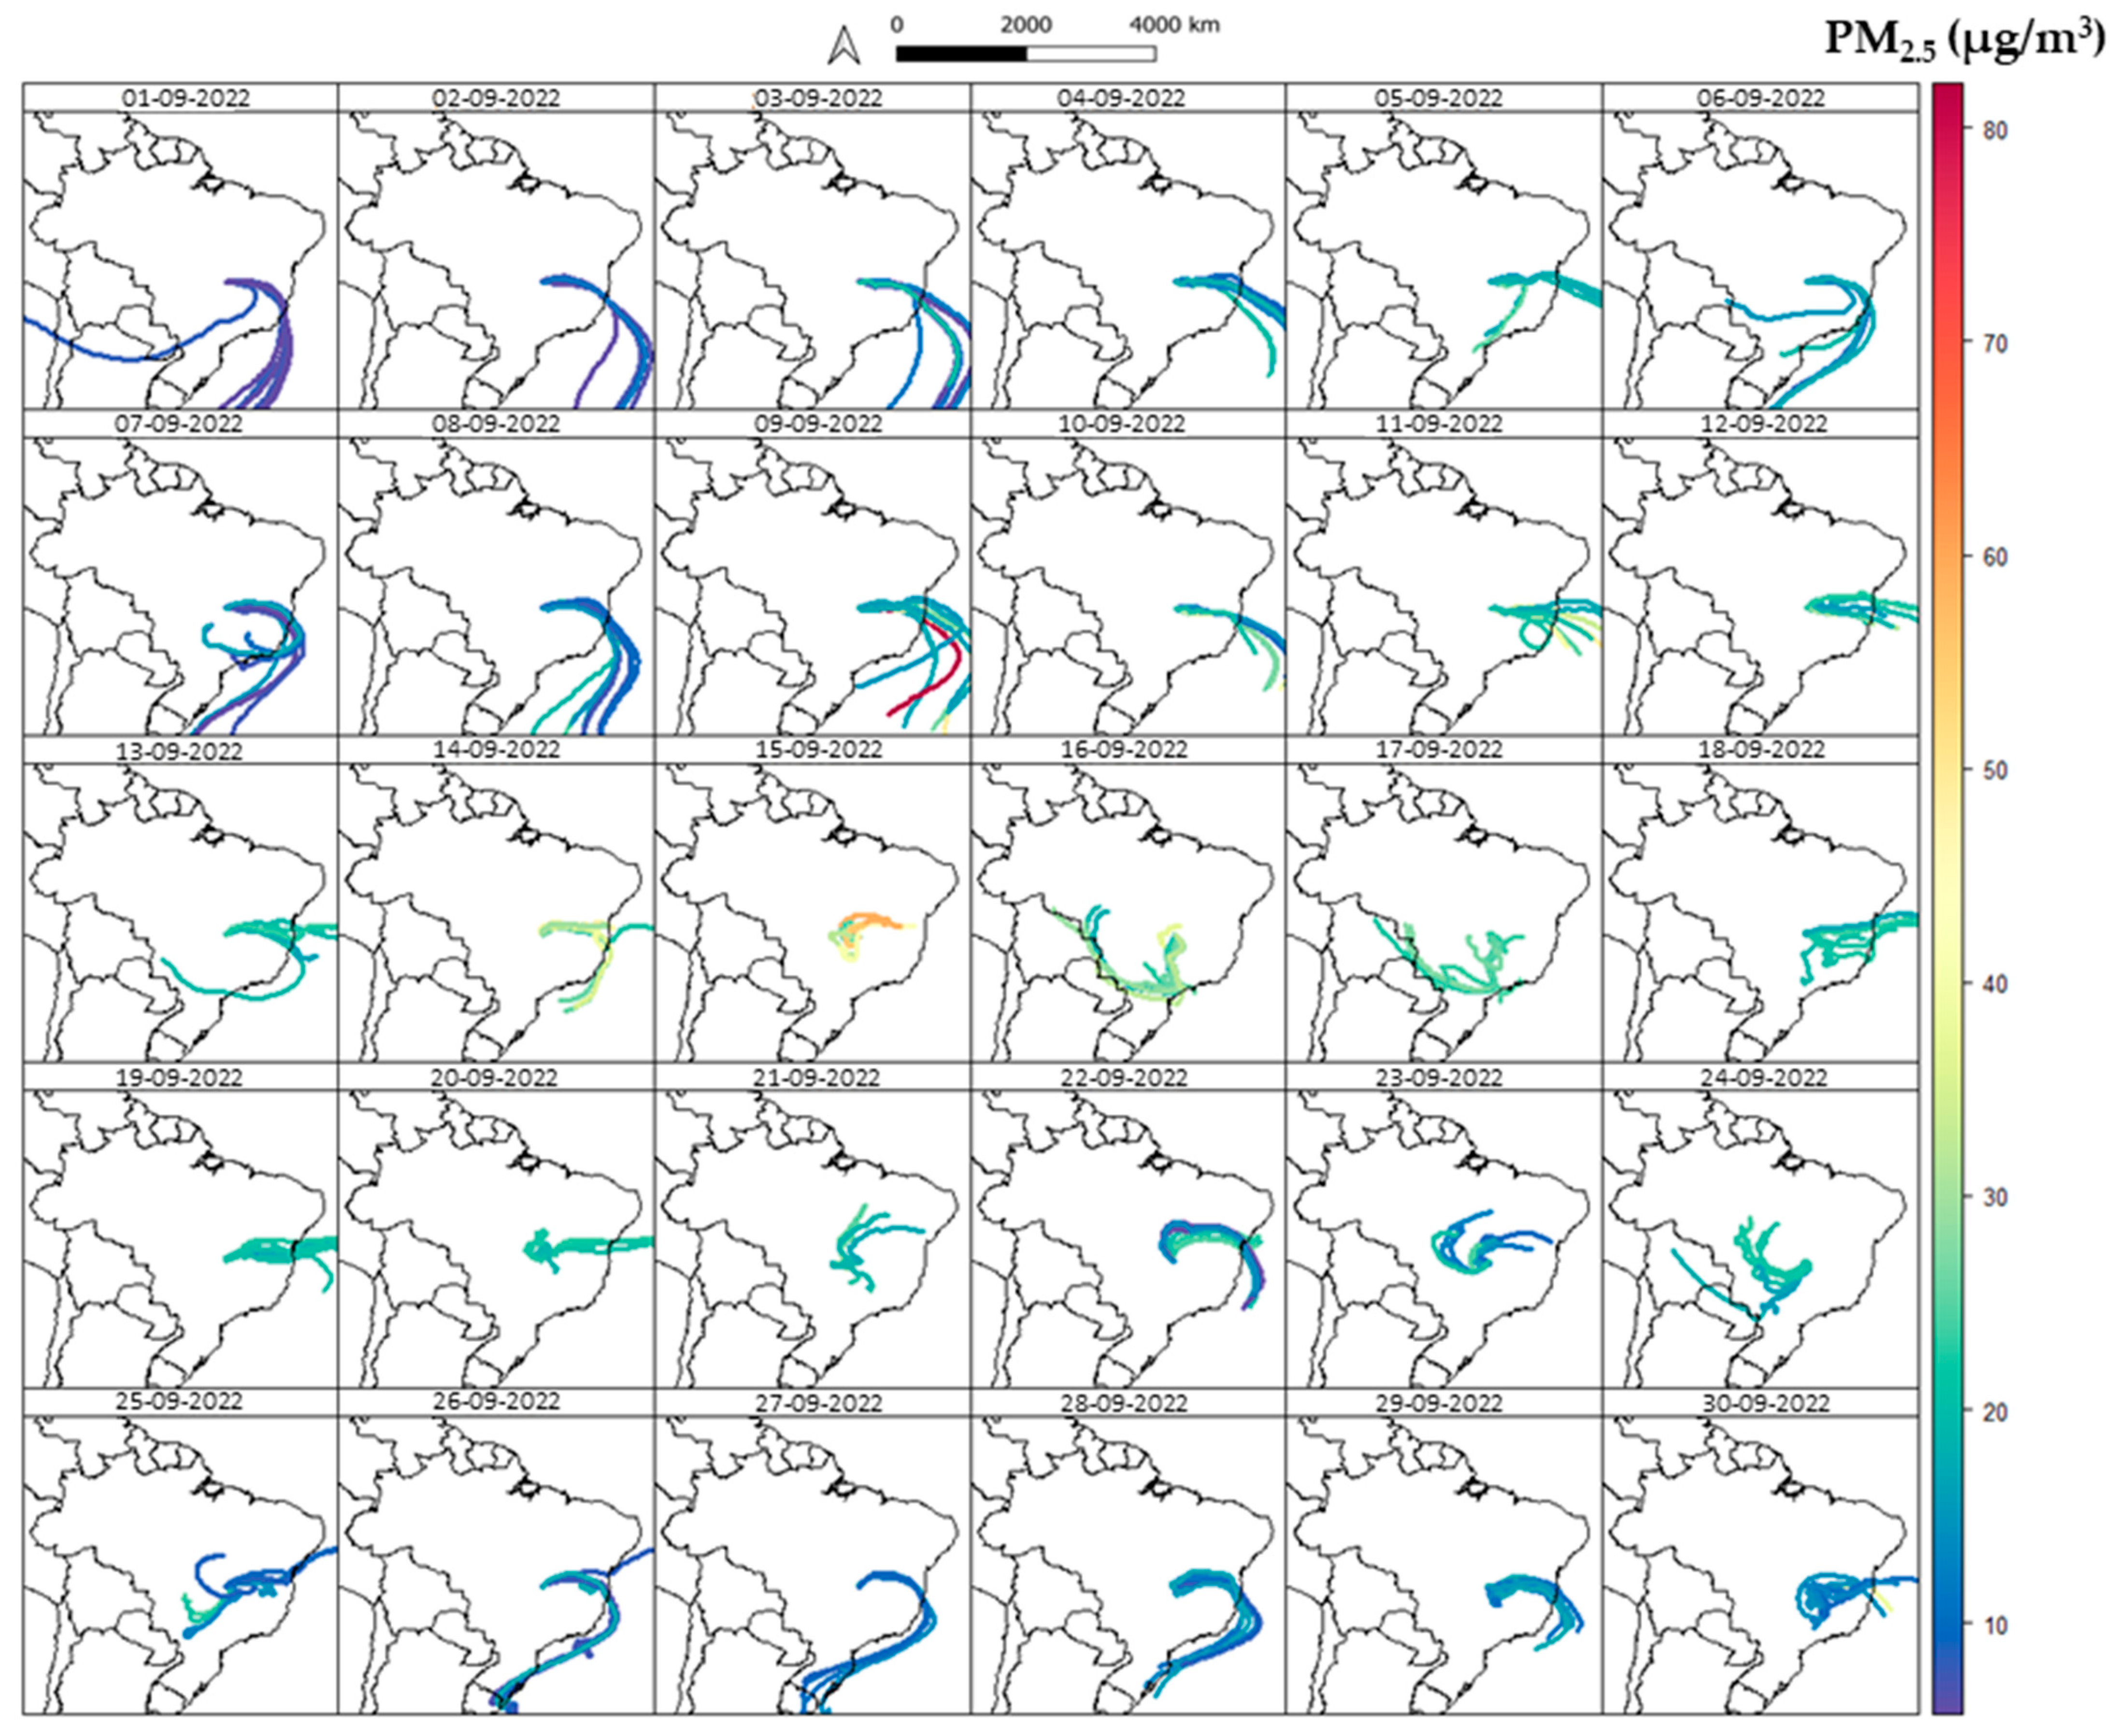
The Hysplit analyses focused on the main PM2.5 episode observed during the study period, having occurred in September 2022, and were performed in R Studio using the packages Openair and Splitr. Given the close proximity of the sensors, along with the model resolution, the model was run using the midpoint of the two sensors as the reference location. For the one-month period that corresponded to the maximum peak observed during this episode, the backwards trajectories were generated for 120 h paths at 3 h intervals, using a height of 250 m. The meteorological model selected for these trajectories was gdas1. The Hysplit model’s output trajectory data were combined with the PM2.5 concentration data using R Studio to identify the trajectories that corresponded to peak concentrations observed in September 2022. For the peak concentration date—15 September 2022—the same parameters were used but the trajectories were generated at 1 h intervals. These trajectories, corresponding to the highest concentrations observed during the episode, were then mapped in QGIS to combine this information with wildfire hotspots detected during the same period.
2.7. Source Allocation
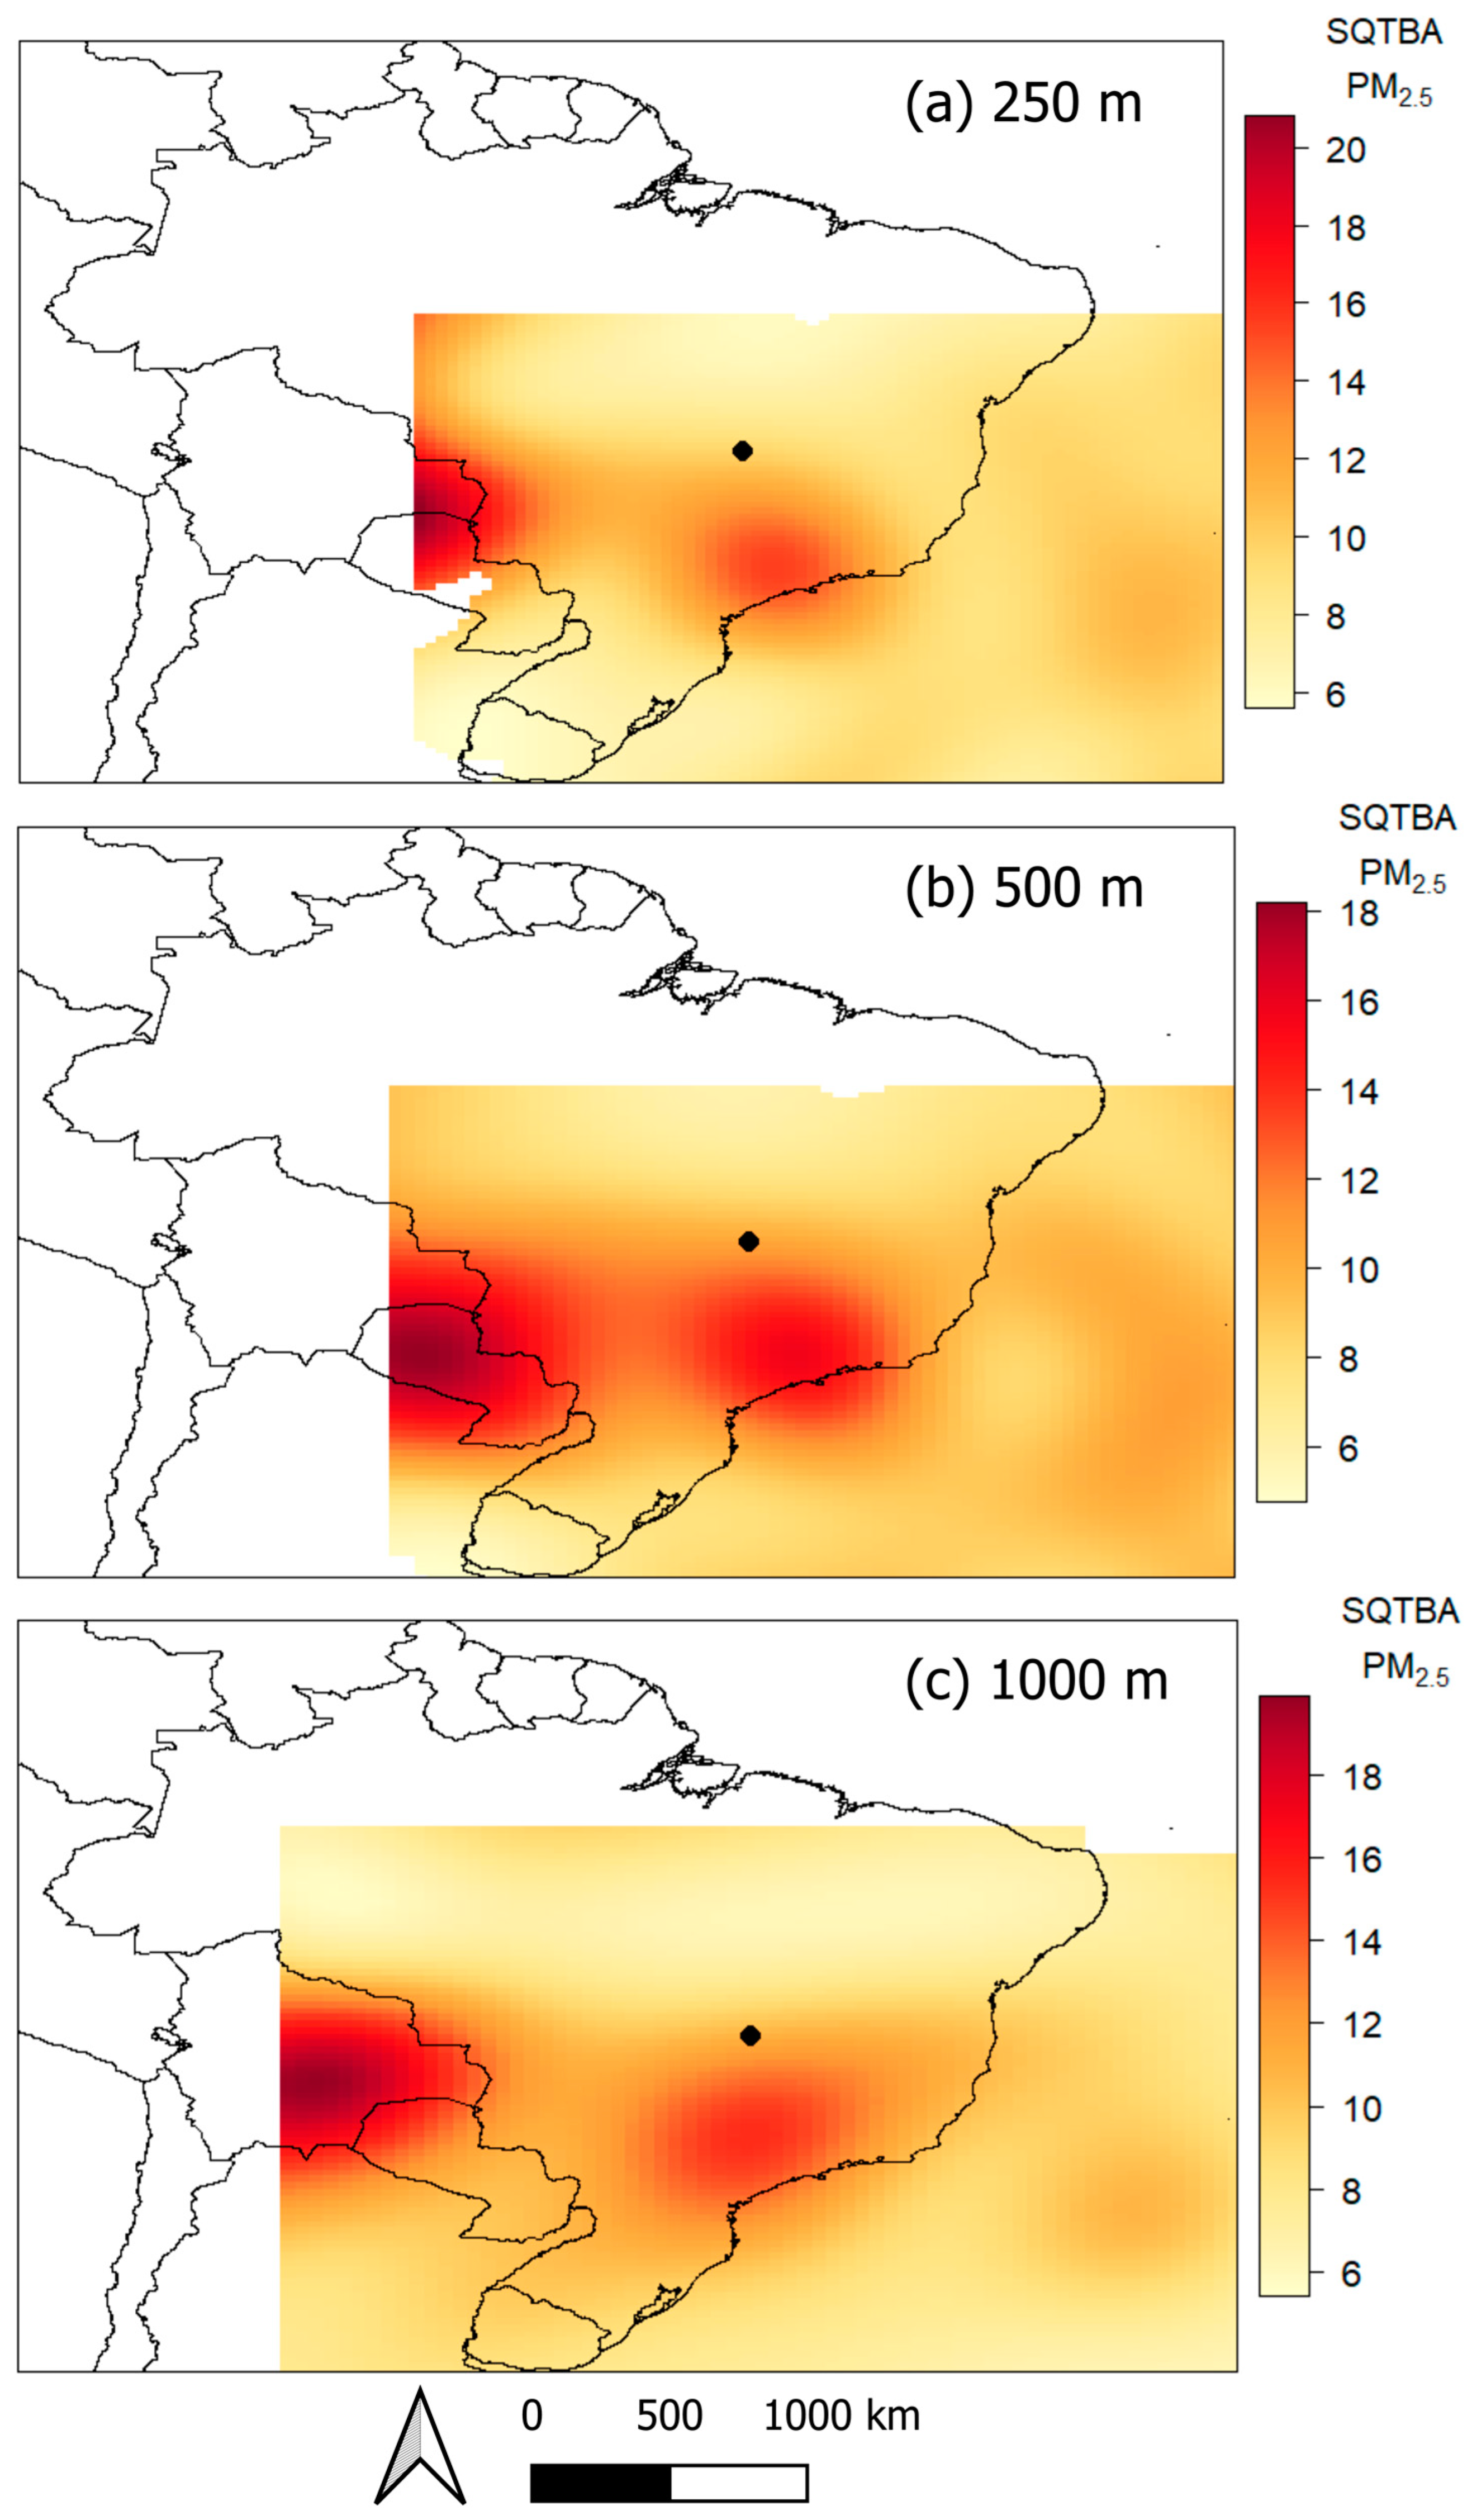
Although the trajectory analyses for the peak episode shed some light on the origin of air masses during this period, it is difficult to identify what specific areas throughout the region contribute to PM2.5 concentrations throughout the year. To better understand these processes over a longer time series, Hysplit trajectories were generated for the entire study period. In this case, backwards trajectories were generated for 120 h paths at 3 h intervals, using heights of 250, 500 and 1000 m. The meteorological model selected for this analysis was NCEP/NCAR Reanalysis 1. The resulting trajectory data were once again joined with the averaged sensor data for the entire study period.
We then used simplified quantitative transport bias analysis (SQTBA) to identify possible contributing sources throughout the study period. This technique uses trajectory and concentration data and estimates the likely contribution of different areas on a grid to the receptor (sensor site) [
29,
30].
4. Discussion
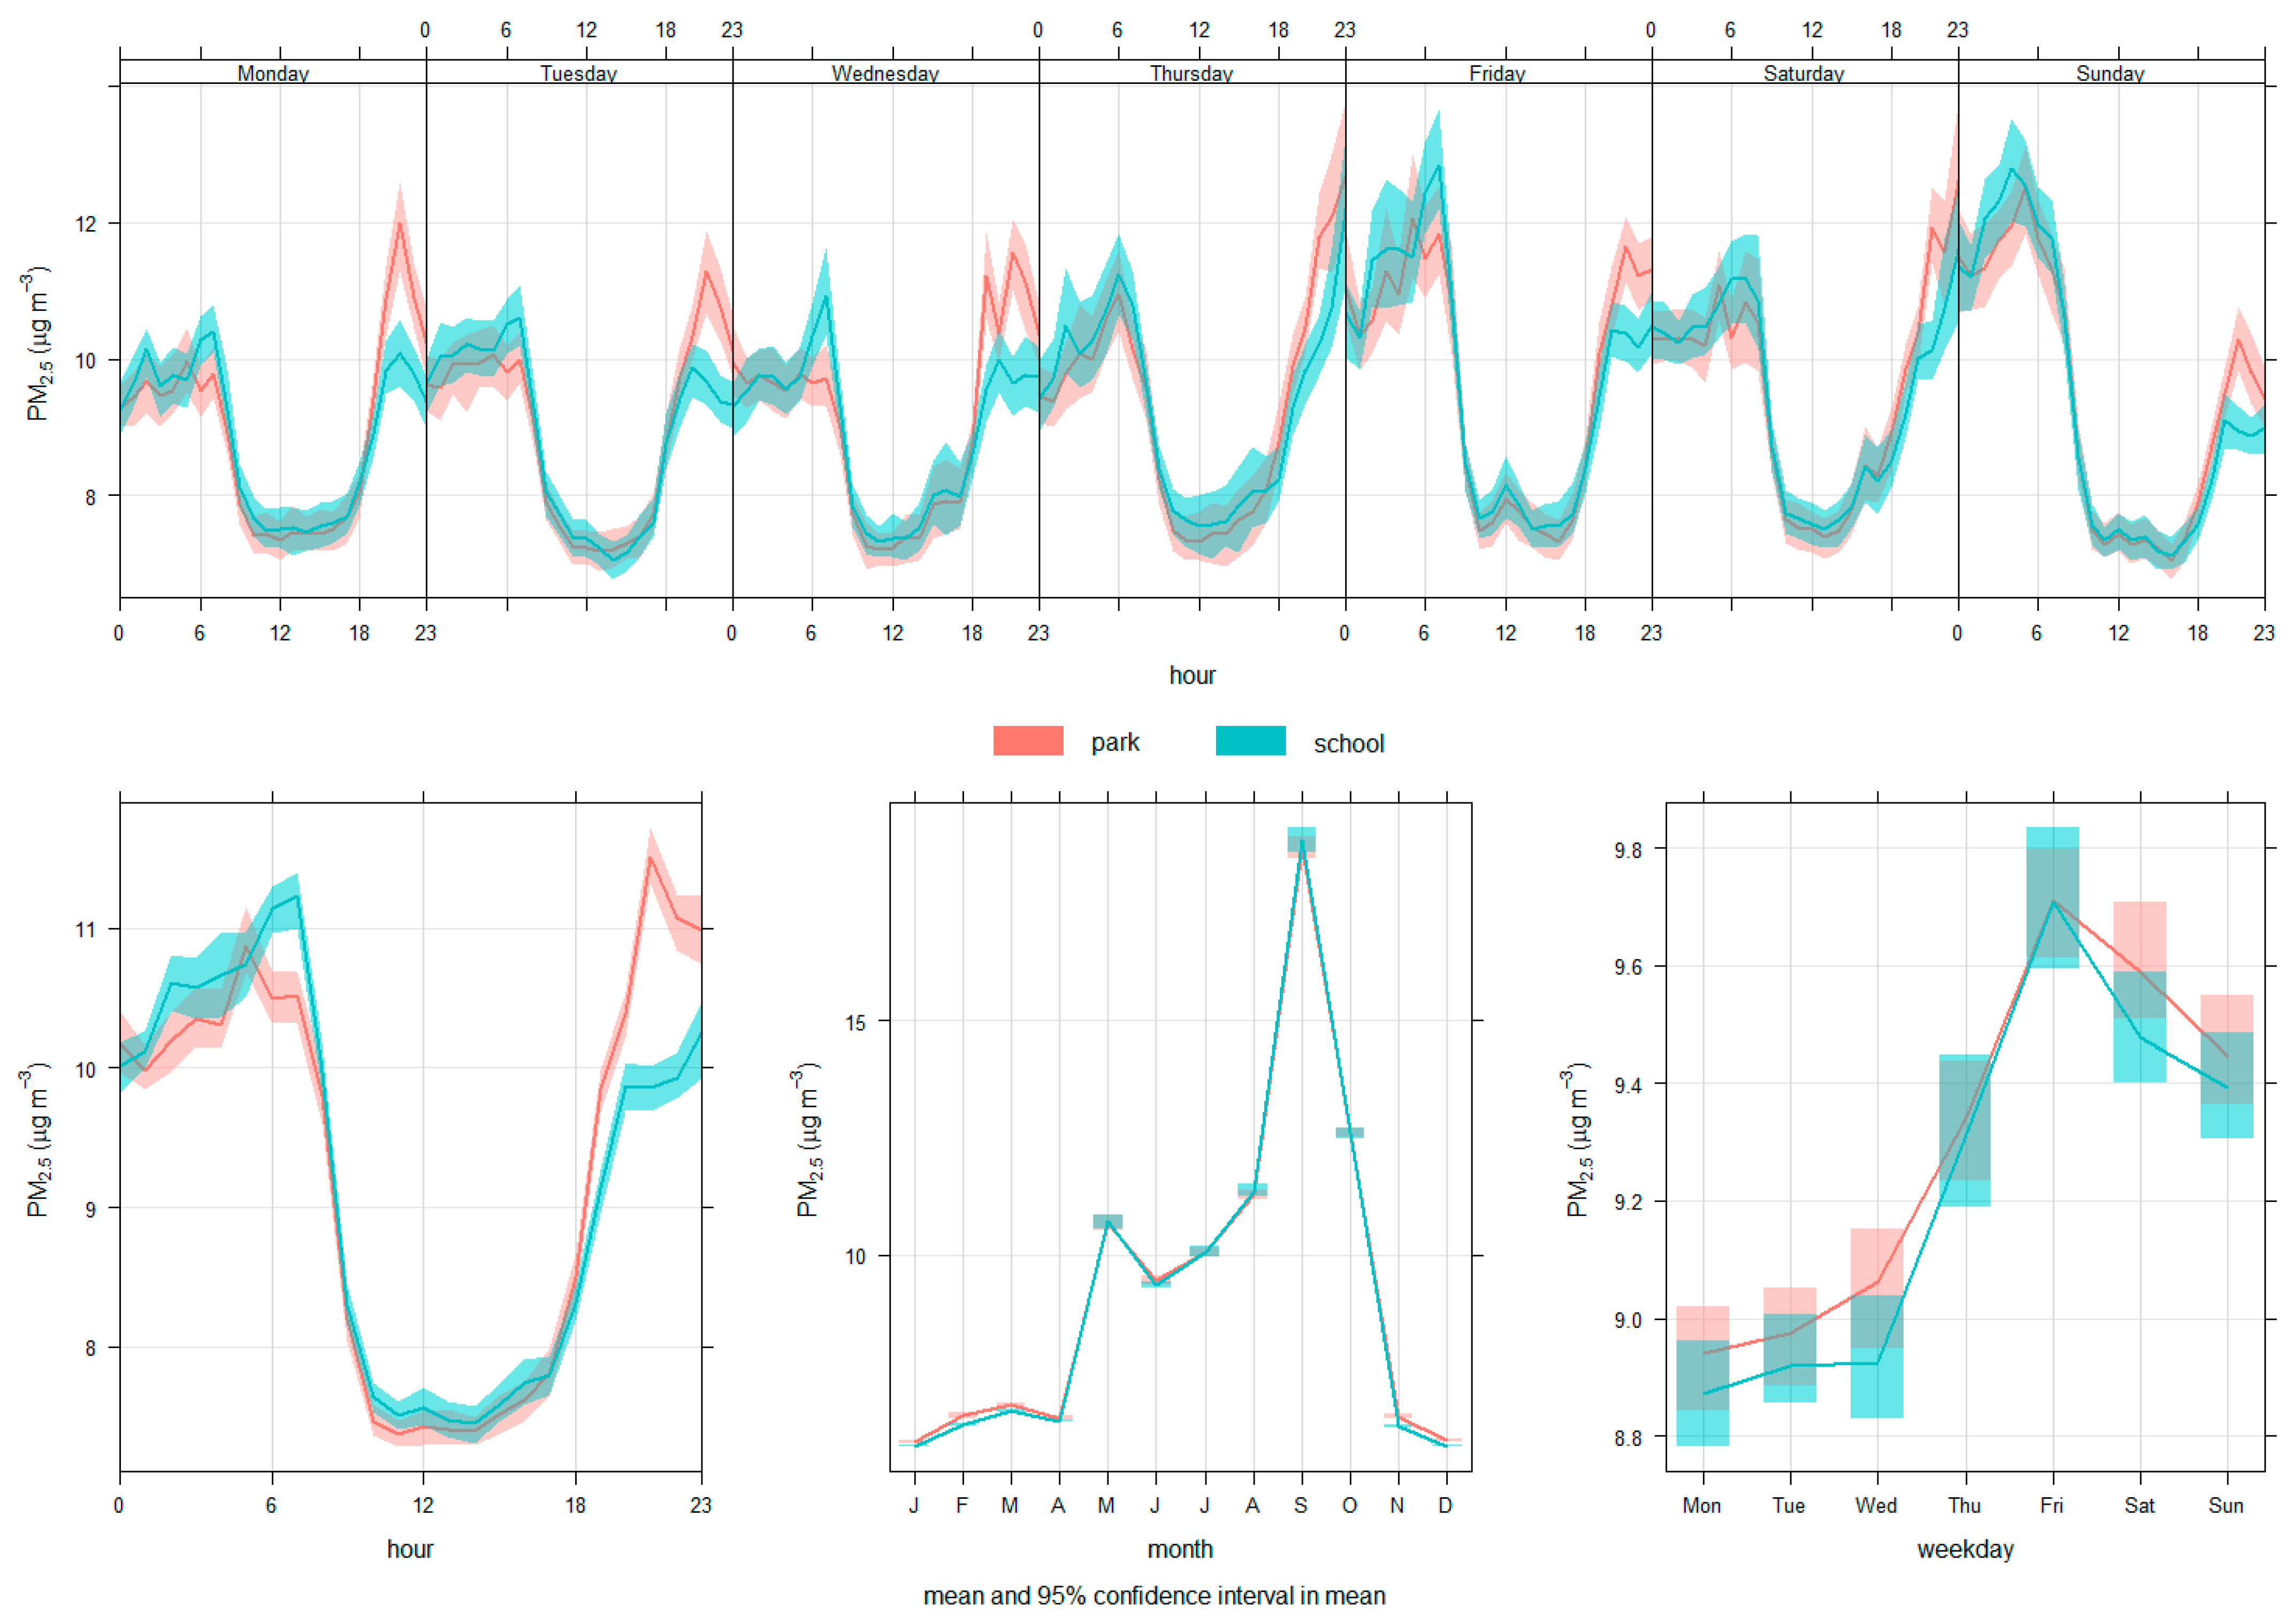
The hourly distribution of PM
2.5 concentrations (
Figure 3) agrees with the literature regarding PM
2.5 emissions in metropolitan areas that are influenced by mobile sources, with peak concentrations corresponding to high-traffic periods [
31]. Although Brasília does not contain large industrial areas and, therefore, has few major point sources of air pollution, the city’s high population density, poor public transportation system, widespread urban design and large individual vehicle fleet result in a high number of mobile sources. However, the hourly distribution differs at the two sites during the morning and evening periods, with slightly higher concentrations at the school site observed in the morning and higher concentrations at the park site observed in the evening. While the overall trend throughout the day is consistent with the influence of vehicle traffic, the closer proximity of the school site to a major highway could be causing the higher morning concentrations. The higher concentrations observed at the park location, on the other hand, may be related to trash burning in nearby encampment communities, a practice that is particularly common at night during the winter months. This is consistent with data reported by the fire brigade in Brasília, which identifies trash burning in the first semester of 2022 as one of the main causes of fires and shows that fire-burning events generally occur in the period from 6 p.m. to midnight [
32].
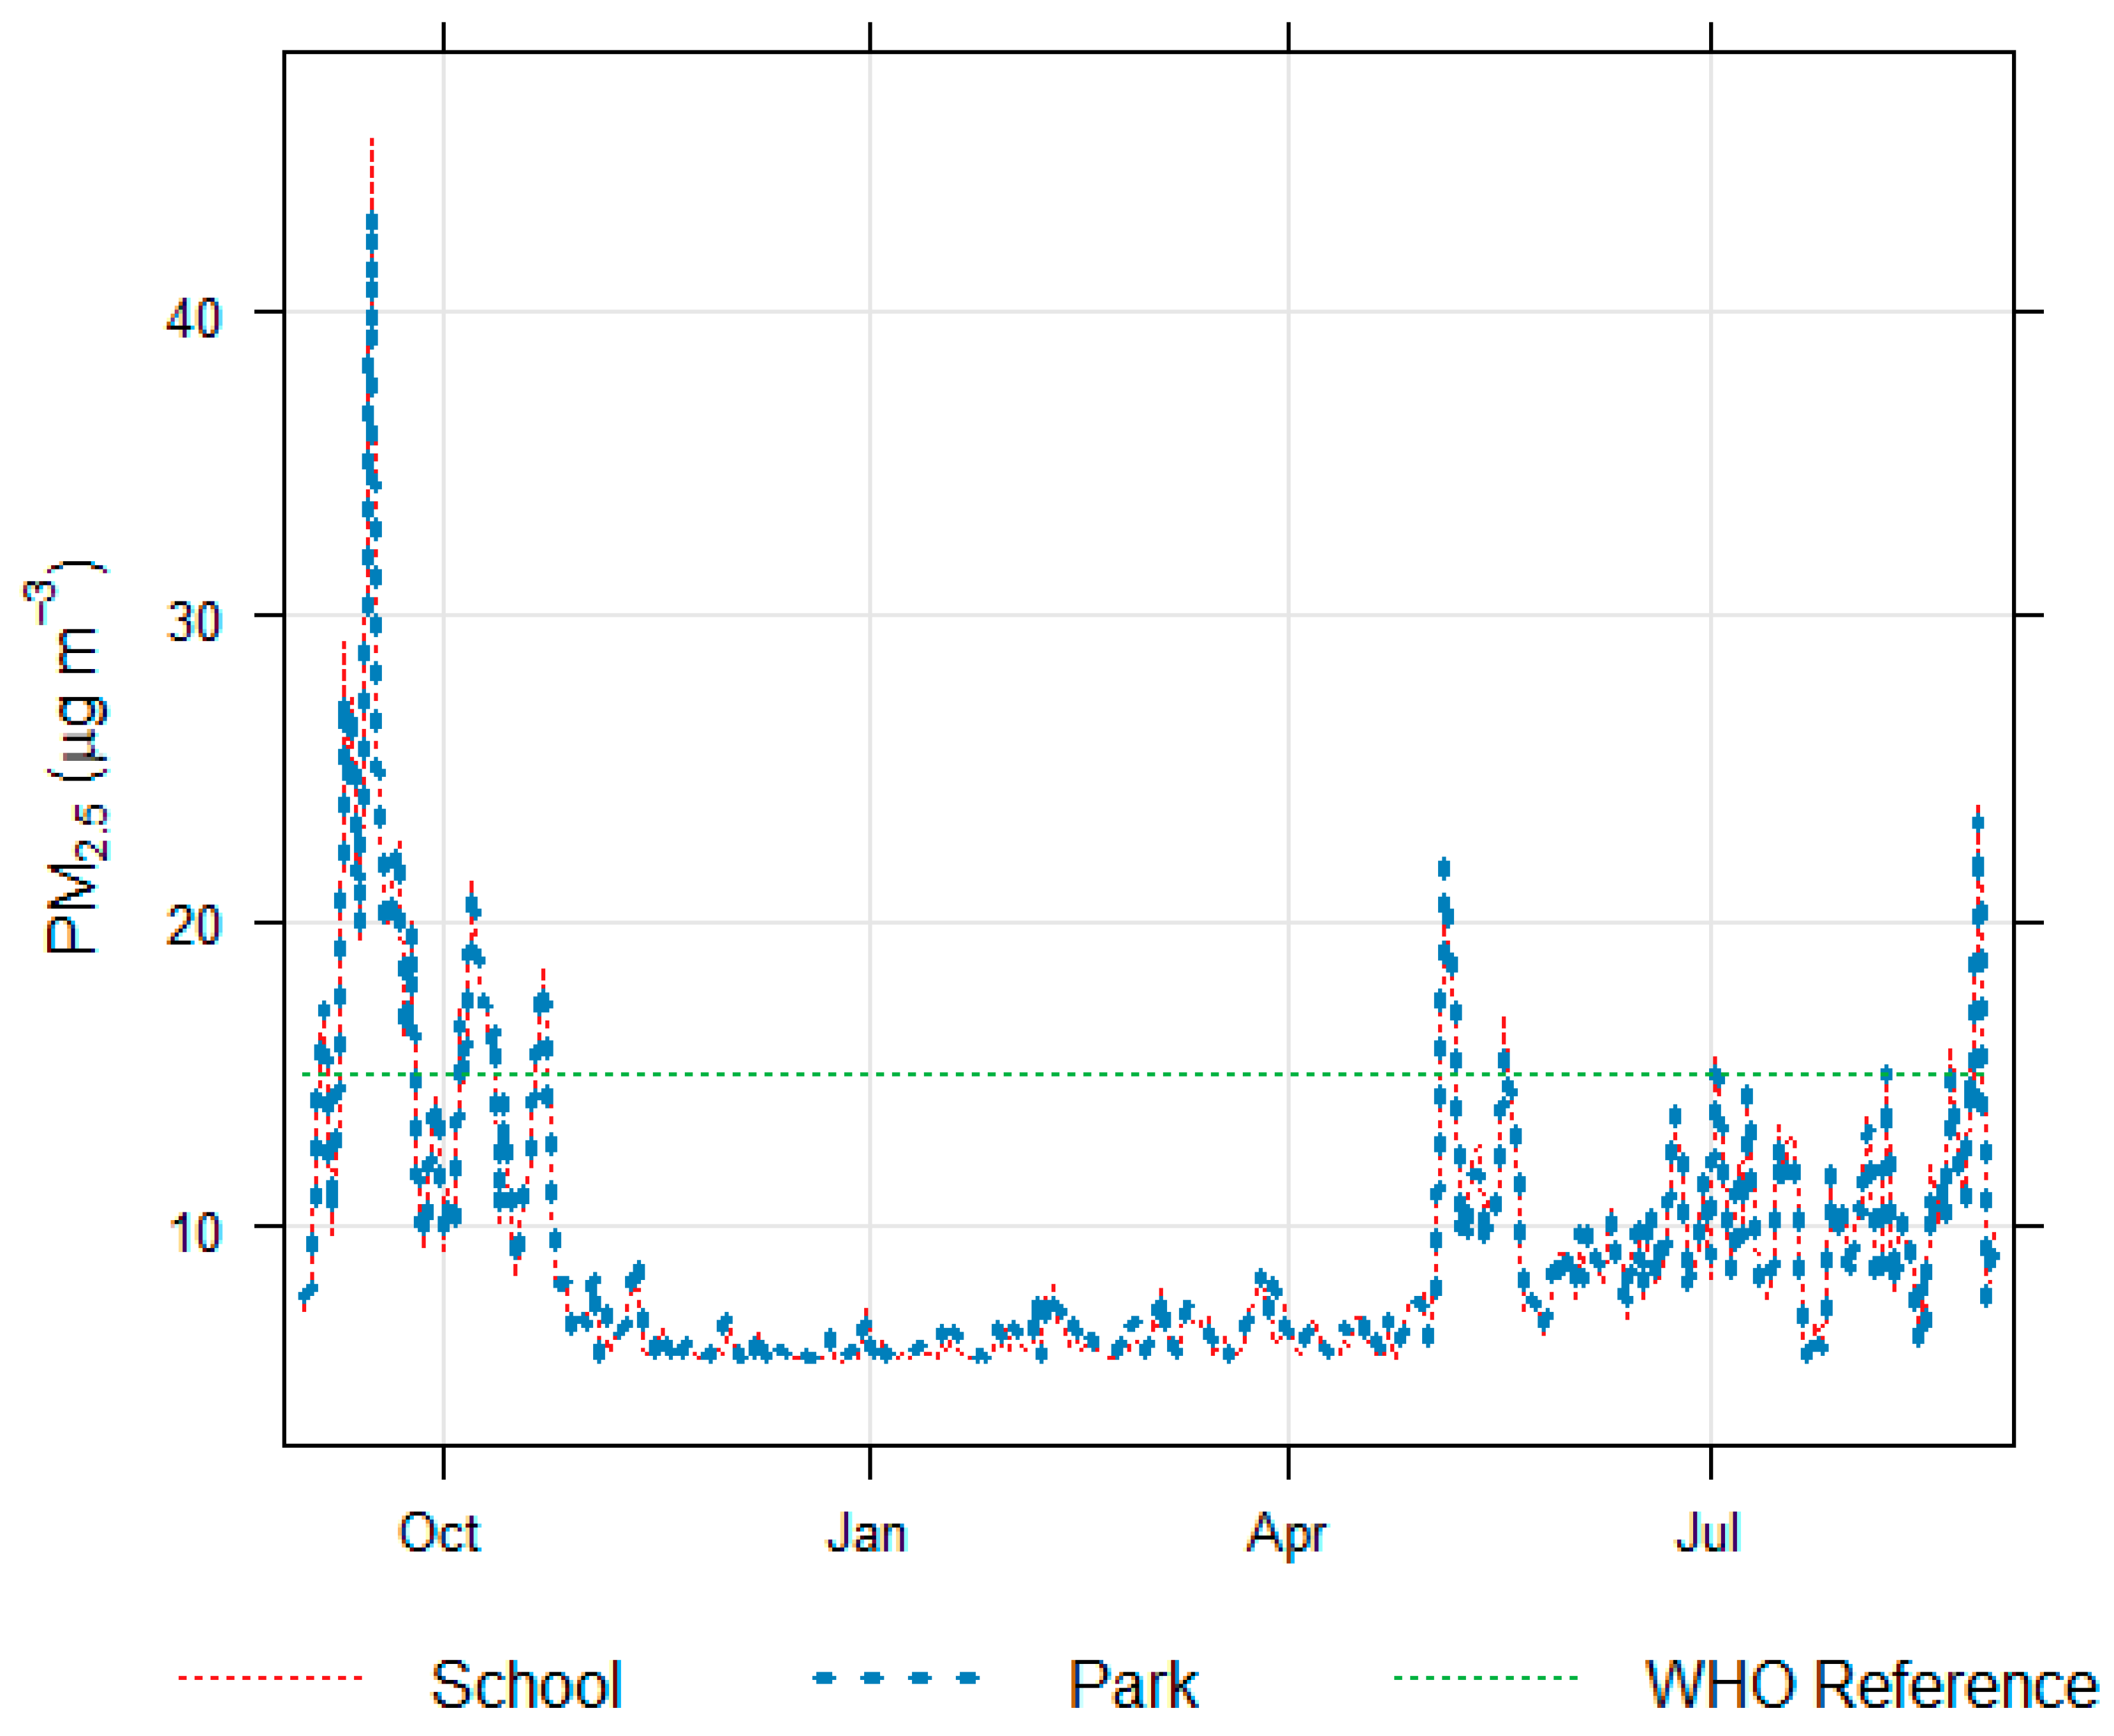
The month-to-month trend observed in the data, with the period from August to October having the highest concentrations of PM
2.5, supports the argument that wildfires contribute to air quality degradation during the dry season. During this part of the year, the Cerrado and Amazon biomes are subject to high concentrations of wildfires, resulting primarily from deforestation and land-use change dynamics [
33]. While the smoke released from wildfires generally impacts the immediate area most severely, smoke plumes can travel hundreds of kilometres and impact air quality in other regions.
In terms of the possible mitigating influence of vegetation, the annual average for the park sensor (9.3 µg/m
3) is essentially equal to that of the school site (9.2 µg/m
3), indicating that the park site does not present the expected profile for a green area and is not providing a protective factor against PM
2.5. This certainly does not counter the established evidence for these ecological services [
34,
35] but could be explained by the sensor’s location within the park, since the sensor is located at the park’s edge and close to a nearby road. This site could also be impacted more by routine trash/solid fuel-burning activities that occur in the city, given its proximity to undeveloped plots.
The Hysplit and SQTBA analyses further confirm the contribution of biomass-burning events to the elevated PM
2.5 concentrations observed in the dry season. The identification of a source near the Brazilian border with Paraguay and Bolivia (obtained by SQTBA) is consistent with the large number of wildfires observed in this area during the dry season as well as with common smoke transport routes from northwest to southeast [
36]. The northward trajectories that pass through the São Paulo Metropolitan Area, meanwhile, could indicate that elevated PM
2.5 concentrations in this area [
37], which are largely due to local sources, also contribute to the PM
2.5 concentrations observed at the receptor site.
It should be noted that this work is limited by the fact that the PA sensors were not collocated with a reference monitor, which would have allowed for a site-specific calibration factor. A longer time series of PM and wildfire hotspot data would likely provide a more complete picture of the contribution of biomass burning. Lastly, deploying more sensors across a wider range of environments in Brasília would allow for more comprehensive source contribution assessments.
5. Conclusions
In this paper, we demonstrated the use of low-cost sensors, in conjunction with the Hysplit model, to detect air pollution episodes in a metropolitan area and to identify wildfires as a contributing emission source, building on previous works that have shown the value of data derived from these sensors to investigate the impact of this phenomenon. The data from the sensors showed relatively low overall concentrations of PM2.5 (annual daily average between sites: 9.3 µg/m3), with September 2022 standing apart as a month that experienced much higher readings from both sensors (average during this month: 19 µg/m3). These results show the large impact that biomass-burning events can have on communities hundreds of kilometres away, shedding light on the importance of deterrence actions to slow illegal deforestation and burning. Wildfires in Brazil represent a seasonal, predictable public health emergency that occurs every year. During the dry season, concentrations of pollutants such as PM2.5 routinely reach levels that can be many times greater than guideline thresholds. With global warming estimated to increase susceptibility to wildfires across many parts of Brazil, the need to respond to this crisis demands the urgent deployment of innovative technologies that can help guide interventions in both public health and environmental regulatory arenas. Real-time monitoring of air pollution from wildfires is needed to generate alerts and implement interventions that can reduce population exposure and prepare healthcare systems accordingly. As sophisticated monitoring networks are slowly expanded across Brazil, alternative technologies such as satellite-derived estimates and low-cost sensors should be considered to fill this gap, especially in under-served areas. These technologies can, in fact, be incorporated in conjunction and can leverage existing monitoring networks; these systems can work in sync with one another to constantly improve calibration methods and deliver highly granular data that provide a more comprehensive picture of air pollution in these areas. This would allow for better quantification of exposure levels and provide visibility to this important issue.


