
Analysis of Inverted Charge Structure and Lightning Activity during the 8.14 Local Hailstorm on the Qinghai–Tibet Plateau

Abstract
:1. Introduction
2. Data and Methodology
3. Descriptions of the Thunderstorm Development and Hailfall Processes
3.1. Overview of the Thunderstorm on 14 August 2014
3.2. Hailfall Process of Hailstorm Cell 1
4. Analysis of the Charge Structure and Electric Field Changes
4.1. Analysis of Hailstorm Cell 1
4.2. Analysis of Thunderstorm Cells 2 and 3
5. Discussion and Analysis
5.1. Effect of Hailfall on the Heights of the Charged Regions and Electric Fields of Hailstorms
5.2. Relationship between the Charge Structures of Hailstorms and Lightning Activity
6. Conclusions
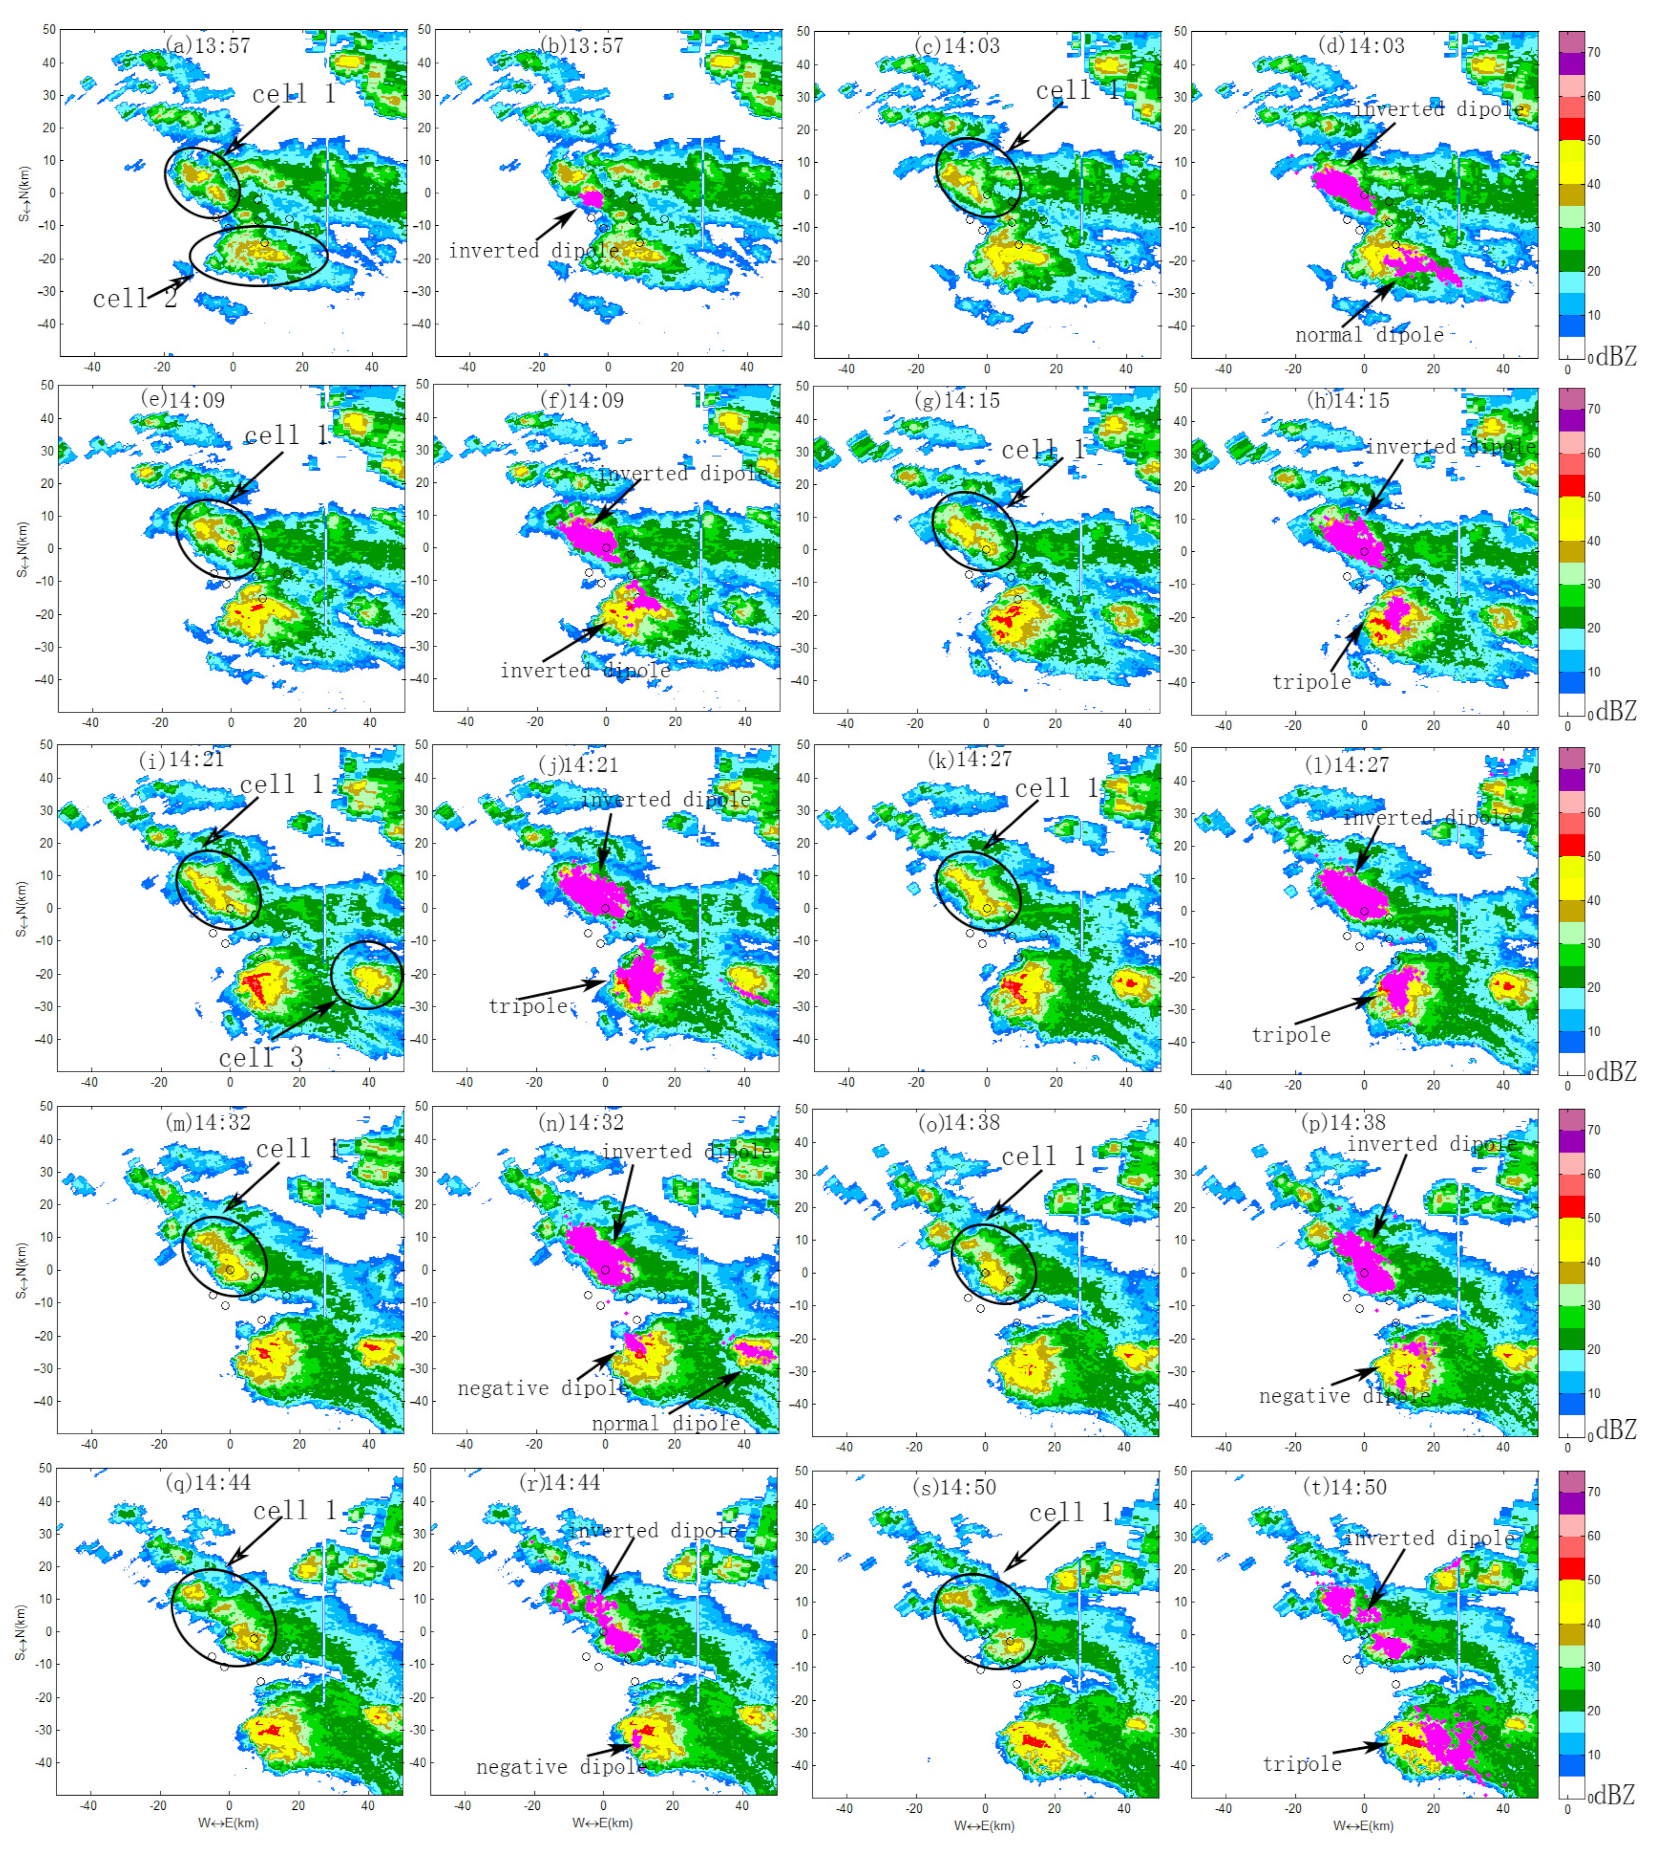
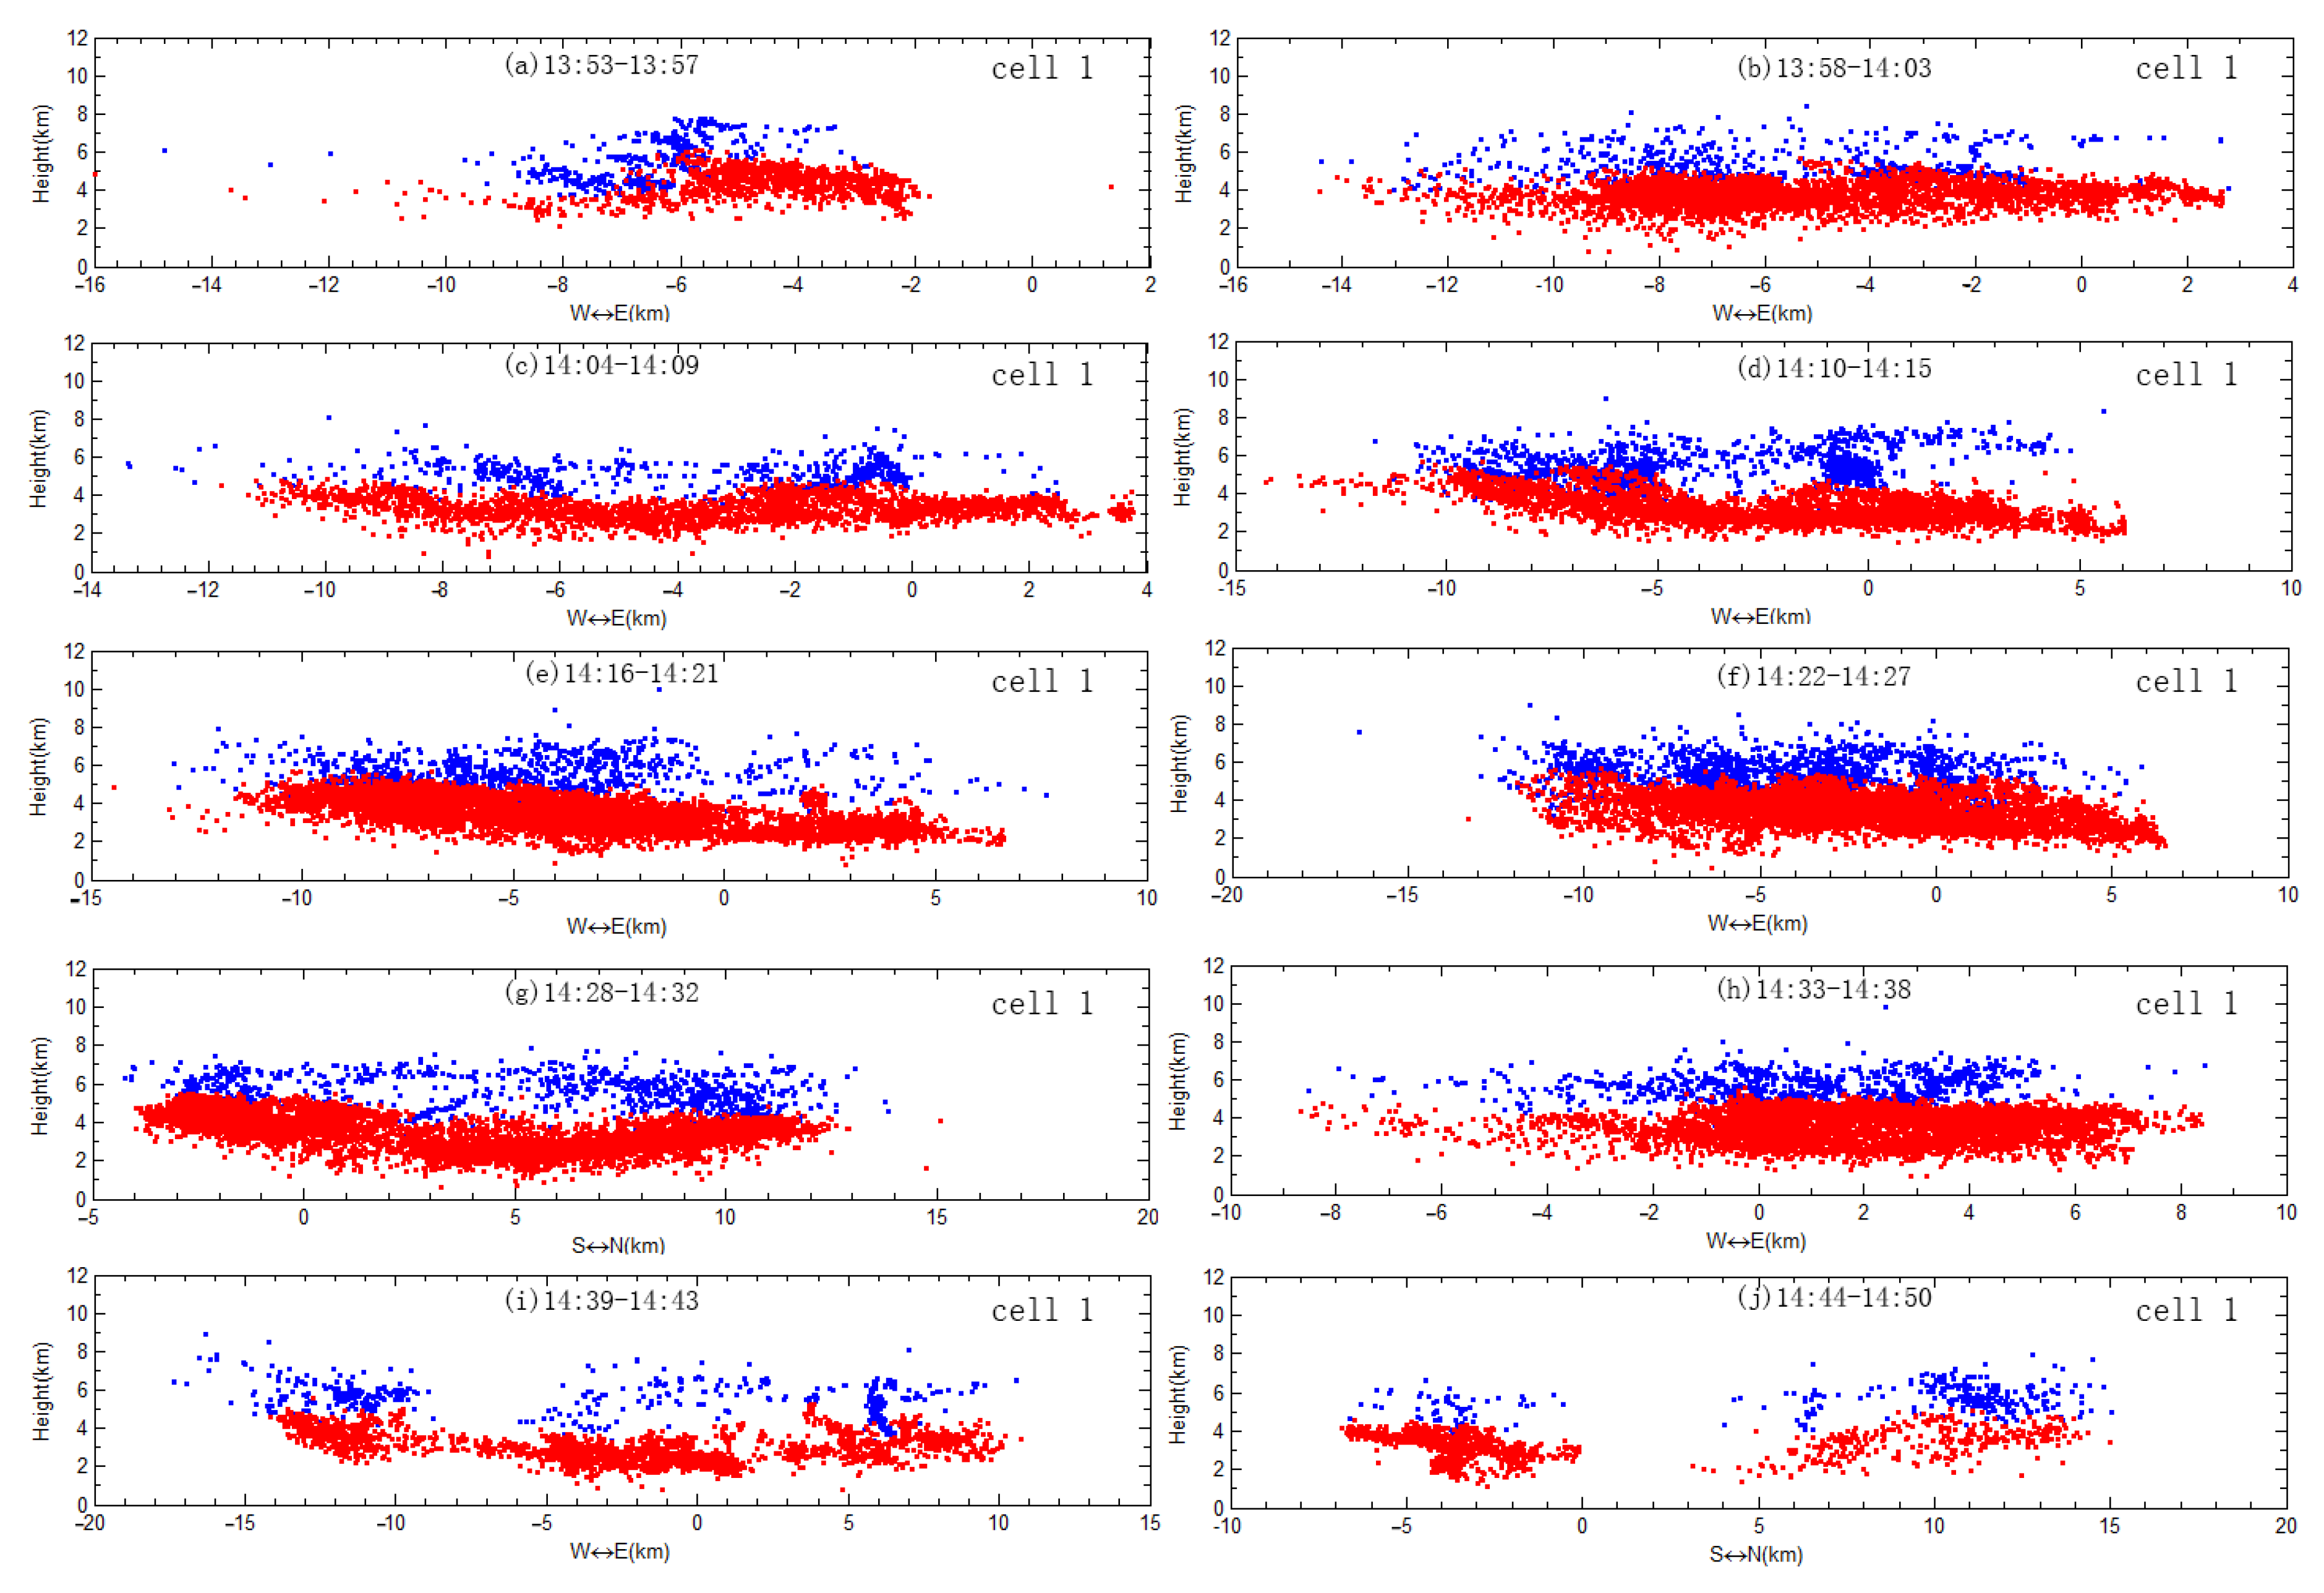
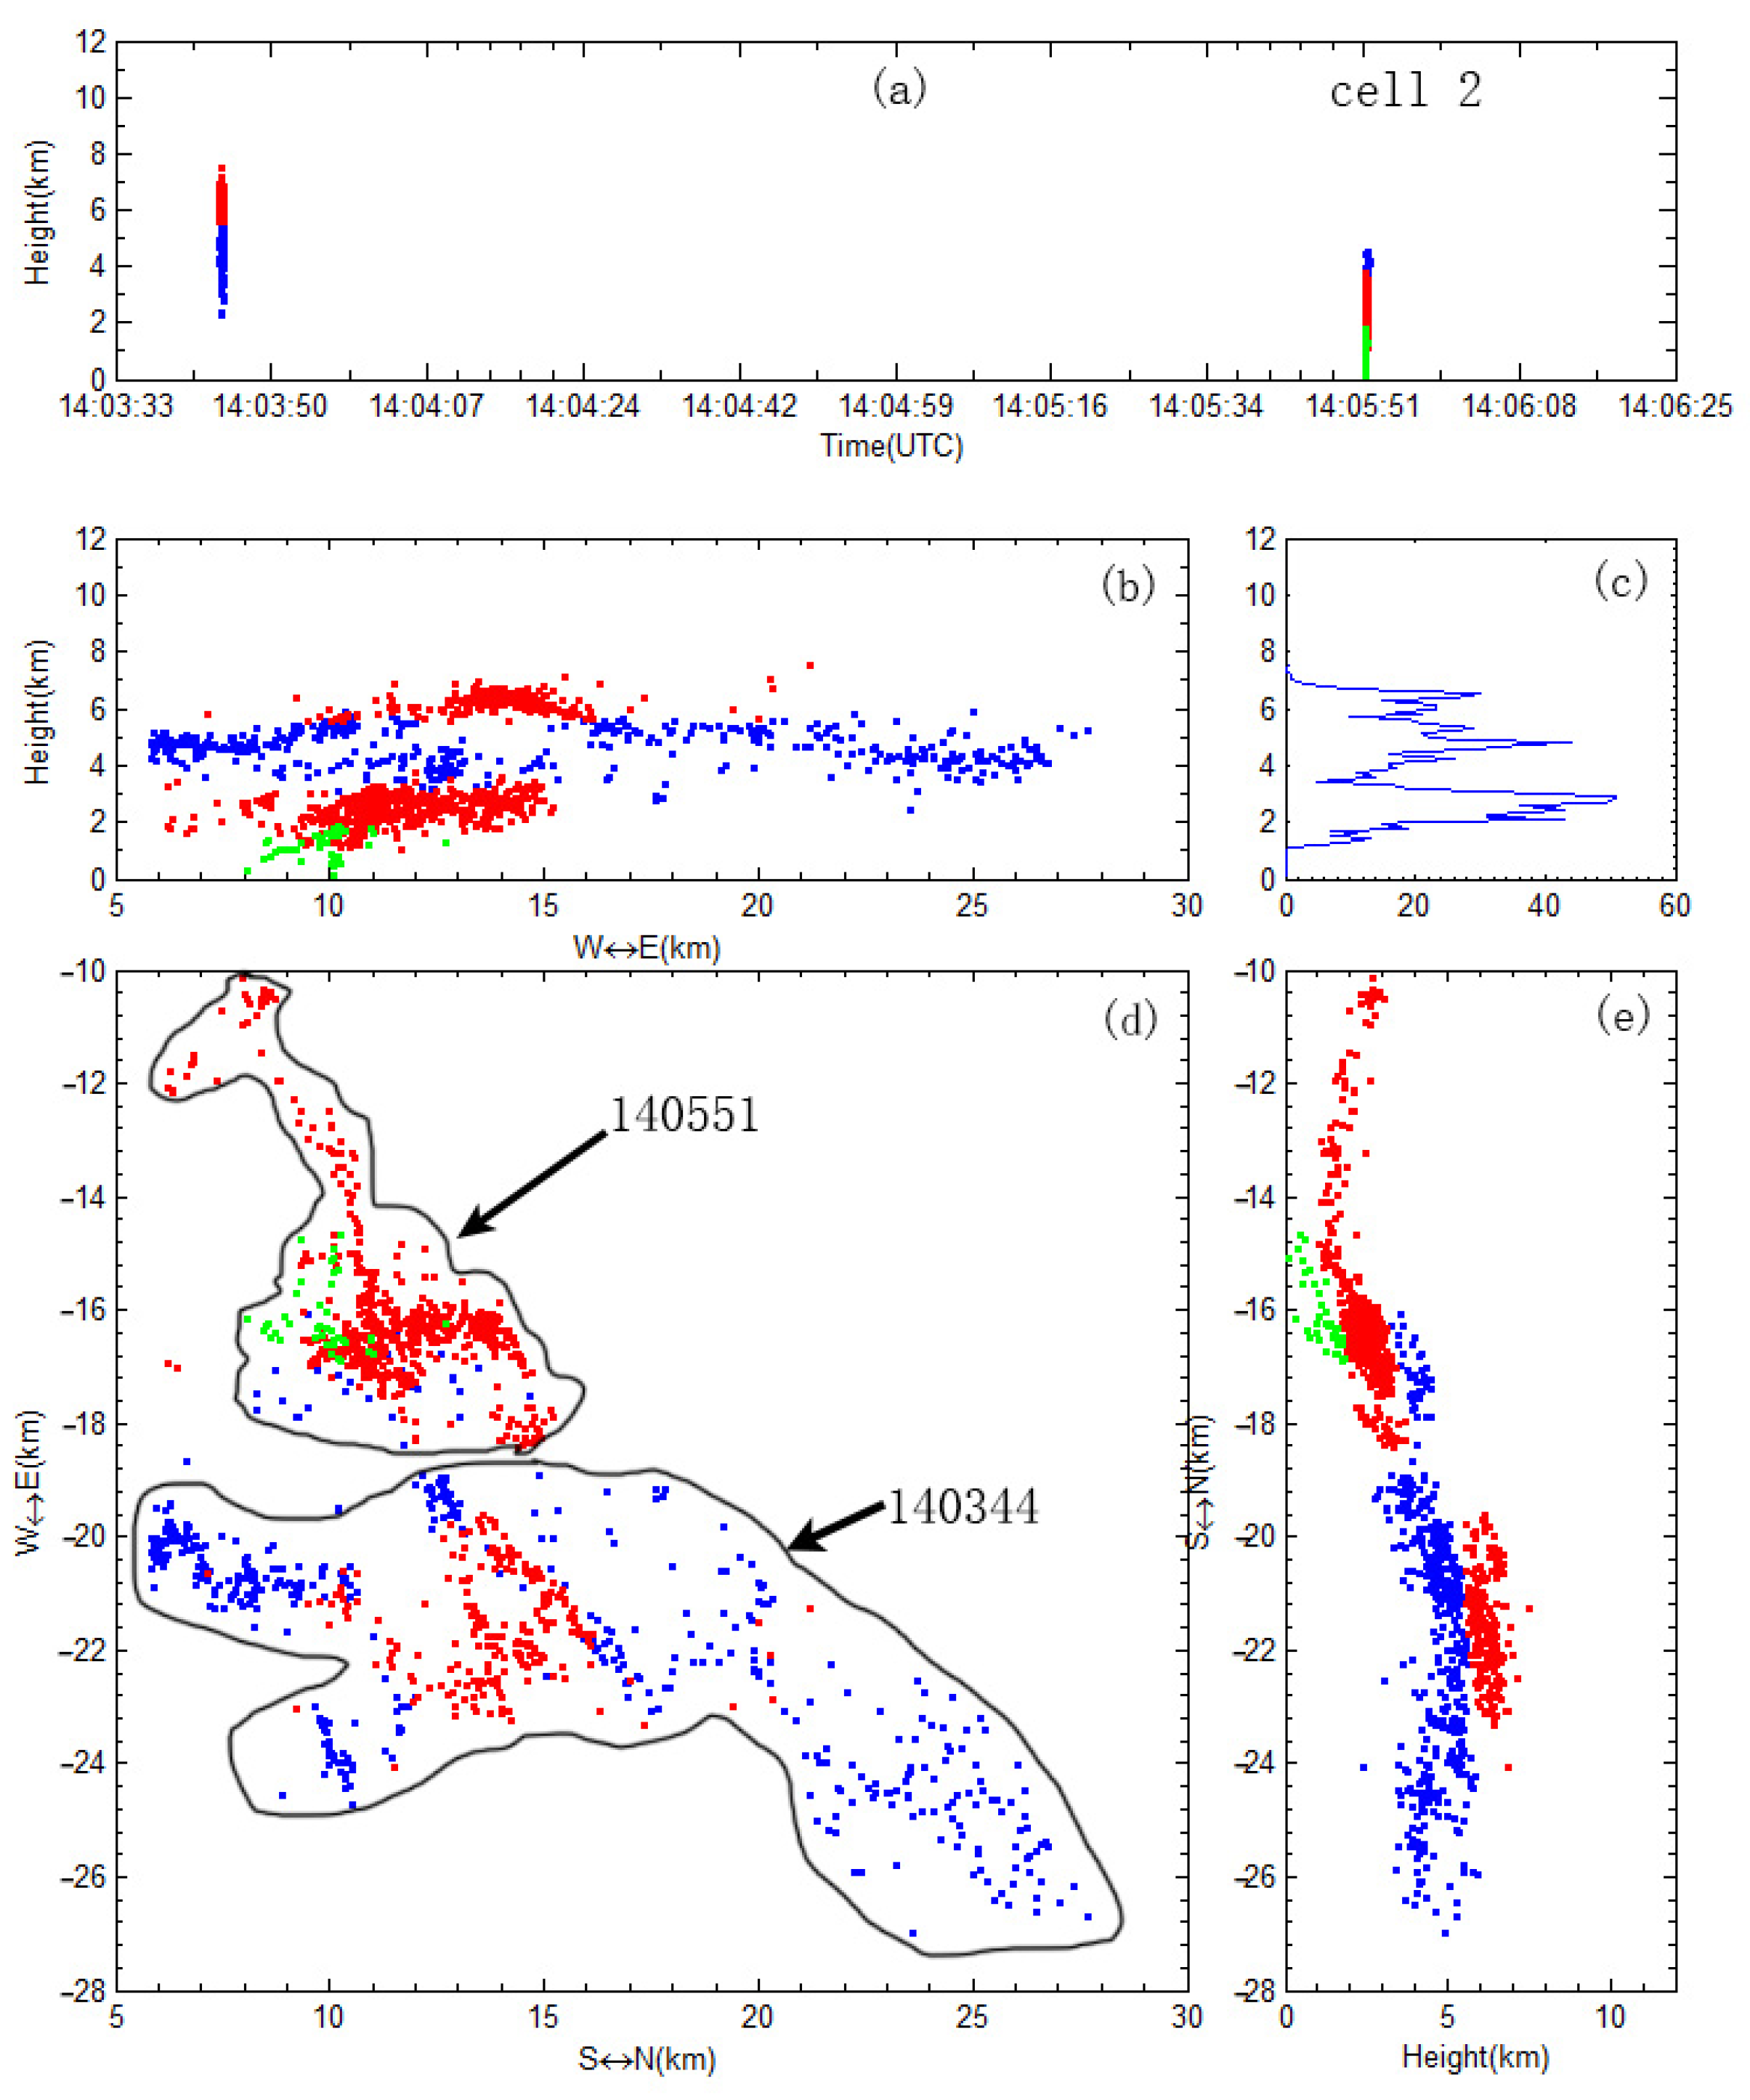
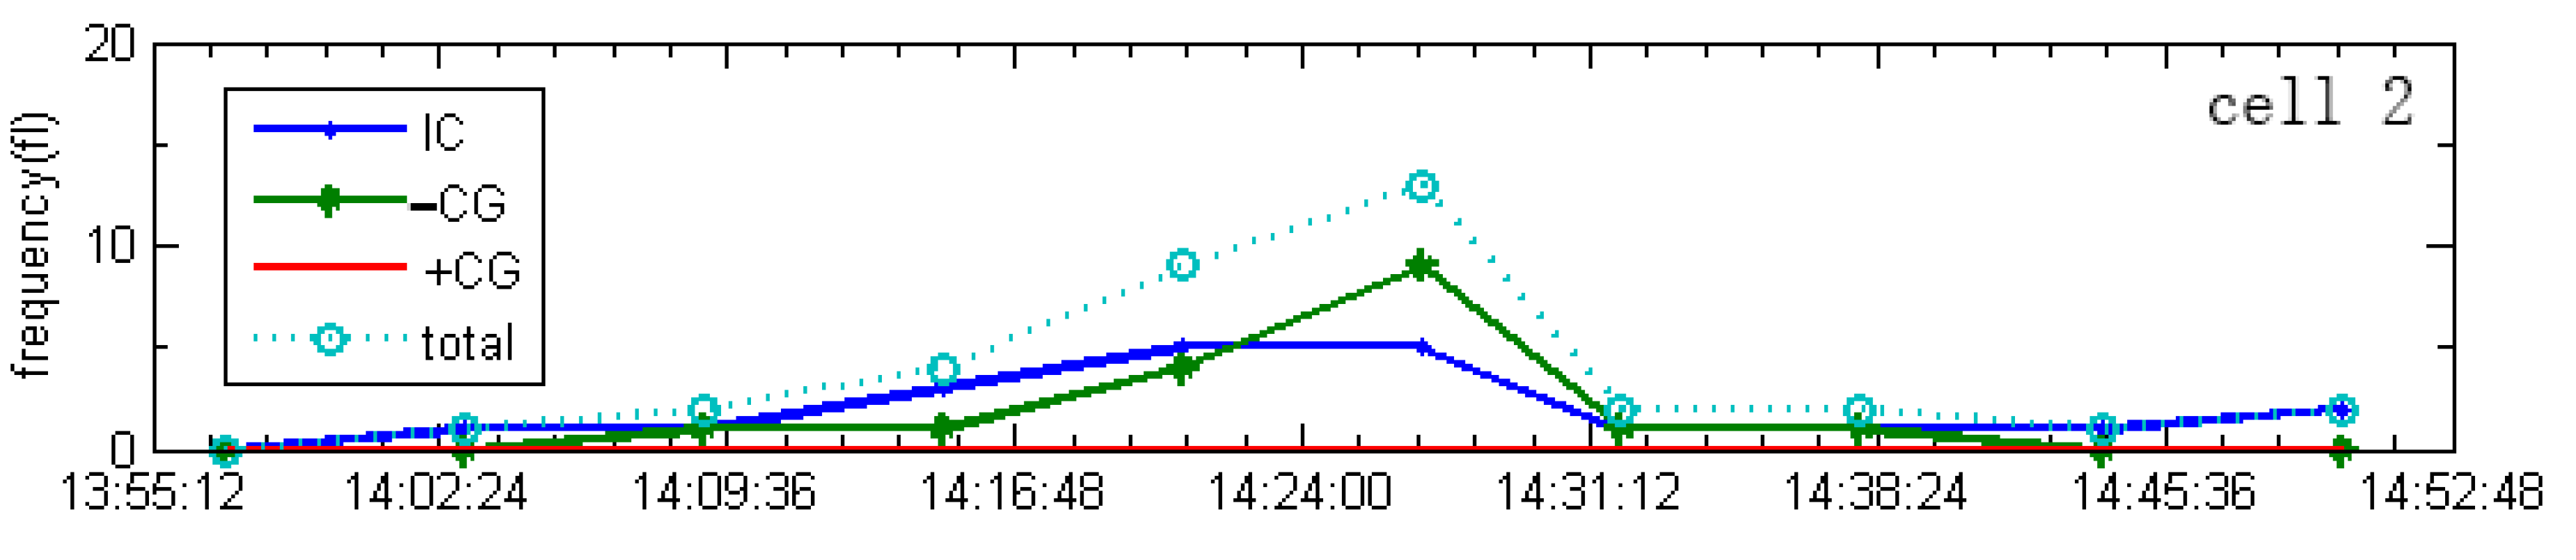
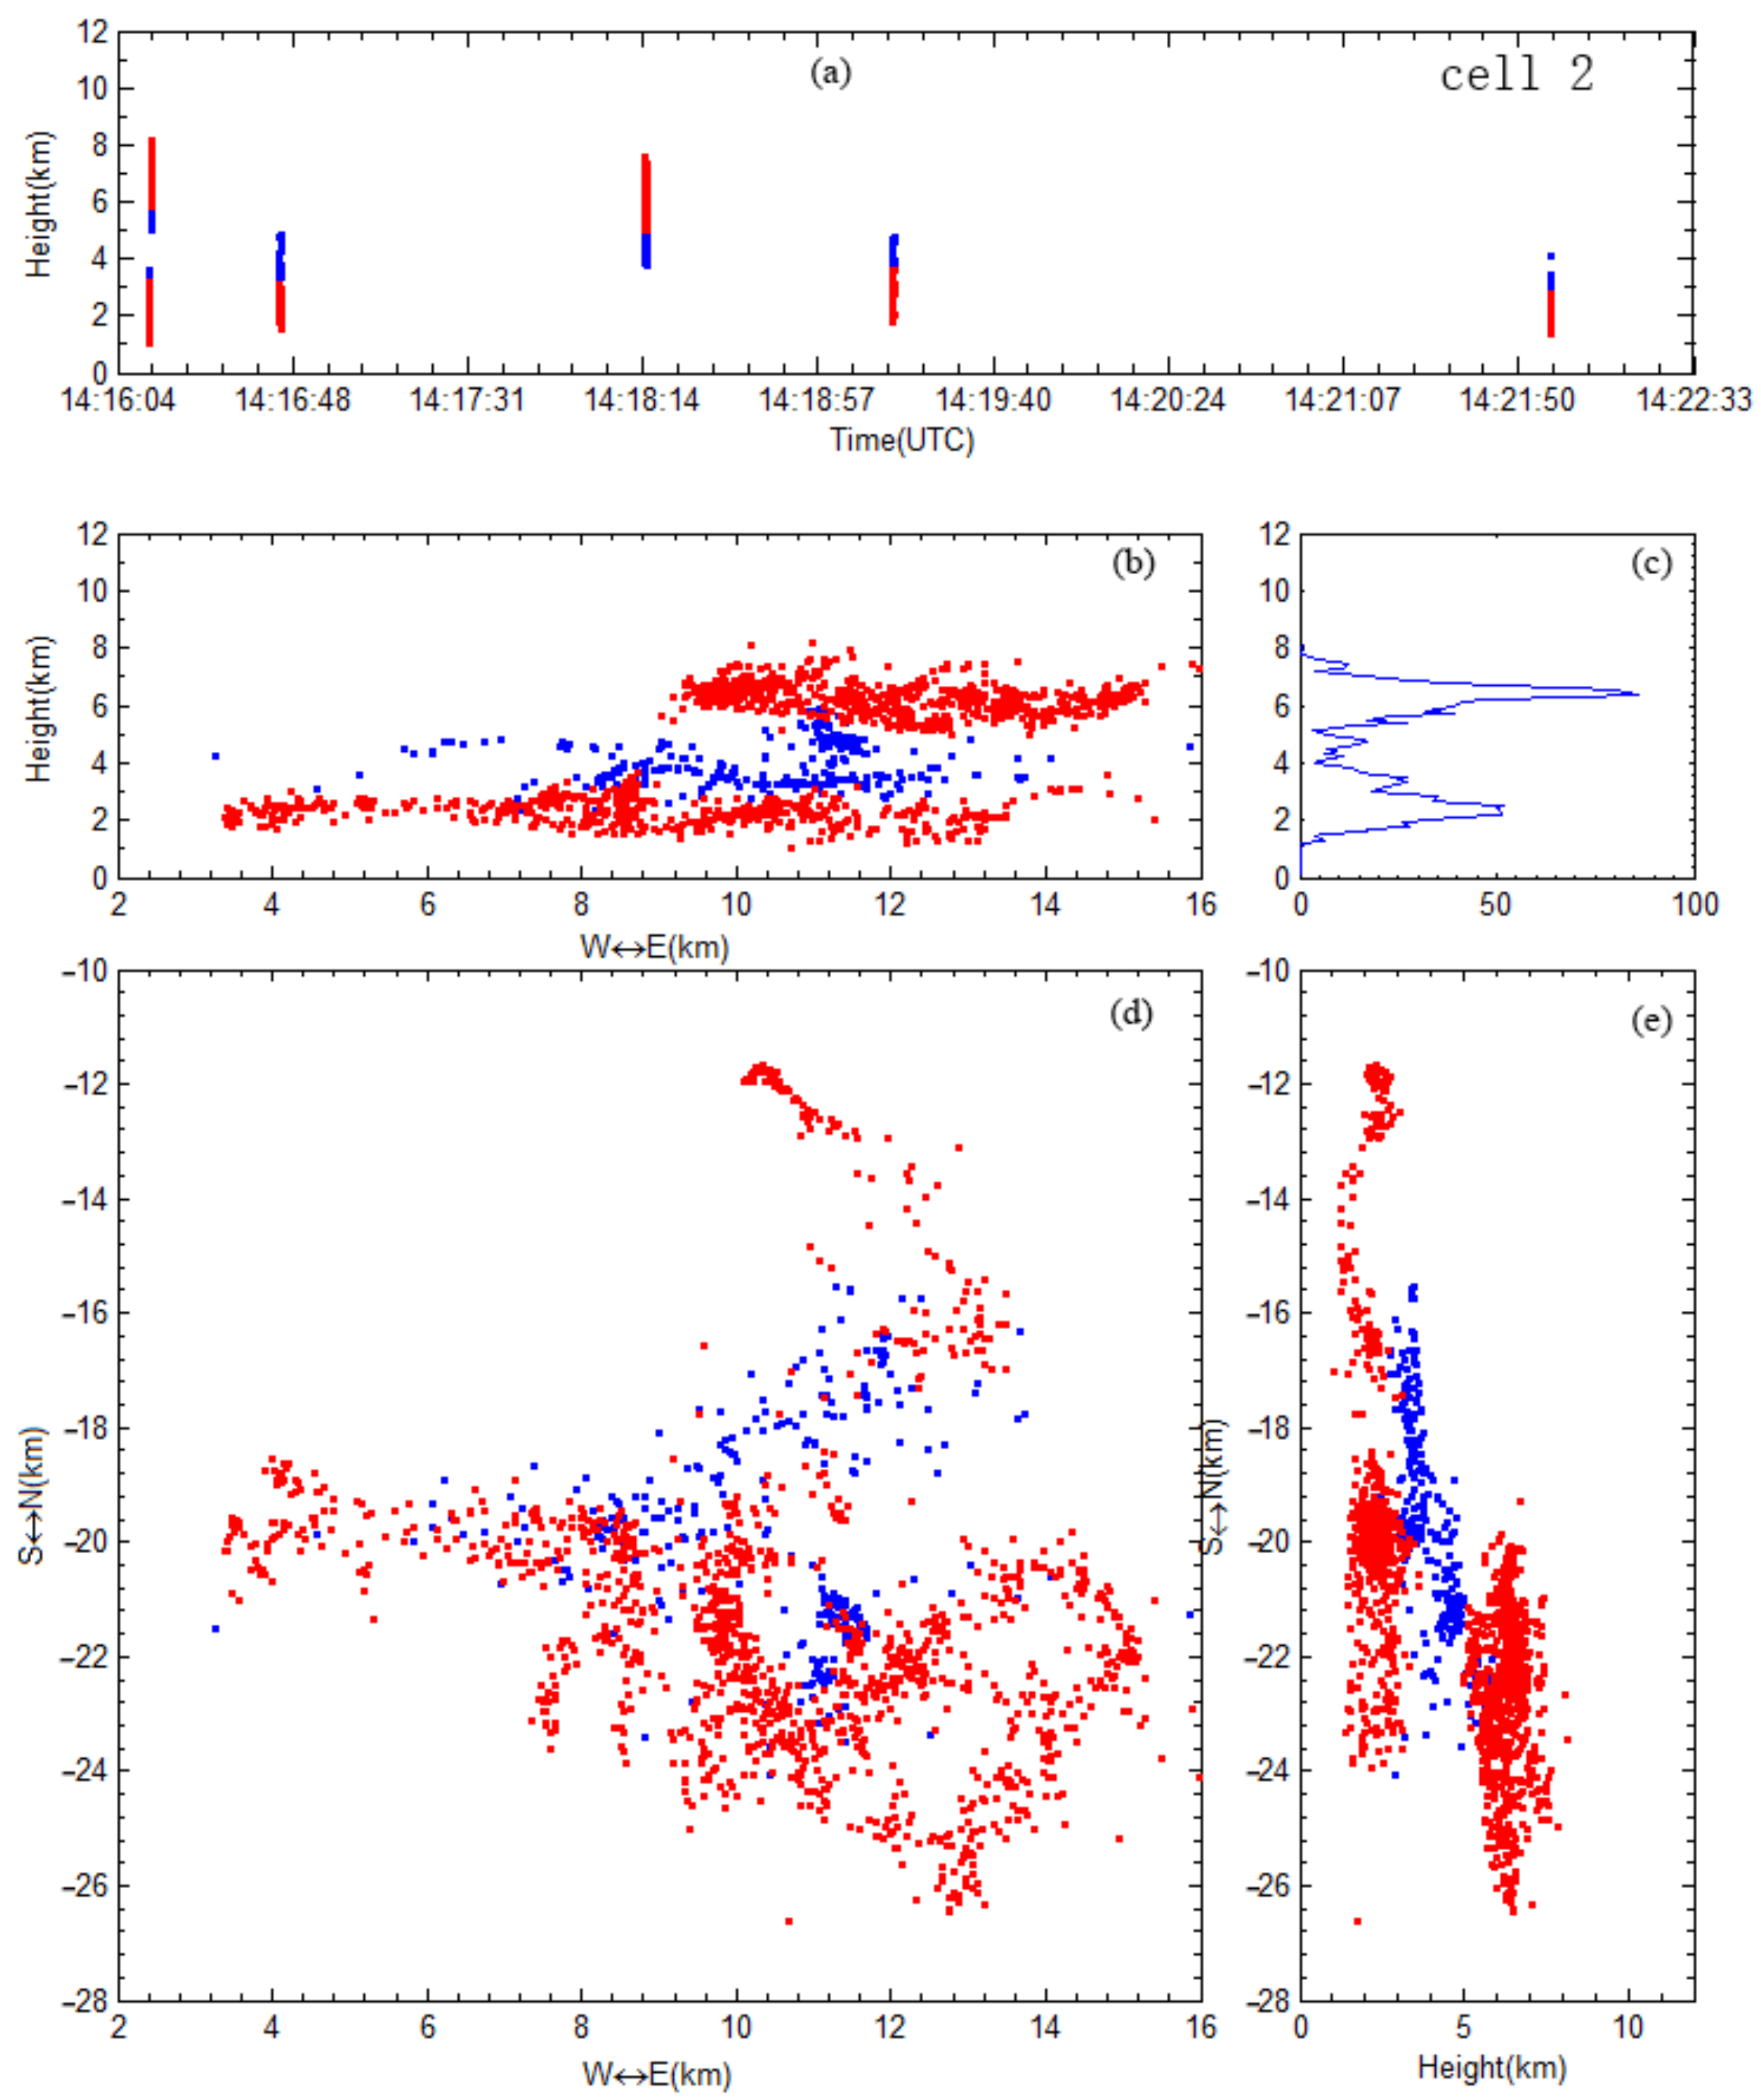
- Hailstorm cell 1 comprised several hailfall processes. The charge structure of this hailstorm showed an inverted dipole throughout the whole thunderstorm’s development process. The lower positively charged region was deep and was mainly distributed at heights of 2–5 km (AGL), while the upper negatively charged region was mainly distributed at heights of 5–7 km (AGL). The normal thunderstorm cell 2 exhibited a normal tripole charge structure. The upper positively charged region spanned from 5 to 7 km (AGL), the middle negatively charged region spanned from 3 to 5 km (AGL), and the lower positively charged region spanned from 1.8 to 3 km (AGL).
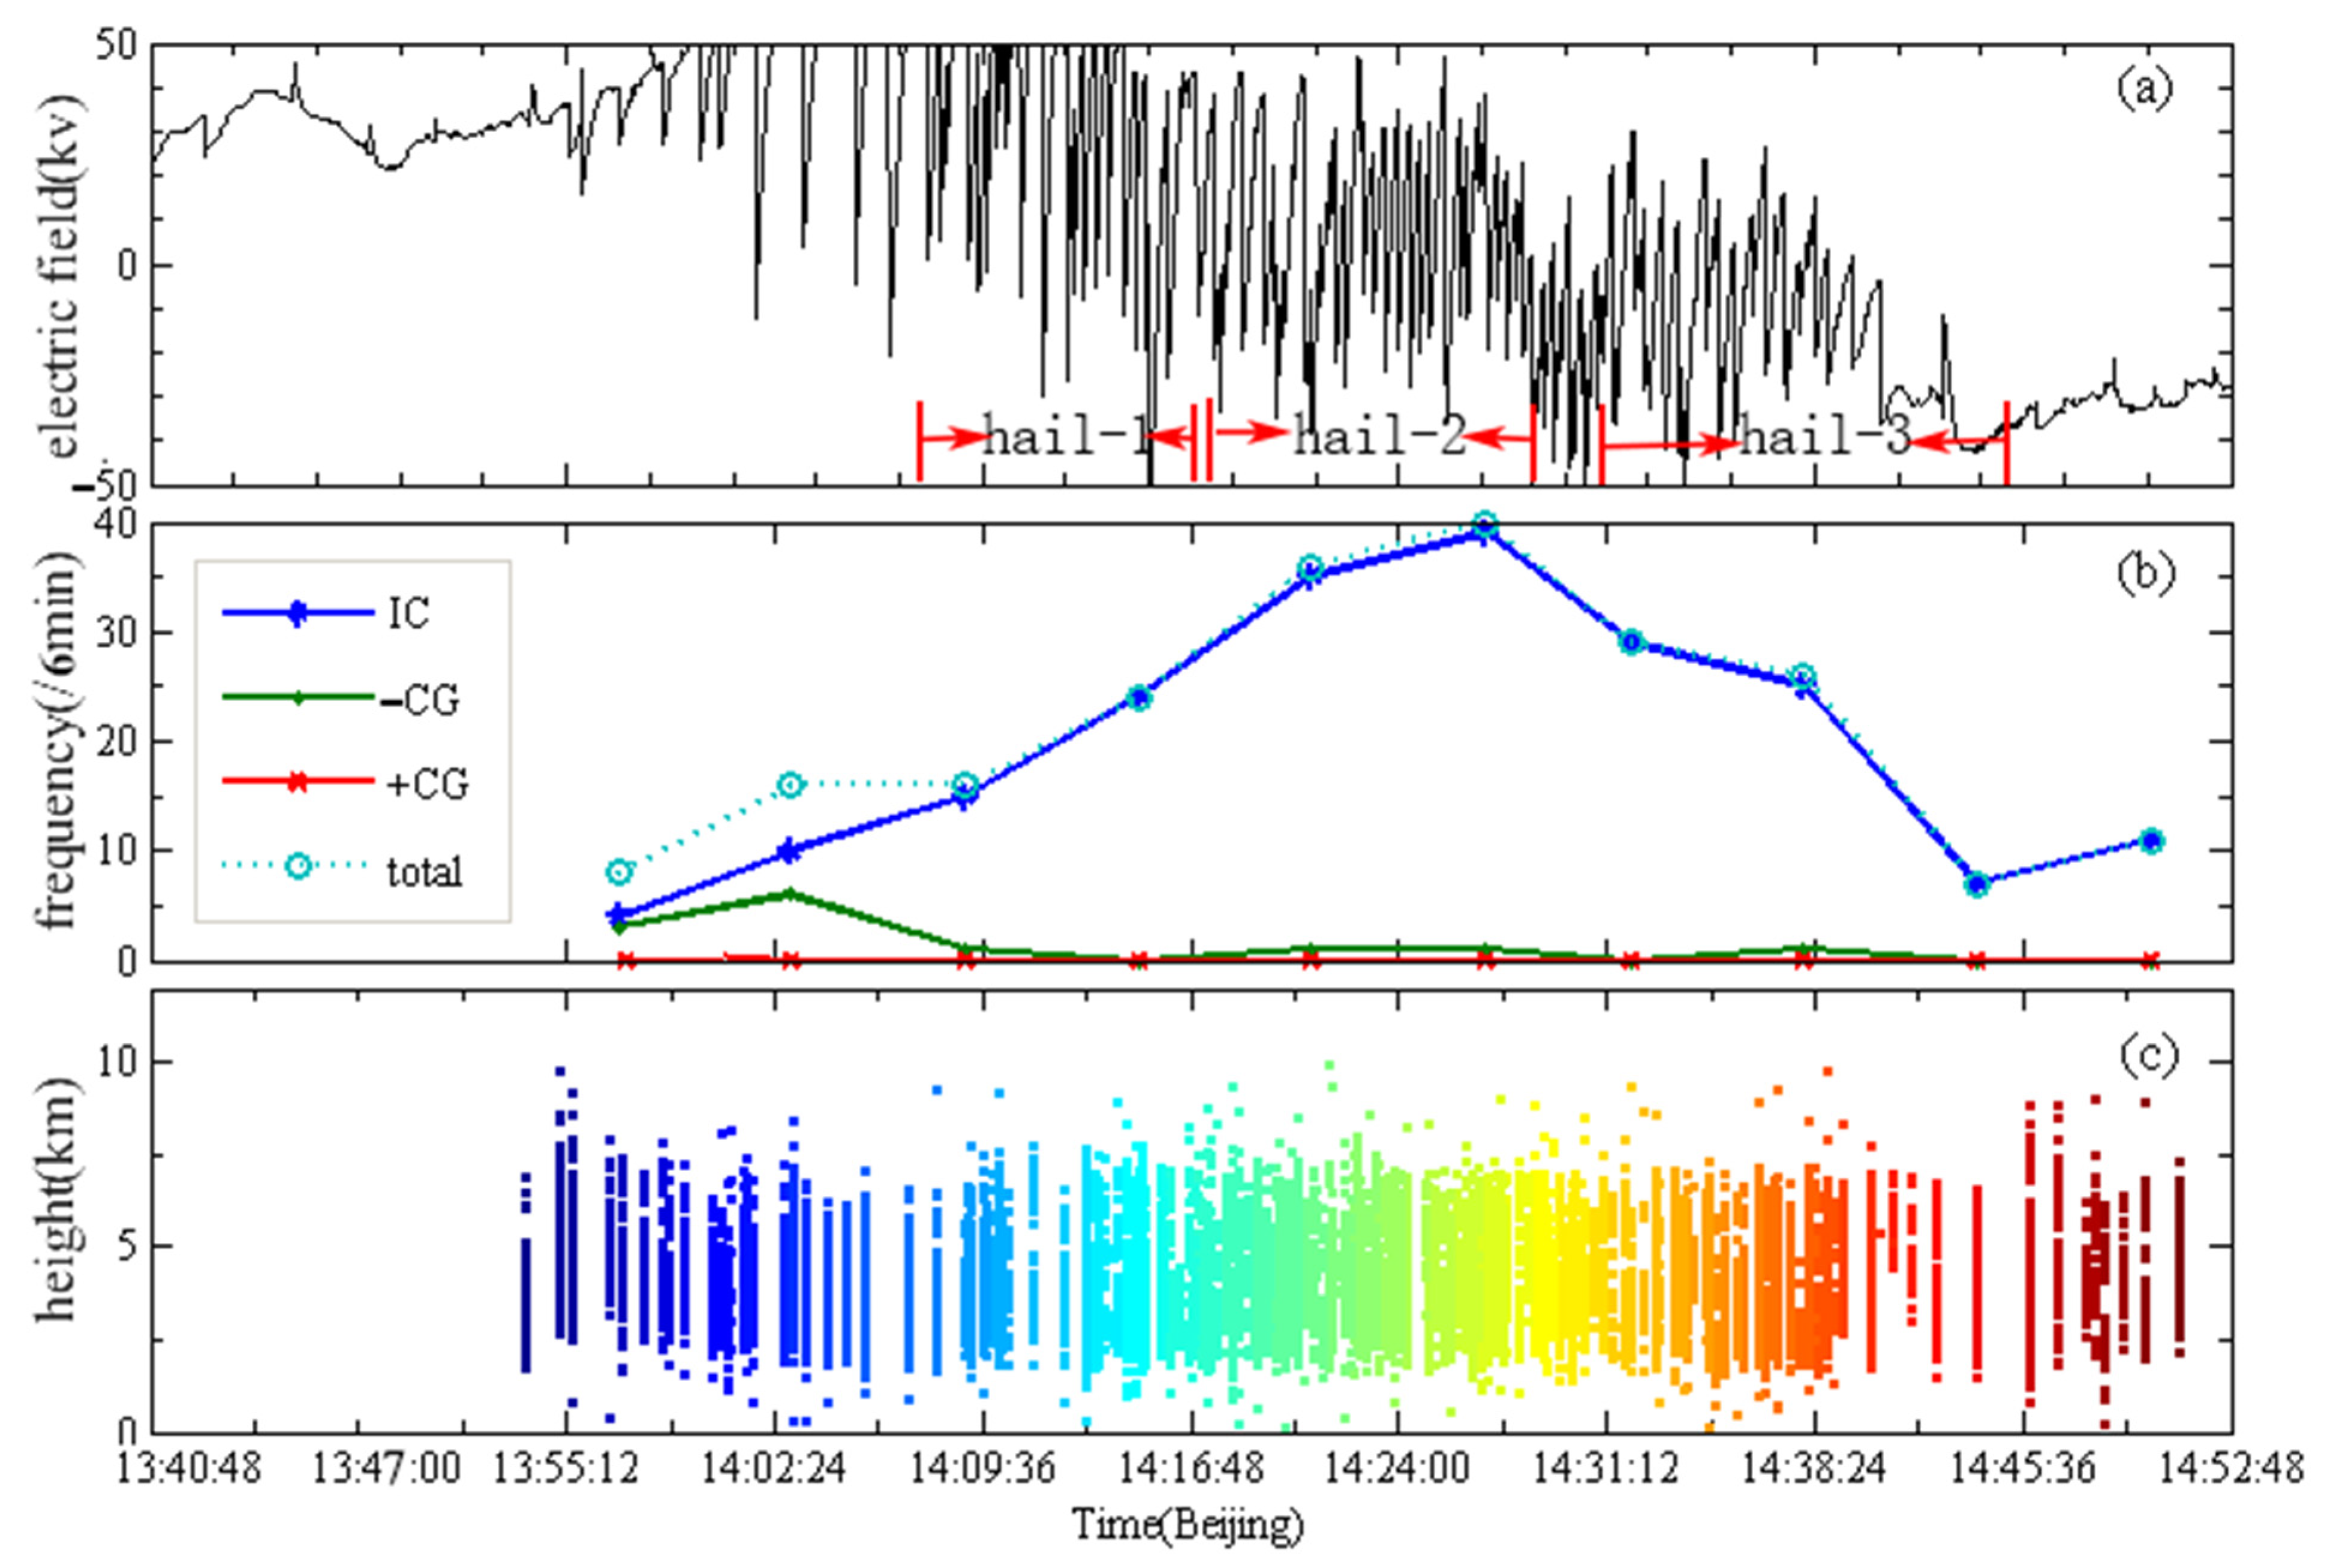
- The lightning flash types observed in hailstorm cell 1 included only intracloud flashes and negative CG flashes. The intracloud flashes accounted for 93% of the total lightning flashes in hailstorm cell 1; this may have been related to the deep position of the lower positively charged region in the thunderstorm.
- The electric field value of hailstorm cell 1 was positive during the development and mature stages. When the hail was falling, the electric field value decreased, and when hail stopped falling, the electric field positively recovered. In the dissipating stage of the hailstorm, the value of the electric field became negative after the hail concluded, and no EOSO phenomenon occurred in this hailstorm.
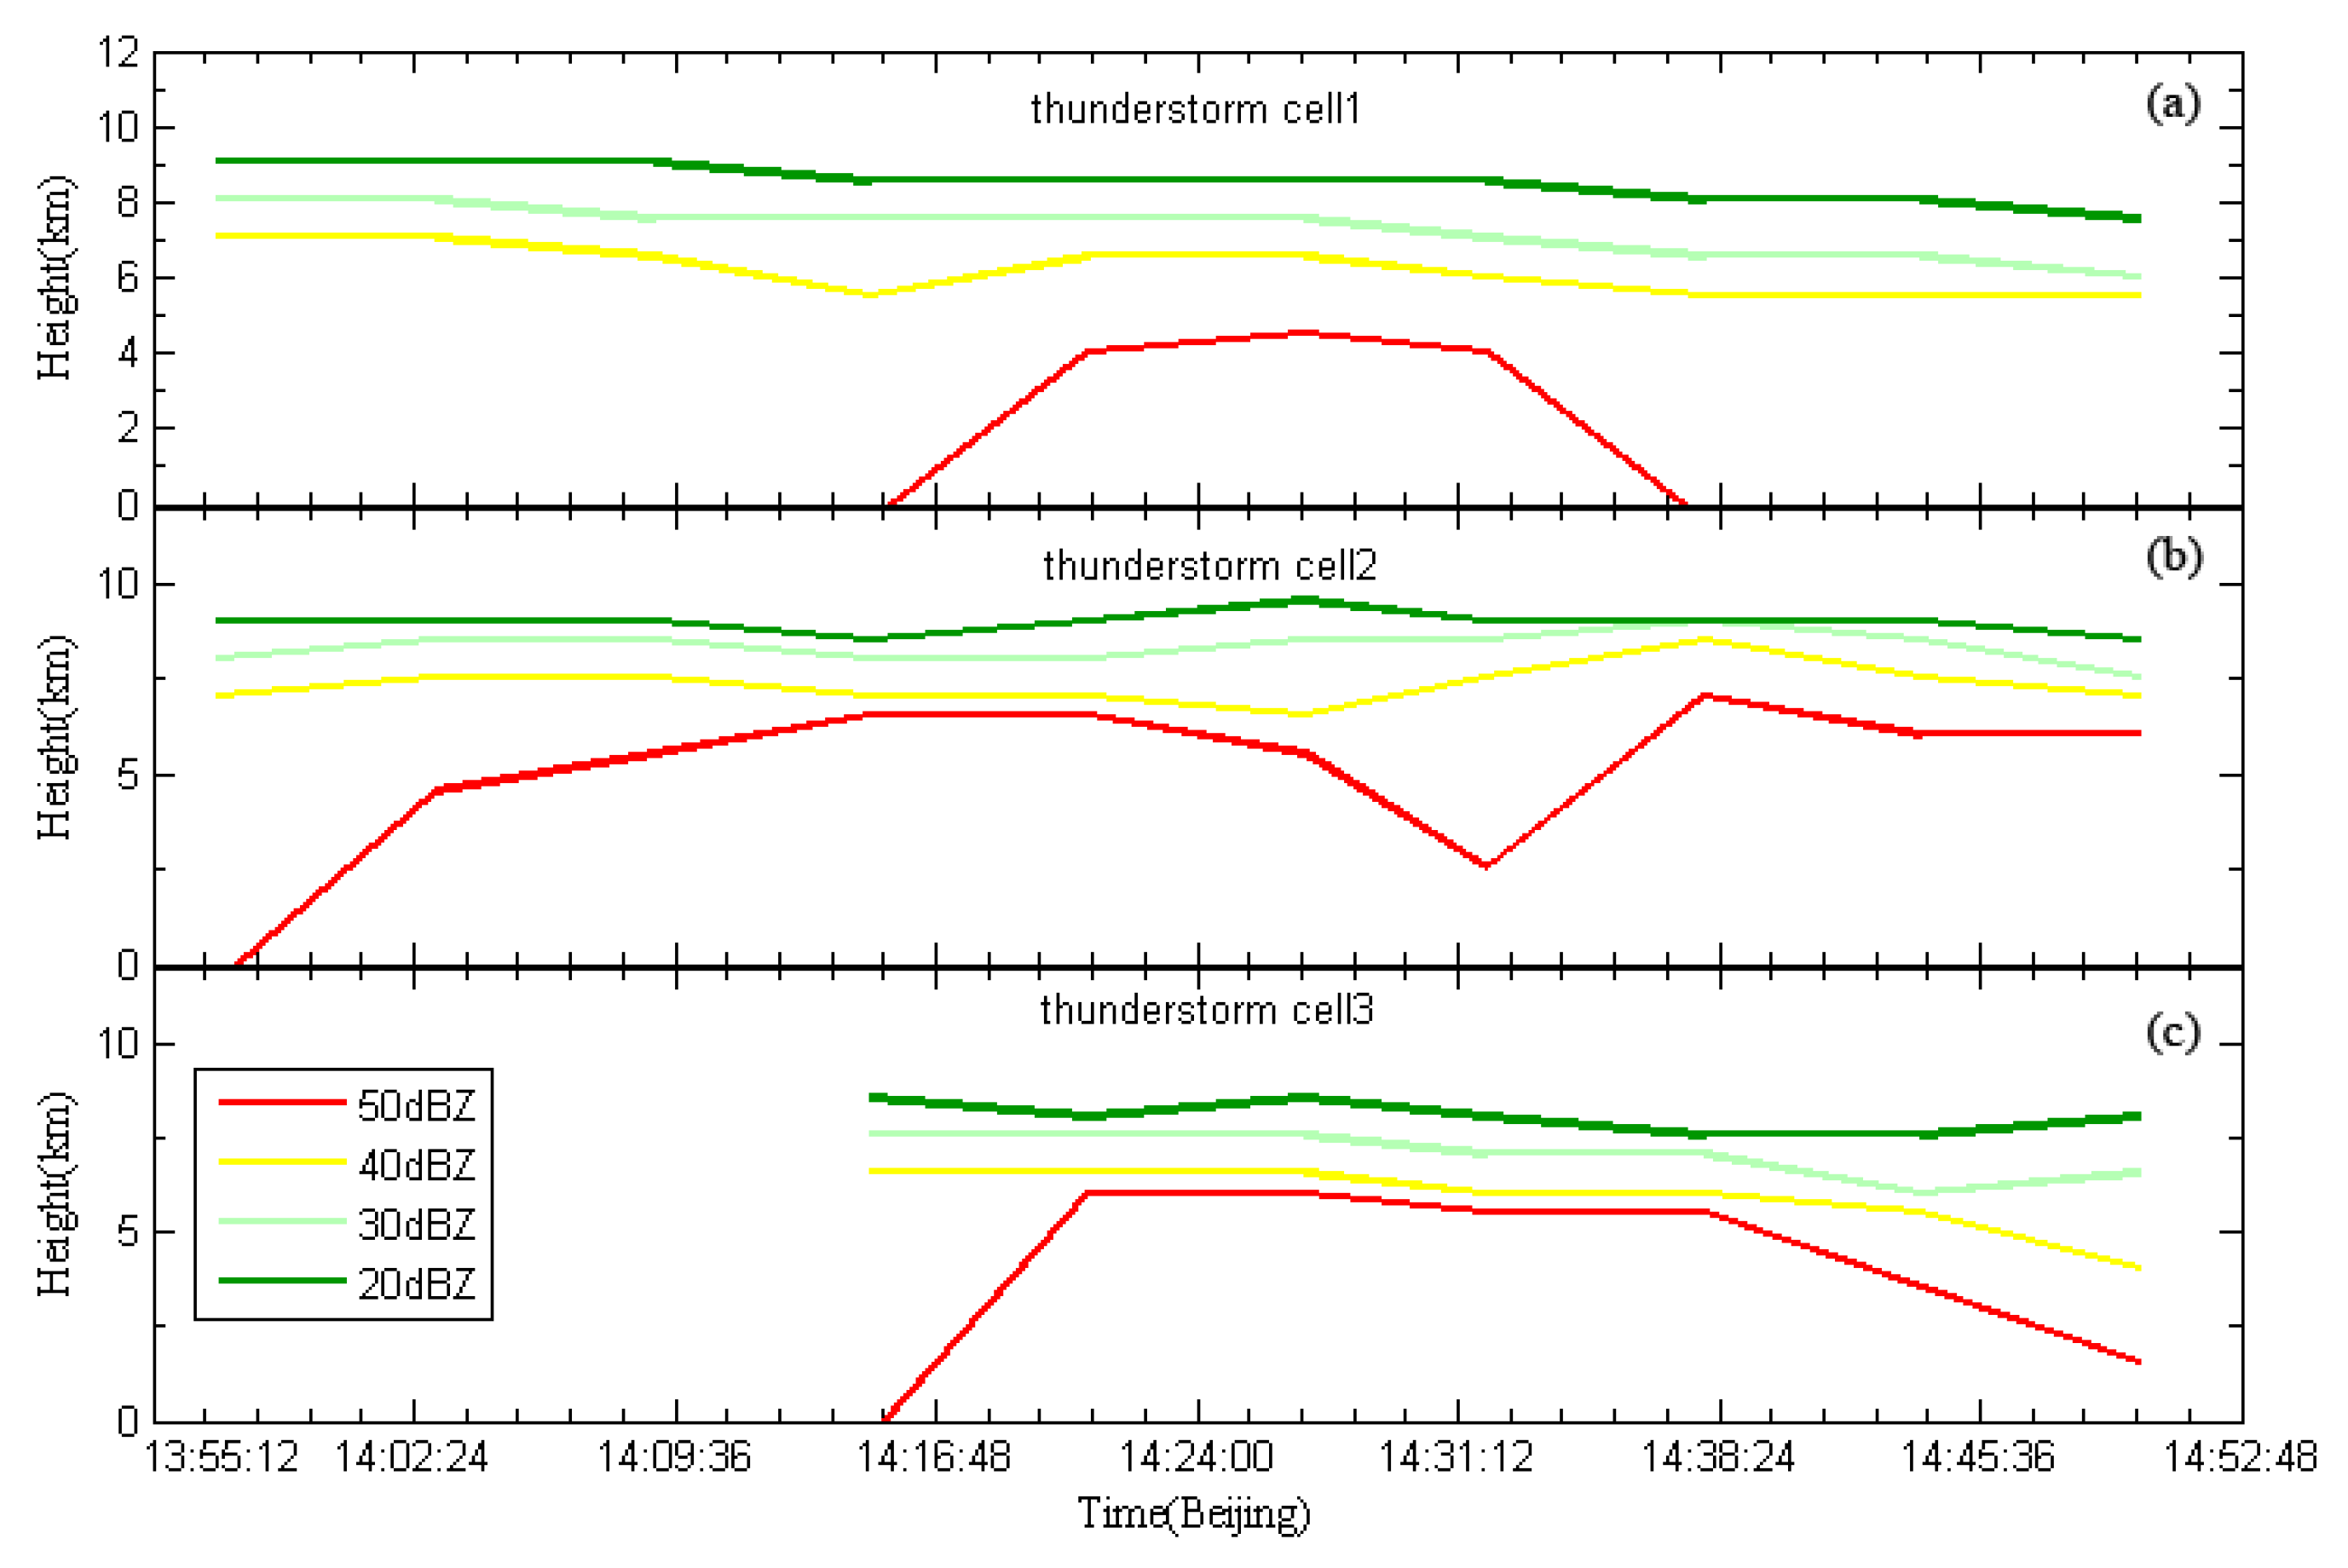
- The 50 dBZ echo zone in hailstorm cell 1 appeared approximately half an hour after the development of the thunderstorm, with a short duration of approximately 15 min and a low height. In contrast, the 50 dBZ echo zone in normal thunderstorm cell 2 appeared early and accompanied almost the whole thunderstorm process, with a relatively high height.
- The hailfall process differed in each stage of the thunderstorm’s development process. In the development stage, hailfall occurred only once and lasted for a long time. In the mature stage, hail fell many times and lasted for only a short time. In the dissipating stage, hail fell many times and lasted for a long time.
Author Contributions
Funding
Institutional Review Board Statement
Informed Consent Statement
Data Availability Statement
Acknowledgments
Conflicts of Interest
References
- Qie, X.S.; Toumi, R.; Zhou, Y.J. Lightning activity on the central Tibetan Plateau and its response to convective available potential energy. Chin. Sci. Bull. 2003, 48, 296–299. [Google Scholar] [CrossRef]
- Qie, X.; Kong, X.; Zhang, G.; Zhang, T.; Yuan, T.; Zhou, Y.; Zhang, Y.; Wang, H.; Sun, A. The possible charge structure of thunderstorm and lightning discharges in northeastern verge of Qinghai–Tibetan Plateau. Atmos. Res. 2005, 76, 231–246. [Google Scholar] [CrossRef]
- Zhang, Y.J.; Dong, W.S.; Zhao, Y.; Zhang, G.S.; Zhang, H.F.; Chen, C.P.; Zhang, T. Study of charge structure and radiation characteristic of intracloud discharge in thunderstorms of Qinghai-Tibet Plateau. Sci. China Earth Sci. 2004, 47, 108–114. [Google Scholar]
- Zheng, D.; Zhang, Y. New insights into the correlation between lightning flash rate and size in thunderstorms. Geophys. Res. Lett. 2021, 48, e2021GL096085. [Google Scholar] [CrossRef]
- Qie, X.; Zhang, T.; Zhang, G.; Zhang, T.; Kong, X. Electrical characteristics of thunderstorms in different plateau regions of China. Atmos. Res. 2009, 91, 244–249. [Google Scholar] [CrossRef]
- Zhang, T.; Qie, X.; Yuan, T.; Zhang, G.; Zhang, T.; Zhao, Y. Charge source of cloud-to-ground lightning and charge structure of a typical thunderstorm in the Chinese inland plateau. Atmos. Res. 2009, 92, 475–480. [Google Scholar] [CrossRef]
- Liu, X.S.; Ye, Z.X.; Shao, X.M.; Wang, C.W.; Yan, M.H.; Guo, C.M. Intracloud lightning discharges in the lower part of thundercloud. ACTA Meteorol. Sin. 1989, 3, 212–219. [Google Scholar]
- Wang, D.; Liu, X.; Wang, C. A preliminary analysis of the characteristics of ground discharges in thunderstorms near Zhongchuan, Gansu province. Plateau Meteorol. 1990, 9, 405–410. [Google Scholar]
- Li, Y.J.; Zhang, G.S.; Wen, J.; Wang, D.H.; Wang, Y.H.; Zhang, T.; Fan, X.P.; Fan, X.P.; Wu, B. Electrical structure of a Qinghai–Tibet Plateau thunderstorm based on three-dimensional lightning mapping. Atmos. Res. 2013, 134, 137–149. [Google Scholar] [CrossRef]
- Li, Y.J.; Zhang, G.S.; Wang, Y.H.; Wu, B. Observation and analysis of electrical structure change and diversity in thunderstorms on the Qinghai-Tibet Plateau. Atmos. Res. 2017, 194, 130–141. [Google Scholar] [CrossRef]
- Li, Y.; Zhang, G.; Zhang, Y. Evolution of the charge structure and lightning discharge characteristics of a Qinghai-Tibet Plateau thunderstorm dominated by negative cloud-to-ground flashes. J. Geophys. Res. Atmos. 2020, 125, e2019JD031129. [Google Scholar] [CrossRef]
- Marshall, T.C.; Rust, W.D.; Stolzenburg, M. Electrical structure and updraft speeds in thunderstorms over the southern great plains. J. Geophys. Res. Atmos. 1995, 100, 1001. [Google Scholar] [CrossRef]
- Brook, M.; Nakano, M.; Krehbiel, P.; Takeuti, T. The electrical structure of the hokuriku winter thunderstorm. J. Geophys. Res. Oceans 1982, 87, 1207–1215. [Google Scholar] [CrossRef]
- MacGorman, D.R.; Burgess, D.W. Positive cloud-to-ground lightning in tomadic storms and hailstorms. Mon. Weather Rev. 1994, 122, 1571–1597. [Google Scholar] [CrossRef]
- Rust, W.D.; MacGorman, D.R.; Bruning, E.C.; Weiss, S.A.; Krehbiel, P.R.; Thomas, R.J. Inverted-polarity electrical structures in thunderstorms in the Severe Thunderstorm Electrification and Precipitation Study (STEPS). Atmos. Res. 2005, 76, 247–271. [Google Scholar] [CrossRef]
- Liu, D.; Feng, G.; Wu, S. The characteristics of cloud-to-ground lightning activity in hailstorms over northern China. Atmos. Res. 2009, 91, 459–465. [Google Scholar] [CrossRef]
- Guo, F.; Zhang, Y.; Yan, M.; Guo, F.; Zhang, Y.; Yan, M.; Dong, W. The effect of environment temperature and humidity stratification on charge structure in thunderstorms. Plateau Meteorol. 2004, 23, 678–683. (In Chinese) [Google Scholar]
- Qie, X.S.; Zhang, Y.J.; Yuan, T. A review of atmospheric electricity research in China. Adv. Atmos. Sci. 2015, 32, 169–191. [Google Scholar] [CrossRef]
- Fan, X.; Zhang, Y.; Zhang, G.; Zheng, D. Lightning characteristics and electric charge structure of a hail-producing thunderstorm on the eastern Qinghai–Tibetan Plateau. Atmosphere 2018, 9, 295. [Google Scholar] [CrossRef]
- Zhang, G.S.; Wang, Y.H.; Qie, X.S.; Zhang, T.; Zhao, Y.X.; Li, Y.J.; Cao, D.J. Using lightning locating system based on time-of-arrival technique to study three-dimensional lightning discharge processes. Sci. China Earth Sci. 2010, 53, 591–602. [Google Scholar] [CrossRef]
- Zhang, G.S.; Li, Y.J.; Wang, Y.H.; Zhang, T.; Wu, B.; Liu, Y.X. Experimental study on location accuracy of a 3D VHF lightning-radiation-source locating network. Sci. China Earth Sci. 2015, 58, 2034–2048. [Google Scholar] [CrossRef]
- Kasemir, H.W. A contribution to the electrostatic theory of lightning discharge. J. Geophys. Res. Atmos. 1960, 65, 1873–1878. [Google Scholar] [CrossRef]
- Mazur, V.; Ruhnke, L.H. Common physical processes in natural and artificially triggered lightning. J. Geophys. Res. Atmos. 1993, 98, 12913–12930. [Google Scholar] [CrossRef]
- Shao, X.M.; Krehbiel, P.R. The spatial and temporal development of intracloud lightning. Geophys. Res. Lett. 1996, 101, 26641–26668. [Google Scholar] [CrossRef]
- Rison, W.; Thomas, R.J.; Krehbiel, P.R.; Hamlin, T.; Harlin, J. A GPS-based three-dimensional lightning mapping system: Initial observations in central New Mexico. Geophys. Res. Lett. 1999, 26, 3573–3576. [Google Scholar] [CrossRef]
- Krehbiel, P.R.; Thomas, R.J.; Rison, W.; Hamlin, T.; Hamlin, J.; Davis, M. GPS-based mapping system reveals lightning inside storms. Eos Trans. Am. Geophys. Union 2000, 81, 21–25. [Google Scholar] [CrossRef]
- MacGorman, D.R.; Rust, W.D.; Schuur, T.J.; Biggerstaff, M.I.; Straka, J.M.; Ziegler, C.L.; Mansell, E.R.; Bruning, E.C.; Kuhlman, K.M.; Lund, N.R.; et al. TELEX: The Thunderstorm Electrification and Lightning Experiment. Bull. Am. Meteorol. Soc. 2008, 89, 997–1013. [Google Scholar] [CrossRef]
- Wu, B.; Zhang, G.; Wen, J.; Zhang, T.; Li, Y.; Wang, Y. Correlation analysis between initial preliminary breakdown process, the characteristic of radiation pulse, and the charge structure on the Qinghai-Tibetan Plateau. J. Geophys. Res. Atmos. 2016, 121, 12434–12459. [Google Scholar] [CrossRef]
- Liu, Z.G.; Wang, P.X.; Yang, J.C.; Yan, H.X.; Mao, Y.Q.; Chen, P. Statistical Character of Local Hail and Discussion About Special Hail Cloud Cell on the Northeast of Tibetan Plateau. J. Arid Meteorol. 2007, 25, 10–16. [Google Scholar]
- Zhang, Y.; Xu, L.; Zheng, D.; Wang, F. Review on inverted charge structure of severe storms. Chin. J. Appl. Meteorol. Sci. 2014, 25, 513–526. [Google Scholar]
- Bruning, E.C.; Weiss, S.A.; Calhoun, K.M. Continuous variability in thunderstorm primary electrification and an evaluation of inverted-polarity terminology. Atmos. Res. 2014, 135–136, 274–284. [Google Scholar] [CrossRef]
- Donald, R.; MacGorman, W.; David, R. The Electrical Nature of Storms; Oxford University Press: New York, NY, USA, 1998; pp. 167–168. [Google Scholar]
- Qie, X.S.; Zhang, T.L.; Chen, C.P.; Zhang, G.S.; Zhang, T.; Wei, W.Z. The lower positive charge center and its effect on lightning discharges on the Tibetan Plateau. Geophys. Res. Lett. 2005, 32, L05814. [Google Scholar] [CrossRef]
- MacGorman, D.R.; Rust, W.D.; Krehbiel, P. The electrical structure of two supercell storms during STEPS. Mon. Weather Rev. 2005, 133, 2583–2607. [Google Scholar] [CrossRef]
- Rust, W.D. Possibly inverted-polarity electrical structures in thunderstorms during steps. Geophys. Res. Lett. 2002, 29, 1571. [Google Scholar] [CrossRef]
- Mansell, E.R.; Ziegler, C.L.; Bruning, E.C. Simulated electrification of a small thunderstorm with two-moment bulk microphysics. J. Atmos. Sci. 2010, 67, 171–194. [Google Scholar] [CrossRef]
- Nag, A.; Rakov, A.V. Some inferences on the role of lower positive charge region in facilitating different types of lightning. Geophys. Res. Lett. 2009, 36, L05815. [Google Scholar] [CrossRef]
- Iudin, D.I.; Rakov, V.A.; Mareev, E.A.; Iudin, F.D.; Syssoev, A.A.; Davydenko, S.S. Advanced numerical model of lightning development: Application to studying the role of LPCR in determining lightning type. J. Geophys. Res. Atmos. 2017, 122, 6416–6430. [Google Scholar] [CrossRef]
- Zhang, Y.; Meng, Q.; Lu, W.; Paul, K.; Liu, X.; Zhou, X. Charge structures and cloud to-ground lightning discharges characteristics in two supercell thunderstorms. Chin. Sci. Bull. 2006, 51, 198–212. [Google Scholar] [CrossRef]
- Qie, X.; Zhang, Y.; Zhang, Q. Characteristics of lightning discharges and electric structure of thunderstorm. Acta Meteorol. Sin. 2006, 2, 244–257. [Google Scholar]
- Wiens, K.C.; Rutledge, S.A.; Tessendorf, S.A. The 29 June 2000 supercell observed during STEPS. Part II: Lightning and charge structure. J. Atmos. Sci. 2005, 62, 4151–4177. [Google Scholar] [CrossRef]
- Carey, L.D.; Buffalo, K.M. Environmental control of cloud-to ground lightning polarity in severe storms. Mon. Weather Rev. 2007, 135, 1327–1353. [Google Scholar] [CrossRef]

Disclaimer/Publisher’s Note: The statements, opinions and data contained in all publications are solely those of the individual author(s) and contributor(s) and not of MDPI and/or the editor(s). MDPI and/or the editor(s) disclaim responsibility for any injury to people or property resulting from any ideas, methods, instructions or products referred to in the content. |
© 2023 by the authors. Licensee MDPI, Basel, Switzerland. This article is an open access article distributed under the terms and conditions of the Creative Commons Attribution (CC BY) license (https://creativecommons.org/licenses/by/4.0/).
Share and Cite
Li, Y.; Zhang, G.; Lyu, W.; Zhao, Y. Analysis of Inverted Charge Structure and Lightning Activity during the 8.14 Local Hailstorm on the Qinghai–Tibet Plateau. Atmosphere 2023, 14, 1795. https://doi.org/10.3390/atmos14121795
Li Y, Zhang G, Lyu W, Zhao Y. Analysis of Inverted Charge Structure and Lightning Activity during the 8.14 Local Hailstorm on the Qinghai–Tibet Plateau. Atmosphere. 2023; 14(12):1795. https://doi.org/10.3390/atmos14121795
Chicago/Turabian StyleLi, Yajun, Guangshu Zhang, Weitao Lyu, and Yuxiang Zhao. 2023. "Analysis of Inverted Charge Structure and Lightning Activity during the 8.14 Local Hailstorm on the Qinghai–Tibet Plateau" Atmosphere 14, no. 12: 1795. https://doi.org/10.3390/atmos14121795
APA StyleLi, Y., Zhang, G., Lyu, W., & Zhao, Y. (2023). Analysis of Inverted Charge Structure and Lightning Activity during the 8.14 Local Hailstorm on the Qinghai–Tibet Plateau. Atmosphere, 14(12), 1795. https://doi.org/10.3390/atmos14121795