Abstract
The port of Cartagena, south-east Spain, is noted for its intense activity. This paper presents the influence of the COVID-19 pandemic on the recorded levels of six pollutants. Fifteen years of measurements were used, with two objectives. The first was to investigate how these pollutants evolved, together with their usual cycles. The second objective was to ascertain whether the COVID-19 pandemic had an impact on the concentrations recorded. The results showed that nitrogen oxide concentrations remained steady in the first half of the measurement period and decreased in the second half. SO2 concentrations decreased irregularly, whereas O3 and PM10 presented steady concentrations. The annual cycle was observed for nitrogen oxides and O3. Only SO2 evidenced no weekly cycle. Finally, the analysis of pre- and post-pandemic concentrations revealed a sharp decrease in nitrogen oxides, whereas the pandemic was not seen to have had any impact on the other pollutants. In addition, NO2 emerged as the best indicator of human activity—represented by car and maritime traffic—due to its response to the relaxation measures. Finally, Lamb weather types were calculated. The unclassified type was the most frequent. However, the greatest concentration changes were observed for anticyclonic and eastern flow types.
1. Introduction
Studies of ambient air quality in cities that are ports are increasing. Most of these studies are based on observing concentrations, and works such as Zheng et al. [1] indicate that air quality evaluations are based on pollutant concentration control. A basic procedure for regional air quality evaluations is based on measurements obtained from monitoring sites.
There is little doubting the key role played by maritime transport, not only in terms of goods but also with regard to passenger transport as well as vessels used for tourism and leisure; namely, cruise ships. Bilgili and Celebi [2] indicated that 90% of the world’s transport is by sea, with maritime activities having a substantial impact on air quality. Over 450 air pollutants are caused by the internal combustion processes of ships’ engines. Nunes et al. [3] reported that maritime traffic has become one of the most polluting industries due to the increased traffic in ports over the last twenty years. Various studies also find that shipping vessel emissions contribute substantially to total transport emissions worldwide [4,5,6]. Ships’ emissions can have adverse effects on air quality while vessels are at berth, during towing operations and when in transit along the coast [7], and several studies have highlighted the role of ship emissions as a major source of air pollution [6,8,9,10]. Moreover, sea breeze may transport the air pollutants emitted by ships to land, where pollution may increase, with the subsequent health problems this leads to [6,11,12,13,14]. Indeed, results show that air pollution levels in port areas are similar to those on land [15,16].
Port areas are point sources of sea transport, although their contribution represents only a small fraction of this form of transport’s overall emissions [17]. The main pollutants emitted by ships are particulate matter (PM), volatile organic compounds (VOC), carbon monoxide (CO), nitrogen oxides (NOx), sulphur oxides (SOx) and carbon dioxide (CO2). The impact on health is particularly acute with regard to PM, VOC, CO, NOx and SOx. NOx and SOx contribute to rain acidification, while CO2 is linked to the greenhouse effect [18]. Some studies have revealed that around 2.2, 15 and 5.8% of global anthropogenic levels of CO2, NOx and SOx, respectively, are attributed to ships [17,19,20]. Although designing and implementing policies geared towards emission abatement proves difficult and complex due to the global scope of this sector, monitoring and controlling air pollution is a recognised part of the key measures aimed at minimising the impact of port activities [17,21].
As regards the population’s exposure to these emissions, Alver et al. [22] found that nearly 230 million people are directly exposed to these emissions in the 100 main ports around the world. Tichavska and Tovar [23] noted that exhaust emissions from sea transport are a major concern for health and environmental protection. The impact of dangerous pollutants released into the atmosphere negatively impacts coastal communities as well as those living in the cities near the ports. Corbett et al. [11] and Alver et al. [22] reported a link between PM emissions from sea transport and certain causes of death in some European and Asian coastal areas.
Nunes et al. [3] pointed out that port emissions are produced by ships’ engines (main and secondary) when ships sail, when they manoeuvre in and out of port as well as when they remain docked. Some years earlier, Saxe and Larsen [9] established two sources of ship air emissions: the first is manoeuvres, and the second is dock activity. Manoeuvres when arriving or leaving dock include turning, braking and accelerating, all of which consume more energy than when merely sailing the same distance at a constant average speed. Most ship emissions are produced while at sea. However, due to the port’s proximity to populations, port emissions may prove to be more noticeable. Villalba and Gemechu [24] indicated that a city’s activity as a sea port makes it different to other cities.
García [25] noted the constant increase in international tourism due to globalization, and highlighted the impact of cruise ship tourism due to its rapid expansion. This has been heralded as a major success story by ports and by shipping companies, although social opposition has condemned the environmental costs associated with this activity. Such costs include the pollutant emissions released into the atmosphere and which may impact people’s health since shipping routes often run parallel to or near to the coast. In general, there are two different phases when a ship is in port: manoeuvring and mooring. Moreover, when a ship is docked in port, it continues to burn fuel oil in order to keep its facilities running, which are linked to the city. Several procedures have been presented to calculate emissions under different working conditions [26,27] and the impact this has on nearby cities [28]. Consequently, local mobilisation and opposition to cruise ships is now emerging time and again.
The city of Cartagena and the region in which it lies—Murcia—were the focus of atmospheric research. Air pollution problems in Cartagena have long been known, with the origin of these problems being the proximity of industries to the urban area. Control measures, such as a reduction in activity or the interruption thereof, have led to significant decreases in SO2 and total suspended matter levels [29]. One specific problem of urban areas is vehicle traffic. The lockdown resulting from the COVID-19 health crisis brought about a number of changes in the mobility pattern, which impacted air quality. Air quality initially improved, although the new traffic patterns favoured pollution situations in Cartagena [30,31]. Outside of Cartagena—although still within the region of Murcia—the impact of the COVID-19 lockdown on air pollution was studied by Doval Miñarro and Bueso [32] with three monitoring stations, one rural, a second industrial and the last one rural. Finally, the origin of microplastics in the air was investigated with air trajectory analysis. The results of this research revealed local agricultural practices to be the main origin of these pollutants [33].
The current paper seeks to establish the impact of the COVID-19 lockdown on the concentrations in a city with cruise ship traffic and tourism. This impact was studied with different variables, such as noise changes [34] or night-time sky glow [35]. Air pollution is a result of the combination of the following three elements: pollutant sources, atmospheric chemistry and meteorology. Noticeable decreases in particulate matter and different pollutants during the COVID-19 lockdown were observed at populated sites in China [36]. Moreover, responses to the suggested social distancing and stay-at-home orders are available worldwide. By way of an example, some are presented by Sabrin et al. [37], where an improvement in air quality was observed in the USA, while Seo et al. [38] reported a reduction in the PM2.5/PM10 ratio as a consequence of social distancing as well as a drop in the air quality index in two Korean cities—Seoul and Daegu. In this study, the concentrations of six pollutants are used. An extensive database was analysed at a site with two ports: one affected by this lockdown due to its link to tourism; the second devoted to handling goods, which continued to work during the lockdown.
Two noticeable and original contributions of the current study merit highlighting. The first is the analysis of the relationship between weather types and pollutant concentrations in the context of the pandemic. Consequently, this paper investigates the influence of regional structures, such as pressure centres, on the values of local variables, such as the recorded concentrations. The second original feature of this research is the description of annual and weekly cycles with a simple addition of two harmonics since this combination is flexible enough to obtain satisfactory fits. Both contributions are geared towards a physical approach that is not present in previous analyses, which mainly focus on chemical features, such as concentrations.
Another difference between this research and previous studies involves comparing concentrations between the lockdown period and the periods preceding and following it. Most published studies compare values in the lockdown period with those of a few months before or after, with the main inconvenience being that seasonal evolution overlaps with the impact of the pandemic. In the current research, concentrations are compared for the same period in the year before, in the year of the pandemic, and in the year after the pandemic.
After describing the site and databases used, the paper then offers data on pollutant evolution. This section is aimed at increasing current background information on coastal sites where cities and industries are located. Finally, the study focuses on the lockdown period.
2. Materials and Methods
2.1. Site and Measurements
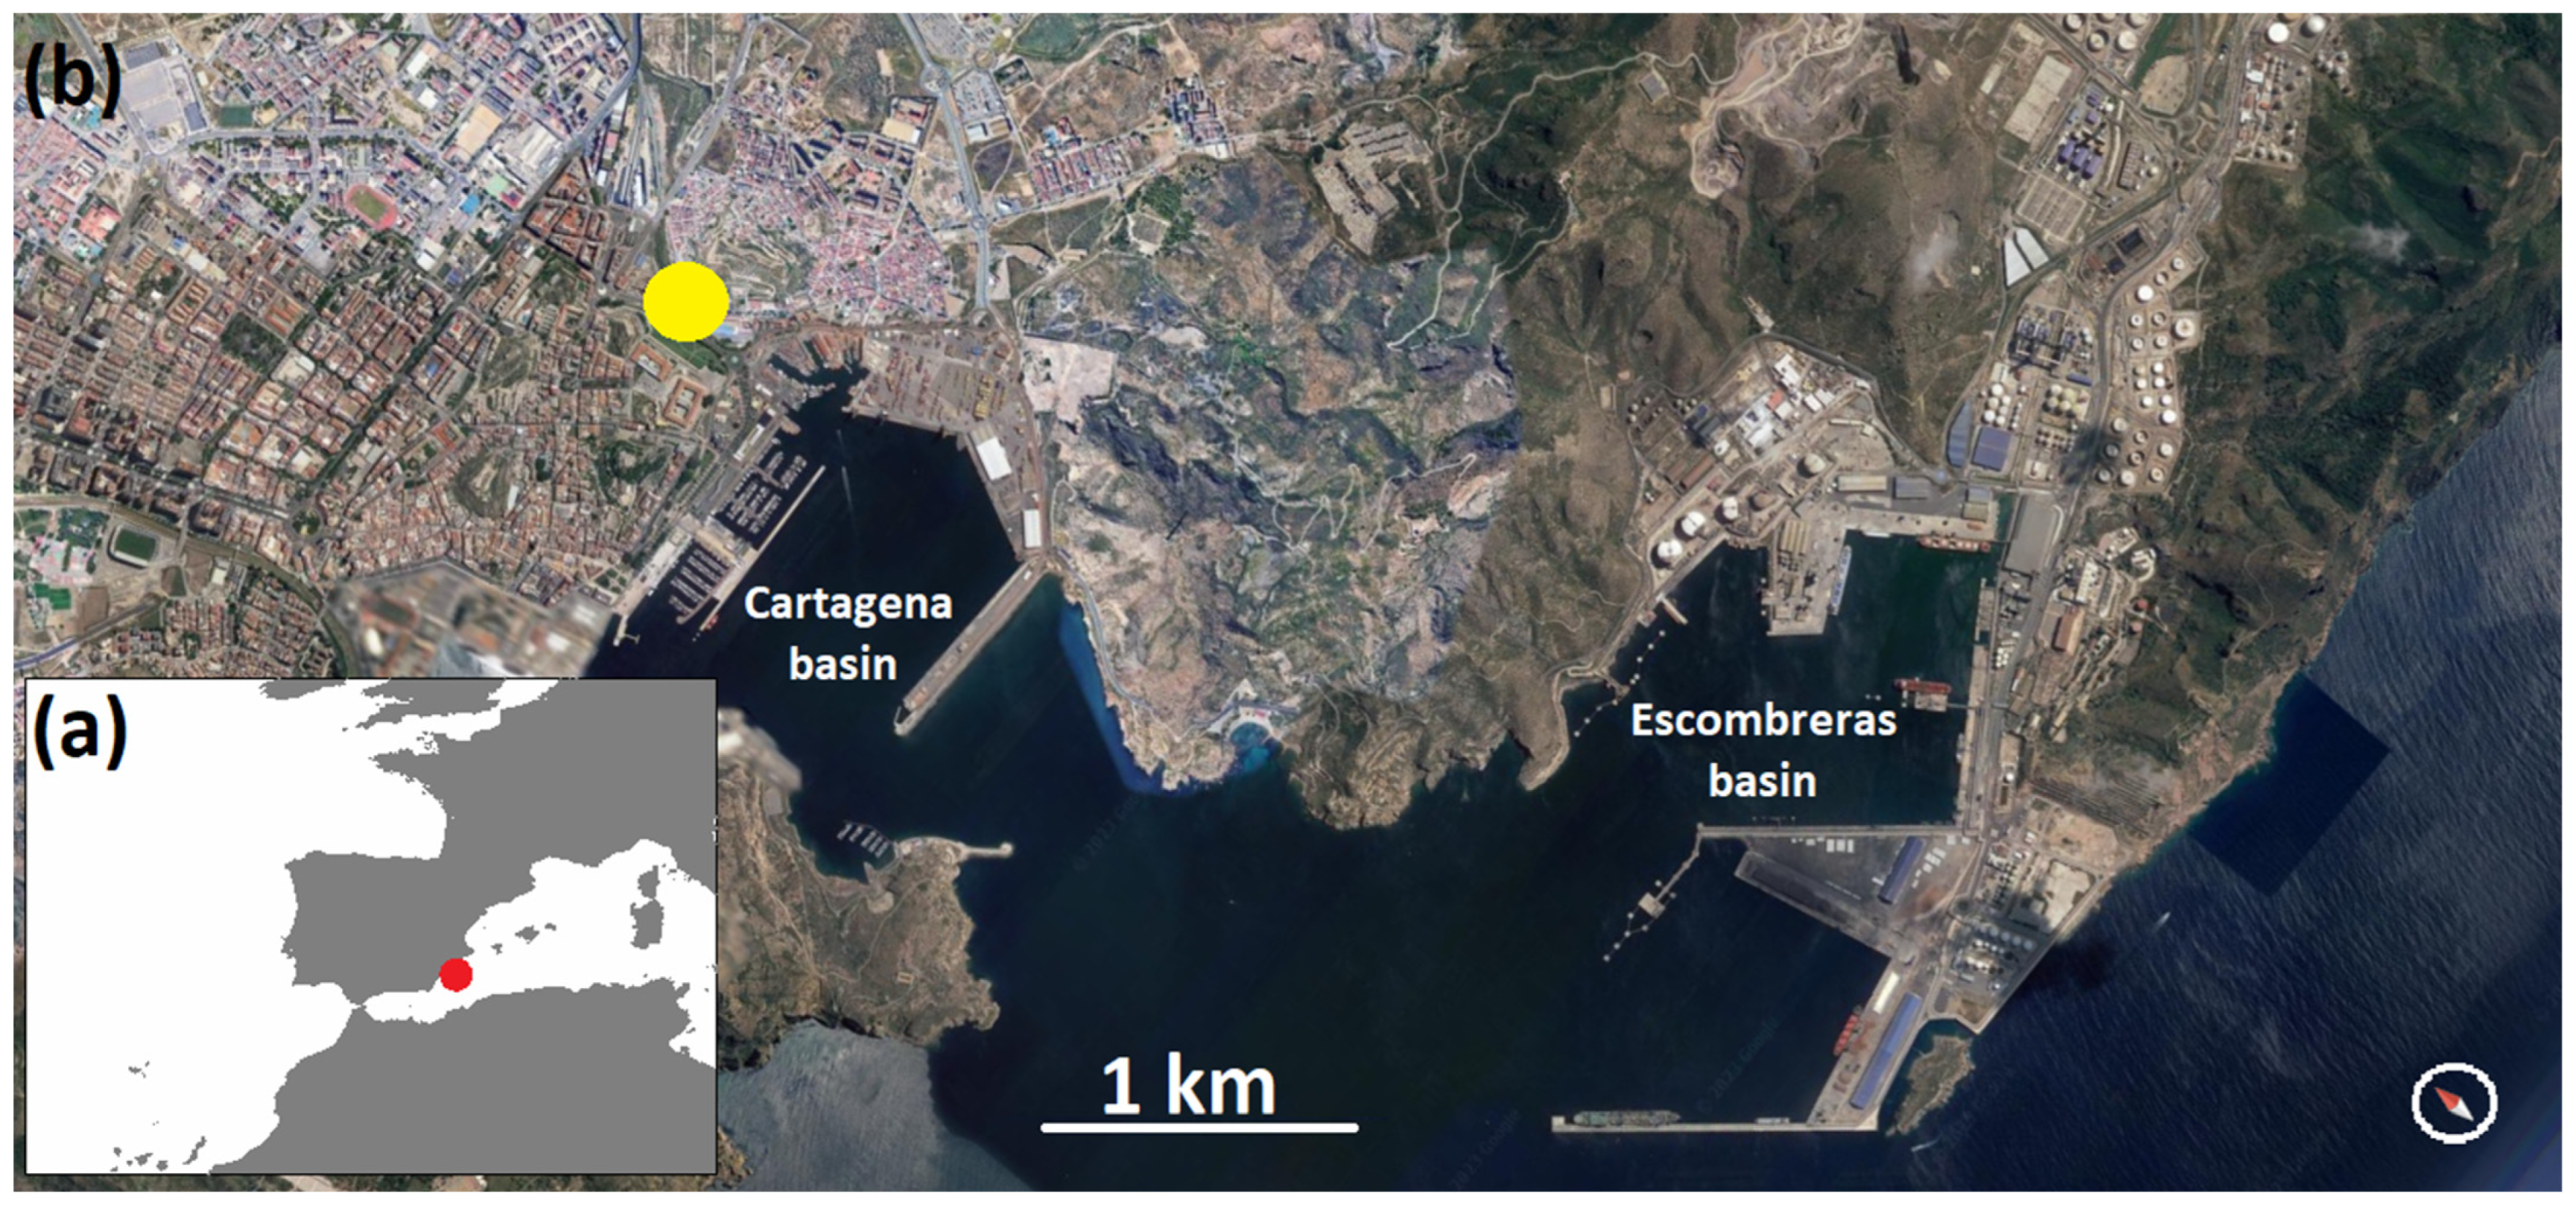
The port of Cartagena is located in the western Mediterranean Sea—Figure 1—on the sea route between Western Europe and the Indian Ocean and the Western Pacific. In the 1970s, it was Spain’s leading port in the total amount of goods handled. Cartagena is a double port, formed by two separate basins—the Cartagena basin (with a population of 217,000 inhabitants), and the Escombreras basin. The distance between the two is some 1.5 miles by sea. This port boasts deep basins that favour the manoeuvrability of large vessels, with the lack of sea storms being an additional feature.
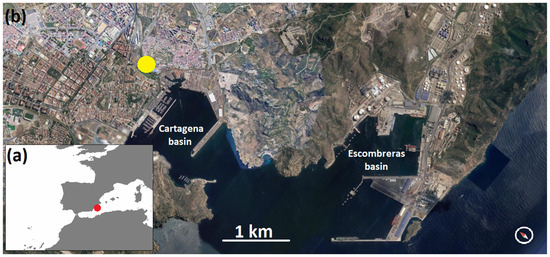
Figure 1.
Basins of the port of Cartagena (red dot in the south-west Europe map, (a)) and the measurement station (yellow dot to the upper left side of (b), in the image by Google Earth).
Air quality data were daily averages provided by the Murcia regional government [39], and the measurement station—Mompean (coordinates 37°36′06.6″ N 0°58′34.2″ W)—was selected since it is mainly affected by traffic and secondly by the port’s activity. The analysis period covered from January 2007 to December 2021, and the pollutants investigated were NO, NO2, NOx, SO2, O3 (the latter since May 2010) and PM10. The analysis procedure used by the monitors was chemiluminescence for nitrogen oxides (Teledyne API T200, 0–50 ppb to 0–20 ppm), ultraviolet fluorescence for SO2 (Ecotech Serinus 50, 0–20 ppm), ultraviolet absorption for O3 (Teledyne API T400, 0–100 ppb to 0–10 ppm) and beta absorption for PM10 (DIGITEL DHA80).
Maritime transport data—such as tourist ships and passenger numbers—were provided by the Spanish Ministry of Transport, Mobility and Urban Agenda [40]. A seasonal pattern of this activity is observed since it focused on the period April–November in the last three years before the COVID-19 pandemic. The mean number of ships per month was around ten in June–August, although it rose to over 20 in April–May, with the peak being reached in October with around 30. The average number of passengers per month remained more constant—between 20,000 and 30,000. There were two peaks: the first in October, with around 40,000 passengers, and the second in May with around 35,000. These numbers are small when compared to those from European tourist cities.
2.2. Harmonic Analysis
Previous research considered a two-harmonic function to describe the evolution of atmospheric concentrations [41]. The function proposed responds to the equation:
where y is the pollutant concentration, T1 and T2 are the periods (T2 = T1/2), and t is time. This function was flexible enough to accurately describe quite varied annual evolutions. In this analysis, T1 was 12 months for the annual analysis, but seven days for the weekly analysis, which is a specific feature of this paper, and which has scarcely been investigated until now. This equation may be transformed to the following,
which may be fitted by a multiple linear regression procedure. Once the bi coefficients are calculated, ai amplitudes may be calculated from
2.3. Lamb Weather Types
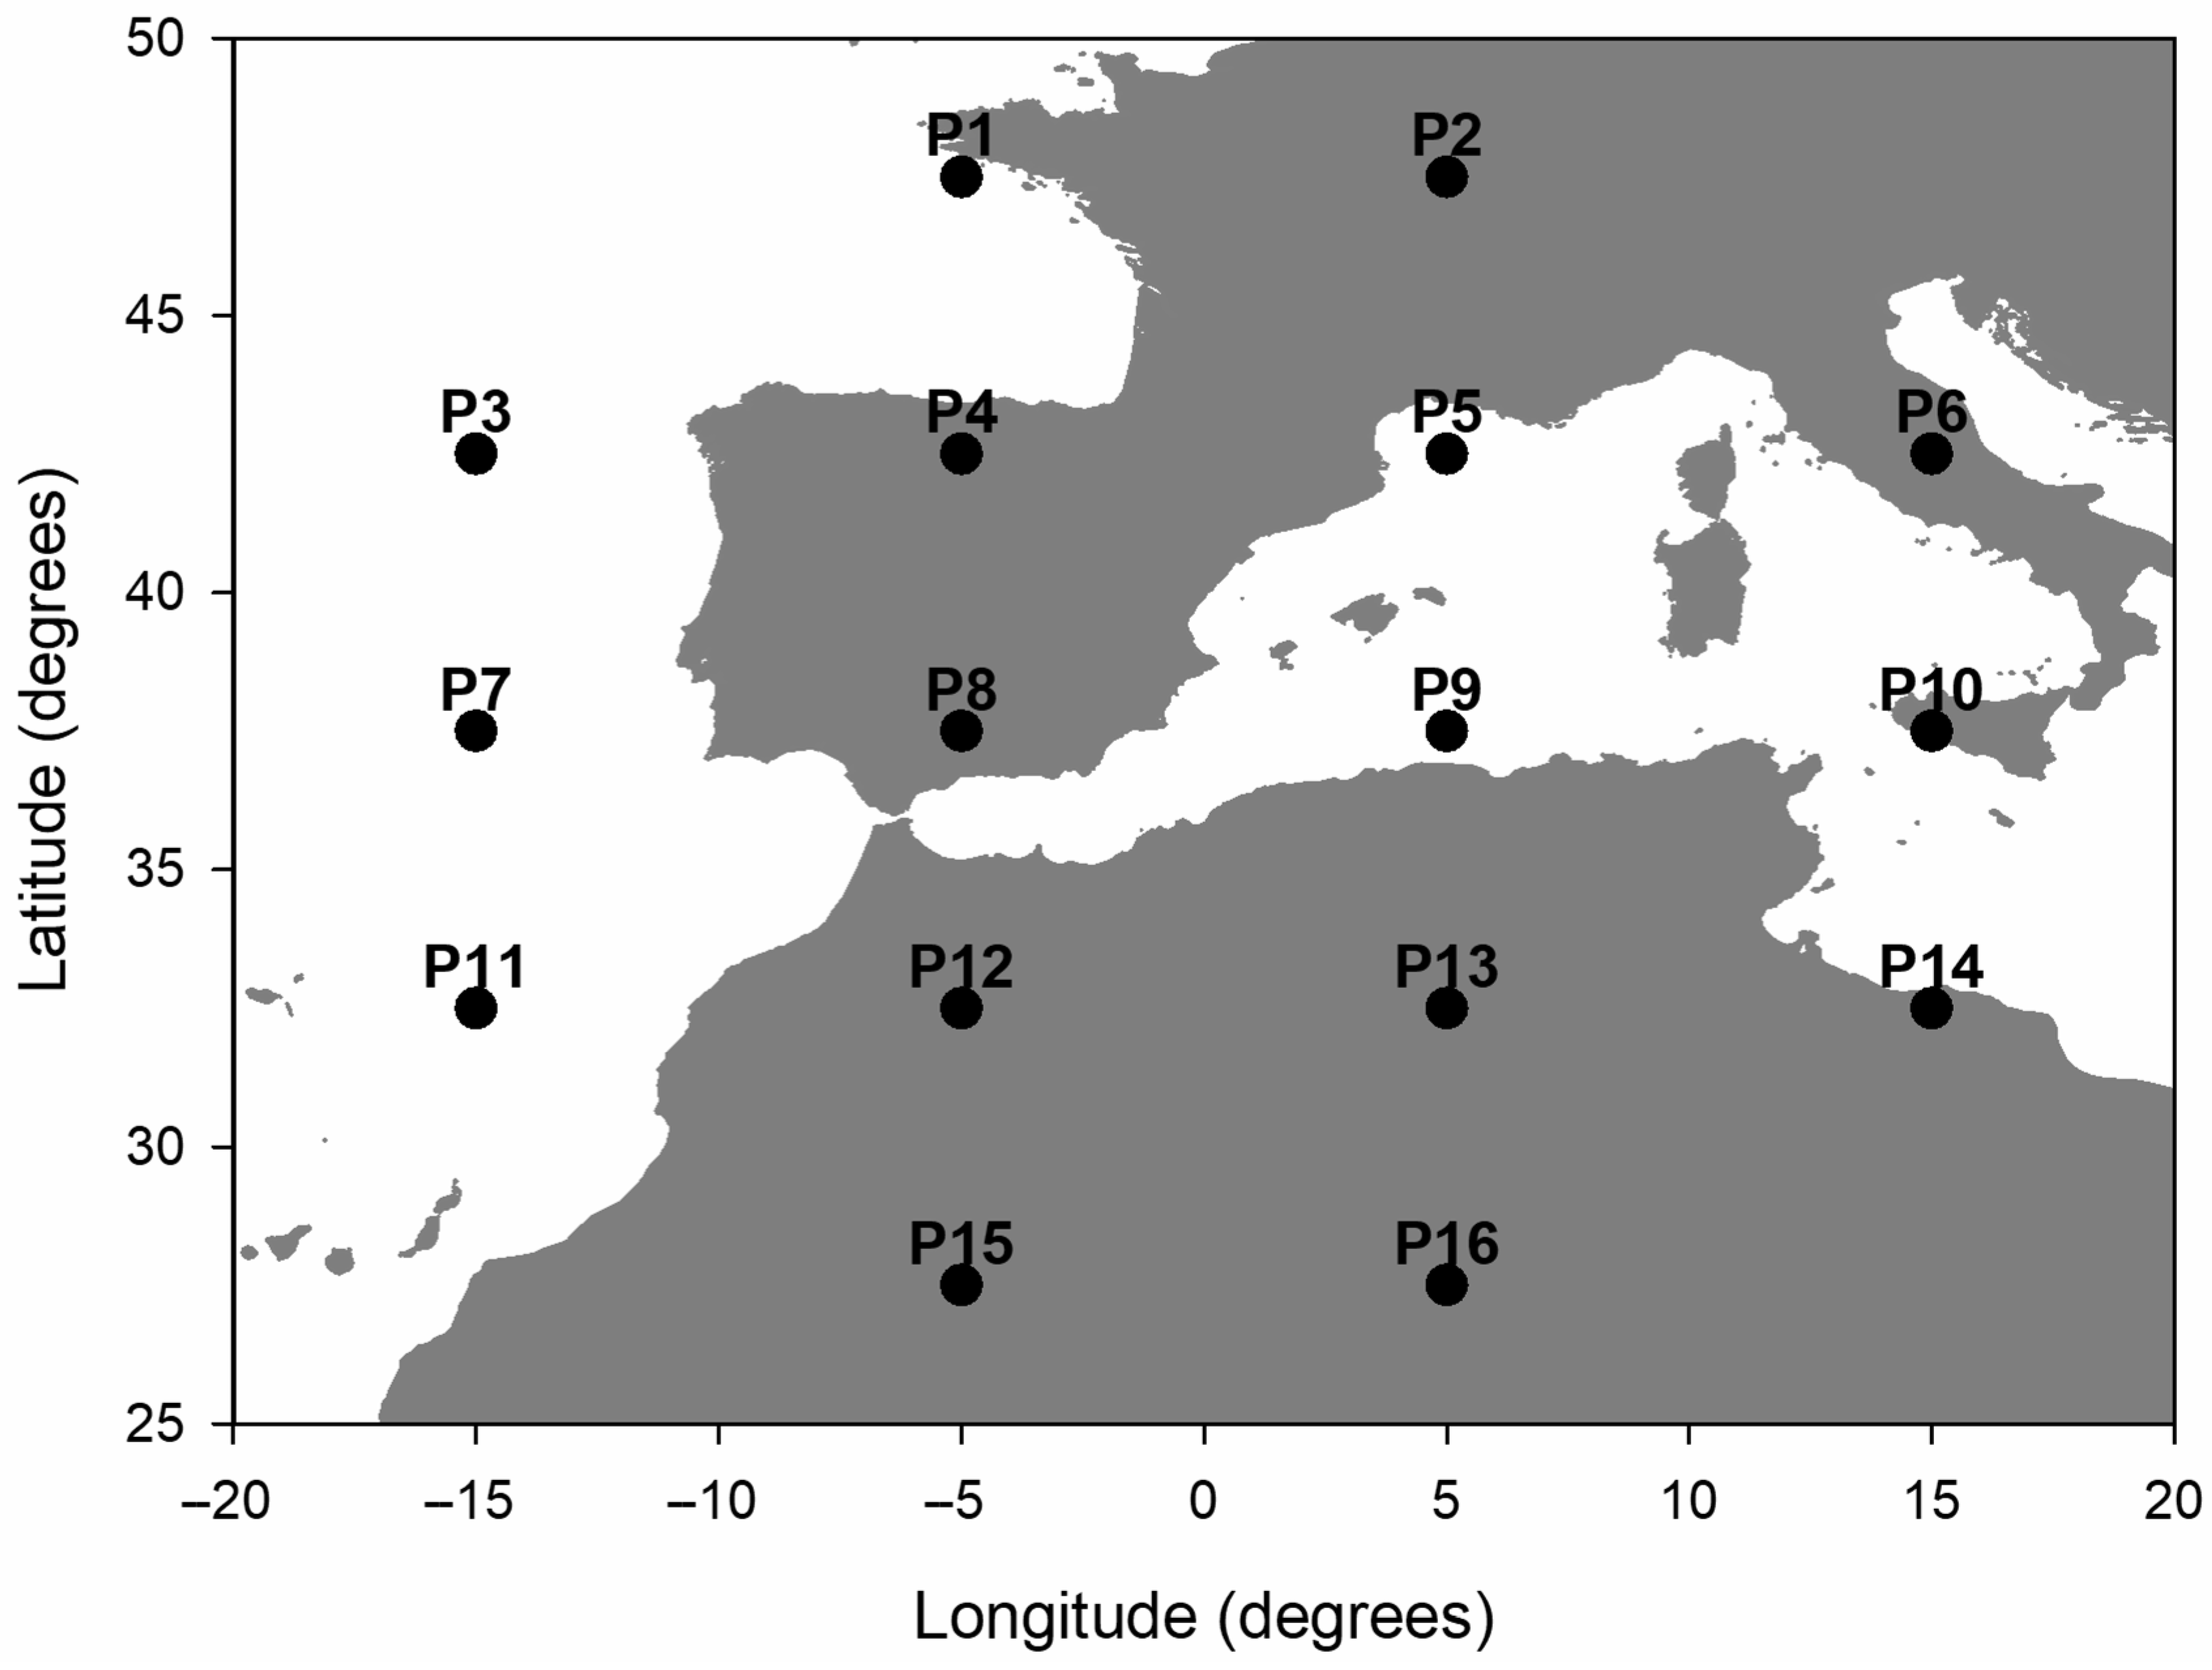
The original classification was developed in the 1970s, with one major inconvenience of this and similar classifications being the subjective determination of specific situations. However, Jenkinson and Collison [42] proposed a procedure for objectively determining weather types. This method is based on a 16-point network, which is presented in Figure 2. Sea level pressure, P, at these points is extracted from pressure fields provided by NOAA [43].
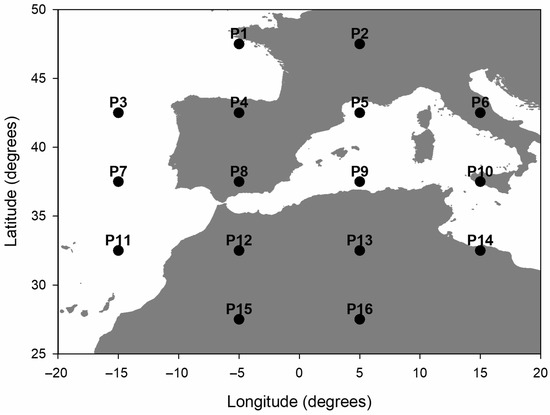
Figure 2.
Network used to determine Lamb weather types.
The following equations are required:
where W indicates westerly flow, S, southerly flow, F, the resulting flow, ZW, westerly shear vorticity, ZS, southerly shear vorticity, and Z, total vorticity. The following coefficients are necessary:
Latitude is 37.5° N in this case. Moreover, wind direction is determined by
Eight 45° sectors were used to establish wind direction.
If |Z| < F, a Lamb pure directional type is obtained, such as eastern, E. If |Z| > 2F, the weather type is anticyclonic, A, (Z < 0) or cyclonic, C, (Z > 0). If F < |Z| < 2F, there is a Lamb hybrid type, such as AN, anticyclonic with northerly flow. Finally, if F < 6 and |Z| < 6, the weather type is unclassified, U. With this classification, 27 weather types are obtained.
3. Results and Discussion
3.1. The Whole Period
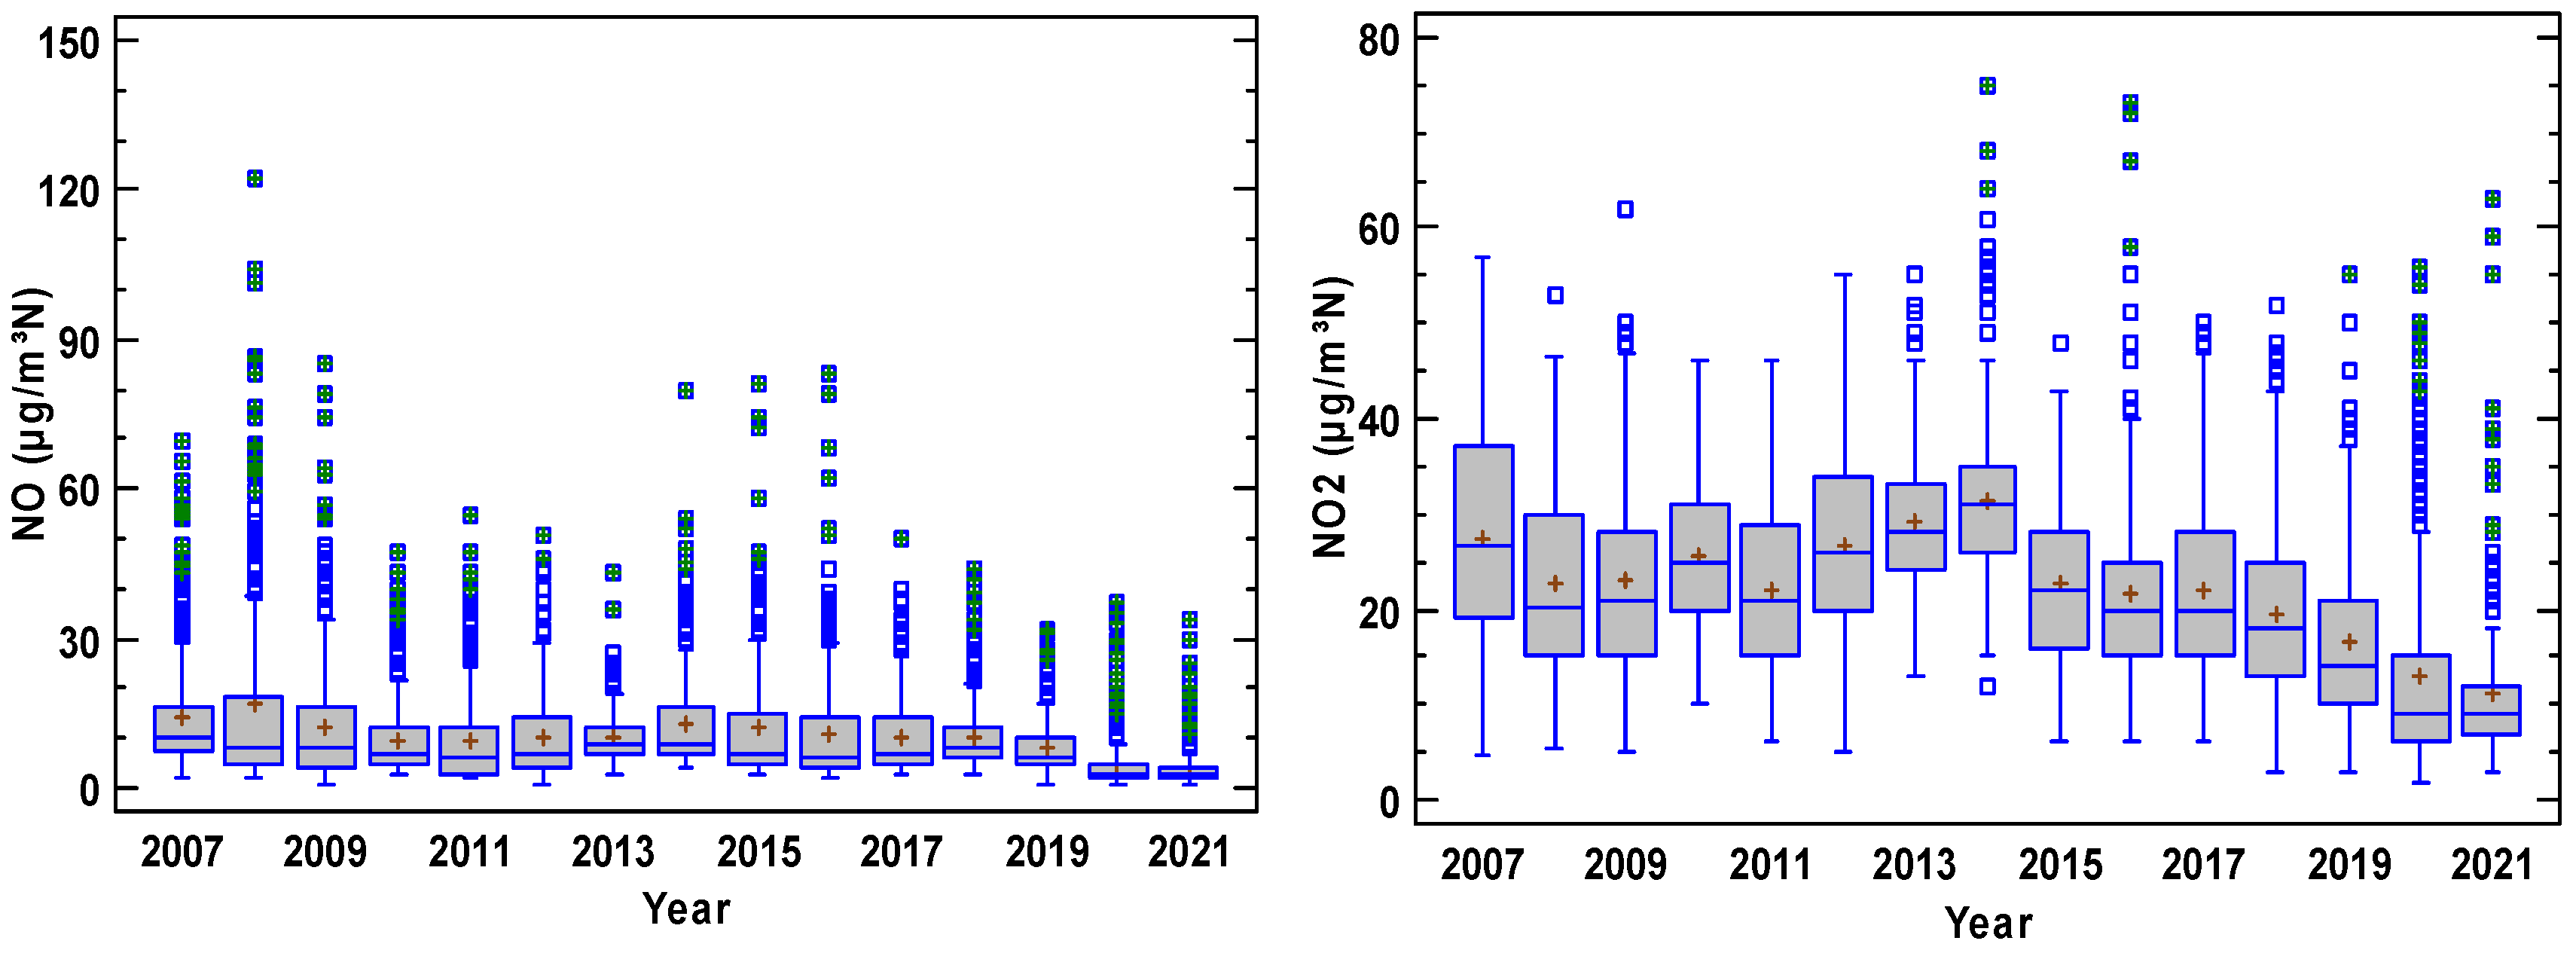
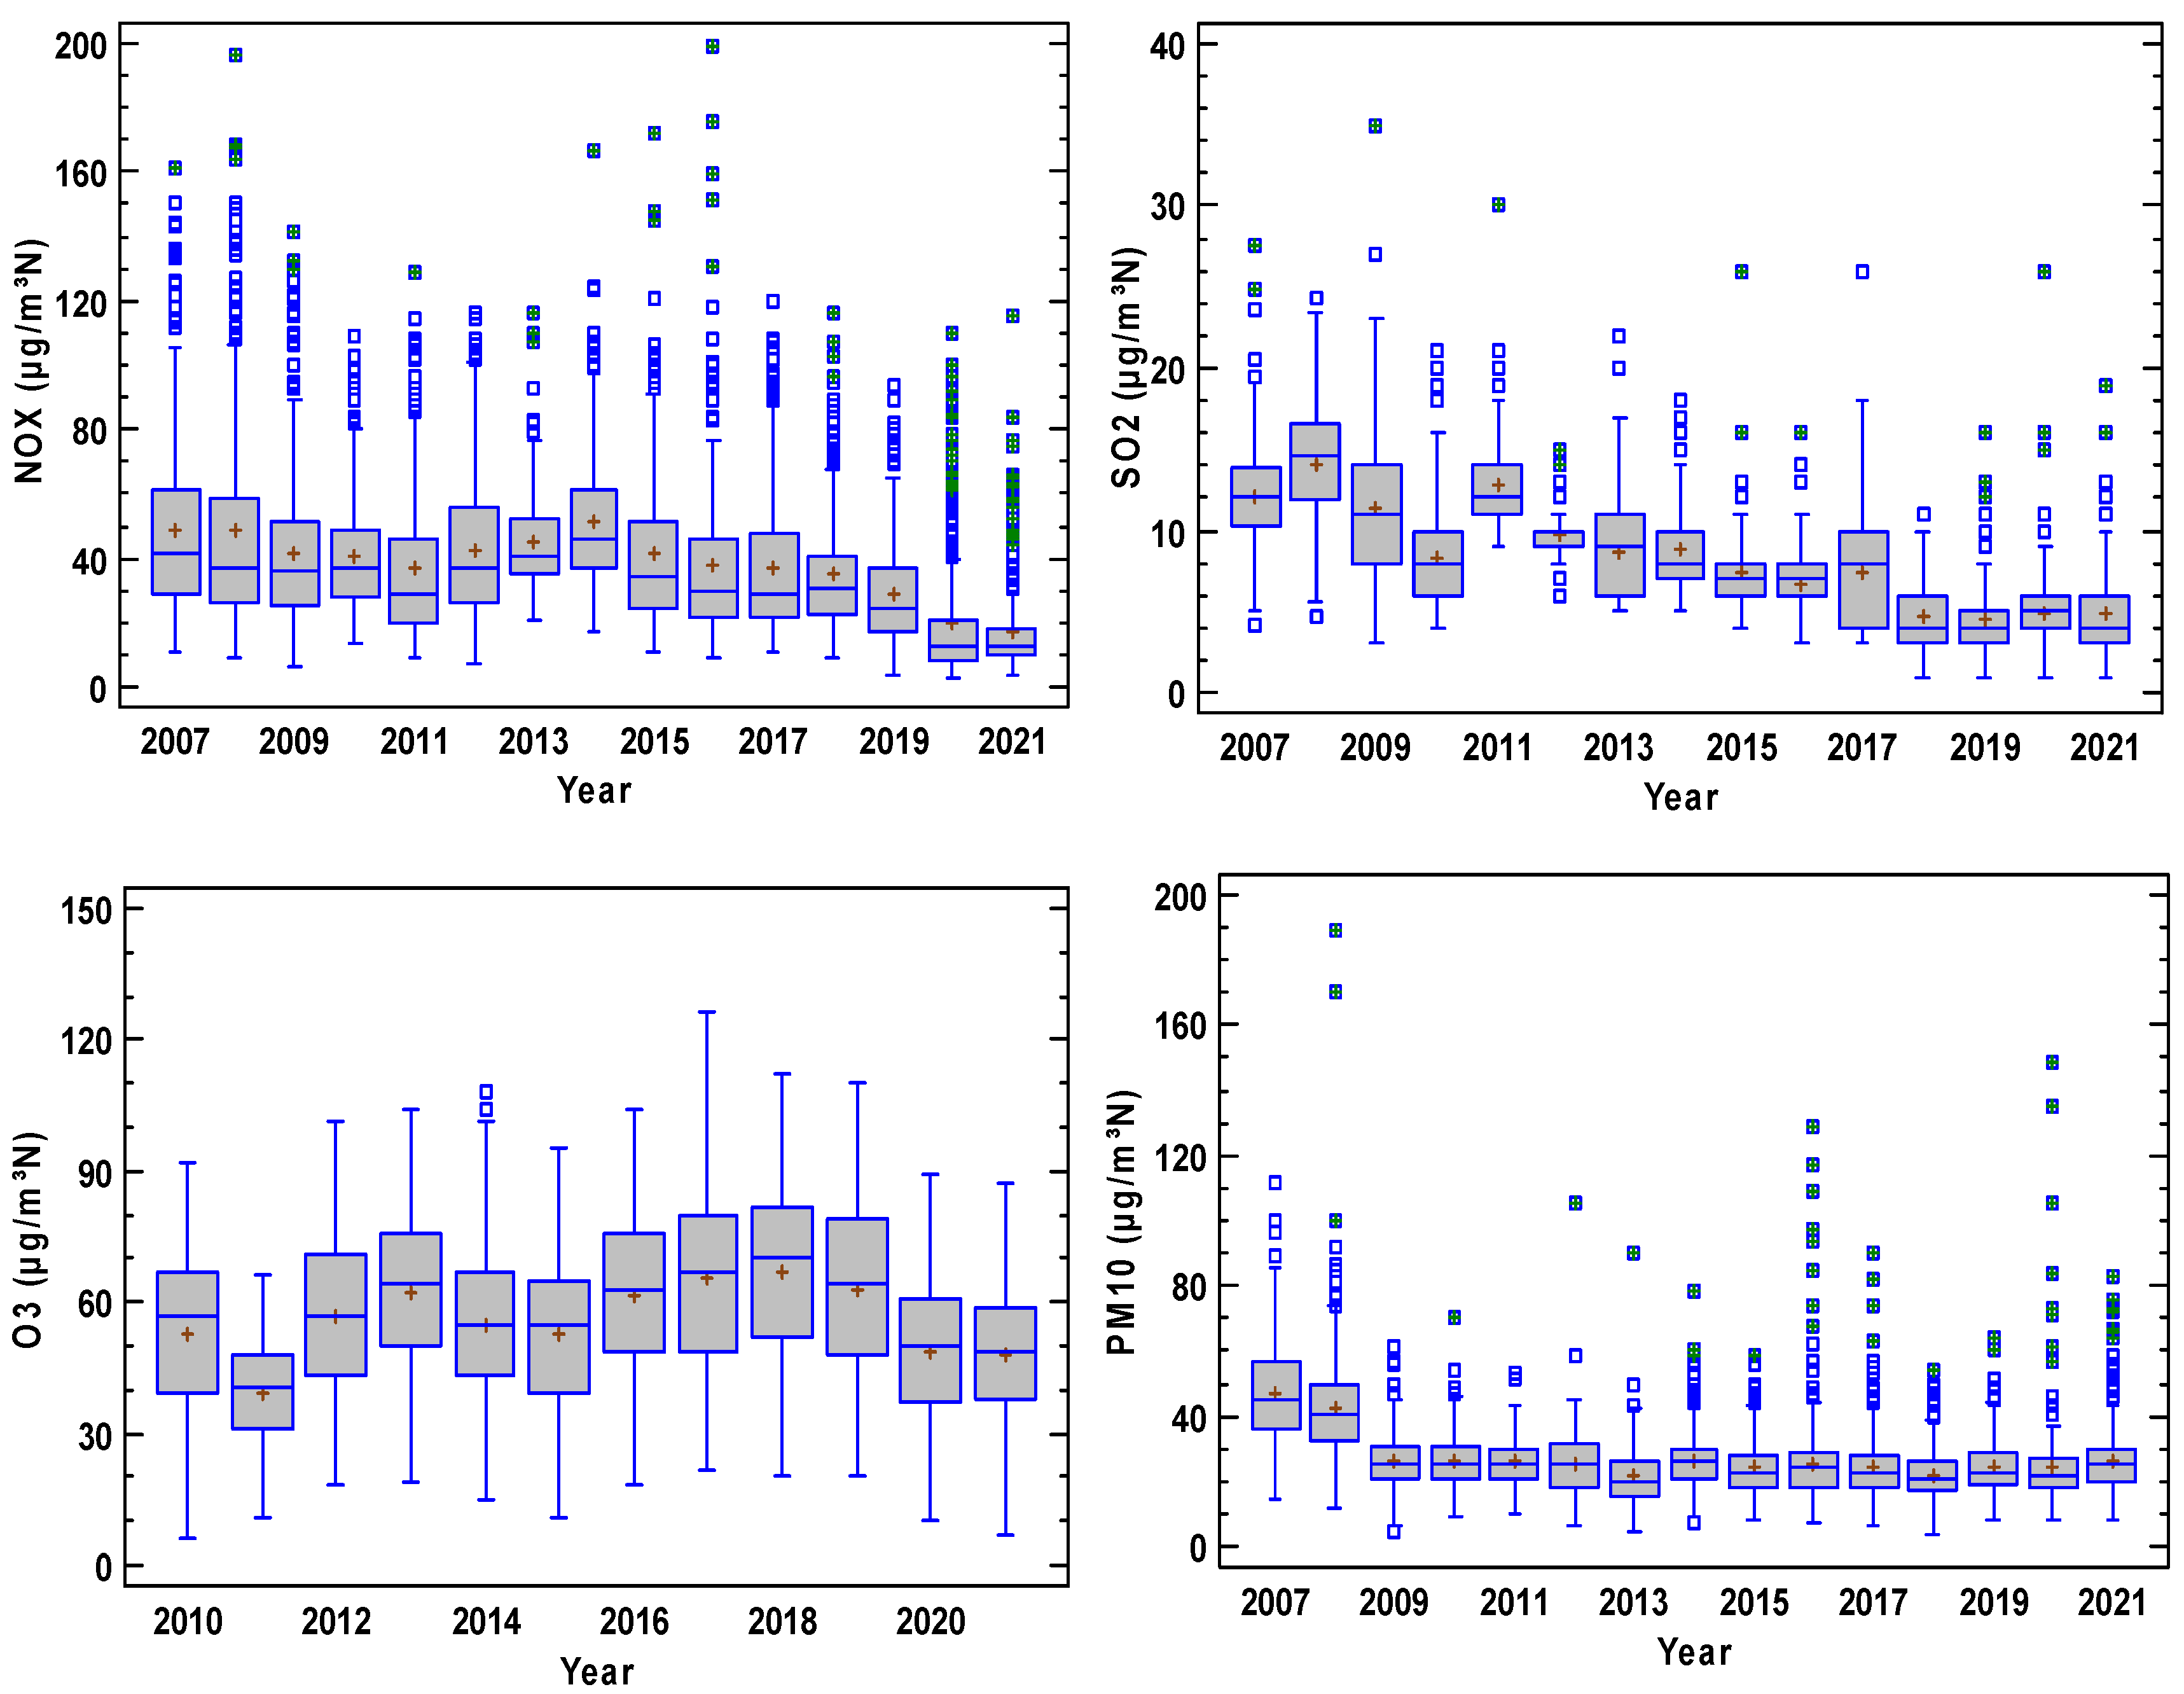
Figure 3 presents the concentration evolution where each year is represented by a boxplot diagram. In these plots, NO2 contribution was higher than that of NO, and a period of steady concentrations is observed until 2014 for both nitrogen oxides, although a decrease is observed after this year. Concentration decreased for SO2, although the sudden changes in the interquartile range reveal an irregular evolution where extreme concentrations are frequent. Finally, concentrations remain steady for O3 and PM10. Moreover, O3 is noticeable for the scarce number of outliers, which were more frequent for PM10.
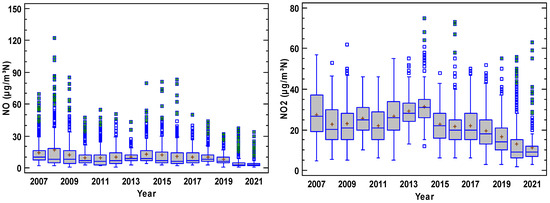
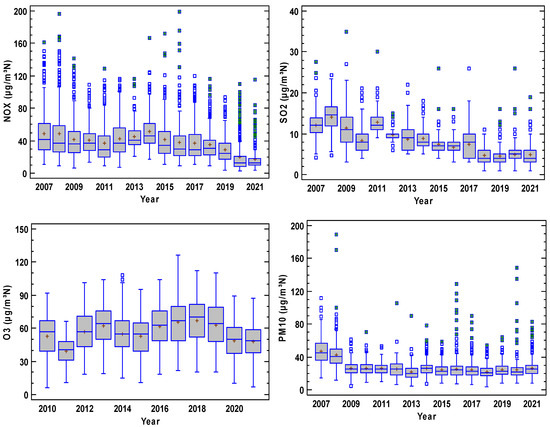
Figure 3.
Evolution of pollutants at the station considered in the period 2007–2021 (O3 2010–2021). The box is the interquartile range, the median is the line in the box, and the mean is the cross in the box. The whiskers extend until the last value in a fence located at 1.5 times the interquartile range, and outliers are drawn as isolated dots. Outliers with a cross correspond to extreme values outside three times the interquartile range from the upper or lower quartiles.
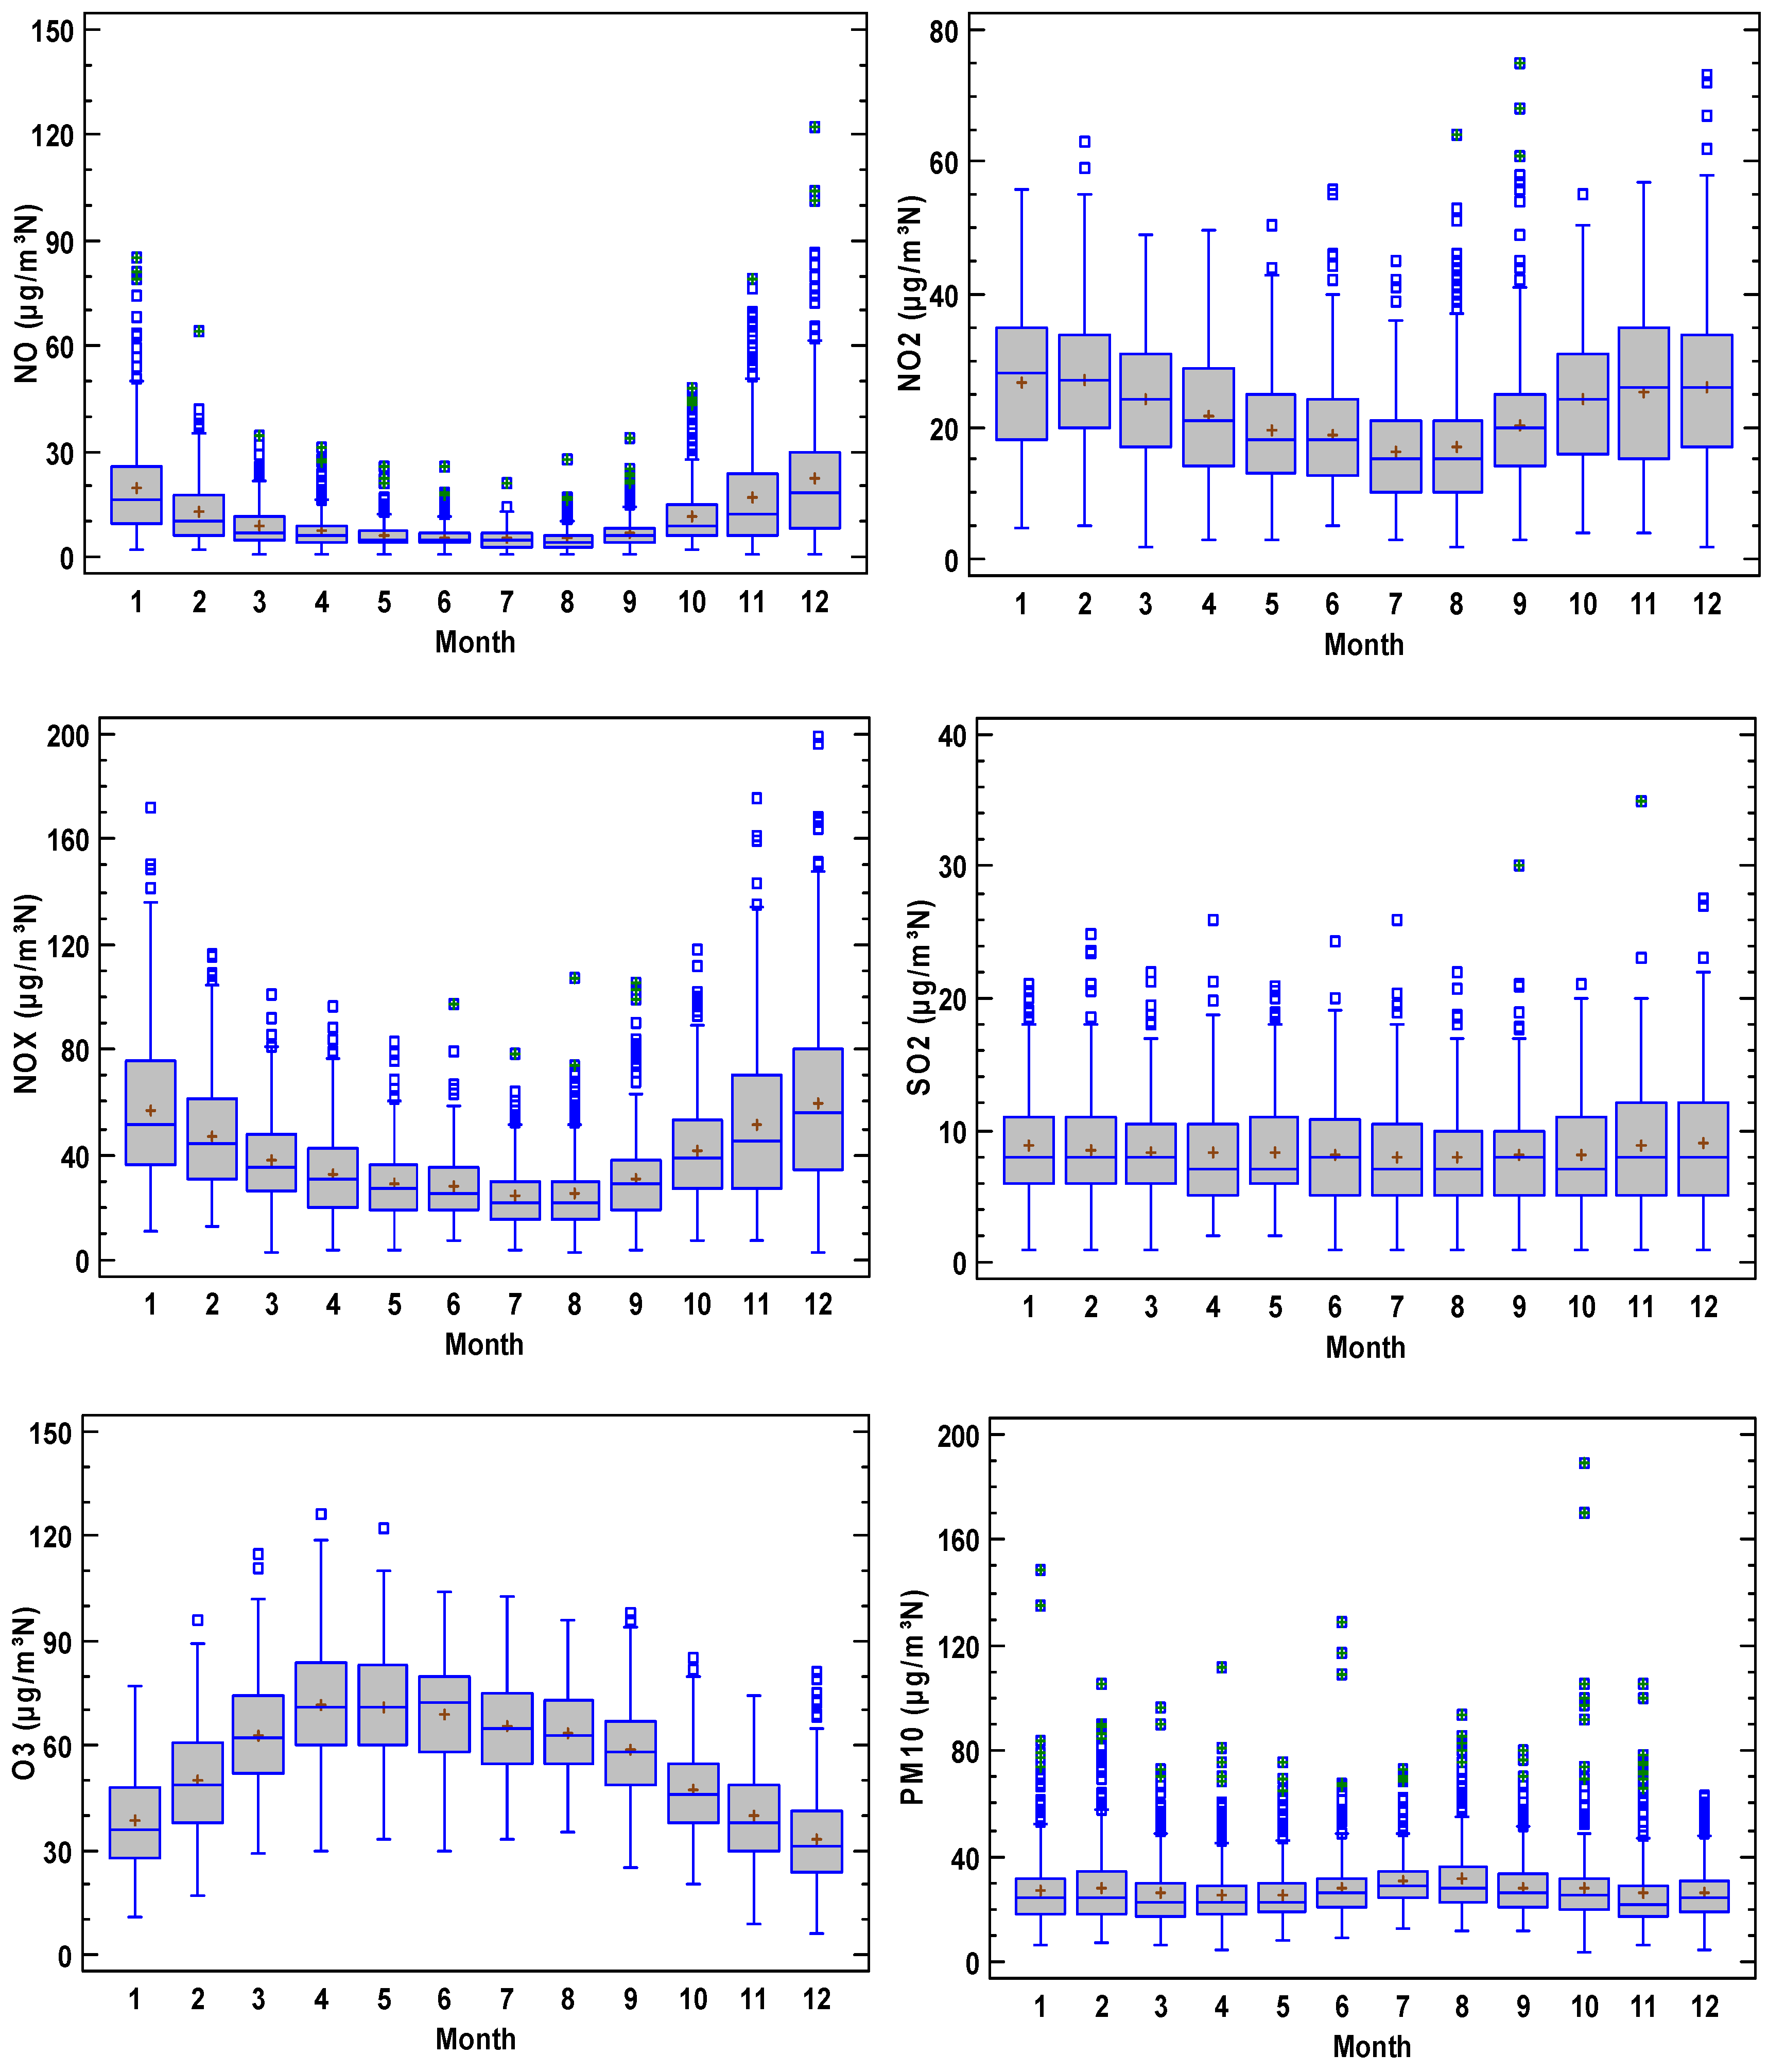
The annual cycle is presented in Figure 4. The evolution shows high values of nitrogen oxides in autumn–winter and low values in summer. Moreover, the interquartile range presents a similar evolution for NO, with a noticeable contrast between summer and winter. However, this contrast is smoother for NO2. Additionally, outliers for high concentrations are observed throughout the year for NO, although they are limited mainly to summer for NO2. The opposite evolution is observed for O3 since the highest values are obtained in spring, followed by a slight decrease until the lowest values, which were found in winter. SO2 and PM10 remained steady during the annual cycle, with outliers being more frequent for PM10.
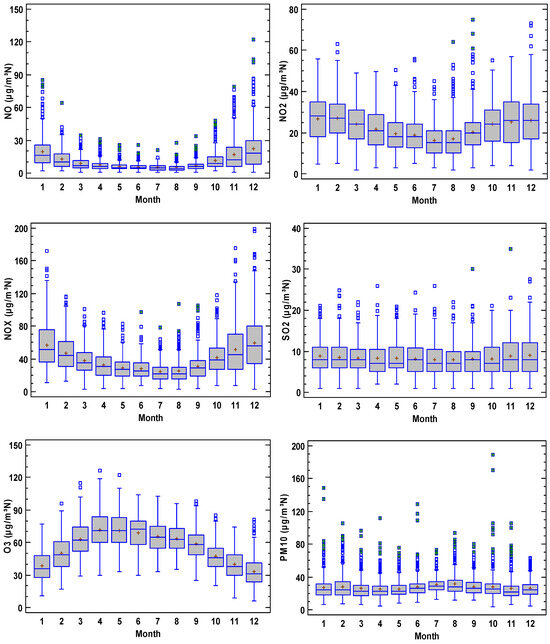
Figure 4.
Annual cycle of the pollutants analysed in the current study.
Jang et al. [44] analysed the concentrations of six pollutants at four sites (traffic, urban background, commercial and rural background) in Busan—the second largest city in South Korea. The annual cycle of mean concentrations for nitrogen oxides is mainly evidenced through traffic concentrations—especially for NO—whose highest values were obtained in winter. The difference when compared to the other stations is lower for NO2, whose lowest values were observed in summer. O3 annual evolution was slightly higher at the rural background site, and is reflected by two minima—one in summer and another in winter– and by maxima in spring and autumn. The annual cycle was weak for PM10, with values slightly higher in spring, and quite similar for all the stations.
Lee et al. [45] examined air quality in Seoul, South Korea, with three types of monitoring stations: roadside, urban and background stations. The period covered from 2018 to 2021. O3 and PM10 presented an annual defined cycle with maxima in summer and minima in winter for O3, and the opposite for PM10. However, the annual cycle was only observed for NO2 at urban stations where concentration oscillations were quite frequent, with the cycle not being as pronounced as for O3 and PM10. NO2 minima were reached in summer, and maxima were recorded at the beginning and end of the year.
Detailed annual evolution is introduced as Supplementary Material. These plots present specific features, such as major dispersions in specific months or annual evolutions outside those presented in Figure 4, analysis of which lies outside the scope of this paper since our purpose focuses on a shorter period in order to consider the impact of the lockdown on air pollutant concentrations.
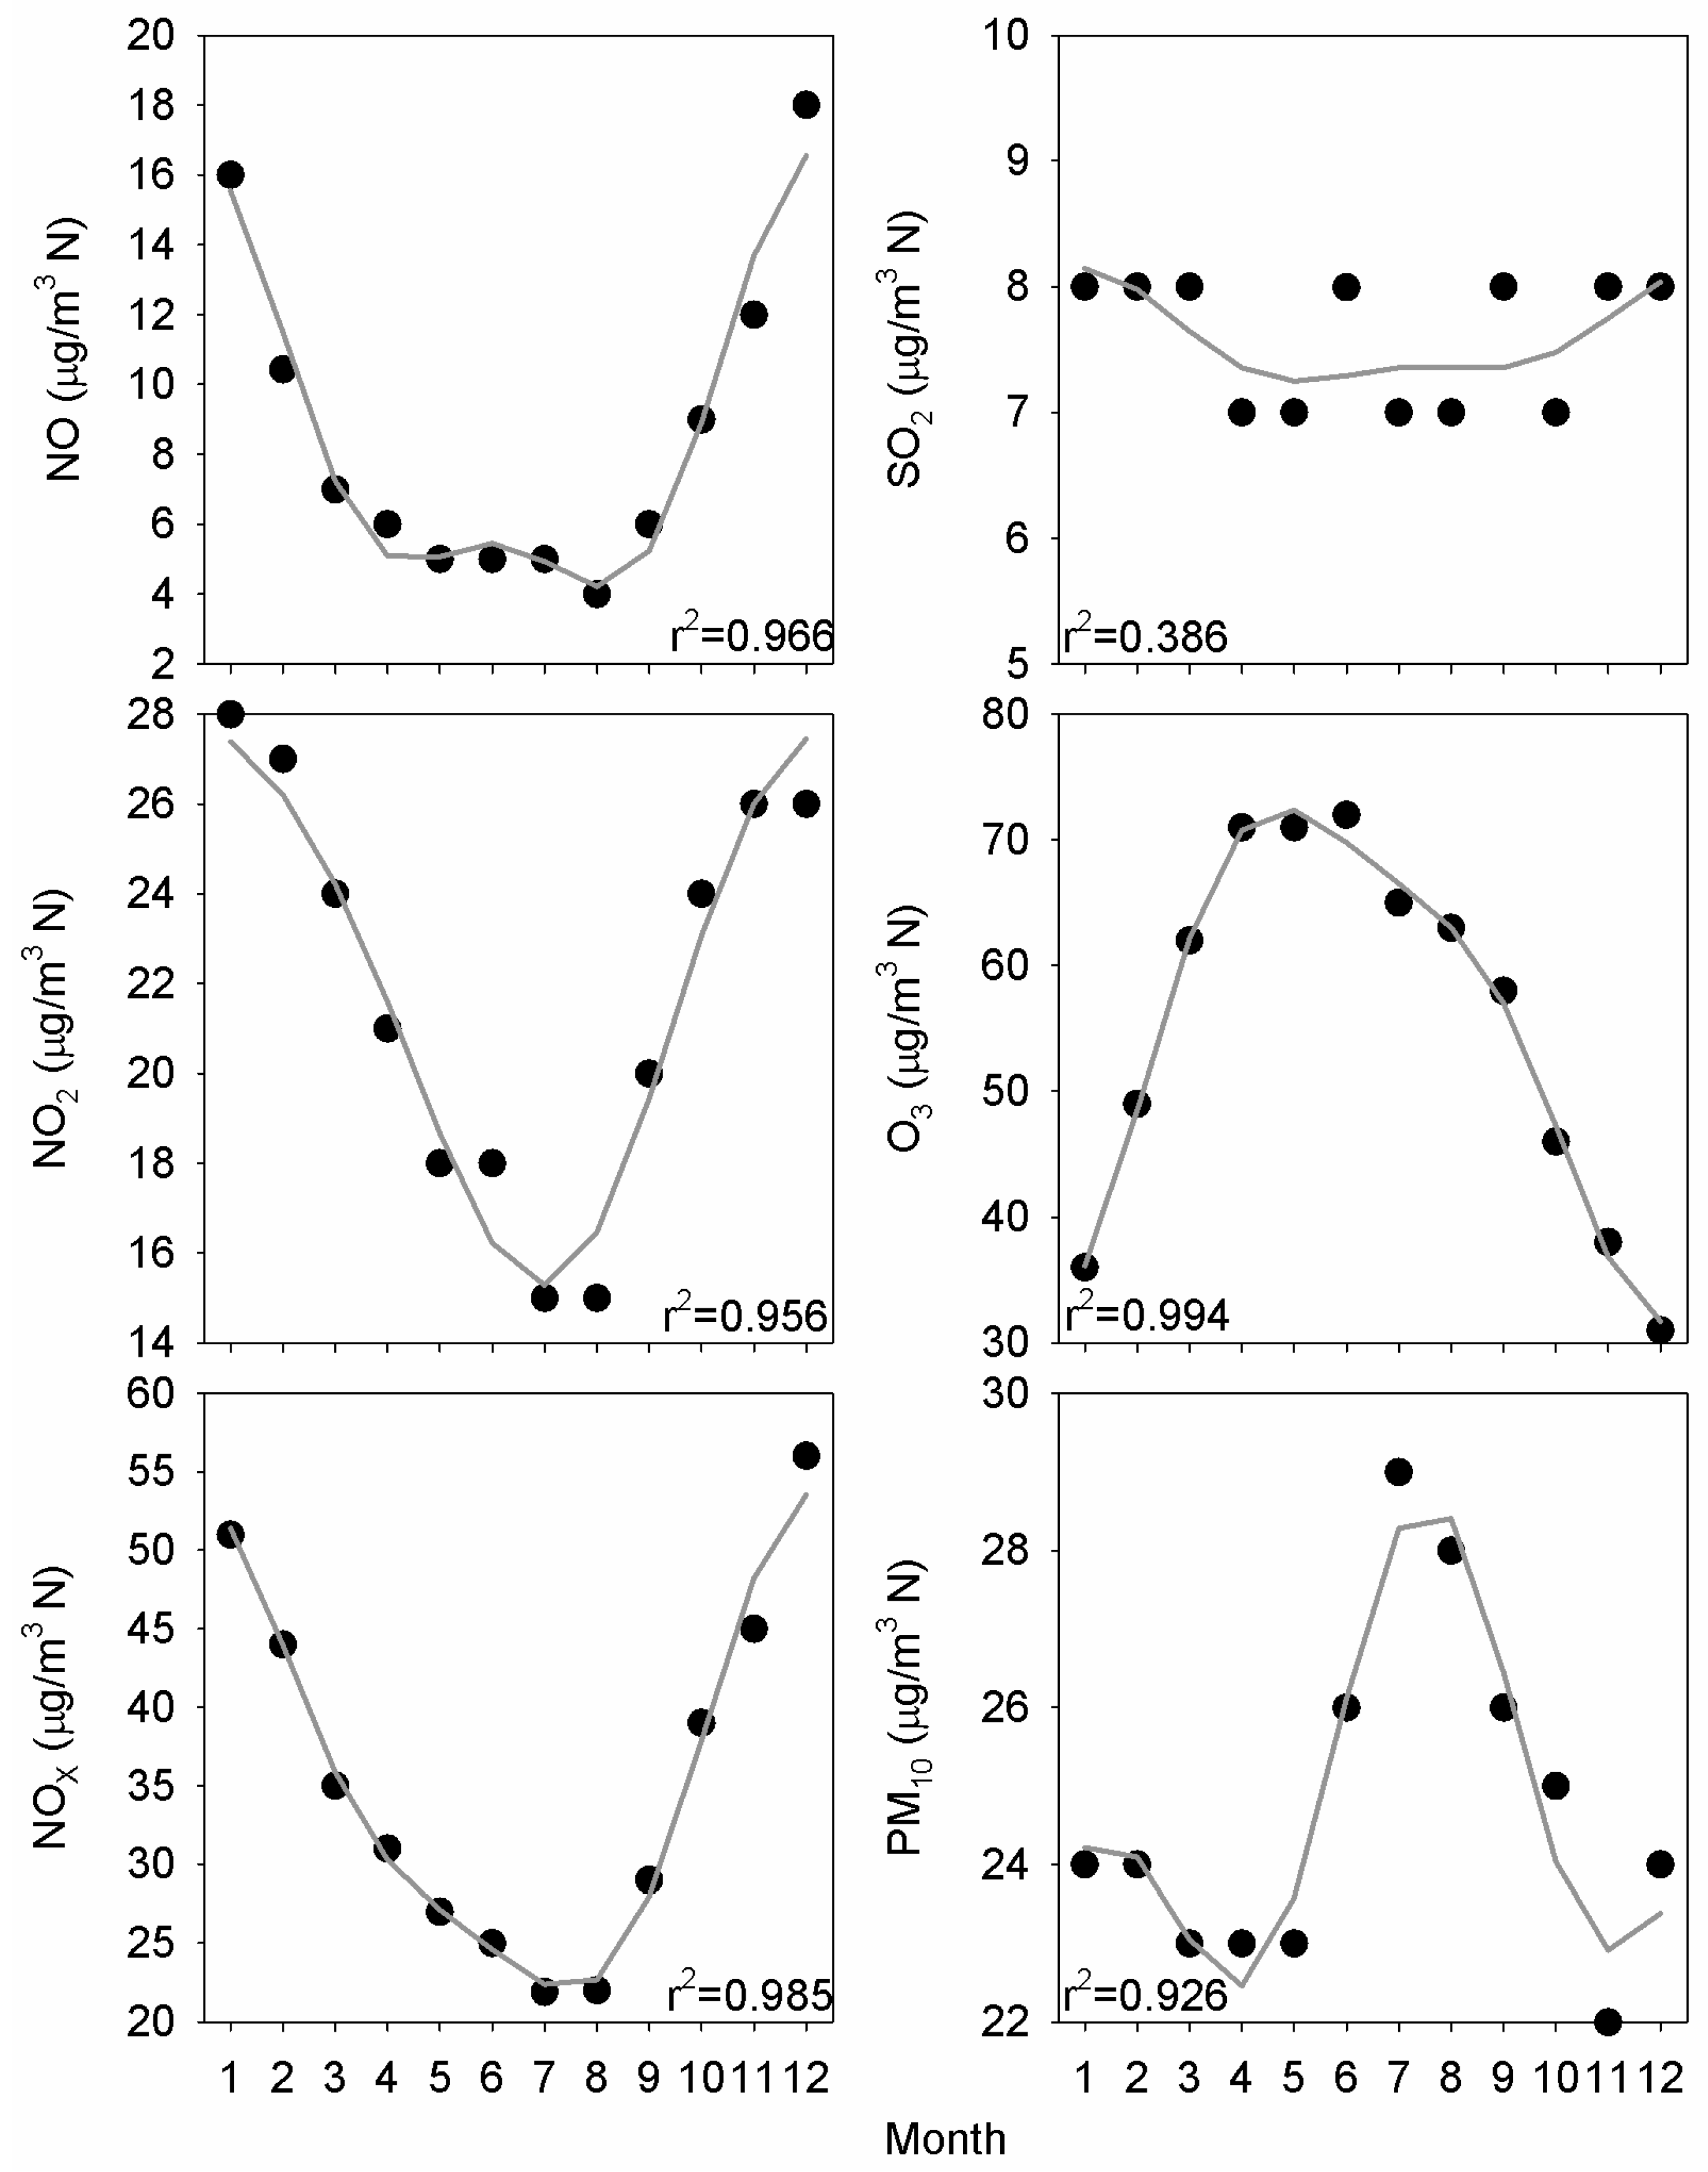
Figure 5 presents the monthly medians together with their fit with the harmonic function presented in Equation (1). Cycles are well defined, and minima are reached in summer for nitrogen oxides. However, a noticeable difference between NO and NO2 is observed since the extension of low values is longer for NO than for NO2—about four months for NO against only two months for NO2—whereas the opposite behaviour is seen for high concentrations. The highest NO values were reached in two months, but during four months for NO2. NOX evolution presents an intermediate shape since the concentration decrease in the first half of the year is slow, whereas the increase in concentration is rapid in the second half of the year. This evolution is closely related with the O3 cycle since its highest concentrations are reached in the period April–June, at the beginning of the NO low concentrations. The concentration range is wide for these four pollutants. However, a narrower range is observed for PM10, whose high concentrations are limited to summer. Agreements obtained with the harmonic function are satisfactory and reveal the suitability of such an equation to describe this cycle. Analysis of the harmonic amplitude indicates that the NO2 cycle follows a periodic annual pattern, which is quite noticeable. However, the contribution of the half-annual pattern is not negligible for NO and PM10. SO2 presents a nearly flat evolution, perhaps as a result of its industrial origin.
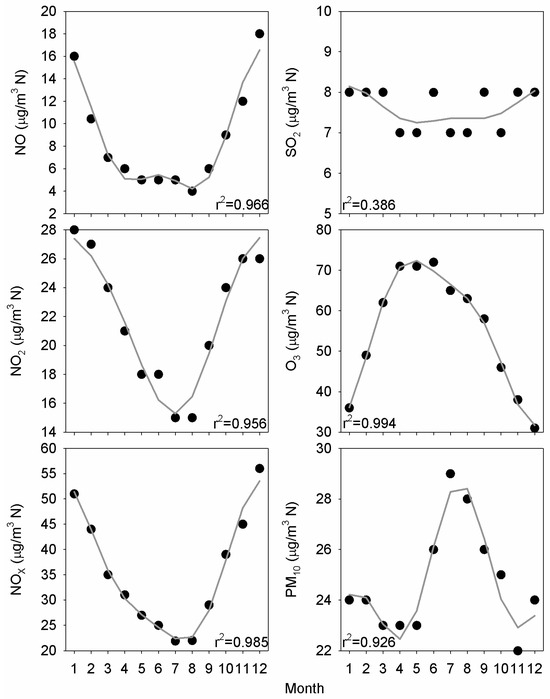
Figure 5.
Median annual cycle fitted with the harmonic function from Equation (1).
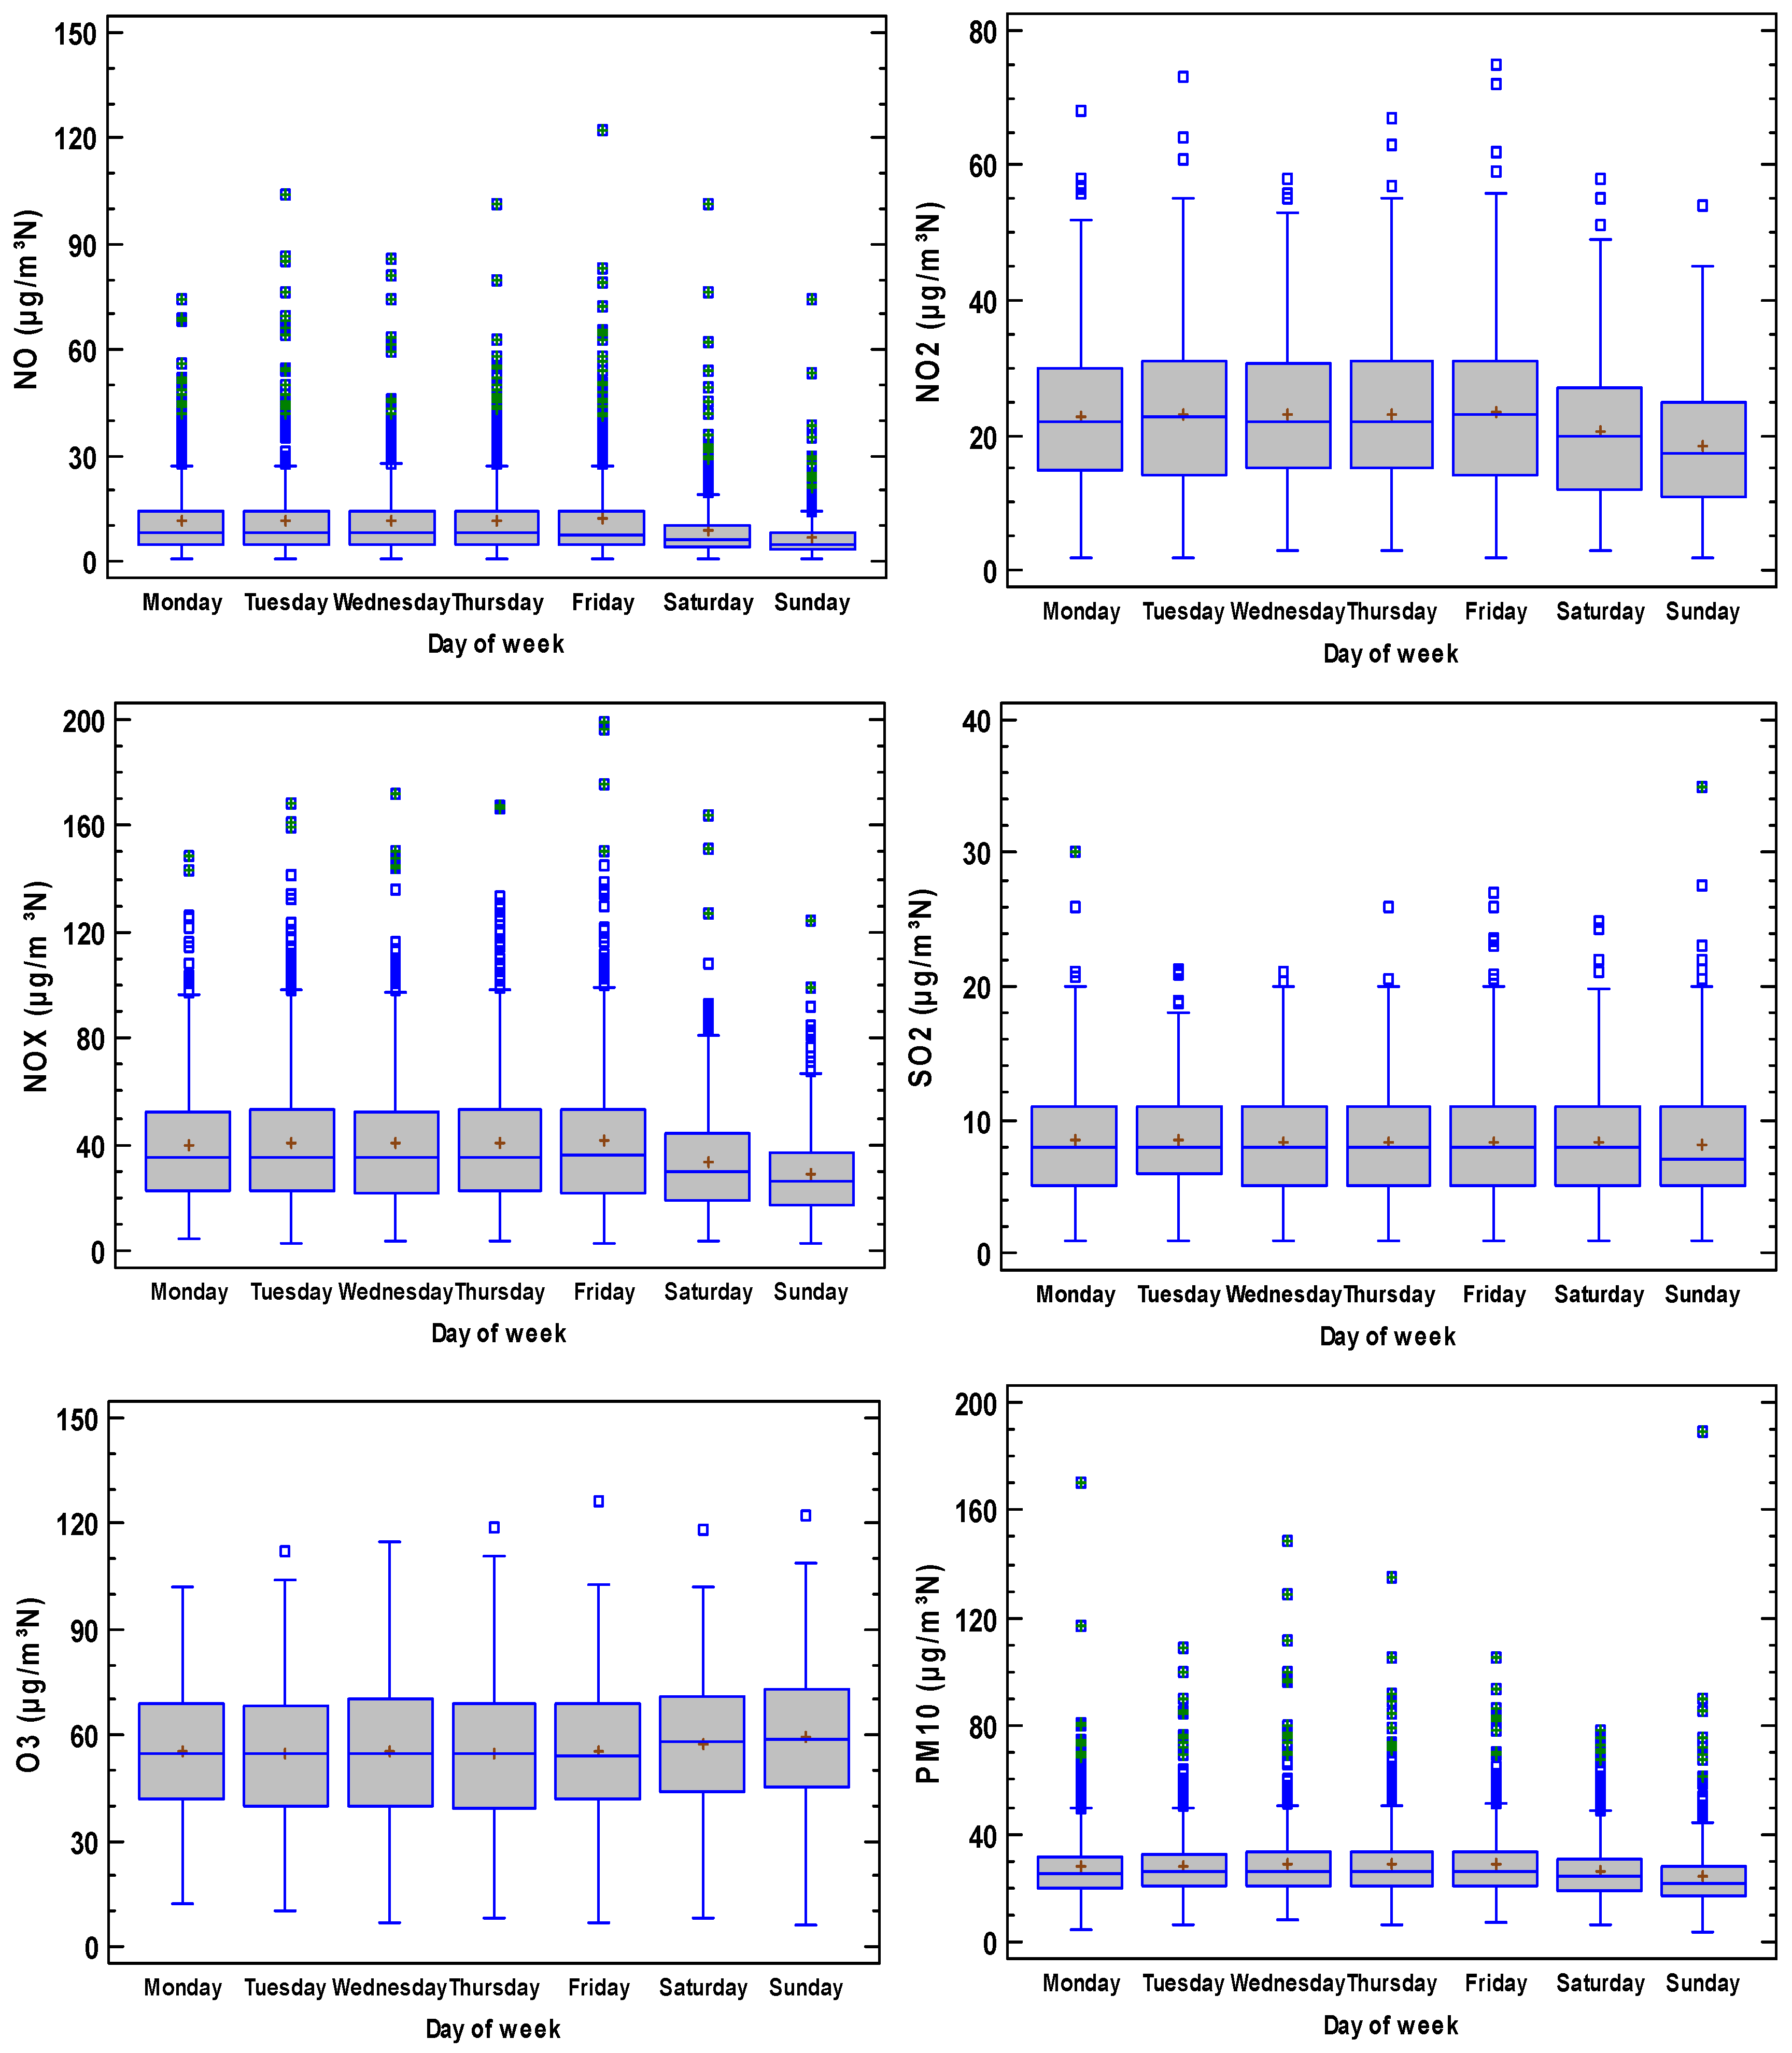
Figure 6 presents the weekly cycle, which is observed for all the pollutants, except for SO2. Concentrations decrease on Saturdays and Sundays for nitrogen oxides and PM10. However, they increase for O3 due to the link between precursors, such as nitrogen oxides, and this secondary pollutant. For SO2, the mean is similar throughout the week, although the median decreased on Sunday. As a result of this weekly pattern, traffic is seen to be the main source of pollutants.
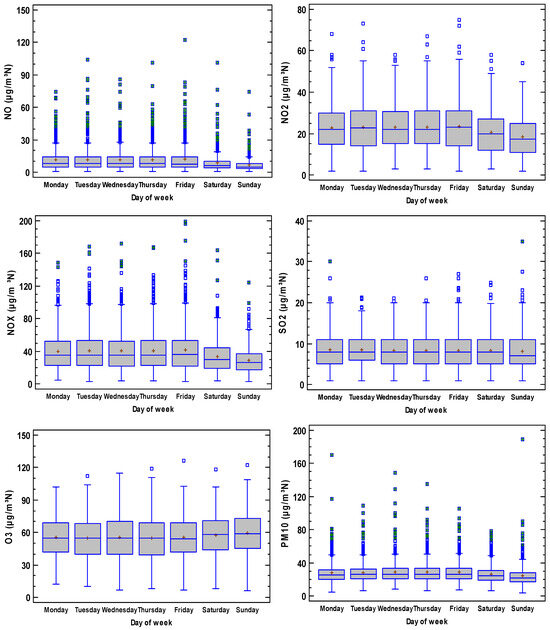
Figure 6.
Weekly cycle of pollutants considered in the current analysis.
Xiong et al. [46] analysed urban pollution in Chengdu, China. They observed a weekly pattern where NO2 concentration decreased at the weekend, although PM10 increased. He [47] studied this weekly cycle effect in some Chinese cities for six pollutants: O3, NO2, SO2, CO, PM10 and PM2.5, and found no weekly pattern for CO. This pattern was either not observed or was extremely weak for SO2.
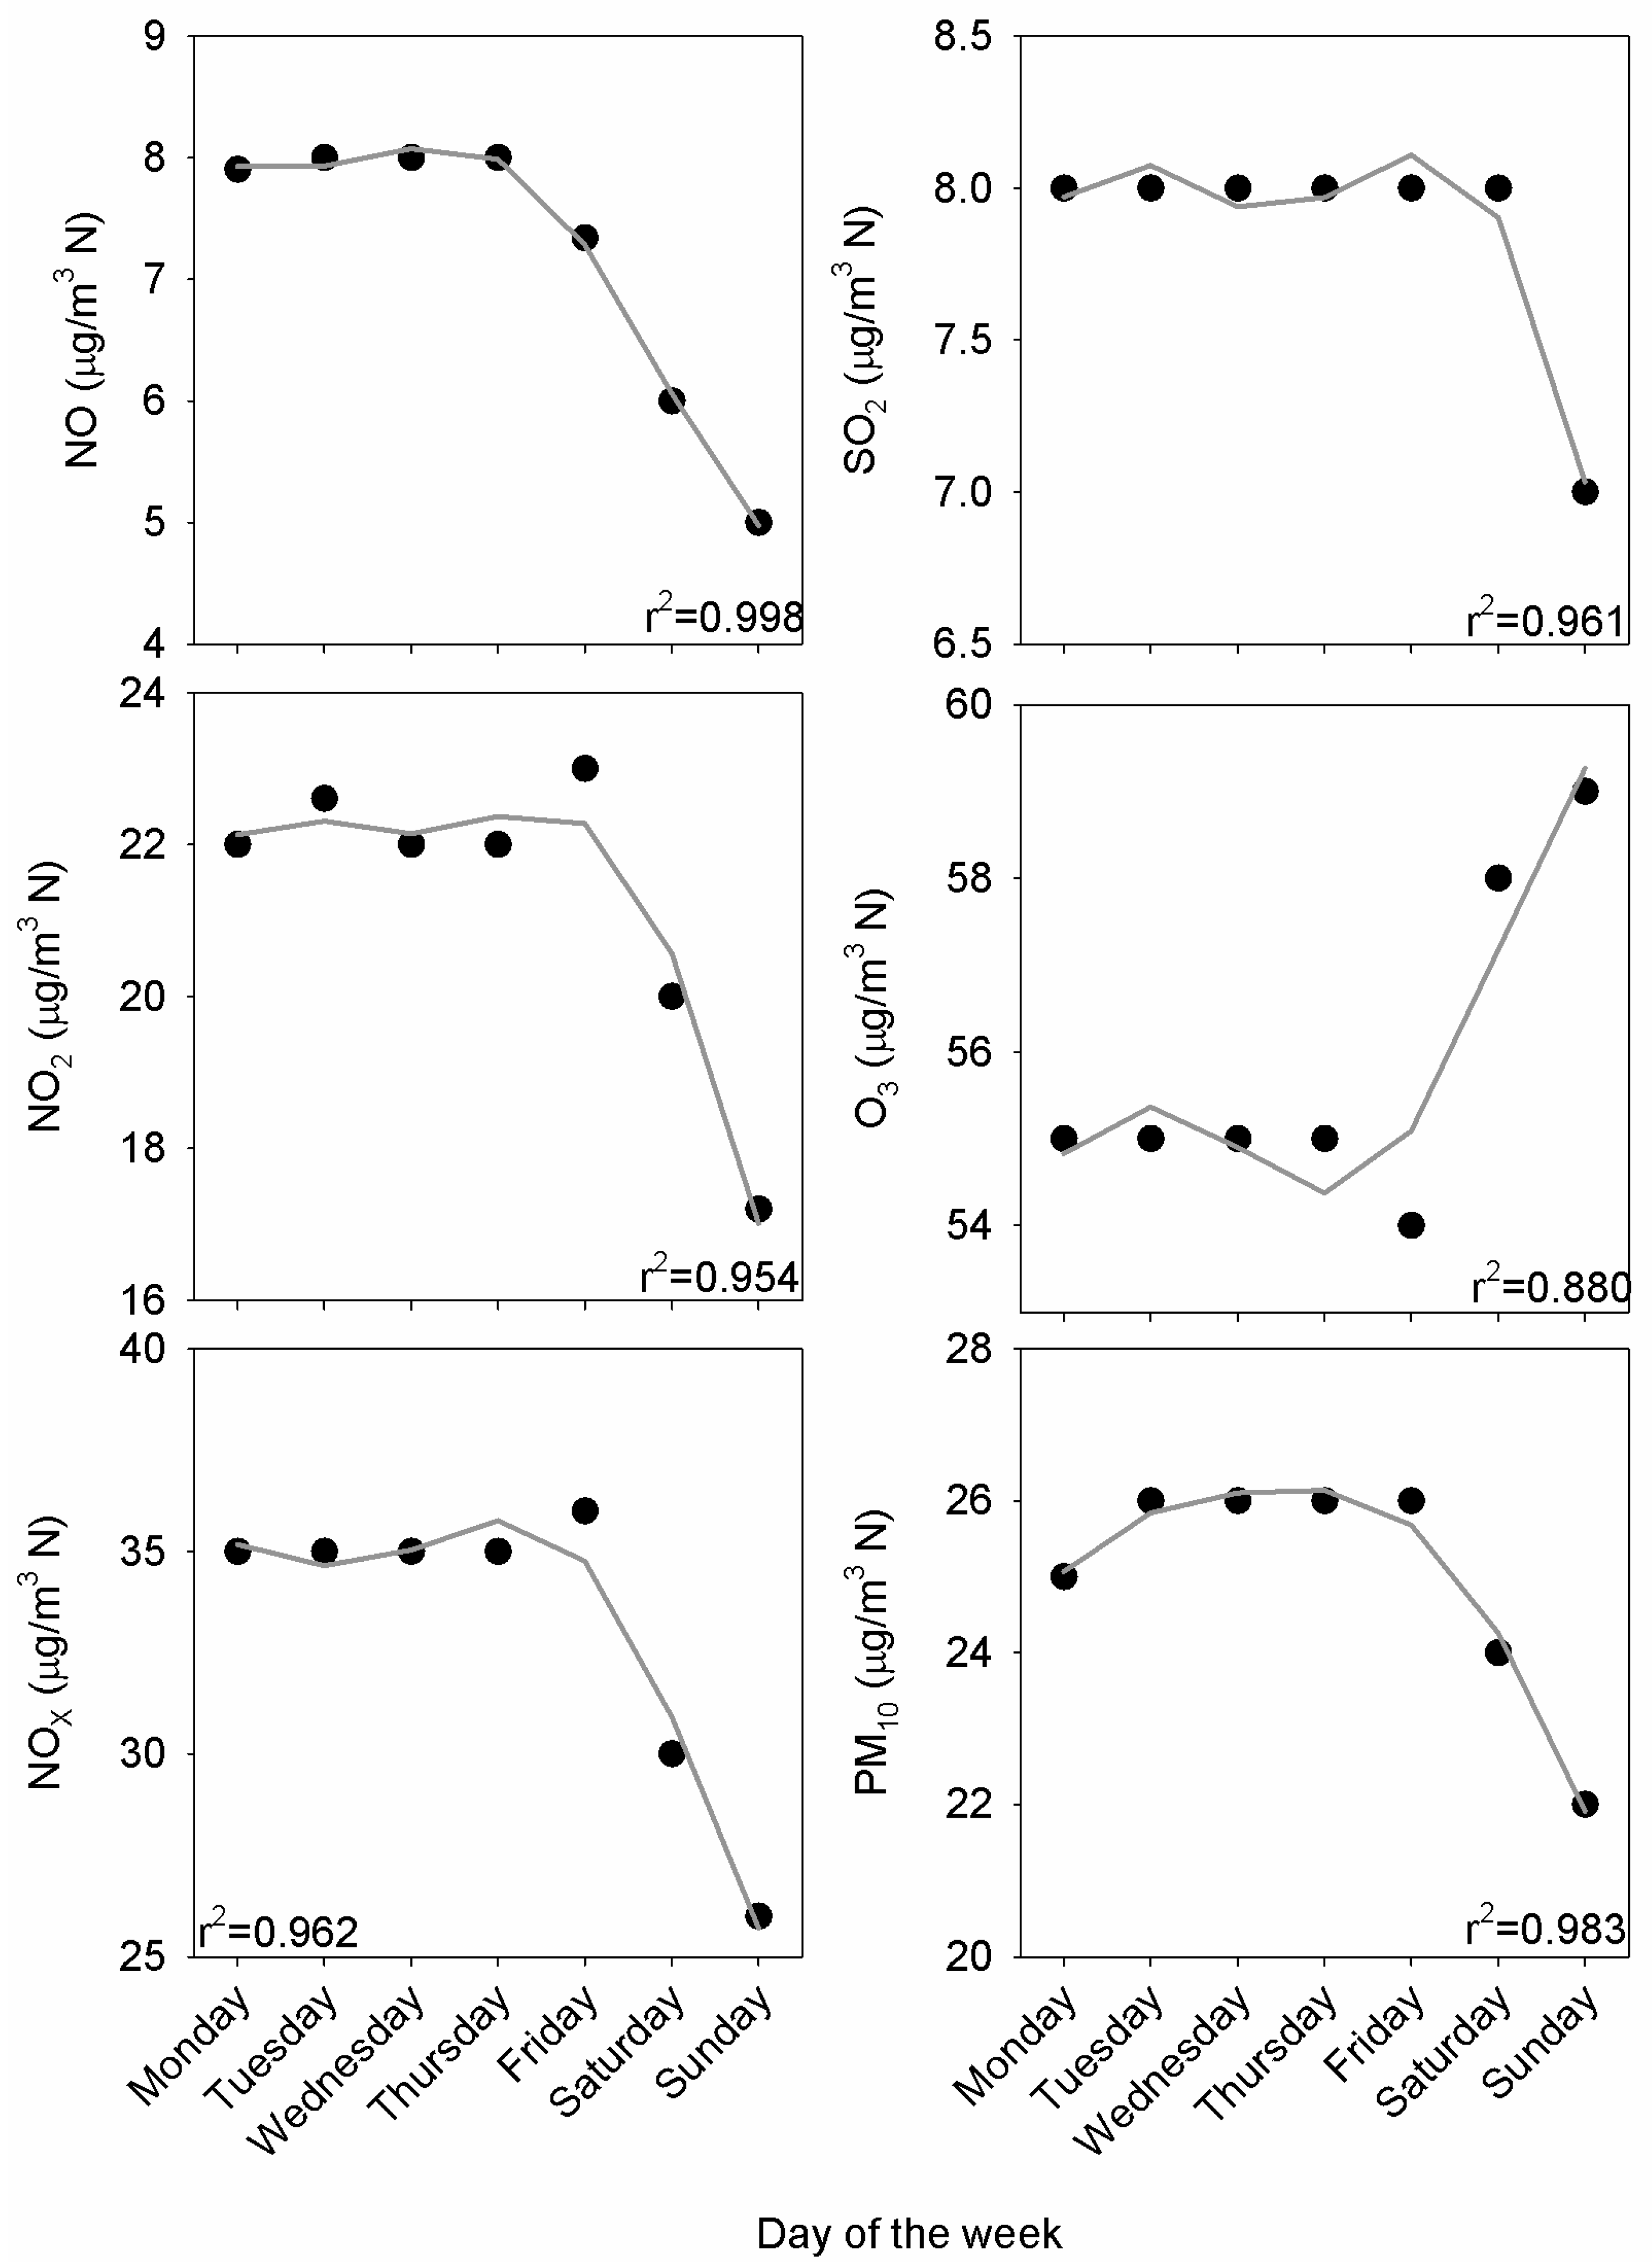
Figure 7 shows the weekly pattern for the median concentrations. Contrasting values for Saturdays and Sundays stand out, except for SO2, which presented slightly lower concentrations on Sunday. The harmonic model response was satisfactory from the coefficient of determination presented in plots. The half-period cycle was noticeable for O3, and was much lower for PM10, since the amplitude relationship between a1 and a2 in Equation (1) was 1.4 and 4.8, respectively, with this relationship being around 2.5 for the remaining pollutants. This result indicates a weekly pattern for PM10 but oscillations in the period formed by working days for the remaining pollutants. These oscillations may be spurious results of the model, for instance, for SO2.
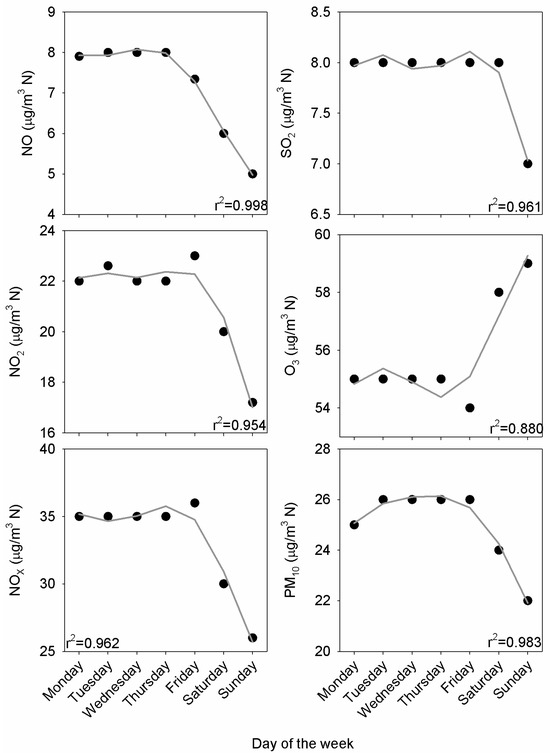
Figure 7.
Median weekly cycle together with the harmonic fit from Equation (1).
3.2. The Impact of the Lockdown
3.2.1. The Concentration Series around the Lockdown Period
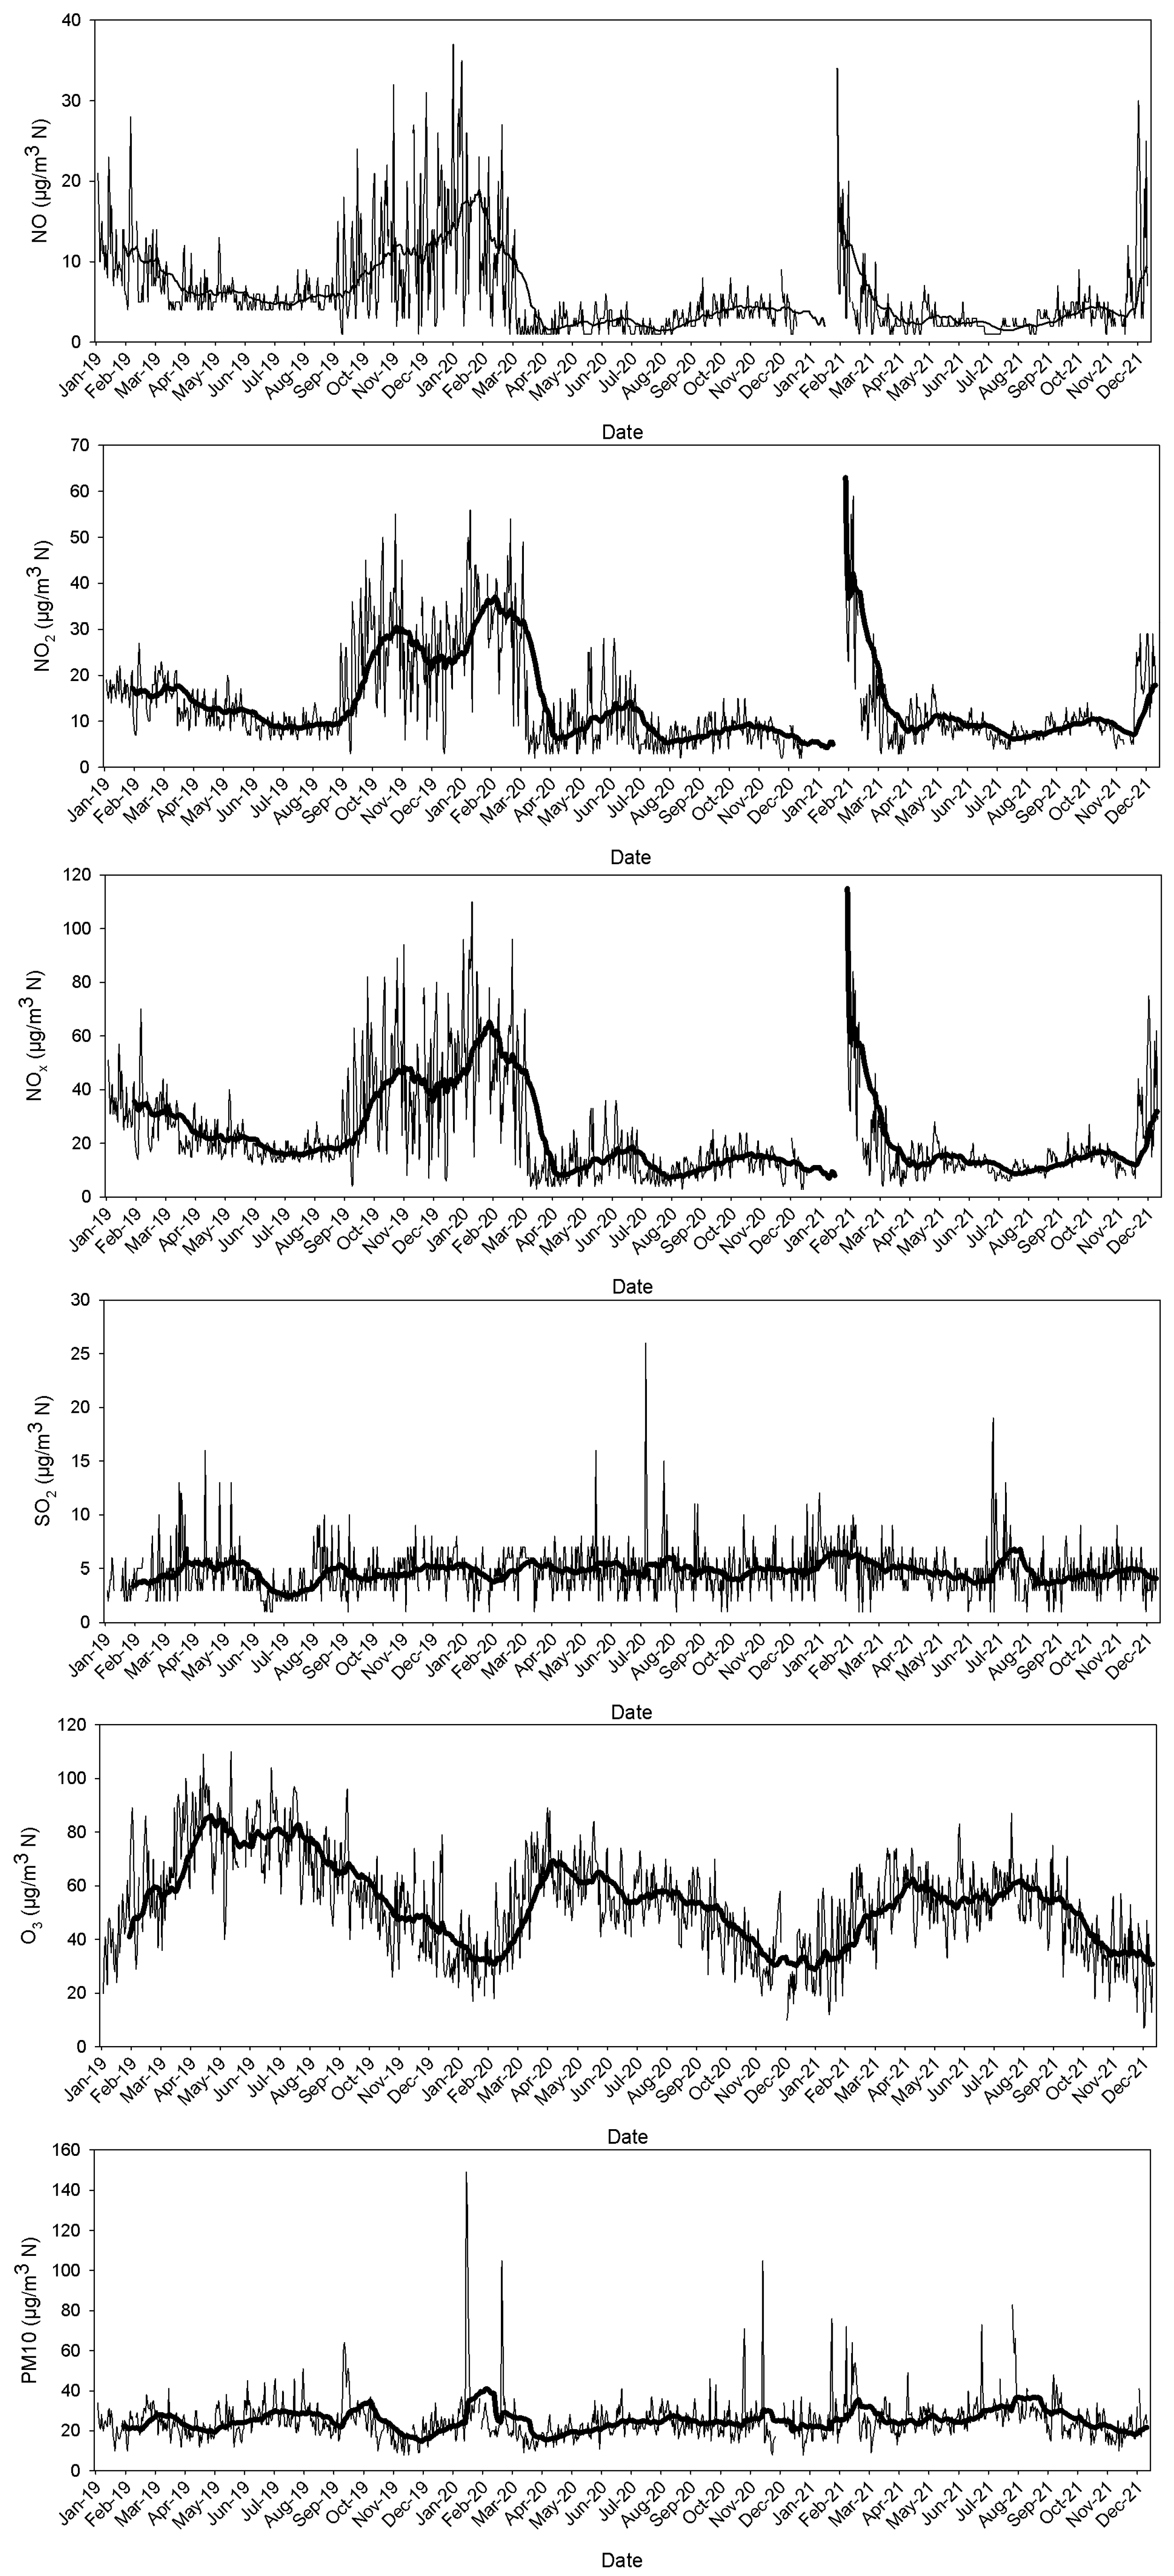
Figure 8 presents the evolution of the daily values in the period 2019–2021. The regional government indicated that the air quality was good in this period [48]. Large values were observed for nitrogen oxides until mid-March—when the lockdown began—and when vehicle and cruise ship traffic was halted. After that, a slow and small increase in NO2 concentrations was seen, which may be attributed to the relaxation measures introduced. This evolution was not observed for NO, with concentrations remaining steady during the rest of the year. The concentration gap at the end of the year was attributed to technical problems with the measurement device. A similar result was obtained by Song et al. [49] in Central China, where the change in NO was not observed, although this change was observed for NO2. Luo et al. [50] observed a sharp drop in NO2 tropospheric vertical column density over China between late January and October 2020, although a rebound effect did appear at the end of the year as a result of the rapid recovery of the economy.
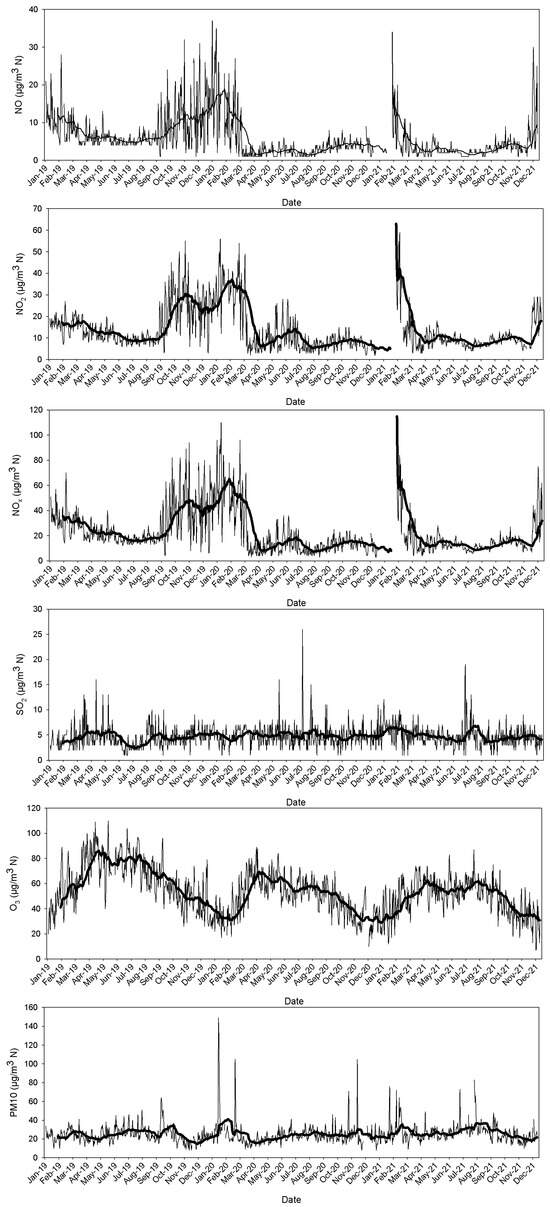
Figure 8.
Daily values and moving average in the period pre- and post-pandemic, 2019–2021.
In 2020, O3 presented a cycle which is comparable to that of 2019, although the contrast between spring and summer was smoother, perhaps due to the lower concentrations of nitrogen oxides. The annual cycle in 2021 was also very slight. Yilmaz et al. [51] analysed CO, NO2, O3, PM10 and SO2 concentrations at Erzurum, a city in eastern Turkey known for its cold weather. The authors considered three periods: pre-COVID-19, COVID-19 and post-COVID-19. The results indicated a general decrease in concentrations during the COVID-19 pandemic, except for O3, which rose by 16.9%. Putaud et al. [52] studied the impact of lockdown on air pollution across Europe and observed a decrease in NO2 and an increase in O3 concentrations at some sites, which was attributed to the greater oxidizing capacity of the atmosphere.
Minimum PM10 mean concentrations were reached in April 2020. In fact, concentrations were low during the lockdown (from 15 March to 21 June), with low values and small variations, although the impact of the lockdown was very slight. PM10 evolution during the COVID-19 pandemic was studied at Gijón, another coastal city, located in northern Spain [53]. The study showed an increase in these concentrations at the height of the lockdown when the most severe restrictions were imposed, with the increase being attributed to a rise in secondary aerosol species. This unexpected result was linked to concrete meteorological conditions that determined secondary aerosol formation from gaseous precursors.
SO2 proved to be fairly insensitive to the lockdown period since its concentrations remained steady during 2020. Consequently, these concentrations were not affected by the lockdown at all. Kumar and Dwivedi [54] studied the evolution of four pollutants (PM2.5, PM10, NOx and SOx) at Lucknow, India, around the festival of Diwali. They considered the period 2019–2022 and monitored pollutants three days pre-Diwali, three days post-Diwali and on Diwali day. Although maxima are reached on this day, the values for 2020 were the lowest, with those for 2021 and 2022 being even lower than for 2019. Only SOx behaved differently, with the greatest contrast between the concentrations, which were the highest on the Diwali day in 2019 and nearly the lowest at the beginning and end of the period analysed.
The impact of the pandemic has been described at a number of different sites. Shaygan and Mokarram [55] presented the evolution of air pollution at six cities in Iran from November 2018 to August 2021. A noticeable change is observed in 2020 with a decrease in air pollution followed by a slow increase. Li et al. [56] considered 11 coastal provinces in China and analysed the COVID-19 pandemic’s impact on air pollution and the marine economy using data from the period 2016–2021. They concluded that the pandemic had a negative impact on the marine economy but a positive impact on air pollution.
3.2.2. The Lockdown Period
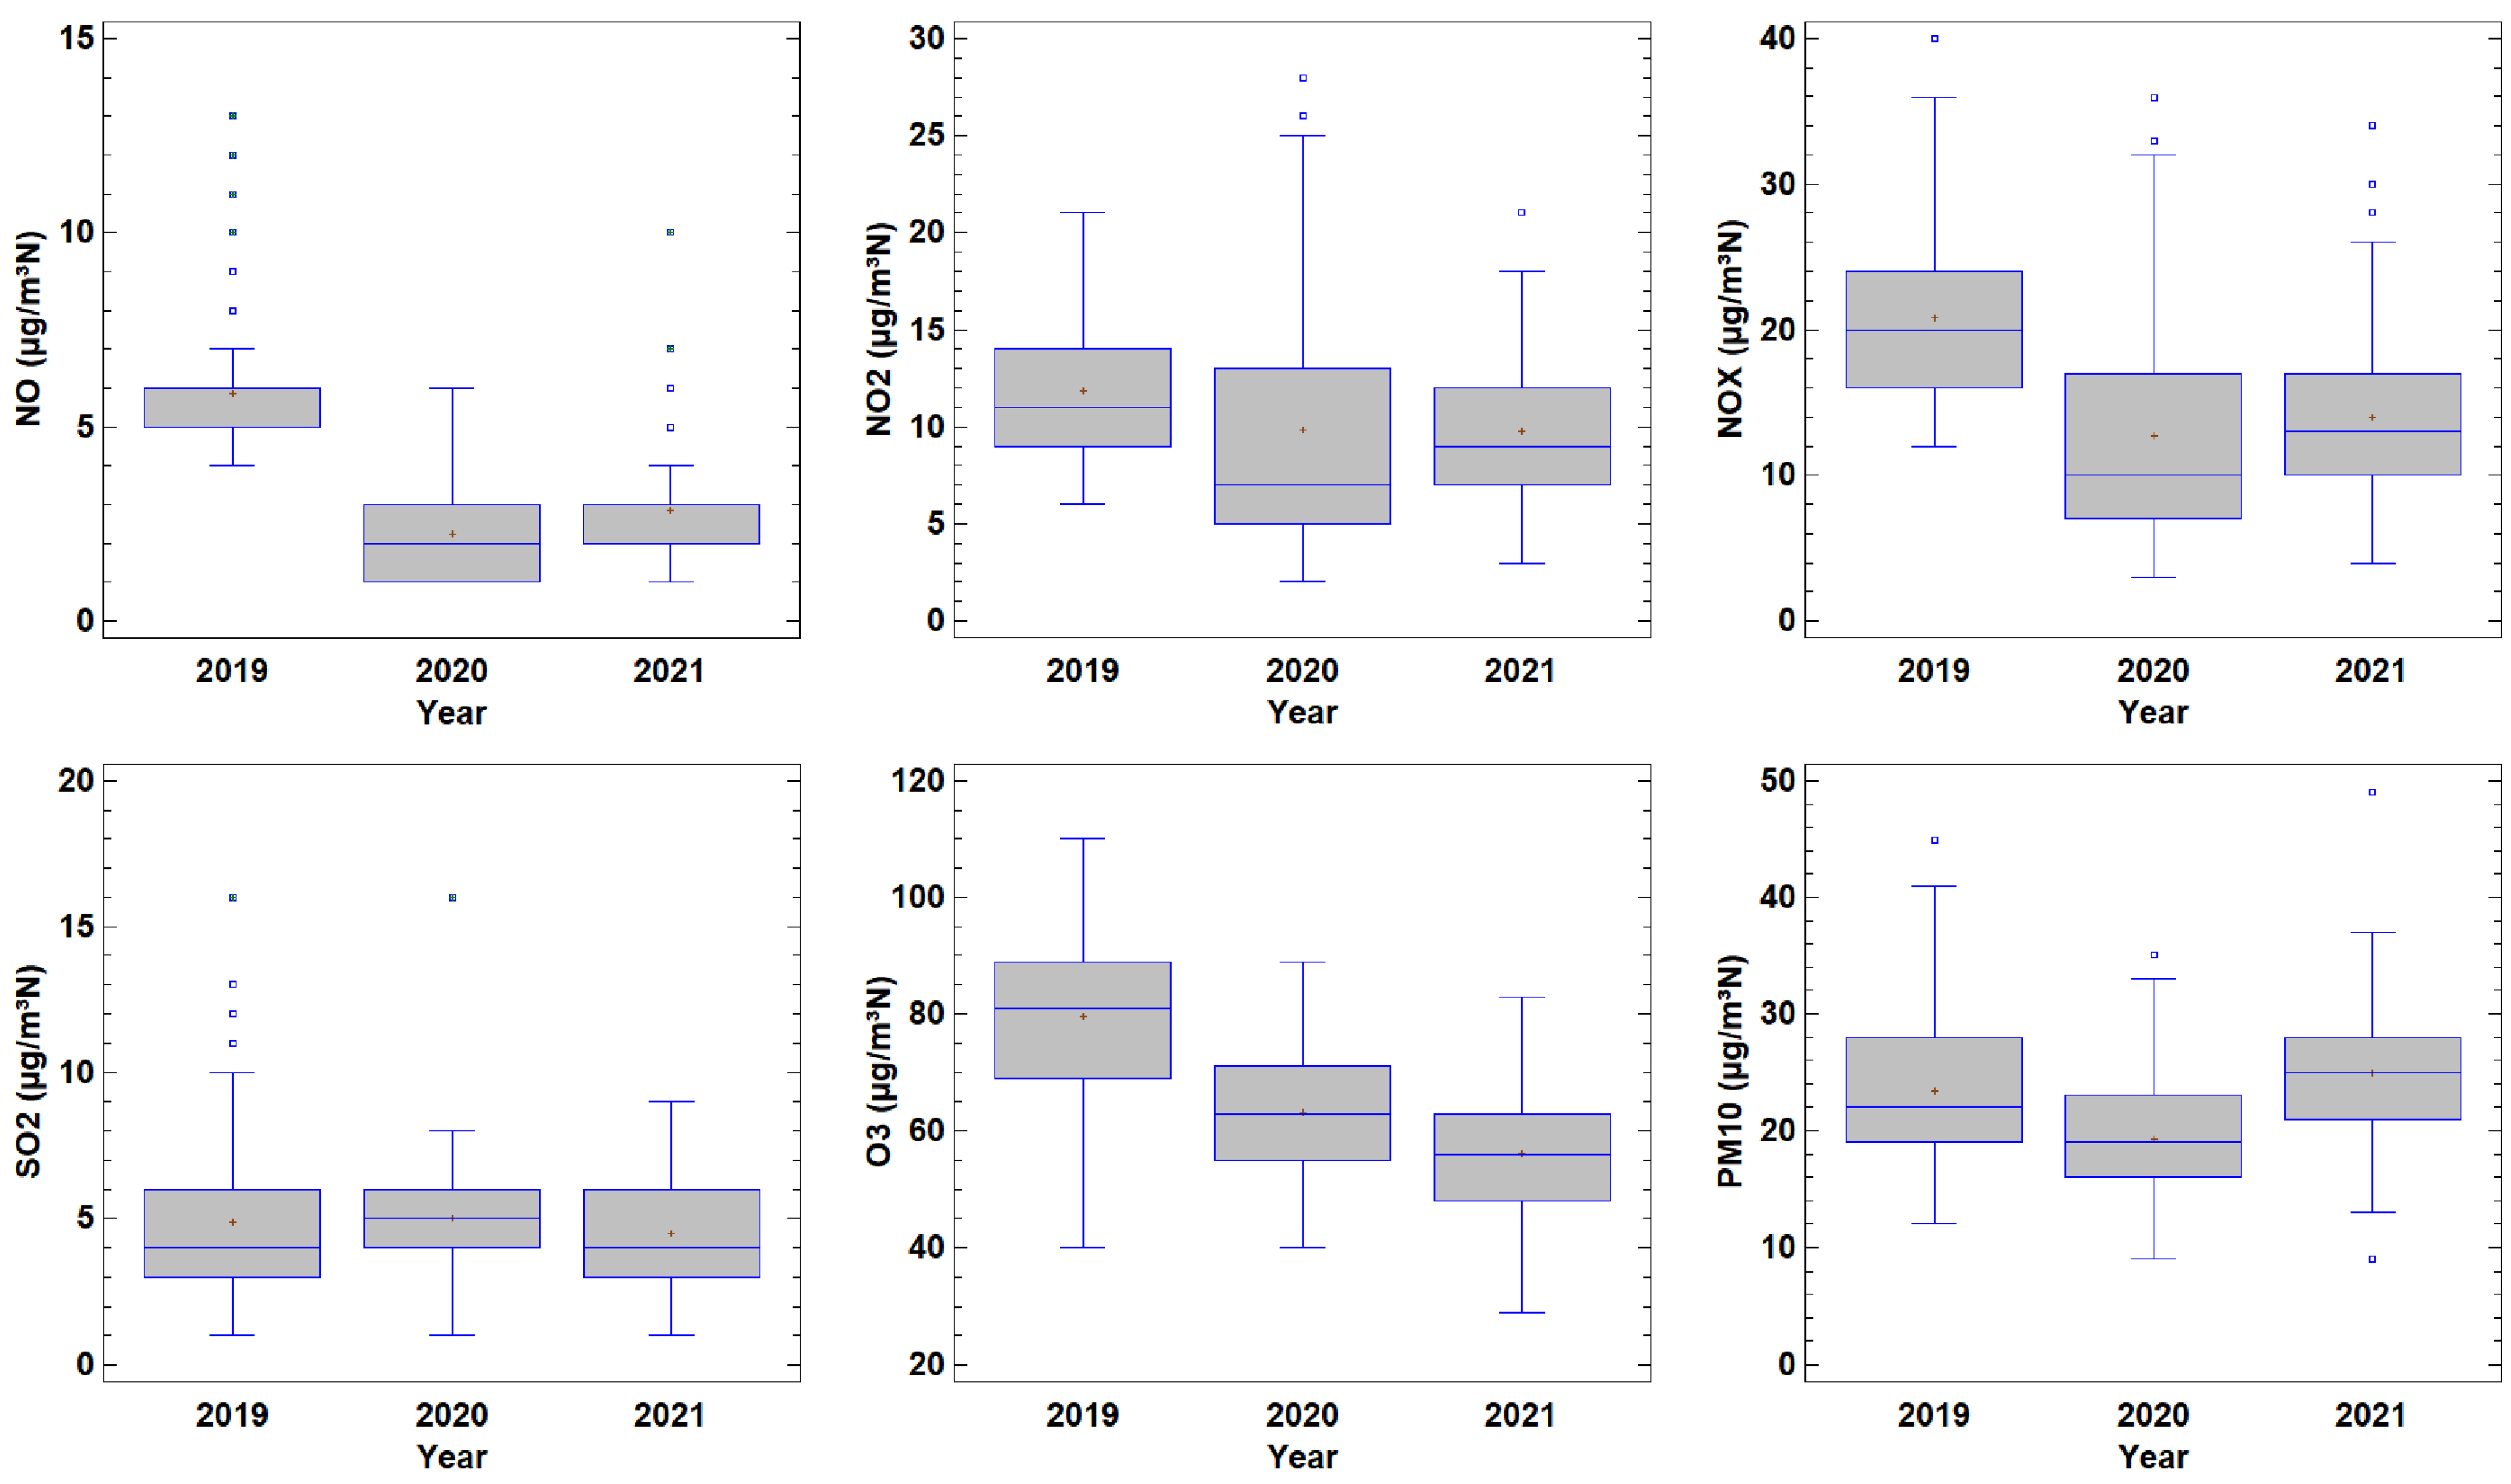
Most analyses are focused on the period just before and after the lockdown. The procedure followed in this study considers the lockdown period, although in different years. The aim is to obtain more robust results than those that may be affected by the seasonal evolution. However, annual changes may contaminate the results. Figure 9 presents the box and whisker plot for the period 15 March–21 June, which was the lockdown period in 2020 in Spain. The contrast between the values before, during and after the pandemic may be qualitatively observed by medians or means. Concentrations were highest in 2019 for most pollutants, such as NO, NO2, NOX and O3. This result indicates that the pollution levels after the pandemic had not recovered. Only PM10 in 2021 reached pre-pandemic levels. SO2 concentrations remained steady and were not affected by the mobility restriction measures. Moreover, the position of the median in the box reveals a nearly symmetrical distribution in 2020 for NO, SO2 and O3, whereas positive skewness is obtained for NO and SO2 in 2019 and 2021. Additionally, noticeable positive skewness is observed for NO2 and NOX in 2020 when compared to the other two years. The similar distribution of the two pollutants is justified since NO2 contribution in NOX is higher than that of NO. Negative skewness is observed for O3 in 2019. Quantitative determination of this contrast may be obtained with a multiple range test. Differences in the means between pairs of the three groups are statistically significant at 95% for NO and O3; i.e., concentrations for each year are different to those for the remaining years. However, differences in means are not statistically significant in two years for NO2, NOX and PM10; i.e., concentrations were comparable both during and after the lockdown for NO2, and NOX, whereas concentrations were similar before and after the lockdown for PM10. Only SO2 concentrations remained steady over the period investigated.
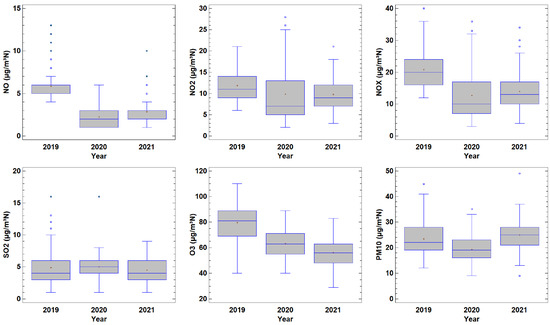
Figure 9.
Boxplot for the period 15 March–21 June in years before, during and after the pandemic.
Air pollutant concentrations are controlled not only by sources and sinks since atmospheric dispersion is conditioned by meteorological processes that cannot be controlled. Such is the case of O3, which is a secondary pollutant that has volatile organic compounds and nitrogen oxides as precursors. Figure 9 shows a concentration decrease linked with restrictions on traffic and tourism. Xu et al. [57] reported a noticeable decrease in black carbon concentrations following the lockdown period at Hangzhou City, in China, and Yuan et al. [58] quantified the decreases in the main air pollutants at the same site and over the same period. However, Li et al. [59] reported a noticeable O3 increase in the North China Plain, attributed to emission reduction, with a contribution of 54%, and meteorology, 46%, in particular by lower wind speed, together with regional transport. Lin et al. [60] reported a study with the results of the lockdown in China, where a decrease in SO2 is observed. However, their concentrations are much higher than those in this analysis, which might be background concentrations since the impact of the lockdown is not observed.
3.2.3. The Influence of the Lockdown on the Weekly Cycle
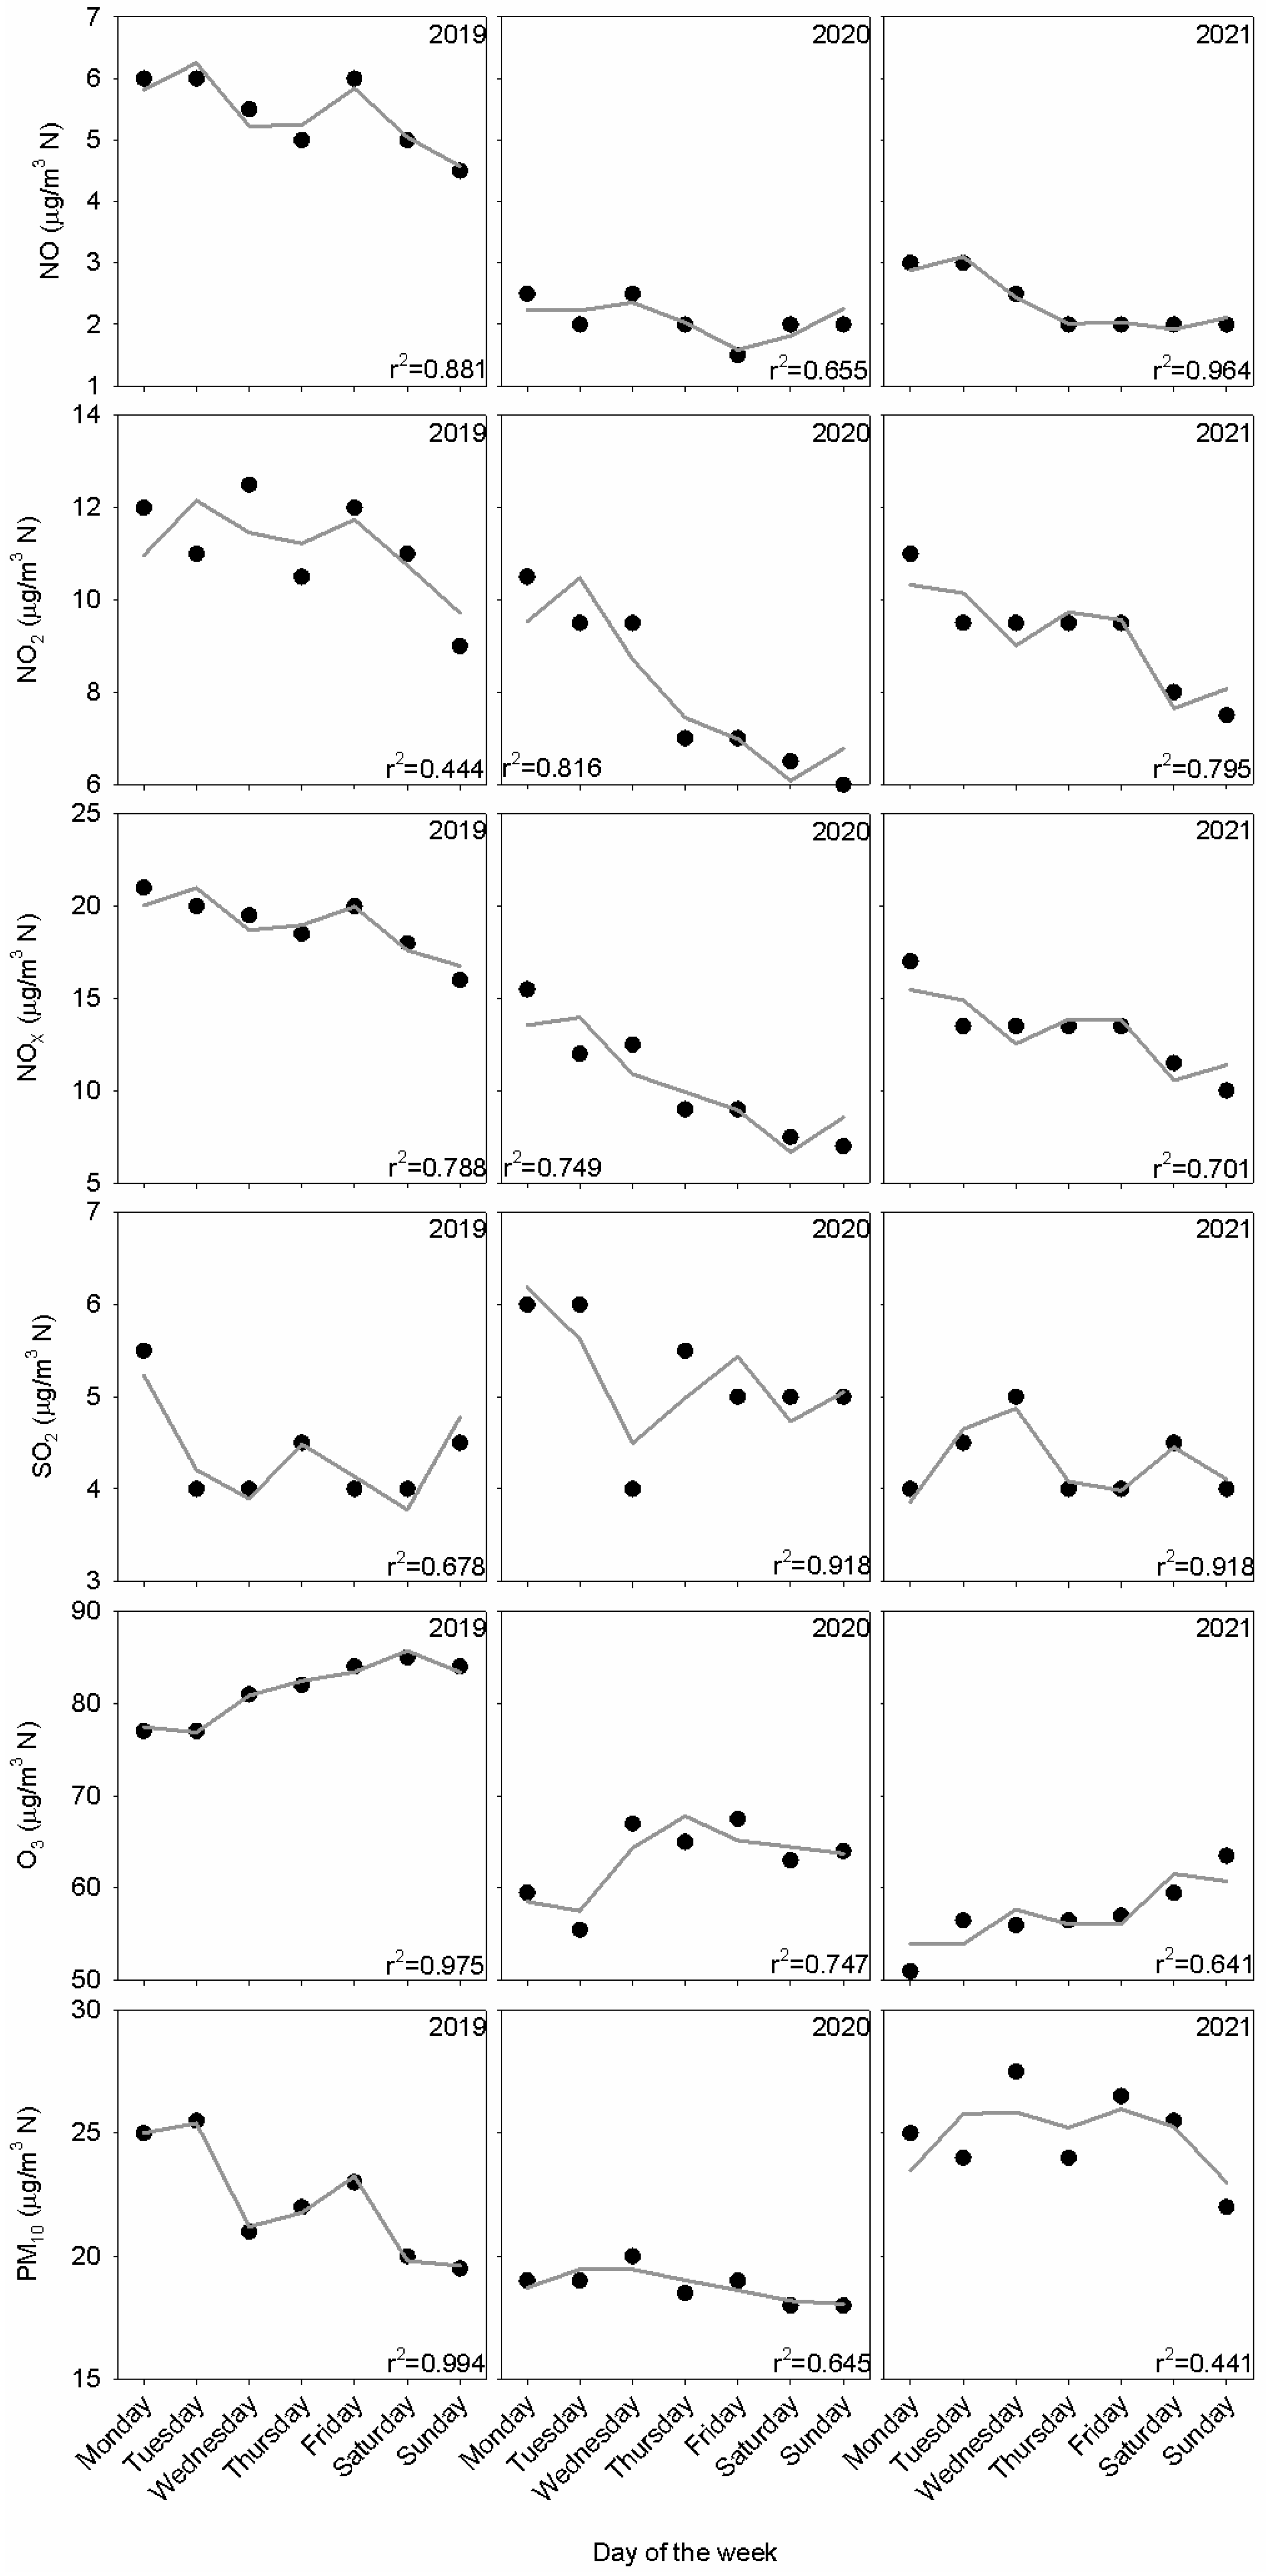
Figure 10 presents the median weekly cycle in the lockdown period and similar periods for the preceding and subsequent years. The contrast between working days and weekends is observed for nitrogen oxides and PM10 in 2019 since concentrations are higher on working days. O3 concentrations present an opposite evolution due to their relationship with precursors such as nitrogen oxides. SO2 presents a nearly flat evolution since it is weakly related with activities linked to weekly cycles. The lockdown determined a noticeable concentration decrease, although the weekly cycle was maintained in some pollutants by the contrast between concentrations at the beginning and the rest of the week. SO2 concentrations were not affected by the lockdown. Finally, level recovery in the same period during 2021 depends on the pollutant. The weekly cycle was similar to that before the lockdown for NO2 and PM10. However, concentrations remained low for NO and O3, revealing their link with local sources or meteorological features. The harmonic model showed satisfactory agreement. Oscillations and outliers are successfully reproduced by this model. Amplitude relationships, a1/a2, were higher in 2020 compared to the rest of the years for NO2, NOX and PM10. This result reveals that the weekly cycle prevails against the half-weekly cycle. This amplitude relationship decreased from 2019 to 2021 for O3 but increased for NO. The low values of this amplitude relationship—particularly below 1—indicate a complex weekly evolution outside the pattern formed by working days and the weekend.
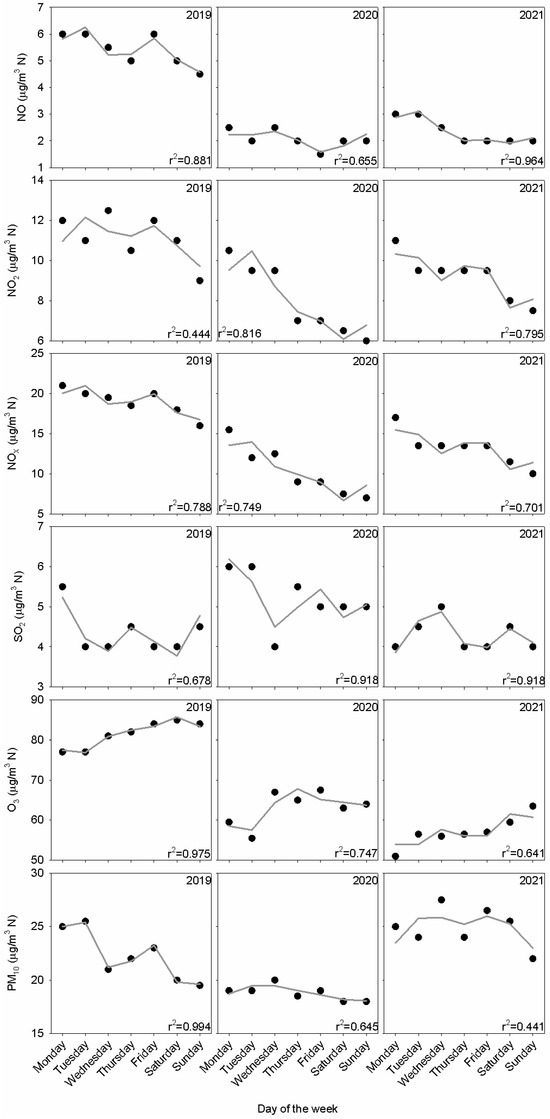
Figure 10.
Weekly cycle together with its fit with the harmonic function from Equation (1).
3.2.4. Concentrations following Lamb Weather Types
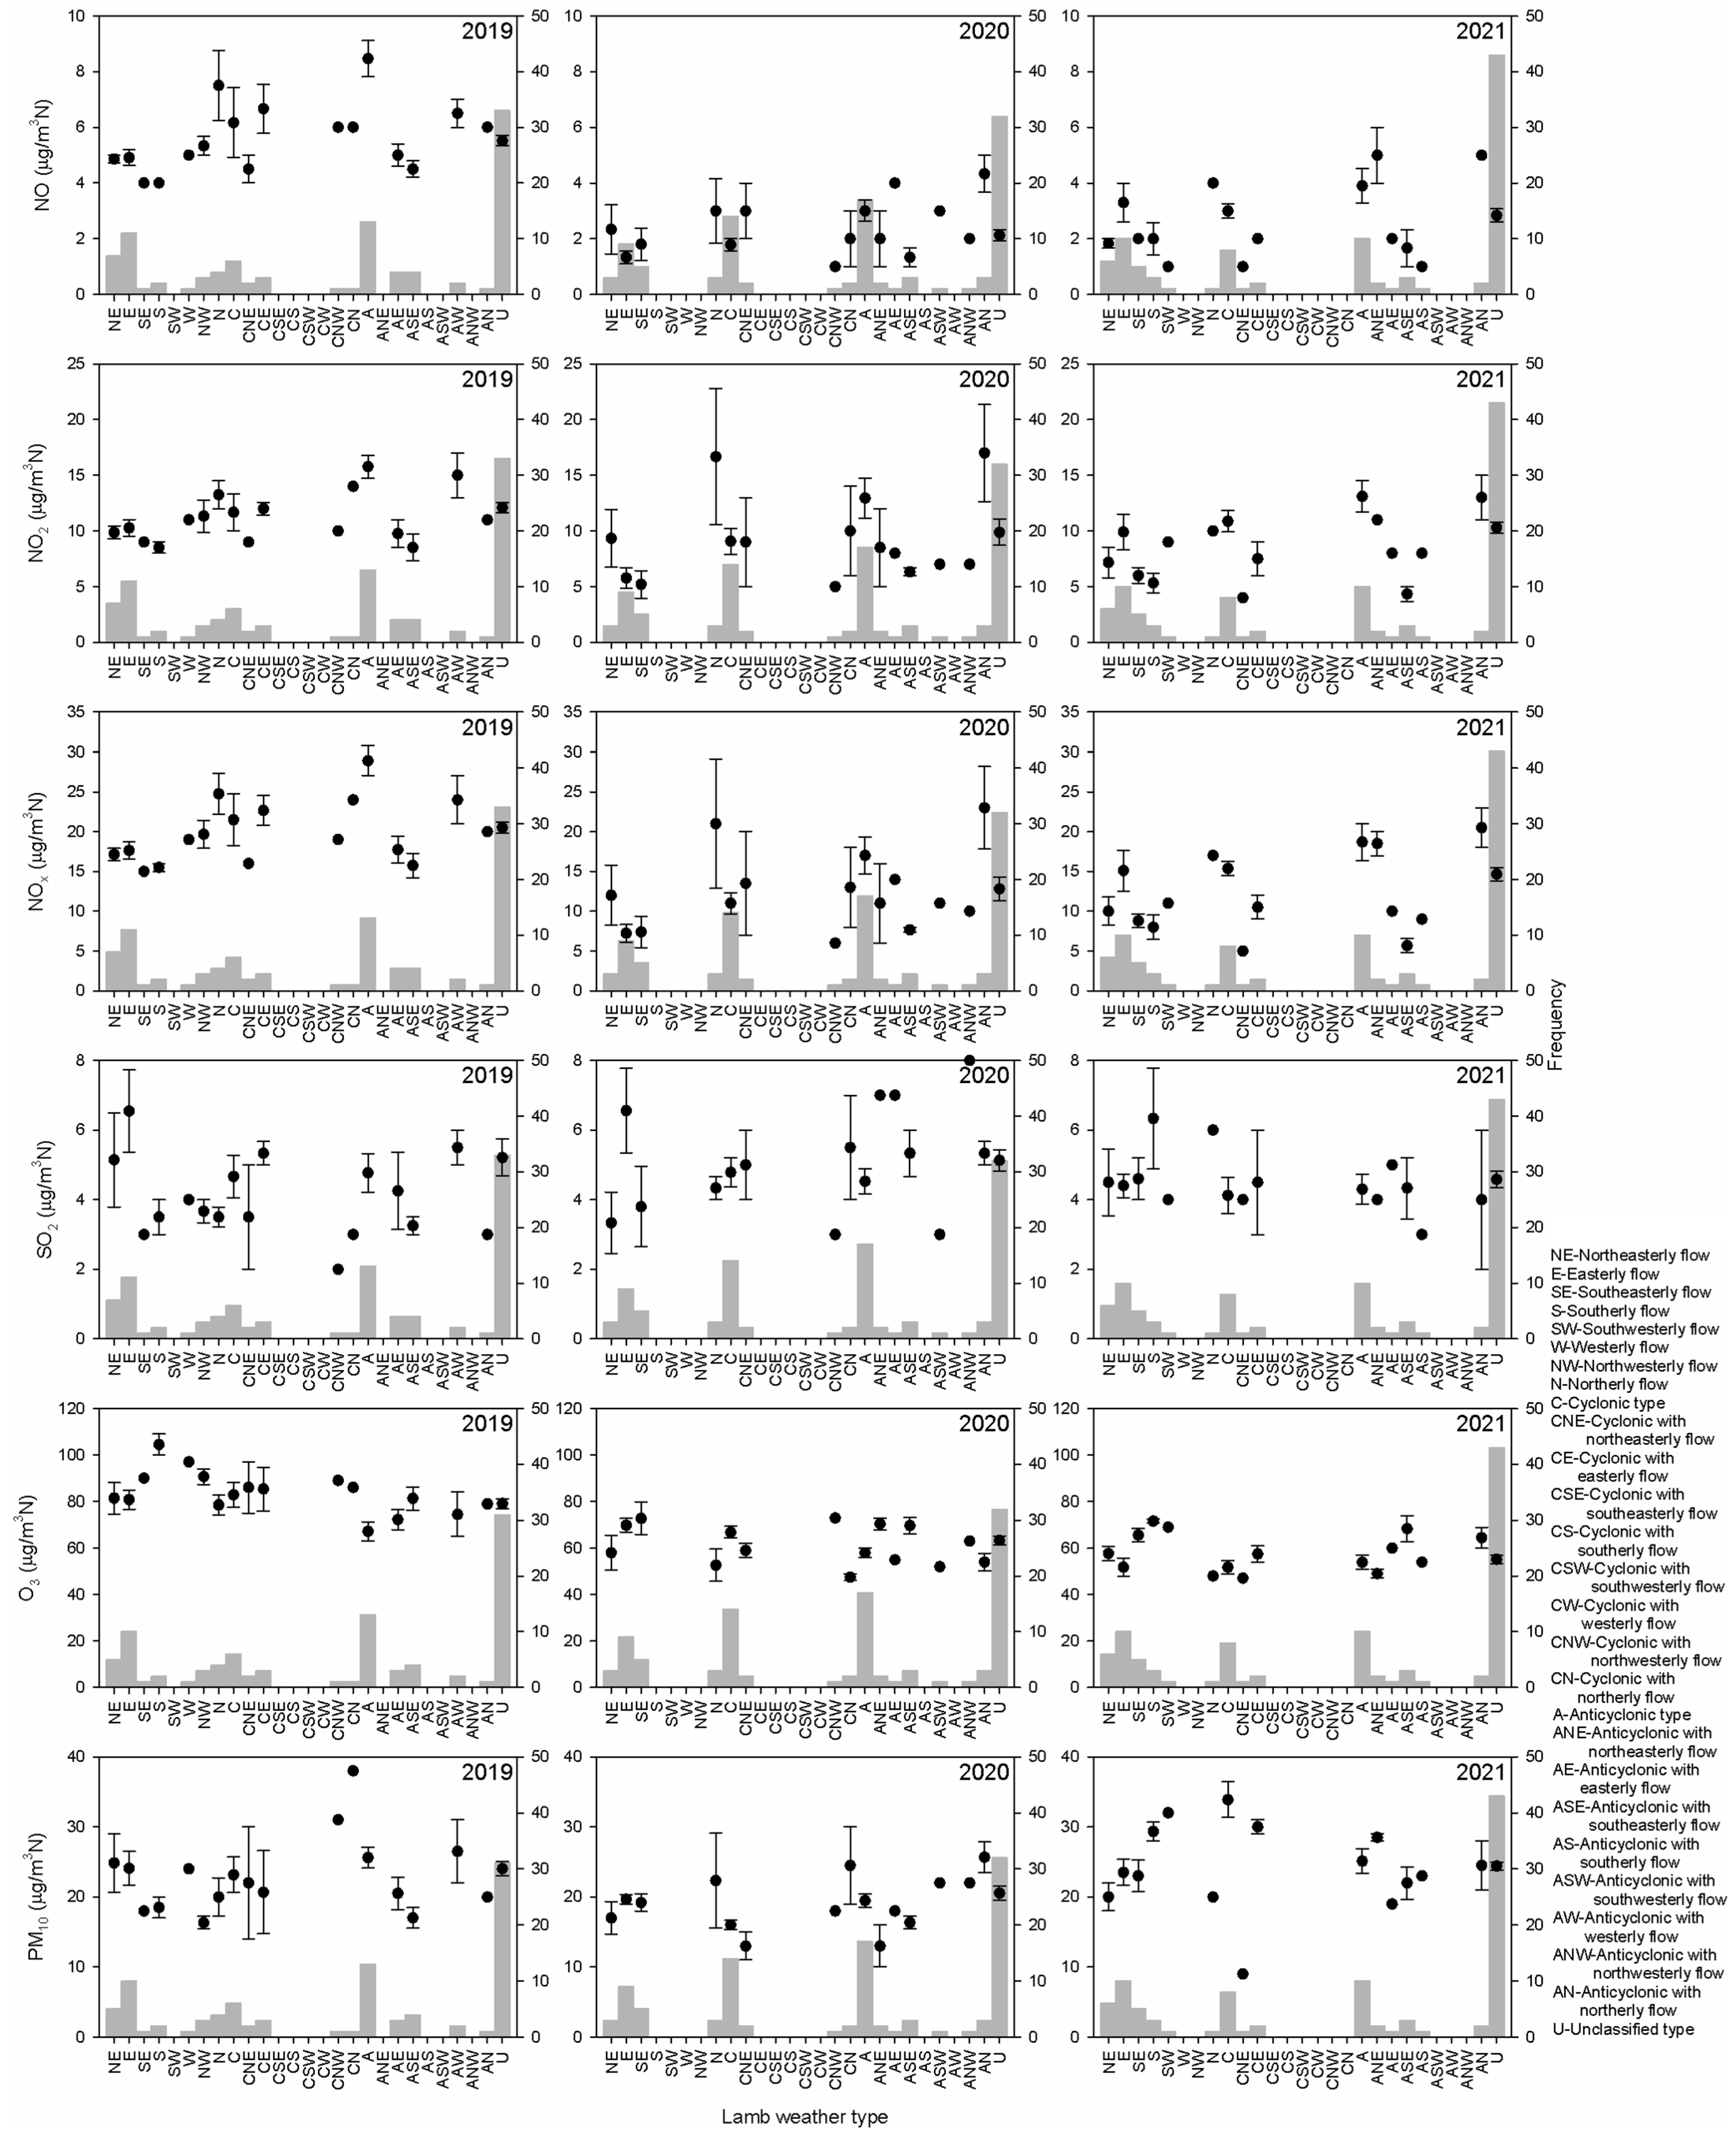
These types were calculated for the period of available data: 2007–2021. The most frequent type is the unclassified type (39.1%), followed by the anticyclonic type (15.0%) and the cyclonic type (7.9%). Pérez and García [61] used a network centred at (5° W, 40° N)—some 515 km from the one used in the current paper—and obtained contrasting frequencies for a longer period. Four types stood out. The most frequent pattern was the anticyclonic type (20.8%), followed by the unclassified type (16.5%), the easterly type (7.6%) and the cyclonic type (6.7%). This comparison indicates that a major contrast in type distribution is observed under small shifts in this region.
In the period, 15 March–21 June, the distribution of these types might present certain changes. Bars in Figure 11 are the frequencies of such types in this period for the years before, during and after the pandemic. The unclassified type prevails. However, second place is not defined since anticyclonic, cyclonic and easterly types stand out. Mean concentrations are also calculated. Values linked to frequent types should be considered in order to obtain robust results. If these most frequent types (unclassified, anticyclonic, cyclonic and easterly) are considered, nitrogen oxides stand out for the anticyclonic type and SO2 for the easterly type, both before the pandemic. The greatest decrease in NO between 2019 and 2020 was for the anticyclonic type, 5.5 μg m−3 N. This decrease was 4.5 μg m−3 N for NO2 for the easterly type, and was followed by a similar increase in 2022. For NOX, the highest decrease in 2019–2020 was for the anticyclonic type, 11.9 μg m−3 N, although the easterly type presented a slightly lower decrease accompanied by a noticeable increase in 2020–2021, 7.9 μg m−3 N. A decrease in this easterly type was also observed in 2020–2021 for SO2, 2.2 μg m−3 N. O3 presented a high decrease in 2019–2020 for the unclassified type, 15.8 μg m−3 N, and an increase in 2020–2021 was not observed for these four types. Finally, PM10 showed a decrease of 6.1 μg m−3 N in 2019–2020 for the anticyclonic type, although the decreases in 2019–2020 for the four types were counterbalanced with increases in 2020–2021.
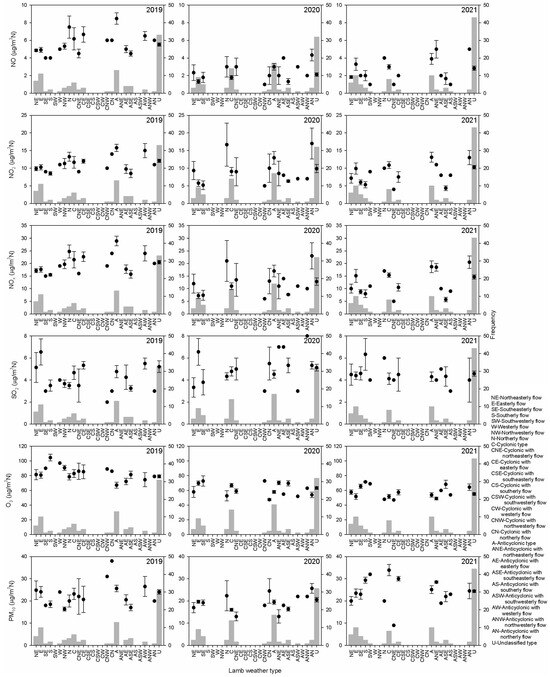
Figure 11.
Mean concentration for Lamb weather types in the period 15 March–21 June (dots). Intervals are twice the standard error (lines). Bars indicate the frequency of Lamb weather types (boxes).
Zoran et al. [62] studied air pollution and COVID-19 between March 2020 and October 2022 in Tokyo, Japan, and suggested that the reasons for the high incidence were due to the accumulation of high levels of pollutants and viral pathogens near the ground. Most are meteorological, such as specific and persistent anticyclonic circulation, the narrow depth of the planetary boundary layer and the high temperatures linked to the prolonged heat waves in the summer of 2022. The current analysis presented decreases in concentrations for the anticyclonic type. Han et al. [63] observed decreases in CO and NO2 concentrations in Seoul, South Korea, which were attributed not only to emission reductions but also to reductions in long-range transport. This result could be extended to the eastern type since this is the most frequent type in the lockdown period that could indicate transport. In this case, part of this transport might have arrived from industrial estates near the monitoring station, which were not affected by the lockdown. However, the high nitrogen oxide values before the pandemic under the anticyclonic type could be attributed to downward motion and pollutant accumulation. Zhu et al. [64] obtained high PM2.5 concentrations in eastern China under uniform pressure fields. Chen et al. [65] investigated the impact of the lockdown on ultrafine particles in Taipei, Taiwan, since traffic emissions decreased. However, aged particulate and secondary aerosols played a noticeable role, particularly under atmospheric stagnant conditions, which were associated with reduced dilution. In our research, the unclassified type is associated with uniform pressure, and its influence was noticeable on O3.
4. Conclusions
After having analysed 15 years of measurements (2007–2021) at the coastal site of Cartagena, Spain, no evolution was observed in the first half of the study period for nitrogen oxides, although a decreasing trend was seen in the second half. A decreasing trend with irregular evolution may be observed for SO2. However, steady concentrations were associated with O3 and PM10. Outliers were particularly frequent for NO and PM10, revealing that local processes need to be studied in order to identify the origin of such high concentrations.
The annual cycle is defined for nitrogen oxides and O3 but not for SO2 and PM10, whose concentrations remain relatively steady, and may be considered as background concentrations for SO2 at the measurement site. A better result is obtained with the weekly pattern since concentrations were lower during the weekend—except for SO2—with traffic being the main pollution source at the measurement station.
The effect of the lockdown was particularly evident through nitrogen oxide concentrations, where a sharp transition was present, followed by a slight increase for NO2. This behaviour may be the response to the traffic restriction for cars and cruises in the early weeks.
One key point of this paper is the impact of regional structures—such as synoptic pressure centres or flow types—on local features such as the concentrations recorded under the restrictions imposed as a result of the pandemic. The unclassified type was the most frequent Lamb type in the period 2007–2021. However, anticyclonic, cyclonic and easterly types were also prominent. The period 15 March–21 June was investigated over three years, 2019 (pre-lockdown), 2020 (lockdown) and 2021 (post-lockdown). As a result, the anticyclonic type was linked to noticeable changes in nitrogen oxide concentrations associated with downward air motion. However, changes observed with the easterly type could be attributed to air transport and might reveal the impact of industrial facilities upwind from the monitoring station.
As a further research line, the main pollution sources should be identified, and the inclusion of meteorological variables could help to investigate the source of outliers. This information could prove extremely valuable for air pollution managers.
Supplementary Materials
The following supporting information can be downloaded at: https://www.mdpi.com/article/10.3390/atmos15070783/s1, Figures S1–S6. Figure S1. NO annual cycle for each year. Figure S2. NO2 annual cycle for each year. Figure S3. NOX annual cycle for each year. Figure S4. SO2 annual cycle for each year. Figure S5. O3 annual cycle for each year. Figure S6. PM10 annual cycle for each year.
Author Contributions
Conceptualization, methodology, investigation, writing—original draft preparation, J.-L.M.-C.; methodology, investigation, writing—original draft preparation, I.A.P.; formal analysis, investigation, writing—review and editing, M.Á.G. All authors have read and agreed to the published version of the manuscript.
Funding
This research received no external funding.
Institutional Review Board Statement
Not applicable.
Informed Consent Statement
Not applicable.
Data Availability Statement
Pollutant concentrations were provided by the Regional Government of Murcia at https://sinqlair.carm.es/calidadaire/ (accessed on 3 October 2023), and maritime traffic information was provided by the Cartagena Port Authority at https://www.apc.es/webapc/publicaciones/documentacion (accessed on 3 October 2023). Pressure fields are available from NOAA https://psl.noaa.gov/data/gridded/data.ncep.reanalysis.html (accessed on 31 October 2023).
Conflicts of Interest
The authors declare no conflicts of interest.
References
- Zheng, H.; Yang, Z.; Yang, J.; Tao, Y.; Zhang, L. Comprehensive evaluation of environmental air quality based on the entropy weights and concentration variation trends of pollutants. Atmosphere 2022, 13, 1978. [Google Scholar] [CrossRef]
- Bilgili, L.; Celebi, U.B. Emission routing in maritime transportation. In Energy, Transportation and Global Warming; Grammelis, P., Ed.; Springer: Cham, Switzerland, 2016; pp. 837–849. [Google Scholar] [CrossRef]
- Nunes, R.A.O.; Alvim-Ferraz, M.C.M.; Martins, F.G.; Sousa, S.I.V. The activity-based methodology to assess ship emissions—A review. Environ. Pollut. 2017, 231, 87–103. [Google Scholar] [CrossRef] [PubMed]
- Eyring, V.; Isaksen, I.S.A.; Berntsen, T.; Collins, W.J.; Corbett, J.J.; Endresen, O.; Grainger, R.G.; Maldanova, J.; Schlager, H.; Stevenson, D.S. Transport impacts on atmosphere and climate: Shipping. Atmos. Environ. 2010, 44, 4735–4771. [Google Scholar] [CrossRef]
- Saraçoǧlu, H.; Deniz, C.; Kiliç, A. An investigation on the effects of ship sourced emissions in Izmir port, Turkey. Sci. World J. 2013, 2013, 218324. [Google Scholar] [CrossRef] [PubMed]
- Yau, P.S.; Lee, S.C.; Corbett, J.J.; Wang, C.; Cheng, Y.; Ho, K.F. Estimation of exhaust emission from ocean-going vessels in Hong Kong. Sci. Total Environ. 2012, 431, 299–306. [Google Scholar] [CrossRef] [PubMed]
- Kiliç, A.; Deniz, C. Inventory of shipping emissions in Izmit gulf, Turkey. Environ. Prog. Sustain. Energy 2010, 29, 221–232. [Google Scholar] [CrossRef]
- Cooper, D.A. Exhaust emissions from ships at Berth. Atmos. Environ. 2003, 37, 3817–3830. [Google Scholar] [CrossRef]
- Saxe, H.; Larsen, T. Air pollution from ships in three Danish ports. Atmos. Environ. 2004, 38, 4057–4067. [Google Scholar] [CrossRef]
- Dalsøren, S.B.; Eide, M.S.; Endresen, O.; Mjelde, A.; Gravir, G.; Isaksen, I.S.A. Update on emissions and environmental impacts from the international fleet of ships: The contribution from major ship types and ports. Atmos. Chem. Phys. 2009, 9, 2171–2194. [Google Scholar] [CrossRef]
- Corbett, J.J.; Winebrake, J.J.; Green, E.H.; Kasibhatla, P.; Eyring, V.; Lauer, A. Mortality from ship emissions: A global assessment. Environ. Sci. Technol. 2007, 41, 8512–8518. [Google Scholar] [CrossRef]
- Dore, A.J.; Vieno, M.; Tang, Y.S.; Dragosits, U.; Dosio, A.; Weston, K.J.; Sutton, M.A. Modelling the atmospheric transport and deposition of sulphur and nitrogen over the United Kingdom and assessment of the influence of SO2 emissions from international shipping. Atmos. Environ. 2007, 41, 2355–2367. [Google Scholar] [CrossRef]
- Papanastasiou, D.K.; Melas, D. Climatology and impact on air quality of sea breeze in an urban coastal environment. Int. J. Climatol. 2009, 29, 305–315. [Google Scholar] [CrossRef]
- Mavrakou, T.; Philippopoulos, K.; Deligiorgi, D. The impact of sea breeze under different synoptic patterns on air pollution within Athens basin. Sci. Total Environ. 2012, 433, 31–43. [Google Scholar] [CrossRef] [PubMed]
- Zhao, M.; Zhang, Y.; Ma, W.; Fu, Q.; Yang, X.; Li, C.; Zhou, B.; Yu, Q.; Chen, L. Characteristics and ship traffic source identification of air pollutants in China’s largest port. Atmos. Environ. 2013, 64, 277–286. [Google Scholar] [CrossRef]
- Fan, Q.; Zhang, Y.; Ma, W.; Ma, H.; Feng, J.; Yu, Q.; Yang, X.; Ng, S.K.W.; Fu, Q.; Chen, L. Spatial and seasonal dynamics of ship emissions over the Yangtze River Delta and East China Sea and their potential environmental influence. Environ. Sci. Technol. 2016, 50, 1322–1329. [Google Scholar] [CrossRef] [PubMed]
- Tzannatos, E. Ship emissions and their externalities for the port of Piraeus—Greece. Atmos. Environ. 2010, 44, 400–407. [Google Scholar] [CrossRef]
- Matthias, V.; Bewersdorff, I.; Aulinger, A.; Quante, M. The contribution of ship emissions to air pollution in the North Sea regions. Environ. Pollut. 2010, 158, 2241–2250. [Google Scholar] [CrossRef]
- Song, S.K.; Shon, Z.H. Current and future emission estimates of exhaust gases and particles from shipping at the largest port in Korea. Environ. Sci. Pollut. Res. 2014, 21, 6612–6622. [Google Scholar] [CrossRef]
- International Maritime Organisation. International Convention for the Prevention of Pollution from Ships (MARPOL). Available online: https://www.imo.org/en (accessed on 3 October 2023).
- Castells Sanabra, M.; Usabiaga Santamaría, J.J.; Martínez De Osés, F.X. Manoeuvring and hotelling external costs: Enough for alternative energy sources? Marit. Policy Manag. 2014, 41, 42–60. [Google Scholar] [CrossRef]
- Alver, F.; Saraç, B.A.; Alver Şahin, Ü. Estimating of shipping emissions in the Samsun Port from 2010 to 2015. Atmos. Pollut. Res. 2018, 9, 822–828. [Google Scholar] [CrossRef]
- Tichavska, M.; Tovar, B. Environmental cost and eco-efficiency from vessel emissions in Las Palmas Port. Transp. Res. Part e-Logist. Transp. Rev. 2015, 83, 126–140. [Google Scholar] [CrossRef]
- Villalba, G.; Gemechu, E.D. Estimating GHG emissions of marine ports-the case of Barcelona. Energy Policy 2011, 39, 1363–1368. [Google Scholar] [CrossRef]
- García, M. Cruceros: Colosos del turismo masivo de alta contaminación. Ecol. Política Tur. 2016, 52, 98–102. [Google Scholar]
- Papaefthimiou, S.; Maragkogianni, A.; Andriosopoulos, K. Evaluation of cruise ships emissions in the Mediterranean basin: The case of Greek ports. Int. J. Sustain. Transp. 2016, 10, 985–994. [Google Scholar] [CrossRef]
- De Melo Rodríguez, G.; Martin-Alcalde, E.; Murcia-González, J.C.; Saurí, S. Evaluating air emission inventories and indicators from cruise vessels at ports. WMU J. Marit. Aff. 2017, 16, 405–420. [Google Scholar] [CrossRef]
- Cesari, D.; Genga, A.; Ielpo, P.; Siciliano, M.; Mascolo, G.; Grasso, F.M.; Contini, D. Source apportionment of PM2.5 in the harbour-industrial area of Brindisi (Italy): Identification and estimation of the contribution of in-port ship emissions. Sci. Total Environ. 2014, 497–498, 392–400. [Google Scholar] [CrossRef] [PubMed]
- Cirera, L.; Rodríguez, M.; Giménez, J.; Jiménez, E.; Saez, M.; Guillén, J.J.; Medrano, J.; Martínez-Victoria, M.A.; Ballester, F.; Moreno-Grau, S.; et al. Effects of public health interventions on industrial emissions and ambient air in Cartagena, Spain. Environ. Sci. Pollut. Res. 2009, 16, 152–161. [Google Scholar] [CrossRef] [PubMed]
- García-Ayllón, S. Air pollution derivatives linked to changes in urban mobility patterns during COVID-19: The Cartagena case study. Environ. Sci. Proc. 2022, 24, 3. [Google Scholar] [CrossRef]
- García-Ayllón, S.; Kyriakidis, P. Spatial analysis of environmental impacts linked to changes in urban mobility patterns during COVID-19: Lessons learned from the Cartagena case study. Land 2022, 11, 81. [Google Scholar] [CrossRef]
- Doval-Miñarro, M.; Bueso, M.C. A comparative study of air pollutant concentrations before the COVID-19 pandemic and in the new normal in the Región de Murcia (Spain). Atmosphere 2023, 14, 147. [Google Scholar] [CrossRef]
- Costa-Gómez, I.; Suarez-Suarez, M.; Moreno, J.M.; Moreno-Grau, S.; Negral, L.; Arroyo-Manzanares, N.; López-García, I.; Peñalver, R. A novel application of thermogravimetry-mass spectrometry for polystyrene quantification in the PM10 and PM2.5 fractions of airborne microplastics. Sci. Total Environ. 2023, 856, 159041. [Google Scholar] [CrossRef] [PubMed]
- Caniato, M.; Bettarello, F.; Gasparella, A. Indoor and outdoor noise changes due to the COVID-19 lockdown and their effects on individuals’ expectations and preferences. Sci. Rep. 2021, 11, 16533. [Google Scholar] [CrossRef] [PubMed]
- Li, C.; Li, X.; Zhu, C. Night-time skyglow dynamics during the COVID-19 Epidemic in Guangbutun region of Wuhan City. Remote Sens. 2022, 14, 4451. [Google Scholar] [CrossRef]
- He, G.; Pan, Y.; Tanaka, T. The short-term impacts of COVID-19 lockdown on urban air pollution in China. Nat. Sustain. 2020, 3, 1005–1011. [Google Scholar] [CrossRef]
- Sabrin, S.; Karimi, M.; Nazari, R.; Fahad, M.G.R.; Peters, R.W.; Uddin, A. The impact of stay-at-home orders on air-quality and COVID-19 mortality rate in the United States. Urban Clim. 2021, 39, 100946. [Google Scholar] [CrossRef] [PubMed]
- Seo, J.H.; Jeon, H.W.; Sung, U.J.; Sohn, J.R. Impact of the COVID-19 outbreak on air quality in Korea. Atmosphere 2020, 11, 1137. [Google Scholar] [CrossRef]
- Calidad del Aire de la Región de Murcia. Available online: https://sinqlair.carm.es/calidadaire/ (accessed on 3 October 2023).
- Autoridad Portuaria de Cartagena. Available online: https://www.apc.es/webapc/publicaciones/documentacion (accessed on 3 October 2023).
- Pérez, I.A.; Sánchez, M.L.; García, M.A.; Pardo, N.; Fernández-Duque, B. Statistical analysis of the CO2 and CH4 annual cycle on the northern plateau of the Iberian Peninsula. Atmosphere 2020, 11, 769. [Google Scholar] [CrossRef]
- Jenkinson, A.F.; Collison, F.P. An Initial Climatology of Gales over the North Sea; Synoptic Climatology Branch Memorandum No. 62; Meteorological Office: Bracknelly, UK, 1977. [Google Scholar]
- National Oceanic and Atmospheric Administration. Available online: https://psl.noaa.gov/data/gridded/data.ncep.reanalysis.html (accessed on 31 October 2023).
- Jang, E.; Do, W.; Park, G.; Kim, M.; Yoo, E. Spatial and temporal variation of urban air pollutants and their concentrations in relation to meteorological conditions at four sites in Busan, South Korea. Atmos. Pollut. Res. 2017, 8, 89–100. [Google Scholar] [CrossRef]
- Lee, H.; Park, S.; Mayer, H. Statistical characteristics of air quality index DAQx*-Specific air pollutants differentiated by types of air quality monitoring stations: A case study of Seoul, Republic of Korea. Sustainability 2023, 15, 8599. [Google Scholar] [CrossRef]
- Xiong, J.; Li, J.; Gao, F.; Zhang, Y. City wind impact on air pollution control for urban planning with different time-scale considerations: A case study in Chengdu, China. Atmosphere 2023, 14, 1068. [Google Scholar] [CrossRef]
- He, R.R. Quantifying the weekly cycle effect of air pollution in cities of China. Stoch. Environ. Res. Risk Assess. 2023, 37, 2445–2457. [Google Scholar] [CrossRef] [PubMed]
- Consejería de Medio Ambiente, Universidades, Investigación y Mar Menor. Dirección General de Medio Ambiente. Available online: https://sinqlair.carm.es/calidadaire/redvigilancia/redvigilancia.aspx (accessed on 20 June 2024).
- Song, X.; Zhang, D.; Li, X.; Lu, X.; Wang, M.; Zhang, B.; Zhang, R. Simultaneous observations of peroxyacetyl nitrate and ozone in Central China during static management of COVID-19: Regional transport and thermal decomposition. Atmos. Res. 2023, 294, 106958. [Google Scholar] [CrossRef]
- Luo, Z.; Xu, H.; Zhang, Z.; Zheng, S.; Liu, H. Year-round changes in tropospheric nitrogen dioxide caused by COVID-19 in China using satellite observation. J. Environ. Sci. 2023, 132, 162–168. [Google Scholar] [CrossRef] [PubMed]
- Yilmaz, S.; Menteş, Y.; Angin, S.N.; Qaid, A. Impact of the COVID-19 outbreak on urban air, Land surface temperature and air pollution in cold climate zones. Environ. Res. 2023, 237, 116887. [Google Scholar] [CrossRef] [PubMed]
- Putaud, J.-P.; Pisoni, E.; Mangold, A.; Hueglin, C.; Sciare, J.; Pikridas, M.; Savvides, C.; Ondracek, J.; Mbengue, S.; Wiedensohler, A.; et al. Impact of 2020 COVID-19 lockdowns on particulate air pollution across Europe. Atmos. Chem. Phys. 2023, 23, 10145–10161. [Google Scholar] [CrossRef]
- Lara, R.; van Drooge, B.L.; Canals-Angerri, A.; Amato, F.; Alastuey, A.; Querol, X.; Negral, L. Key factors for abating particulate matter in a highly industrialized area in N Spain: Fugitive emissions and secondary aerosol precursors. Chemosphere 2023, 341, 139959. [Google Scholar] [CrossRef] [PubMed]
- Kumar, S.; Dwivedi, S.K. Assessment of air quality in Lucknow, India during the festival of Diwali for four successive years amid the COVID-19 pandemic lockdown. Phys. Chem. Earth 2023, 131, 103439. [Google Scholar] [CrossRef]
- Shaygan, M.; Mokarram, M. Investigating patterns of air pollution in metropolises using remote sensing and neural networks during the COVID-19 pandemic. Adv. Space Res. 2023, 72, 3065–3081. [Google Scholar] [CrossRef] [PubMed]
- Li, C.; Zhang, Y.; Chen, Z.; Wang, X.; Yue, M.; Liu, J.; Jiang, Y.; Zhao, Z.; Cai, G. Systematic and dynamic impacts of the COVID-19 pandemic on marine economic development, air pollution and energy consumption: A case study of China’s coastal regions. Ocean Coastal Manag. 2023, 244, 106774. [Google Scholar] [CrossRef]
- Xu, L.; Zhang, J.; Sun, X.; Xu, S.; Shan, M.; Yuan, Q.; Liu, L.; Du, Z.; Liu, D.; Xu, D.; et al. Variation in concentration and sources of black carbon in a megacity of China during the COVID-19 pandemic. Geophys. Res. Lett. 2020, 47, e2020GL090444. [Google Scholar] [CrossRef]
- Yuan, Q.; Qi, B.; Hu, D.; Wang, J.; Zhang, J.; Yang, H.; Zhang, S.; Liu, L.; Xu, L.; Li, W. Spatiotemporal variations and reduction of air pollutants during the COVID-19 pandemic in a megacity of Yangtze River Delta in China. Sci. Total Environ. 2021, 751, 141820. [Google Scholar] [CrossRef] [PubMed]
- Li, R.; Gao, Y.; Han, Y.; Zhang, Y.; Zhang, B.; Fu, H.; Wang, G. Elucidating the mechanisms of rapid O3 increase in North China Plain during COVID-19 lockdown period. Sci. Total Environ. 2024, 906, 167622. [Google Scholar] [CrossRef] [PubMed]
- Lin, W.; He, Q.; Xiao, Y.; Yang, J. Do city lockdowns effectively reduce air pollution? Technol. Forecast. Soc. Chang. 2023, 197, 122885. [Google Scholar] [CrossRef]
- Pérez, I.A.; García, M.A. Climate change in the Iberian Peninsula by weather types and temperature. Atmos. Res. 2023, 284, 106596. [Google Scholar] [CrossRef]
- Zoran, M.A.; Savastru, R.S.; Savastru, D.M.; Tautan, M.N. Peculiar weather patterns effects on air pollution and COVID-19 spread in Tokyo metropolis. Environ. Res. 2023, 228, 115907. [Google Scholar] [CrossRef] [PubMed]
- Han, B.S.; Park, K.; Kwak, K.H.; Park, S.B.; Jin, H.G.; Moon, S.; Kim, J.W.; Baik, J.J. Air quality change in Seoul, South Korea under covid-19 social distancing: Focusing on PM2.5. Int. J. Environ. Res. Public Health 2020, 17, 6208. [Google Scholar] [CrossRef] [PubMed]
- Zhu, S.; Wang, Z.; Qu, K.; Xu, J.; Zhang, J.; Yang, H.; Wang, W.; Sui, X.; Wei, M.; Liu, H. Spatial characteristics and influence of topography and synoptic systems on PM2.5 in the eastern monsoon region of China. Aerosol Air Qual. Res. 2023, 23, 220393. [Google Scholar] [CrossRef]
- Chen, T.L.; Hsiao, T.C.; Chen, A.Y.; Chang, K.E.; Lin, T.C.; Griffith, S.M.; Chou, C.C.K. A traffic-induced shift of ultrafine particle sources under COVID-19 soft lockdown in a subtropical urban area. Environ. Int. 2024, 187, 108658. [Google Scholar] [CrossRef]
Disclaimer/Publisher’s Note: The statements, opinions and data contained in all publications are solely those of the individual author(s) and contributor(s) and not of MDPI and/or the editor(s). MDPI and/or the editor(s) disclaim responsibility for any injury to people or property resulting from any ideas, methods, instructions or products referred to in the content. |
© 2024 by the authors. Licensee MDPI, Basel, Switzerland. This article is an open access article distributed under the terms and conditions of the Creative Commons Attribution (CC BY) license (https://creativecommons.org/licenses/by/4.0/).

