
Global Per Capita CO2 Emission Trends


Abstract
:1. Introduction
2. Data and Methods
2.1. Data
2.2. Methods
2.2.1. Mann–Kendall (MK) Test
- (1)
- Construct the rank sequence:
- (2)
- Forward statistic, :
- (3)
- Backward statistic
2.2.2. Hurst Index
- (1)
- is a time series of length . Construct a logarithmic difference sequence with length :
- (2)
- Equate a logarithmic sequence of length in subsets, each of length . Calculate the mean value of each subset (:
- (3)
- Within each subset, , calculate the cumulative deviation of the first points (), relative to the mean for that subset:
- (4)
- Calculate the range of the fluctuations in the logarithmic series within each subset :
- (5)
- Calculate the standard deviation of the log-return series within each subset :
2.2.3. Gravity Center Shift
2.2.4. Contribution Decomposition Method (CDM)
3. Results
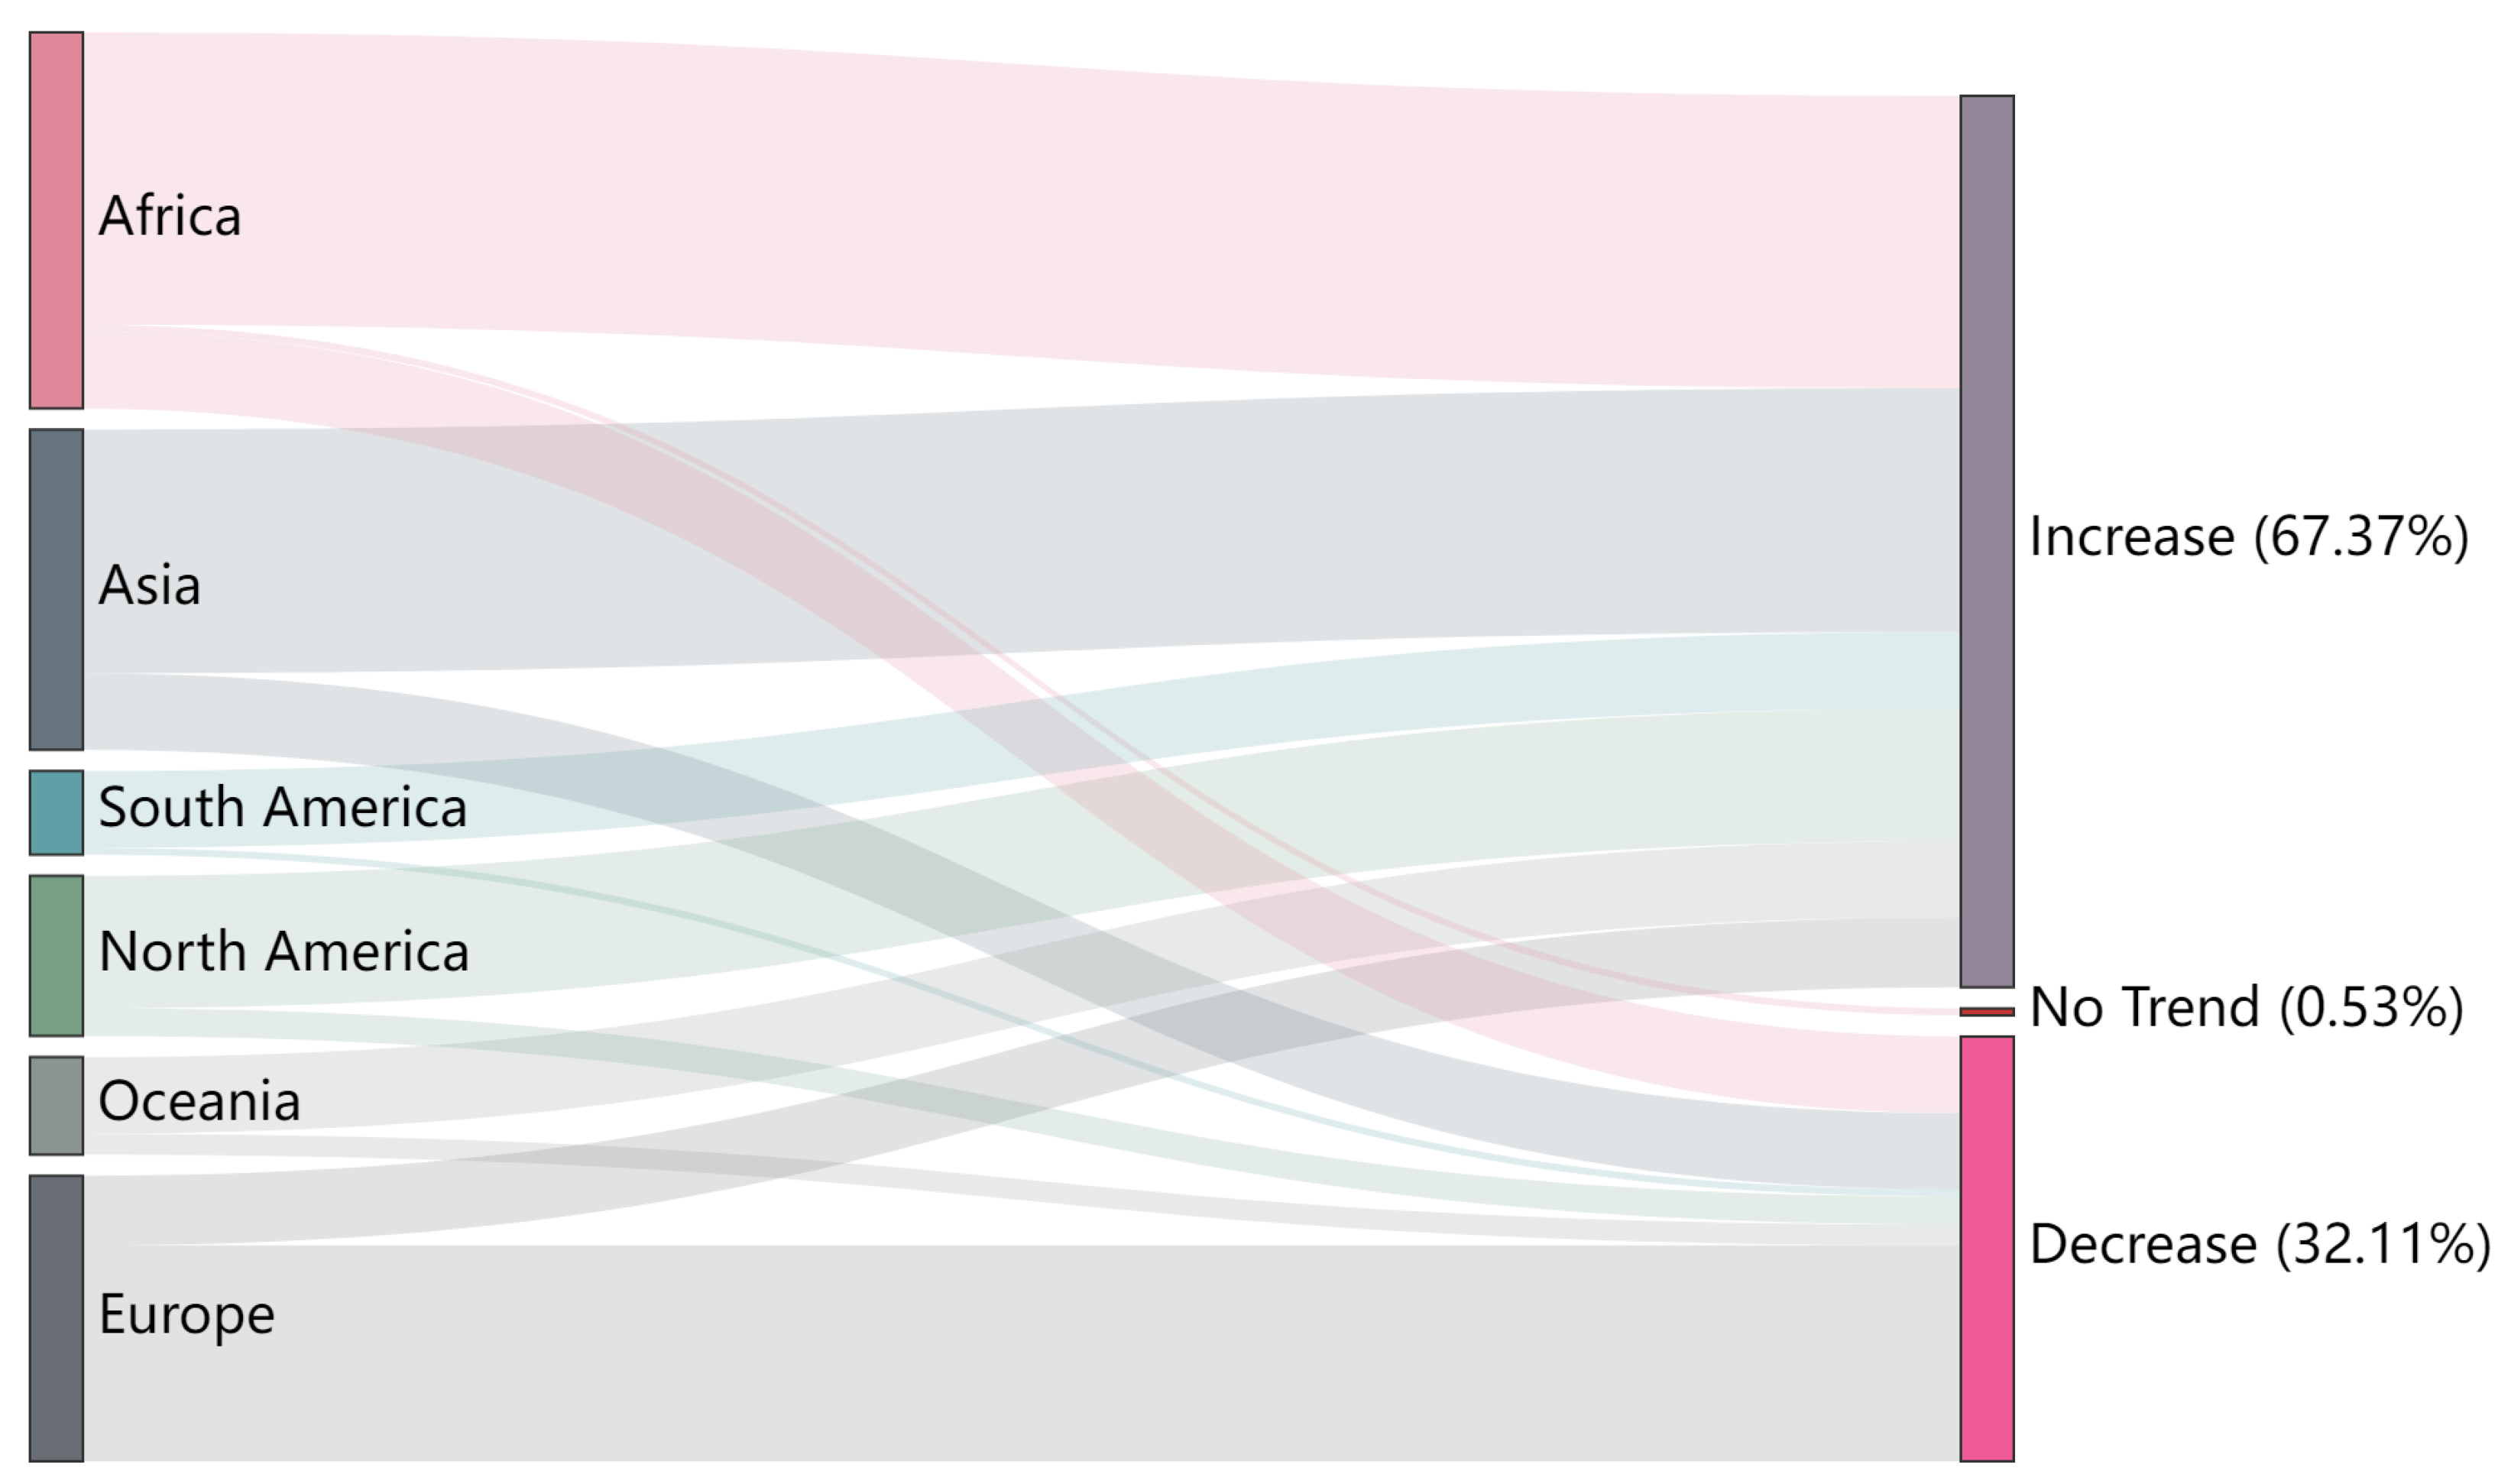
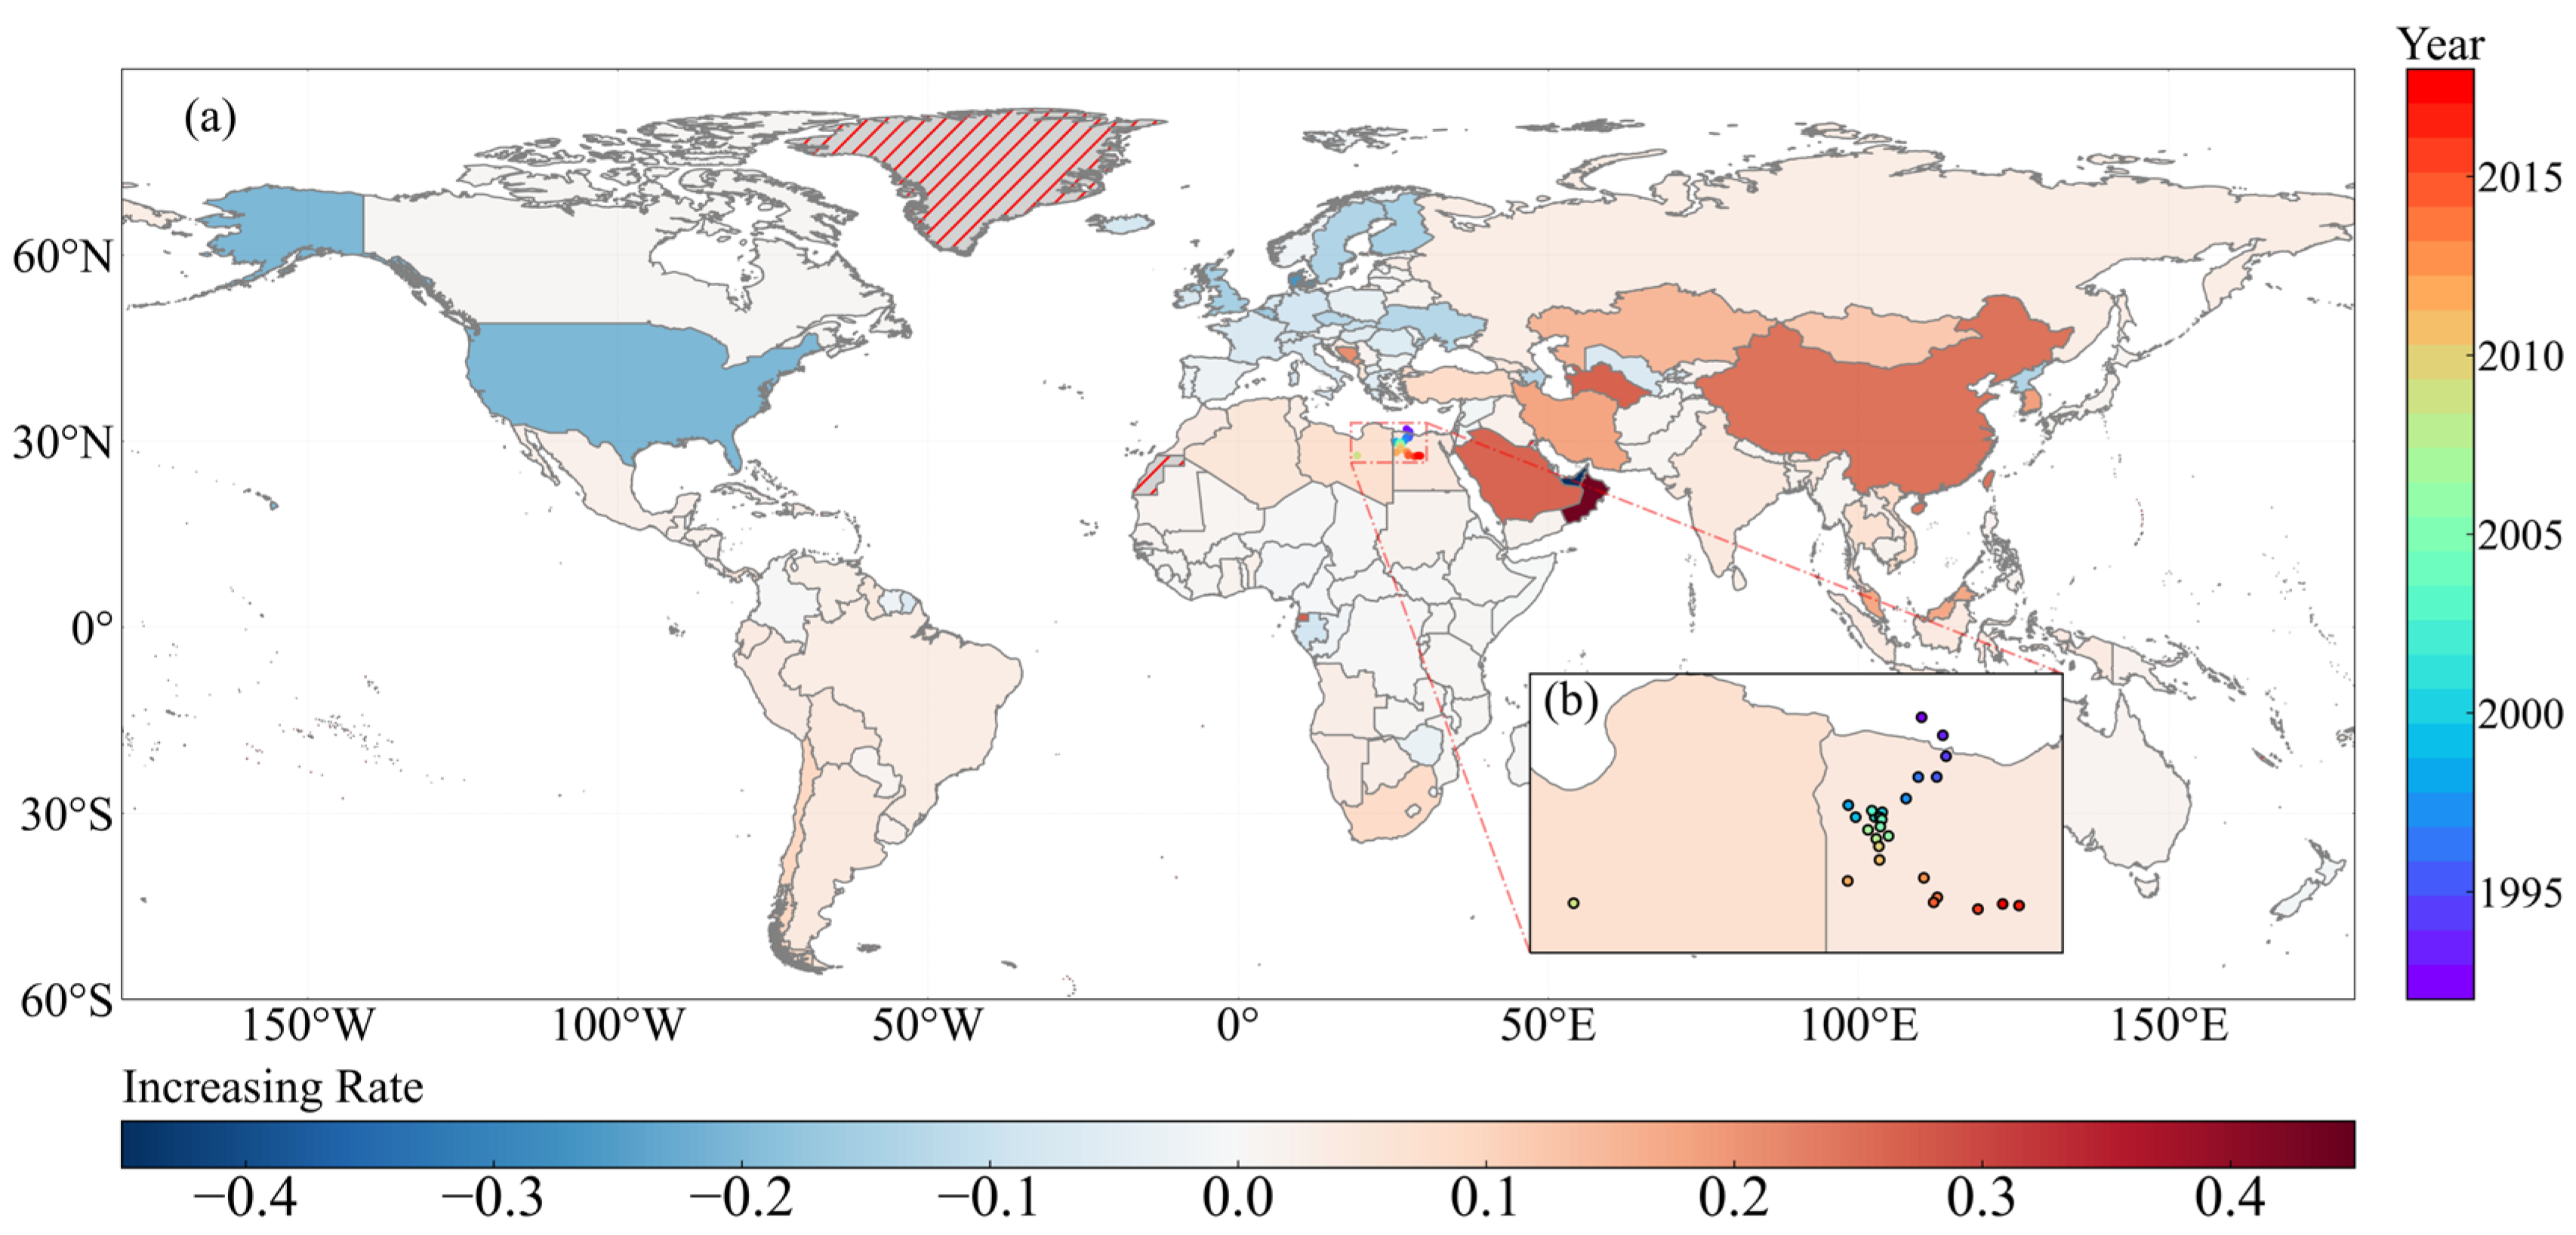
3.1. MK Trend Test
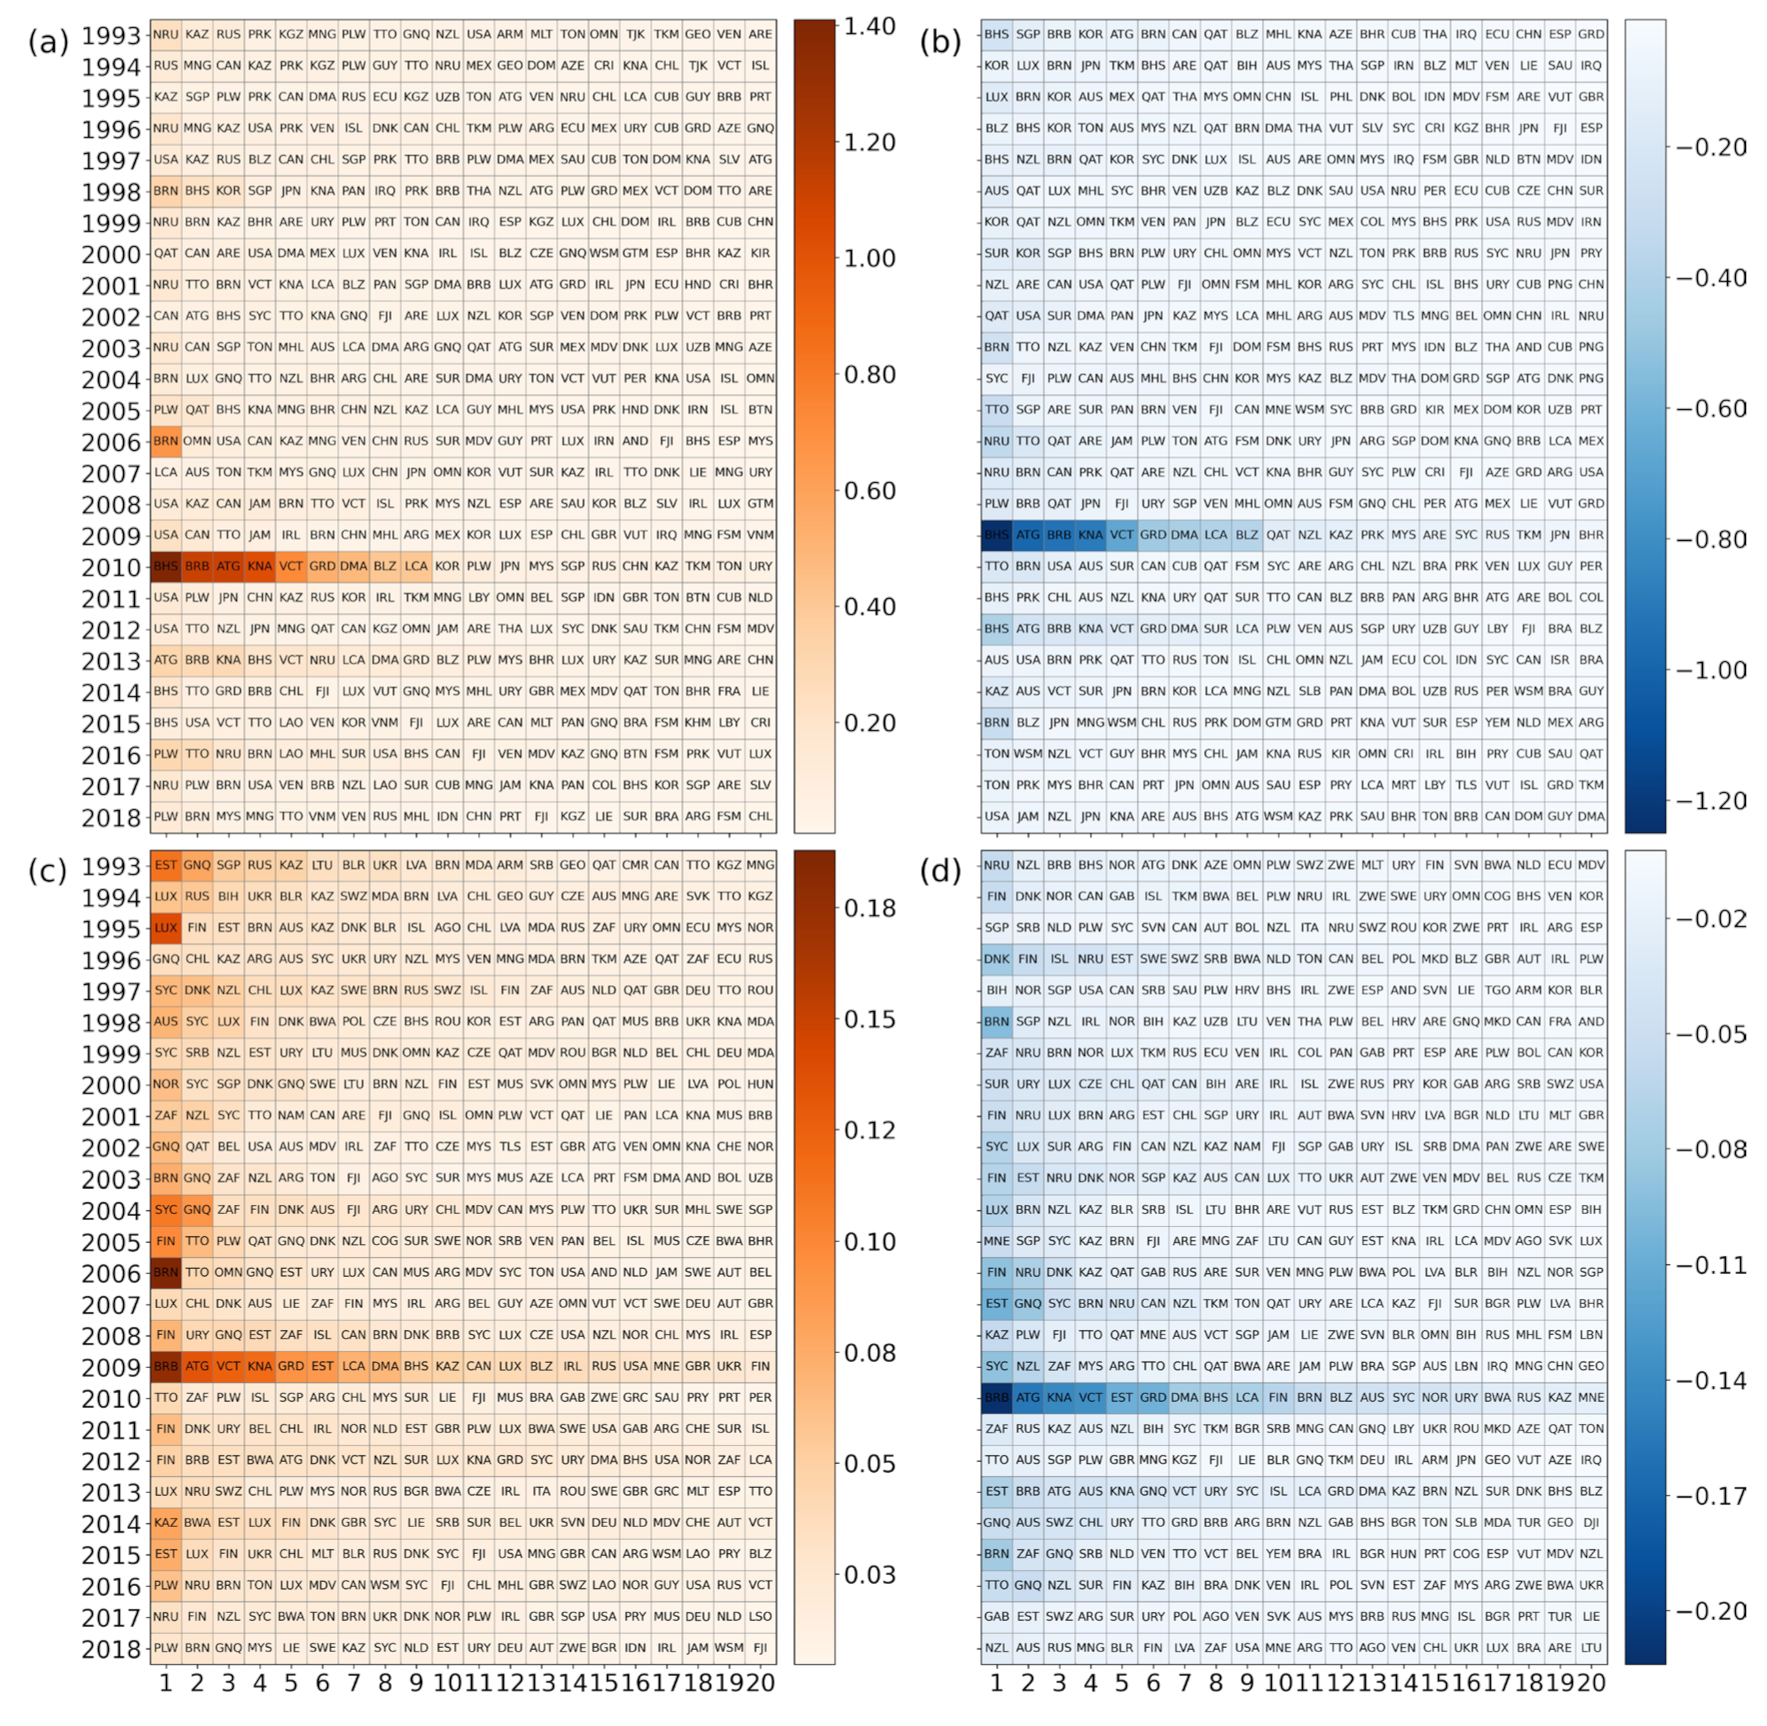
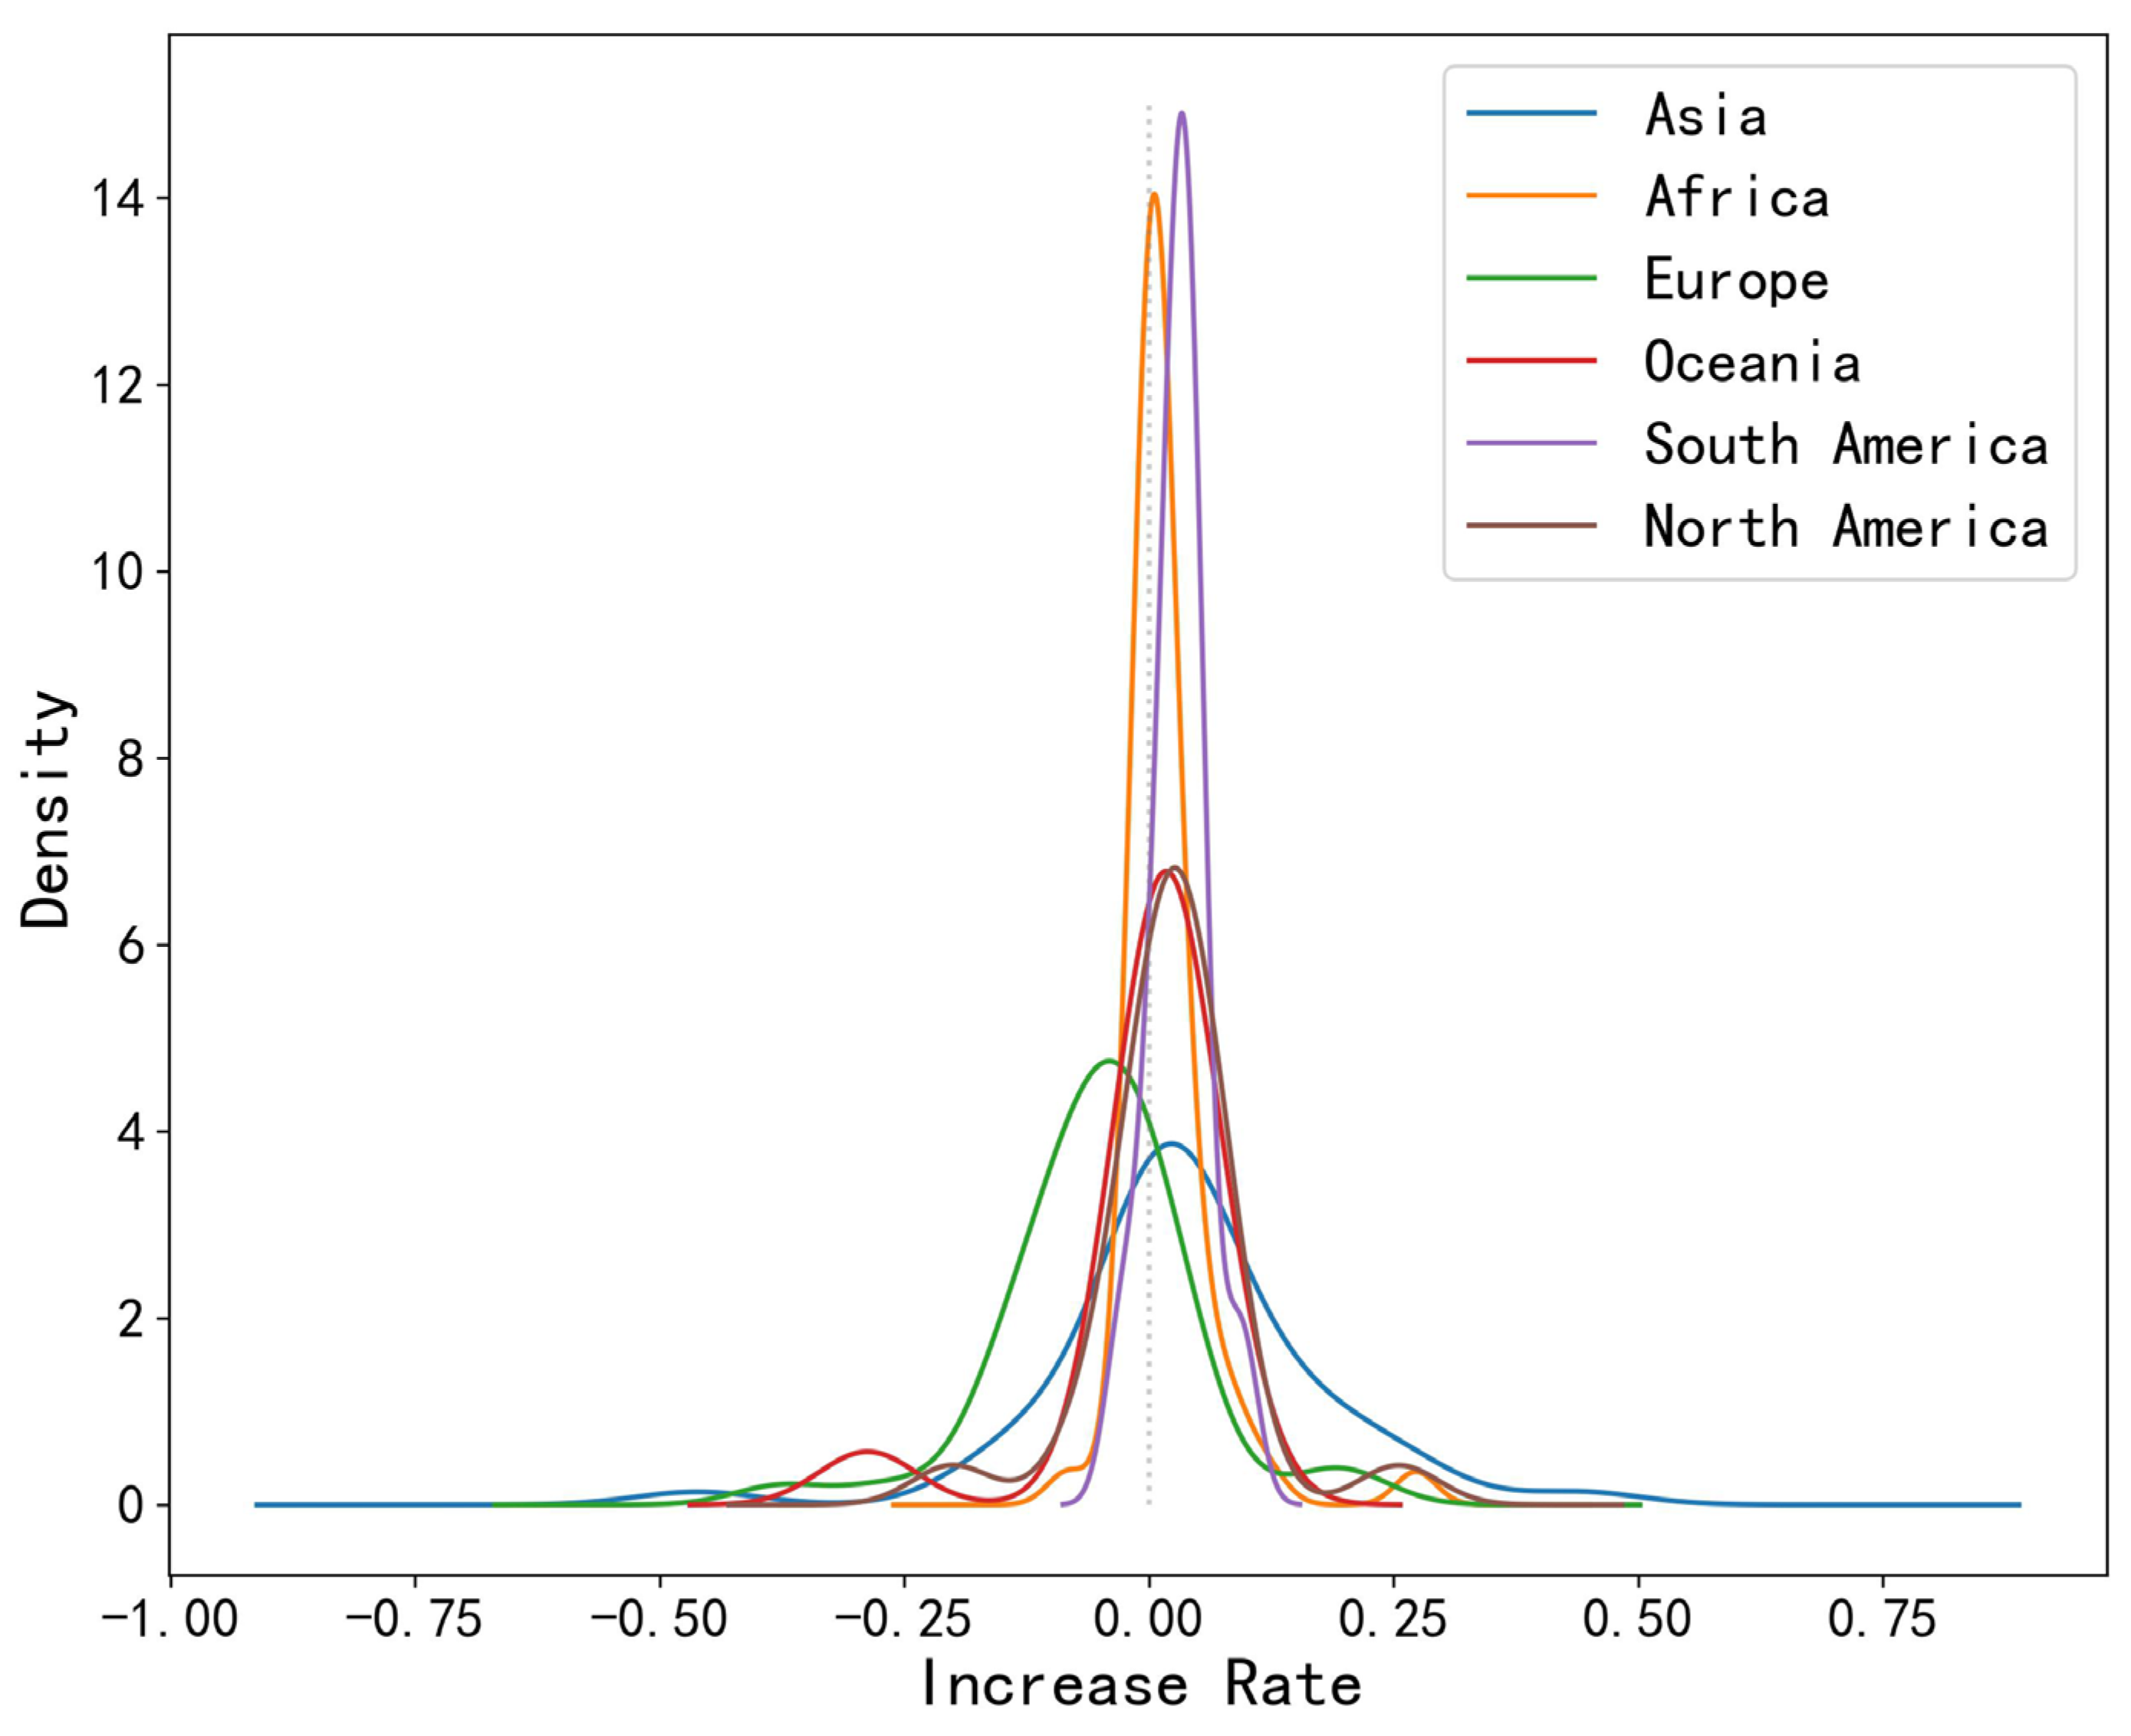
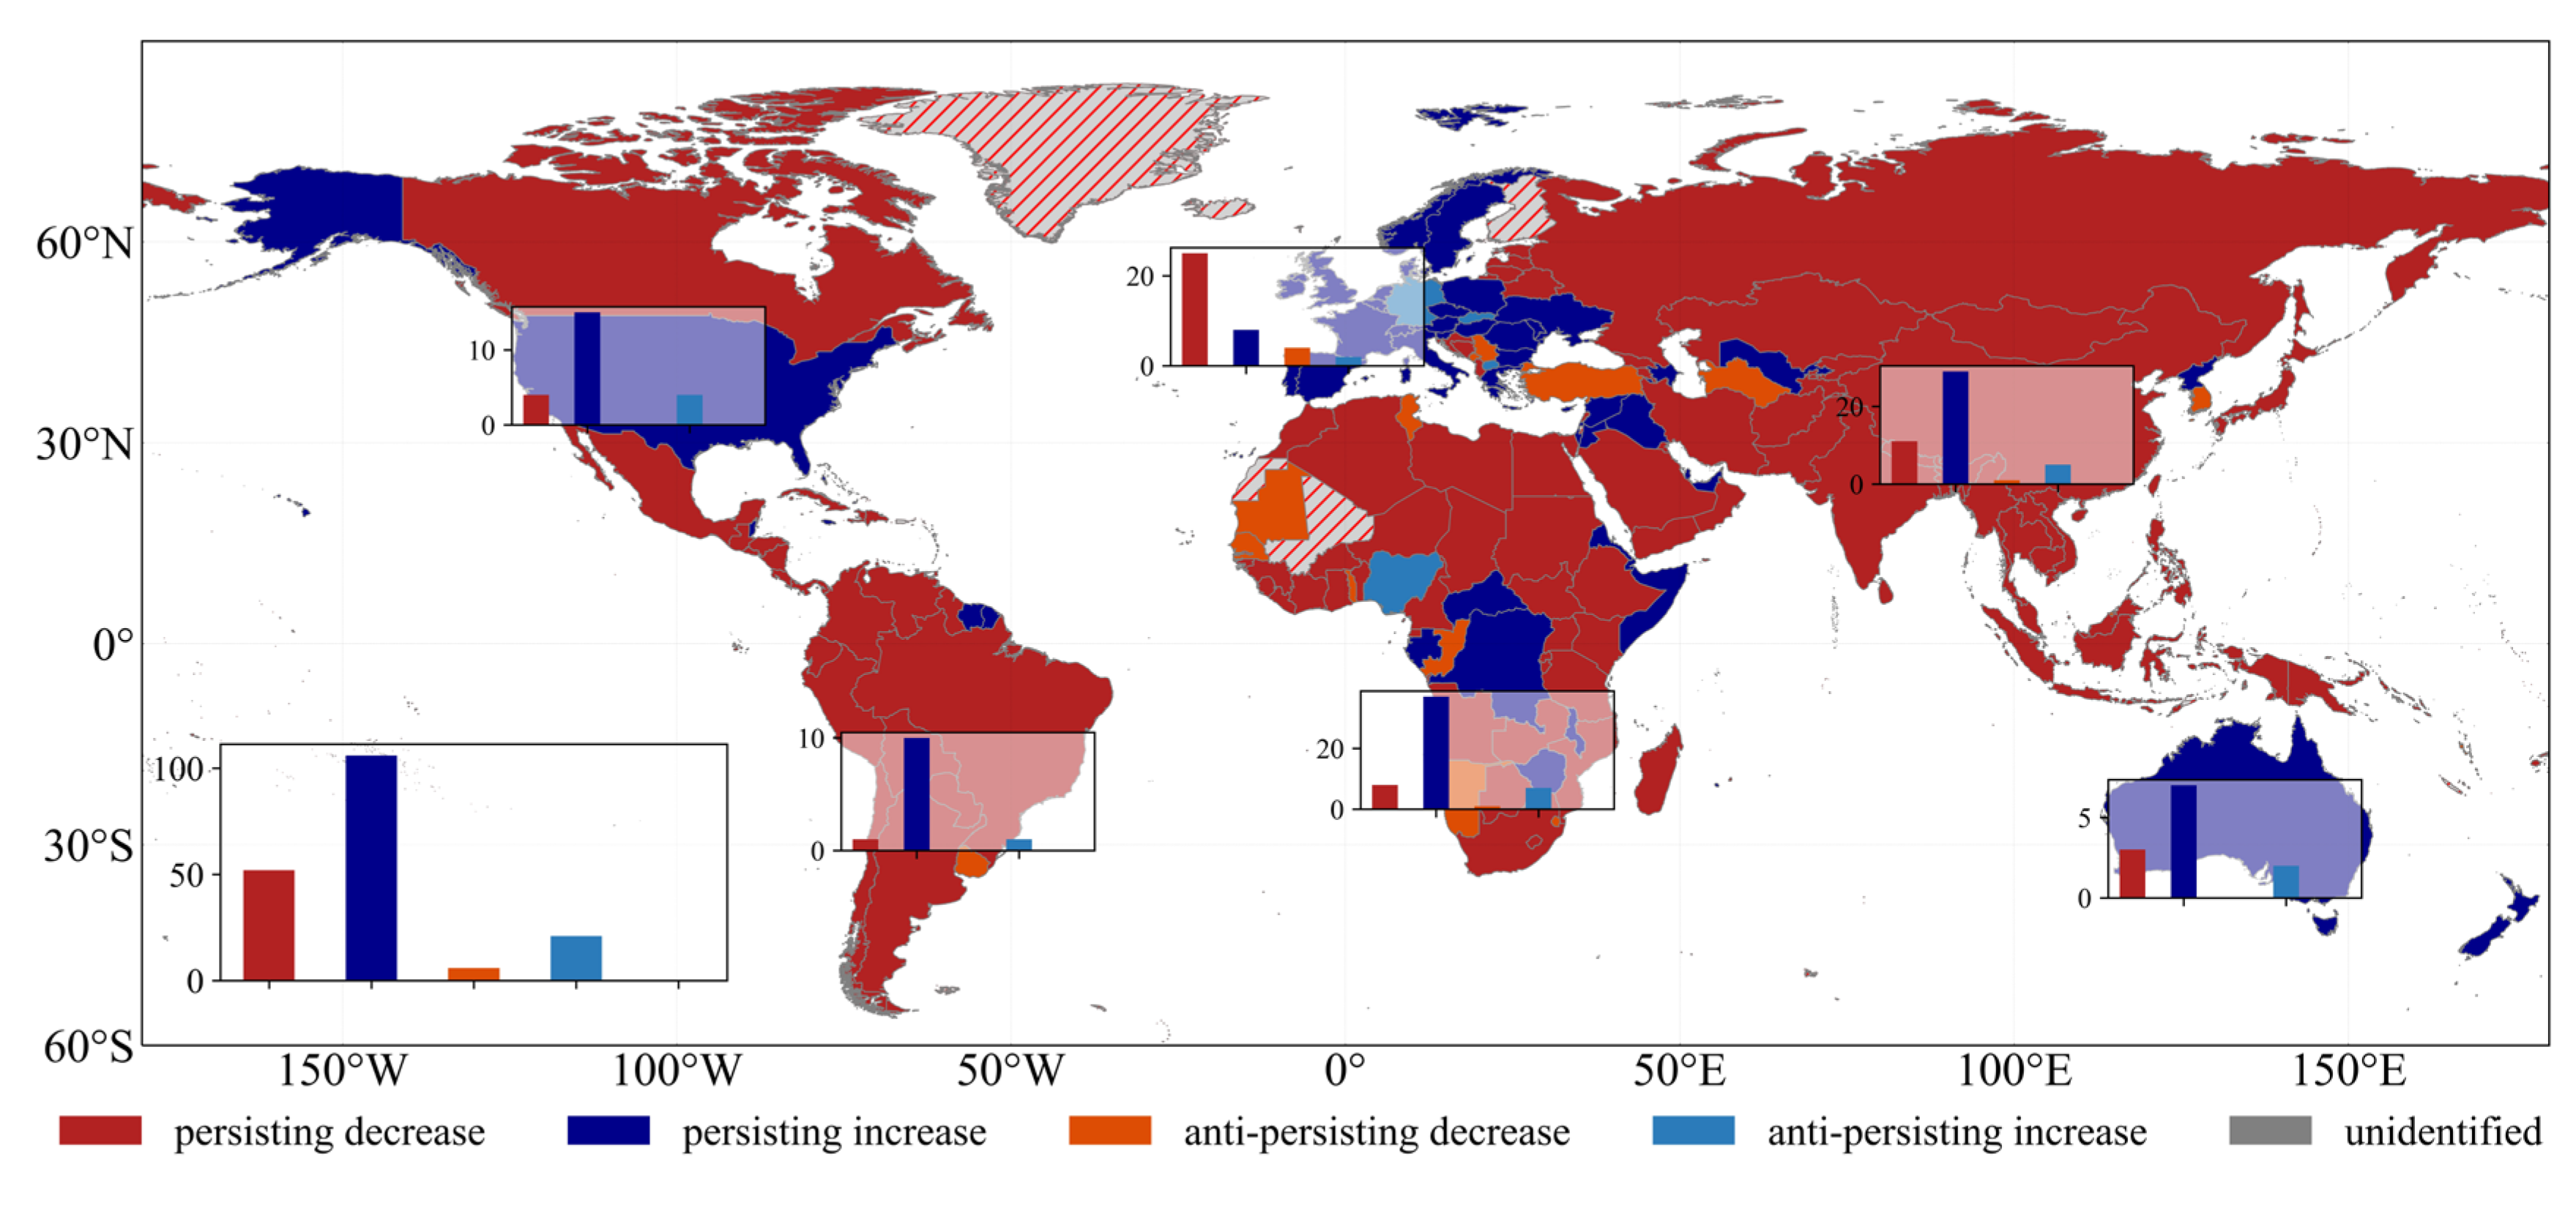
3.2. Future Trends in Per Capita Carbon Emissions
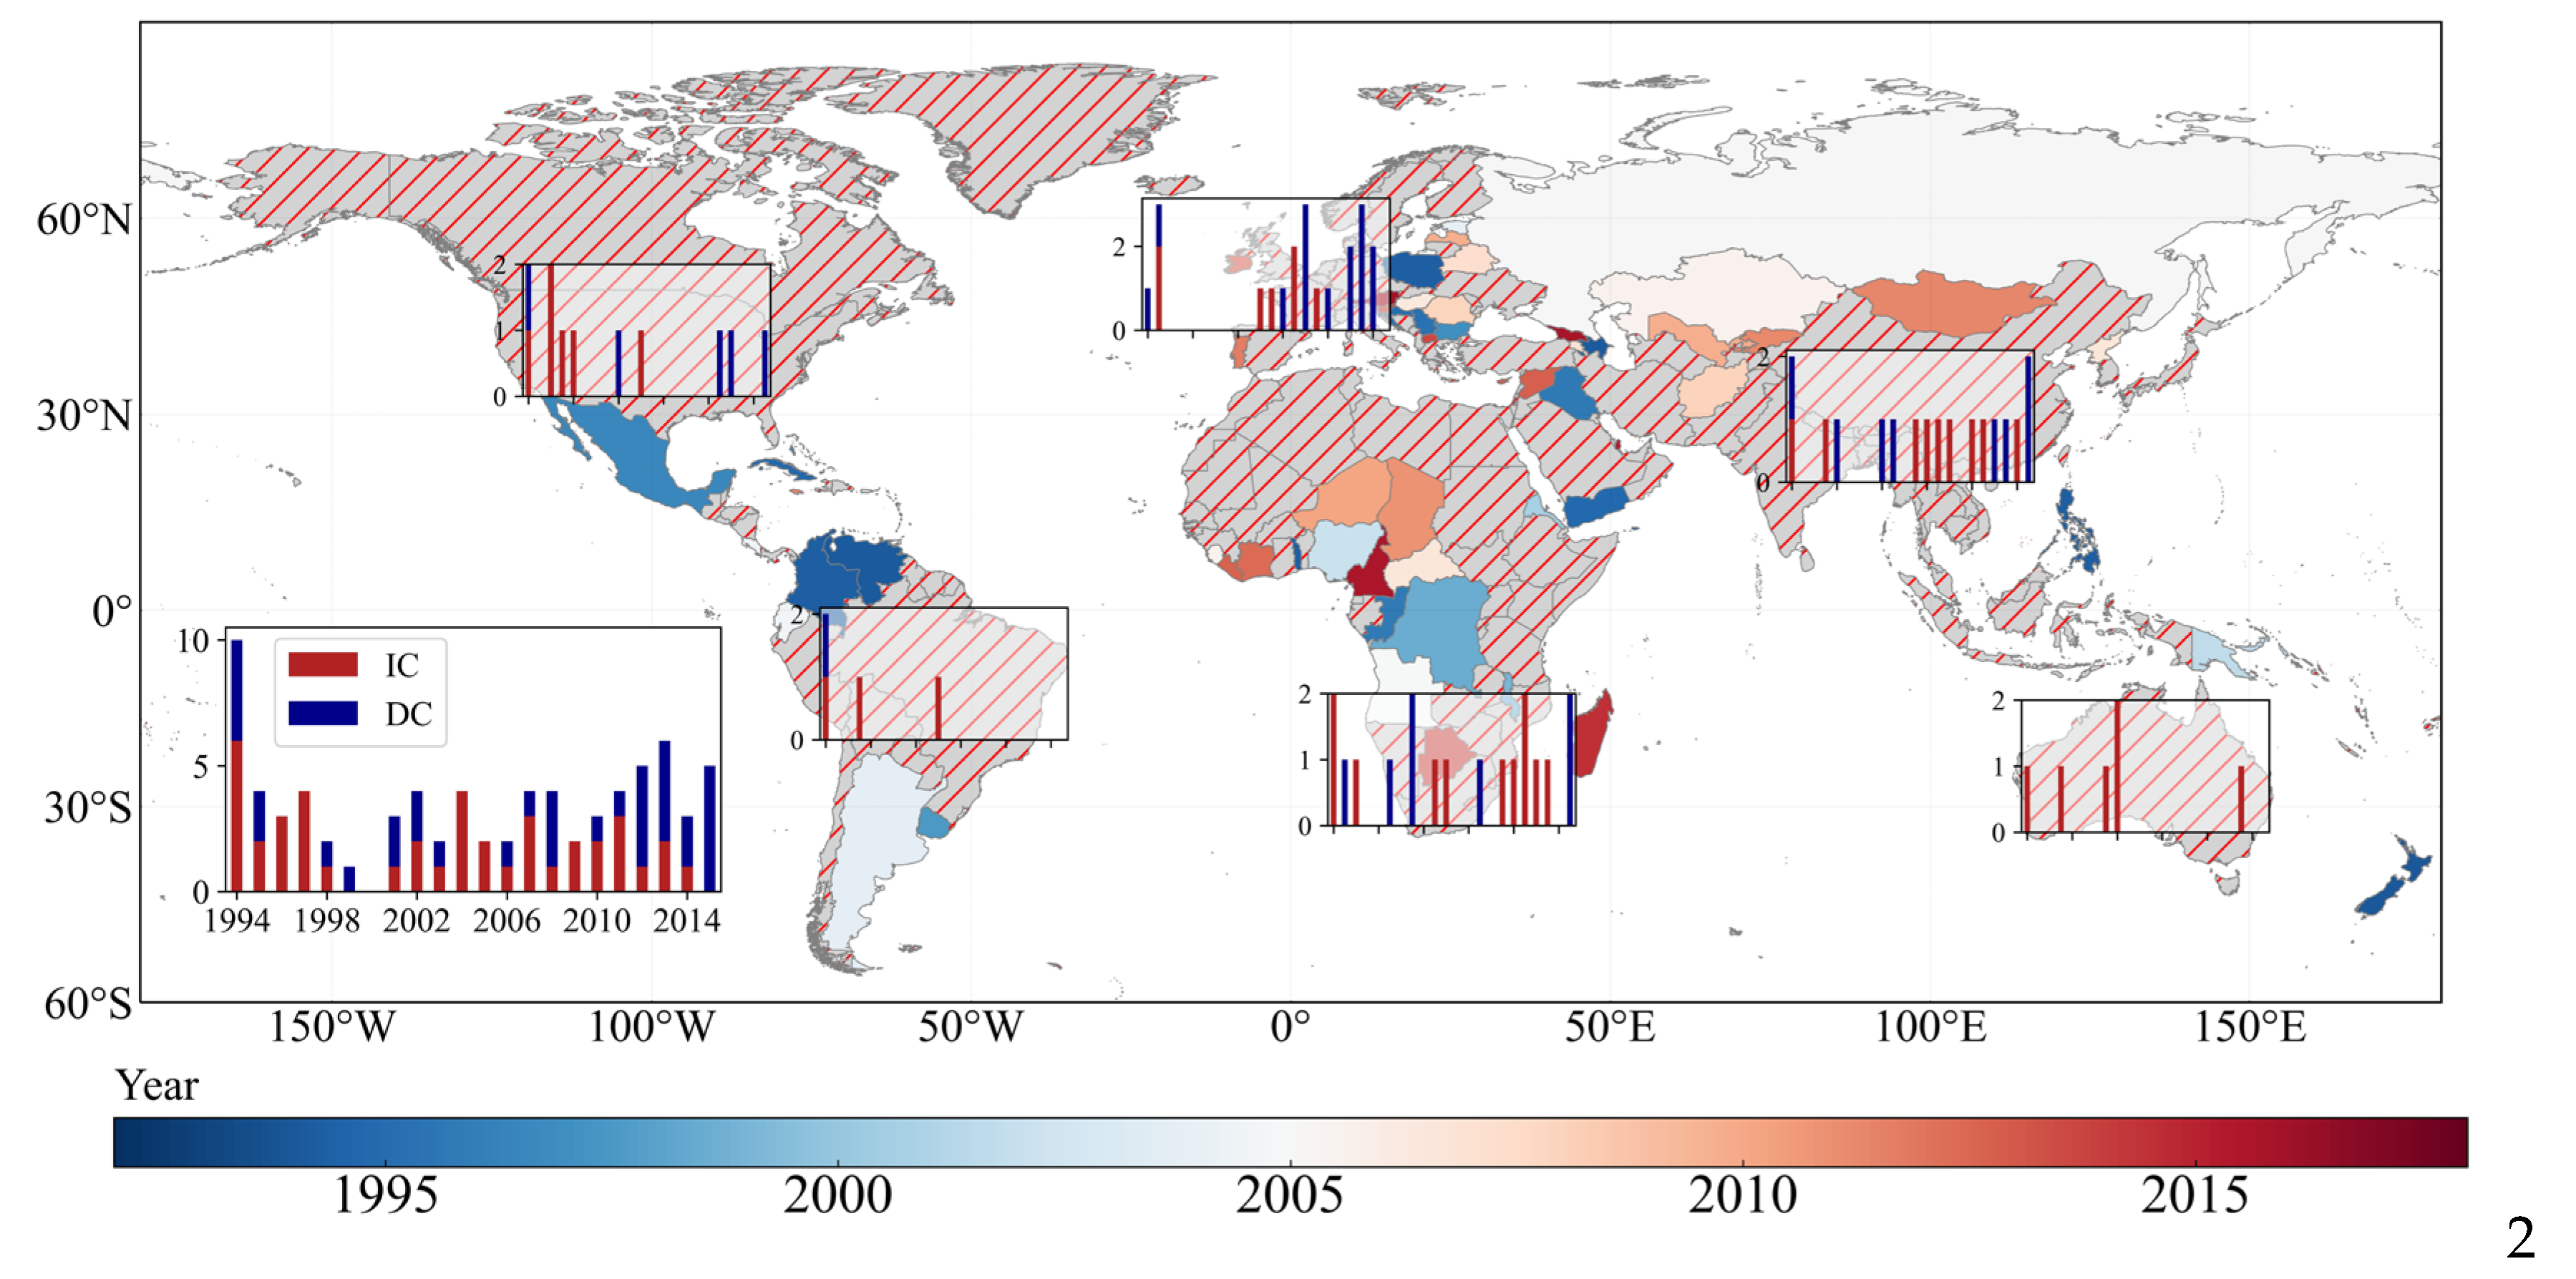
3.3. MK Change Test
3.4. The Gravity Center Shift for Per Capita Carbon Emissions
3.5. The Drivers for the Gravity Center Shift
4. Discussion
5. Conclusions
Author Contributions
Funding
Institutional Review Board Statement
Informed Consent Statement
Data Availability Statement
Conflicts of Interest
References
- Intergovernmental Panel on Climate Change (IPCC). Global Warming of 1.5 °C; IPCC: Geneva, Switzerland, 2018. [Google Scholar]
- Le Quéré, C.; Andrew, R.M.; Friedlingstein, P.; Sitch, S.; Hauck, J.; Pongratz, J.; Pickers, P.A.; Korsbakken, J.I.; Peters, G.P.; Canadell, J.G.; et al. Global Carbon Budget 2018. Earth Syst. Sci. Data 2018, 10, 2141–2194. [Google Scholar] [CrossRef]
- Sarmiento, J.L.; Gruber, N. Sinks for Anthropogenic Carbon. Phys. Today 2002, 55, 30–36. [Google Scholar] [CrossRef]
- Zhao, Y.; Chen, Y.; Wu, C.; Li, G.; Ma, M.; Fan, L.; Zheng, H.; Song, L.; Tang, X. Exploring the contribution of environmental factors to evapotranspiration dynamics in the Three-River-Source region, China. J. Hydrol. 2023, 626, 130222. [Google Scholar] [CrossRef]
- Friedlingstein, P.; Andrew, R.M.; Rogelj, J.; Peters, G.P.; Canadell, J.G.; Knutti, R.; Luderer, G.; Raupach, M.R.; Schaeffer, M.; van Vuuren, D.P.; et al. Persistent growth of CO2 emissions and implications for reaching climate targets. Nat. Geosci. 2014, 7, 709–715. [Google Scholar] [CrossRef]
- Ciais, P.; Wang, Y.; Andrew, R.; Bréon, F.M.; Chevallier, F.; Broquet, G.; Nabuurs, G.J.; Peters, G.; McGrath, M.; Meng, W.; et al. Biofuel burning and human respiration bias on satellite estimates of fossil fuel CO2 emissions. Environ. Res. Lett. 2020, 15, 074036. [Google Scholar] [CrossRef]
- Friedlingstein, P.; Jones, M.W.; O’Sullivan, M.; Andrew, R.M.; Bakker, D.C.E.; Hauck, J.; Le Quéré, C.; Peters, G.P.; Peters, W.; Pongratz, J.; et al. Global Carbon Budget 2021. Earth Syst. Sci. Data 2022, 14, 1917–2005. [Google Scholar] [CrossRef]
- Liu, H.; Ma, L.; Xu, L. Estimating spatiotemporal dynamics of county-level fossil fuel consumption based on integrated nighttime light data. J. Clean. Prod. 2021, 278, 123427. [Google Scholar] [CrossRef]
- Fang, Y.; Wang, L.; Ren, Z.; Yang, Y.; Mou, C.; Qu, Q. Spatial Heterogeneity of Energy-Related CO2 Emission Growth Rates around the World and Their Determinants during 1990–2014. Energies 2017, 10, 367. [Google Scholar] [CrossRef]
- Liu, Y.; Gruber, N.; Brunner, D. Spatiotemporal patterns of the fossil-fuel CO2 signal in central Europe: Results from a high-resolution atmospheric transport model. Atmos. Chem. Phys. 2017, 17, 14145–14169. [Google Scholar] [CrossRef]
- Keppel-Aleks, G.; Wennberg, P.O.; O’Dell, C.W.; Wunch, D. Towards constraints on fossil fuel emissions from total column carbon dioxide. Atmos. Chem. Phys. 2013, 13, 4349–4357. [Google Scholar] [CrossRef]
- Chen, C.; Bi, L. Study on spatio-temporal changes and driving factors of carbon emissions at the building operation stage- A case study of China. Build. Environ. 2022, 219, 109147. [Google Scholar] [CrossRef]
- Hundie, S.K. Income inequality, economic growth and carbon dioxide emissions nexus: Empirical evidence from Ethiopia. Environ. Sci. Pollut. Res. Int. 2021, 28, 43579–43598. [Google Scholar] [CrossRef] [PubMed]
- Wang, S.; Fang, C.; Guan, X.; Pang, B.; Ma, H. Urbanisation, energy consumption, and carbon dioxide emissions in China: A panel data analysis of China’s provinces. Appl. Energy 2014, 136, 738–749. [Google Scholar] [CrossRef]
- Zhang, W.; Xu, H. Effects of land urbanization and land finance on carbon emissions: A panel data analysis for Chinese provinces. Land Use Policy 2017, 63, 493–500. [Google Scholar] [CrossRef]
- Zhang, N.; Yu, K.; Chen, Z. How does urbanization affect carbon dioxide emissions? A cross-country panel data analysis. Energy Policy 2017, 107, 678–687. [Google Scholar] [CrossRef]
- Zhang, C.; Lin, Y. Panel estimation for urbanization, energy consumption and CO2 emissions: A regional analysis in China. Energy Policy 2012, 49, 488–498. [Google Scholar] [CrossRef]
- Sohail, A.; Du, J.; Abbasi, B.N.; Ahmed, Z. The nonlinearity and nonlinear convergence of CO2 emissions: Evidence from top 20 highest emitting countries. Environ. Sci. Pollut. Res. Int. 2022, 29, 59466–59482. [Google Scholar] [CrossRef]
- Li, X.; Lin, B. Global convergence in per capita CO2 emissions. Renew. Sustain. Energy Rev. 2013, 24, 357–363. [Google Scholar] [CrossRef]
- Zhang, X.; Gao, Z.; Geng, Y.; Tong, Y.W.; Kua, H.W.; Song, X.; Xu, Y.; Wu, F. Analysis of the Gravity Movement and Decoupling State of China’s CO2 Emission Embodied in Fixed Capital Formation. Energies 2020, 13, 6655. [Google Scholar] [CrossRef]
- Zhang, G.; Zhang, N.; Liao, W. How do population and land urbanization affect CO2 emissions under gravity center change? A spatial econometric analysis. J. Clean. Prod. 2018, 202, 510–523. [Google Scholar] [CrossRef]
- Zhang, M.; Wang, W. Analysis of spatial distribution of global energy-related CO2 emissions. Nat. Hazards 2014, 73, 165–171. [Google Scholar] [CrossRef]
- Li, A.; Zhang, A.; Zhou, Y.; Yao, X. Decomposition analysis of factors affecting carbon dioxide emissions across provinces in China. J. Clean. Prod. 2017, 141, 1428–1444. [Google Scholar] [CrossRef]
- Wang, M.; Feng, C. Decomposition of energy-related CO2 emissions in China: An empirical analysis based on provincial panel data of three sectors. Appl. Energy 2017, 190, 772–787. [Google Scholar] [CrossRef]
- Xu, R.; Lin, B. Why are there large regional differences in CO2 emissions? Evidence from China’s manufacturing industry. J. Clean. Prod. 2017, 140, 1330–1343. [Google Scholar] [CrossRef]
- Li, A.; Zhang, Z.; Zhang, A. Why are there large differences in performances when the same carbon emission reductions are achieved in different countries? J. Clean. Prod. 2015, 103, 309–318. [Google Scholar] [CrossRef]
- Zhao, H.; Hu, J.; Hao, F.; Zhang, H. Determinants of Carbon Dioxide Emissions and Their Peaking Prospect: Evidence From China. Front. Environ. Sci. 2022, 10, 913835. [Google Scholar] [CrossRef]
- Mann, H.B. Nonparametric tests against trend. Econom. J. Econom. Soc. 1945, 13, 245–259. [Google Scholar] [CrossRef]
- Kendall, M.G. Rank Correlation Methods; Charles Griffin: London, UK, 1975. [Google Scholar]
- Lanzante, J.R. Resistant, Robust and Non-Parametric Techniques for the Analysis of Climate Data: Theory and Examples, Including Applications to Historical Radiosonde Station Data. Int. J. Climatol. 1996, 16, 1197–1226. [Google Scholar] [CrossRef]
- Hurst, H.E. Methods of using long-term storage in reservoirs. Proc. Inst. Civ. Eng. 1956, 5, 519–543. [Google Scholar] [CrossRef]
- Qi, X.; Sheng, H. Hurst index analysis of social electricity consumption change trend based on R/S analysis. In Proceedings of the IOP Conference Series: Materials Science and Engineering, 2019 International Conference on Cloud Computing and Information Science (CCCIS 2019), Shenyang, China, 27–29 December 2019; Volume 750, p. 012150. [Google Scholar]
- Radovanovic, M.; Vyklyuk, Y.; Jovanovic, A.; Vukovic, D.; Milenkovic, M.; Stevancevic, M.; Matsiuk, N. Examination of the correlations between forest fires and solar activity using Hurst index. J. Geogr. Inst. Jovan Cvijic SASA 2013, 63, 23–31. [Google Scholar] [CrossRef]
- Beran, J. Statistics for Long-Memory Processes; Routledge: London, UK, 2017. [Google Scholar]
- Zhang, Y.; Zhang, J.; Yang, Z.; Li, J. Analysis of the distribution and evolution of energy supply and demand centers of gravity in China. Energy Policy 2012, 49, 695–706. [Google Scholar] [CrossRef]
- Xuejun, D.; Shuguo, W.; Wen, C. Evolution of population distribution and growth shift in Changjiang River Delat. Sci. Geogr. Sin. 2008, 28, 139–143. [Google Scholar]
- Song, Y.; Sun, J.; Zhang, M. Research on Evolution in the Center of Gravity and a Contribution Decomposition of Energy–Related CO2 Emissions at the Provincial Level in China. Emerg. Mark. Financ. Trade 2019, 57, 684–697. [Google Scholar] [CrossRef]
- Ye, M. Contribution decomposition approach to a system’s gravity movement. J. Syst. Manag. 2012, 21, 559–563. [Google Scholar]
- Song, Y.; Zhang, M. Study on the gravity movement and decoupling state of global energy-related CO2 emissions. J. Environ. Manag. 2019, 245, 302–310. [Google Scholar] [CrossRef]


| Country Code | Increase Rate | Country Code | Decrease Rate |
|---|---|---|---|
| OMN | 0.438733 | ARE | −0.46155 |
| GNQ | 0.272753 | LUX | −0.37608 |
| TKM | 0.266631 | NRU | −0.28774 |
| SAU | 0.261462 | DNK | −0.26567 |
| TTO | 0.25524 | USA | −0.20121 |
| CHN | 0.244688 | BHR | −0.16523 |
| BIH | 0.209024 | BEL | −0.16132 |
| KOR | 0.185939 | GBR | −0.15022 |
| MNE | 0.176898 | FIN | −0.14466 |
| IRN | 0.176237 | PRK | −0.13669 |
| MYS | 0.175769 | SWE | −0.13565 |
| KAZ | 0.148168 | UKR | −0.12939 |
| BRN | 0.123302 | SGP | −0.12824 |
| MNG | 0.120517 | CZE | −0.12356 |
| SYC | 0.120106 | AZE | −0.12325 |
| MDV | 0.110251 | LIE | −0.12103 |
| CHL | 0.093517 | SVK | −0.10171 |
| TUR | 0.08693 | DEU | −0.08428 |
| ZAF | 0.086919 | GAB | −0.08306 |
| MUS | 0.084493 | ISL | −0.07974 |
Disclaimer/Publisher’s Note: The statements, opinions and data contained in all publications are solely those of the individual author(s) and contributor(s) and not of MDPI and/or the editor(s). MDPI and/or the editor(s) disclaim responsibility for any injury to people or property resulting from any ideas, methods, instructions or products referred to in the content. |
© 2023 by the authors. Licensee MDPI, Basel, Switzerland. This article is an open access article distributed under the terms and conditions of the Creative Commons Attribution (CC BY) license (https://creativecommons.org/licenses/by/4.0/).
Share and Cite
Yang, S.; Wang, X.; Ge, Z.; Dong, G.; Ma, M.; Han, X. Global Per Capita CO2 Emission Trends. Atmosphere 2023, 14, 1797. https://doi.org/10.3390/atmos14121797
Yang S, Wang X, Ge Z, Dong G, Ma M, Han X. Global Per Capita CO2 Emission Trends. Atmosphere. 2023; 14(12):1797. https://doi.org/10.3390/atmos14121797
Chicago/Turabian StyleYang, Shuai, Xuemei Wang, Zhongxi Ge, Guanyu Dong, Mingguo Ma, and Xujun Han. 2023. "Global Per Capita CO2 Emission Trends" Atmosphere 14, no. 12: 1797. https://doi.org/10.3390/atmos14121797
APA StyleYang, S., Wang, X., Ge, Z., Dong, G., Ma, M., & Han, X. (2023). Global Per Capita CO2 Emission Trends. Atmosphere, 14(12), 1797. https://doi.org/10.3390/atmos14121797