Abstract
The high altitude in mountainous regions results in lower atmospheric pressure, oxygen concentration and temperature, leading to lower combustion efficiency in motor vehicles. Therefore, there may be differences in carbon dioxide (CO2), carbon monoxide (CO), and nitrogen oxides (NOx) emissions characteristics at different altitudes. In this study, a portable emission measurement system was used to investigate the effects of varying elevations on the emission factors of CO2, CO, and NOx on diesel and gasoline-powered vehicles at altitudes ranging from 2270 to 4540 m in the Qinghai–Tibet Plateau of China. Additionally, the influencing factors of CO2, CO, and NOx emissions were studied. Results showed that the CO2, CO, and NOx emission factors for diesel vehicles varied in the range of 161.83–195.54, 0.59–0.77, and 4.61–6.58 g/km; the population means with 90% confidence intervals were 178.54, 0.68, and 5.60 g/km, respectively. For gasoline vehicles, the CO2, CO, and NOx emission factors varied in the range of 161.66–181.98, 0.95–1.06, and 0.12–0.25 g/km; the population means with 90% confidence intervals were 171.82, 1.01, and 0.19 g/km, respectively. Overall, the emission factors of diesel vehicles were higher than those of gasoline vehicles, and the emissions increased with increasing altitude. Atmospheric pressure was identified as the primary environmental factor affecting CO2, CO, and NOx emissions. As the speed of motor vehicles increased, the emission of CO2 also increased, while there was a quadratic relationship with acceleration. This study provides a reference and guidance for vehicle pollution control in high-altitude regions.
1. Introduction
Vehicle emissions refer to the waste gases and particulate matter produced during the combustion of fuels. These emissions contain a range of harmful chemicals to the environment and human health. Major pollutants from vehicle emissions include carbon dioxide (CO2), nitrogen oxides (NOx), carbon monoxide (CO), volatile organic compounds (VOCs), particulate matter (PM), and more. The background of vehicle emissions can be traced back to the industrial era. With the widespread use of automobiles and an increase in transportation, vehicle emissions have gradually become a significant factor in urban air quality and global climate change. The combustion of fossil fuels such as gasoline and diesel not only releases a substantial amount of carbon dioxide, contributing to tailpipe gas emissions, but also generates other harmful substances, negatively impacting air quality and human health.
The emission characteristics of vehicles in plateau and high-altitude regions are influenced by geographical and meteorological conditions, leading to significant differences compared to low-altitude areas: (1) Effect of Oxygen Concentration: The oxygen concentration in high-altitude and plateau regions is relatively low, which can impact the combustion efficiency of internal combustion engines. Vehicles may need to adjust fuel mixtures and air–fuel ratios to accommodate lower oxygen levels, or incomplete combustion and increased emissions may result. (2) Impact of Temperature and Atmospheric Pressure: High-altitude and plateau regions generally experience lower temperatures and atmospheric pressure. This can cause variations in the combustion process, affecting engine performance. Vehicles may require special engine adjustments and control systems to adapt to these changes. (3) Engine Load Variation: In high-altitude areas, engines may need to bear greater loads to overcome changes in elevation. This could lead to engines operating at higher loads, producing more exhaust gases and particulate matter. (4) Steep Inclines: High-altitude regions often feature steep inclines, requiring vehicles to exert more power when climbing. To cope with this situation, engines may need more fuel, contributing to increased emissions. (5) Increased Use of Braking Systems: In high-altitude regions, due to the unique nature of mountainous roads, vehicles may use braking systems more frequently. This heightened usage can result in wear and tear on the braking system and the generation of particulate matter.
Thus, due to differences in altitude, the high-altitude regions exhibit significant variations in environmental factors such as atmospheric pressure, oxygen concentration, air humidity, and temperature compared to plain regions [1,2]. These differences can potentially affect the combustion efficiency and emission performance of motor vehicles, thereby leading to variations in carbon emissions characteristics of motor vehicles at different altitudes.
Vehicle emission factor refers to the amount of pollutants released into the atmosphere by vehicles during the combustion of fuel, typically expressed per unit of distance traveled or per unit of fuel consumed. The study of motor vehicle tailpipe gas emission factors in high-altitude areas has gained widespread attention in recent years. Researchers have estimated the tailpipe gas emission factors of motor vehicles in high-altitude regions through field measurements and simulation experiments [1]. These studies have found that due to the different climatic conditions in high-altitude areas, motor vehicles exhibit lower combustion efficiency, resulting in relatively higher tailpipe gas emission factors [2].
Furthermore, the influencing factors behind the high values of motor vehicle tailpipe gas emission factors in high-altitude areas have been systematically studied. Firstly, climate conditions play a significant role, as the thin oxygen and low temperatures in high-altitude areas can affect the combustion efficiency of motor vehicles, leading to increased carbon emissions [3,4]. Secondly, road conditions are a contributing factor, as high-altitude areas often have relatively poor road conditions with rugged terrain and steep slopes, which can increase energy consumption and emissions from motor vehicles [5,6]. Thirdly, fuel quality is another important factor, as it has a significant impact on the combustion efficiency and carbon emissions of motor vehicles [7,8]. However, there is still a lack of quantitative analysis on the coupling relationship between motor vehicle tailpipe gas emission factors, and vehicle driving characteristics and environmental conditions in high-altitude areas. This limitation hinders the development of energy-saving and emission reduction policies for motor vehicles in high-altitude regions, as well as the optimization of automobile designs.
Therefore, this study utilized a Portable Emission Measurement System (PEMS) to conduct actual testing experiments on the CO2, CO, and NOx emission factors of diesel-powered and gasoline-powered vehicles in the Qinghai–Tibet Plateau region of China, at altitudes ranging from 2270 to 4540 m. The influencing factors of CO2, CO, and NOx emission factors were systematically investigated, including vehicle driving characteristics, atmospheric pressure distribution, and temperature distribution across different altitude ranges. By comparing the CO2, CO, and NOx emission characteristics of representative vehicle models at different altitudes, a comprehensive understanding of the emission characteristics and influencing factors of motor vehicles in high-altitude areas can be obtained, providing important evidence for improving environmental quality and formulating relevant policies. Furthermore, this research can serve as a reference for vehicle pollution control in other plateau regions.
2. Materials and Methods
2.1. Testing Equipment
Vehicle onboard emission testing is the direct installation of a PEMS inside a vehicle during actual road driving. It collects motor vehicle driving parameters and pollutant emission concentrations on a per-second basis, providing reliable data for the analysis of motor vehicle exhaust emission characteristics. Onboard testing, as an emerging method for motor vehicle exhaust testing in recent years, utilizes onboard exhaust emission testing instruments to obtain dynamic pollutant emission data from vehicles during actual road driving [9,10,11]. It has the advantages of responsiveness, shock resistance, real-time data acquisition, and stability [12,13]. Its benefit lies in the ability to obtain pollutant emission information under real road driving conditions, thus providing reliable data for the analysis of motor vehicle exhaust emissions.
This study employed the SEMTECH-DS onboard emission testing instrument to conduct tests on the gaseous pollutants (CO, CO2, and NOx, etc.) emitted by vehicles on actual roads. The SEMTECH-DS is a high-precision and integrated onboard exhaust analysis system manufactured by SENSORS company in the United States. It mainly consists of the SEMTECH-DS onboard exhaust analyzer (Figure 1a), SEMTECH-EFM3 onboard exhaust flow meter (Figure 1b), environmental sensors, GPS module, and other components. The specification of SEMTECH-DS on-board vehicle emission analyzer is shown in Table 1.
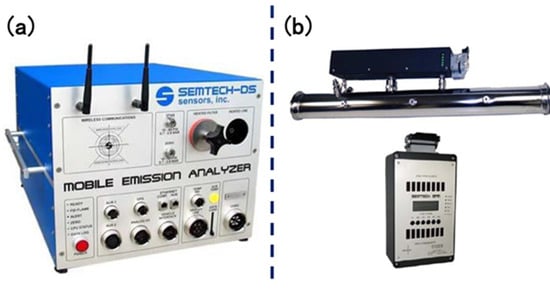
Figure 1.
The SEMTECH-DS onboard emission testing instrument. (a) the SEMTECH-DS onboard exhaust analyzer, (b) the SEMTECH-EFM3 onboard exhaust flow meter.

Table 1.
The specification of SEMTECH-DS on-board vehicle emission analyzer.
The SEMTECH-DS host has dimensions of length 432 mm, width 549 mm, and height 355 mm. To facilitate more precise measurements, the SEMTECH-DS was placed in the trunk of the test vehicle. Exhaust gases were connected to the flow meter of the SEMTECH-DS through semi-rigid, high-temperature-resistant, and stable material pipes. The sampling gas was transported to the onboard SEMTECH-DS analyzer host via threaded connection interfaces, connecting the sampling tube for analysis.
2.2. Testing Vehicle Model
Through the analysis and investigation of traffic statistics data, diesel-powered vehicles and gasoline-powered vehicles are the two most common types of motor vehicles on the roads in the Qinghai–Tibet Plateau region. Therefore, this study selected two types of vehicles with high ownership and activity levels as representative vehicles for onboard testing. These vehicles include a light-duty diesel vehicle (LDDV) that meets the China National IV emission standard (Figure 2a) and a light-duty gasoline vehicle (LDGV) that meets the China National V emission standard (Figure 2b). Among them, the Jiangling Transit is equipped with a turbocharged diesel engine, with a fuel efficiency of 7.6 L/100 km and an engine condition indicating a total mileage of 138,404 km, with regular maintenance performed annually. The Dodge Journey, on the other hand, features a naturally aspirated gasoline engine, achieving a fuel efficiency of 9.6 L/100 km. Its engine condition shows a total mileage of 140,778 km, with regular maintenance conducted each year. Characteristics of test vehicles in this study can be found in Table 2.
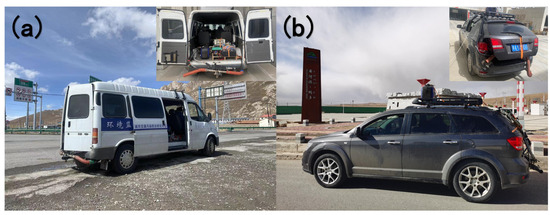
Figure 2.
Vehicle PEMS testing schematic. (a) China IV diesel vehicle, (b) China V gasoline vehicle.

Table 2.
Characteristics of test vehicles in this study.
The LDDV employs Selective Catalytic Reduction (SCR) post-treatment technology, while the LDGV utilizes three-way catalytic post-treatment technology, both of which comply with relevant national standards. The National IV emission standard for motor vehicles specifies that HC emissions should be below 0.1 g/km, CO emissions below 1.0 g/km, NOx emissions below 0.08 g/km, with no PM requirement. The National V emission standard for motor vehicles specifies that HC emissions should be below 0.068 g/km, CO emissions below 1.0 g/km, NOx emissions below 0.06 g/km, and PM emissions below 4.5 mg/km. During the experimental process, the vehicles carried three passengers and testing instruments. The payload of the vehicles was kept the same for both experiments, with only the vehicle’s own weight differing. Therefore, the experimental process has effectively controlled the impact of vehicle payload variations.
2.3. Testing Route
Figure 3 illustrates the selected test route in this study. The starting point is Chengxi District, Xining City, Qinghai Province (Altitude: 2270 m), and the endpoint is the toll station in Maduo County, Golog Prefecture (Altitude: 4540 m). The total distance is 467 km, with an altitude difference of approximately 2400 m. Each segment of measurement in this study was performed in the range of the altitude 2270–4540 m. This test route includes major road types in high-altitude areas and adequately reflects the actual driving conditions of vehicles. It also incorporates altitude and terrain changes to characterize the impact of altitude and topography on motor vehicle CO2, CO, and NOx emissions.
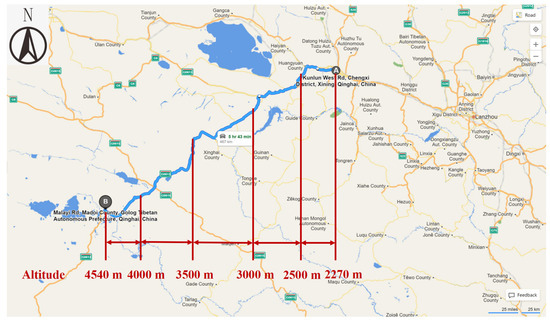
Figure 3.
Driving route for emission measurement at the Qinghai–Tibet Plateau region.
2.4. Quality Control and Assurance
PEMS began sampling and measuring exhaust parameters and recording environmental parameters before the vehicle started. The vehicle’s driving speed and location were measured and recorded using GPS. Throughout the testing period, continuous exhaust sampling and recording of environmental data were conducted. Exhaust sampling also continued when vehicle was idling. Prior to each test, the SEMTECH-DS was preheated for approximately 60 min, and zeroing and calibration operations were performed using high-purity N2 and various gaseous pollutant standard gases to ensure the accuracy of the test results. During the testing process, the analyzer’s operational status was checked every hour to confirm its proper functioning. The data recorded during these checks were not used for emission calculations. The emission factor calculation formula is shown in Equation (1).
where EFp represents the pollutant emission factor in grams per kilometer (g/km); ERp,t is the emission rate of pollutant p at time t in grams per second (g/s); T is the travel time; L is the corresponding travel distance in kilometers (km).
At the end of the experiment, instrument calibration was repeated, and sufficient time was allocated to ensure the responsiveness of the PEMS. LDDV and LDGV traveled at the same speed across all altitudes, with an average driving speed of approximately 75 km/h for both vehicles. During testing, data were collected at 1 s intervals for a duration of 12 h and a distance of 467 km.
3. Results and Discussion
3.1. Emission Factors for Test Vehicles Based on Varying Altitudes
This study primarily analyzes the emission factors of CO2, CO, and NOx at different altitude ranges. Emission factors represent the pollutants emitted by motor vehicles per unit distance traveled and provide an intuitive understanding of the relationship between pollutants and driving conditions [14,15]. Figure 4 shows the emission factors of CO2, CO, and NOx for the two test vehicles at different altitude ranges. In the altitude ranges of [2000, 2500 m), [2500, 3000 m), [3000, 3500 m), and [3500, 4000 m), the emission factors exhibit varying degrees of differences. The CO2 emission factors for the diesel vehicle in the four altitude ranges are: 161.83 g/km, 169.44 g/km, 191.84 g/km, and 195.54 g/km; the CO emission factors are: 0.59 g/km, 0.57 g/km, 0.64 g/km, and 0.77 g/km; the NOx emission factors are: 4.61 g/km, 5.63 g/km, 5.66 g/km, and 6.58 g/km. For the gasoline vehicle, the CO2 emission factors in the four altitude ranges are: 161.66 g/km, 164.86 g/km, 180.26 g/km, and 181.98 g/km; the CO emission factors are: 0.96 g/km, 0.76 g/km, 1.06 g/km, and 0.95 g/km; the NOx emission factors are: 0.16 g/km, 0.15 g/km, 0.25 g/km, and 0.12 g/km. The vehicles moved at the same speed in all the altitude ranges.
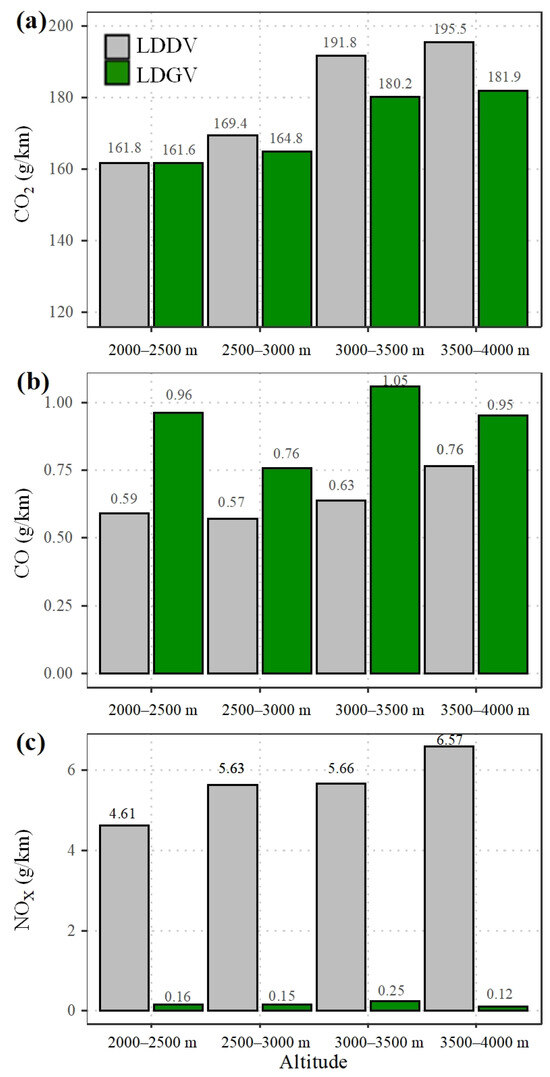
Figure 4.
Mean emission factors of (a) CO2, (b) CO, and (c) NOx at different elevation ranges.
Among them, the CO2 emission factors for both vehicles show an upward trend with increasing altitude. The increase in emission factors for the diesel vehicle is 4.5%, 11.6%, and 1.9% in the respective altitude ranges, while for the gasoline vehicle, it is 1.9%, 8.5%, and 9.5%. The increasing trend of CO and CO2 emission factors is generally consistent with the magnitude of altitude increase. The variation trend in NOx emission factors in different altitude ranges is slightly different. Due to the inconsistent impact of altitude on the combustion process of the engine, the NOx emission of the diesel vehicle does not continuously increase with altitude but reaches a peak in the altitude range of [2500, 3000 m), while showing fluctuating changes in the other three altitude ranges. In the altitude range of 2000–400 m, the variation in air humidity ranged from 28.7% to 9.2%. Additionally, with the increase in altitude, there was a stable decreasing trend in air humidity. Increasing air humidity lowers the combustion temperature of the engine, resulting in smaller NOx emission factors at lower altitudes. In this experiment, the NOx emission factor of LDDV significantly increased with the elevation, highlighting that air humidity is a major influencing factor for the NOx emission from the LDDV. In previous PEMS studies conducted at altitudes exceeding 2 km, a common observation was the consistent increase in CO2, CO, and NOx emission factors with the elevation. Moreover, as the altitude rises, the magnitude of this increase becomes more pronounced. However, in our study, the emission factor for CO demonstrated an overall fluctuating pattern. The numerical ranges of CO2, CO, and NOx emission factors in this study are essentially consistent with those from previous PEMS tests conducted at altitudes exceeding 2 km [3,4,5,6,7].
3.2. Influence of Varying Altitudes on the Emission Factors
3.2.1. Effects of Driving Characteristics
Figure 5 and Figure 6 illustrate the coupled effects of speed and acceleration on CO2 emissions for diesel and gasoline vehicles at different altitudes. The results indicate that motor vehicle CO2 emissions exhibit a complex functional relationship with speed and acceleration, which also vary with changes in altitude ranges. The figures represent instantaneous emission conditions, hence the use of units in g/s.
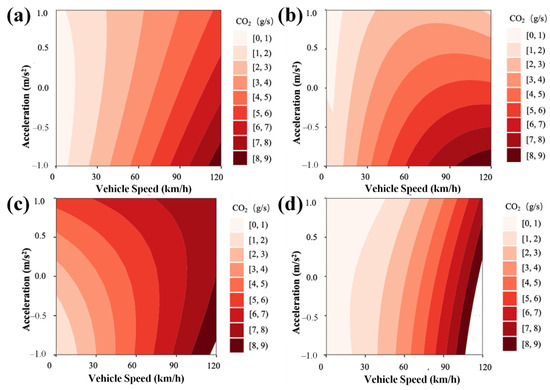
Figure 5.
The coupled effects of speed and acceleration in different altitude ranges on the CO2 emission rate of China IV diesel vehicles. (a) 2000–2500 m, (b) 2500–3000 m, (c) 3000–3500 m, (d) 3500–4000 m.
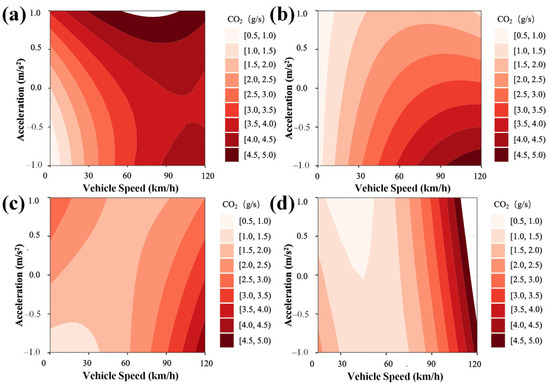
Figure 6.
The coupled effects of speed and acceleration in different altitude ranges on the CO2 emission rate of China V gasoline vehicles. (a) 2000–2500 m, (b) 2500–3000 m, (c) 3000–3500 m, (d) 3500–4000 m.
As shown in Figure 5 and Figure 6, carbon emissions of vehicles in different altitude ranges are directly proportional to the driving speed, with a more pronounced effect during deceleration. However, the relationship becomes more complex when considering acceleration. At the same speed, the carbon dioxide emission is inversely proportional to the acceleration, meaning that the highest CO2 emissions occur during deceleration or braking at high speeds. This relationship becomes more pronounced with increasing altitude. This phenomenon is primarily due to the decreased combustion efficiency caused by the high-altitude environment. In high-altitude regions, the thin air results in insufficient oxygen supply for fuel combustion, leading to a decrease in combustion efficiency [16,17]. This leads to an increase in unburned carbon black and other harmful substances, resulting in a decrease in the proportion of carbon dioxide emissions. During high-speed operation, the engine requires more fuel consumption to maintain the same speed and power output, thus generating more carbon dioxide emissions [18,19]. However, during negative acceleration, although the engine continues to run, there is a reduced fuel supply, resulting in a leaner air–fuel mixture and more complete combustion. Particularly during high-speed driving, the engine needs to provide stable hydraulic pressure for the brakes and tires, leading to more complete combustion and increased production of carbon dioxide as a byproduct of complete combustion. As altitude increases, the oxygen content decreases, amplifying this phenomenon.
Compared to diesel vehicles, gasoline vehicles exhibit a more complex relationship between CO2 emissions, speed, and acceleration (Figure 6). Overall, the carbon emission patterns of gasoline vehicles are similar to those of diesel vehicles, but there are differences in emission factors under different altitude ranges and driving conditions. For example, in the altitude range of 2000–2500 m, there is a peak in CO2 emissions when the vehicle operates under high-speed and high-acceleration conditions. In contrast, in the altitude range of 3000–4000 m, emissions are lower during medium- to low-speed driving conditions (speed < 80 km/h), and the impact of acceleration is relatively smaller.
These differences are attributed to the different intake methods of the engines. The gasoline engine used in the experiment adopts a ‘naturally aspirated’ intake method, which, compared to the ‘turbocharged’ engine of the diesel vehicle, has lower intake pressure and, consequently, lower output power and combustion efficiency. In the low-speed driving range, the CO2 emissions are also lower for gasoline vehicles compared to diesel vehicles. However, turbocharged engines have a more complex structure, which can increase fuel consumption [20]. Additionally, during low-speed driving, the turbocharger may require time to ‘respond’ and generate sufficient pressure [21,22]. As shown in Figure 5a and Figure 6a, naturally aspirated gasoline vehicles have faster acceleration response times in low-altitude regions, resulting in higher carbon emissions.
In general, diesel vehicles have higher emission rates compared to gasoline vehicles, which are determined by the fuel type and engine condition. In terms of fuel, diesel has a higher density than gasoline, and diesel fuel has a higher C/H ratio in its chemical composition. As a result, diesel combustion generates more CO2 emissions. Additionally, diesel engines are generally larger and heavier than gasoline engines, requiring more fuel consumption to provide sufficient power, which also leads to higher carbon emissions.
3.2.2. Effects of Atmospheric Pressure and Temperature
Figure 7 illustrates the variations in atmospheric pressure and environmental temperature across different altitude ranges. The PEMS tests for the LDDV and the LDGV started in the early morning and continued for 12 h, resulting in a gradual increase in temperature over time. Due to the different dates of the two tests, the distribution of specific meteorological parameters varies, but the overall trend remains essentially consistent. As altitude increases, the air pressure and oxygen concentration decrease. This results in insufficient oxygen supply during the engine combustion process, requiring increased throttle input to maintain stable vehicle speed, leading to higher fuel consumption and increased pollutant emissions [23,24]. Additionally, the emission of NOx is influenced by the temperature generated during the combustion process. As altitude rises, the air becomes thinner, reducing the cooling effect and raising the maximum temperature inside the combustion chamber. Consequently, the emission of NOx exhibits a unimodal or oscillating pattern within a certain range.
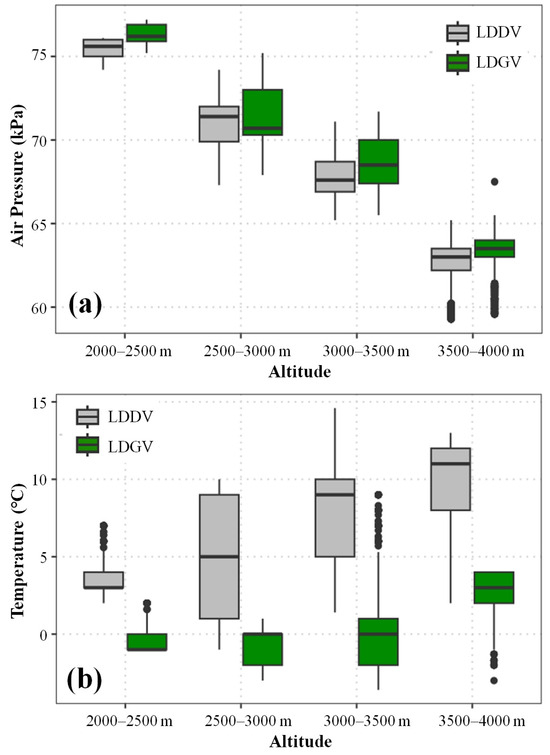
Figure 7.
The distribution of atmospheric pressure (a) and distribution of temperature (b) in different altitude ranges.
As the altitude increases, the CO2 and CO emission factors of diesel vehicles gradually increase, while the NOx emission factor shows a fluctuating trend. Specifically, for diesel vehicles, the CO2 emission factor increases by approximately 20% from the lowest to the highest altitude point. The NOx emission factor reaches its peak in the altitude range of [2500, 3000 m], while the remaining three altitude ranges exhibit fluctuating trends. On the other hand, gasoline vehicles show smaller increases in CO2 and CO emission factors compared to diesel vehicles, while the NOx emission factor demonstrates irregular fluctuations. Specifically, for gasoline vehicles, the CO2 increases by less than 15% from the lowest to the highest altitude point. The NOx emission factor also exhibits irregular fluctuating changes.
Figure 8 shows the coupled impact of meteorological factors (temperature, atmospheric pressure) on the CO2 emission rate of vehicles. The results indicate that both types of vehicles exhibit similar patterns of CO2 emissions influenced by meteorological factors, with diesel vehicles generally emitting slightly more CO2 than gasoline vehicles. Specifically, a decrease in atmospheric pressure significantly increases CO2 emissions, while temperature variations have a relatively smaller impact on CO2 emissions.
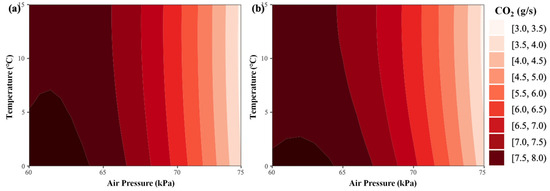
Figure 8.
The impact of temperature and atmospheric pressure on CO2 emissions. (a) Diesel vehicle, (b) Gasoline vehicle.
In high-altitude regions, the reduction in atmospheric pressure leads to a decrease in air density, resulting in reduced collisions between oxygen molecules and fuel during the combustion process, thereby exacerbating incomplete combustion [6,25]. During high-speed operation, the engine requires more fuel to maintain the same speed and power output, resulting in higher CO2 emissions. Additionally, an increase in temperature intensifies the combustion reaction, leading to an increase in CO2 emissions. However, at high altitudes, the impact of temperature on CO2 emissions generated by vehicle combustion is relatively small due to the lower temperatures. As shown in the graph, under lower temperature conditions, temperature variations still have a certain influence on CO2 emissions, although they are not the primary factor. The fact that the boundaries of the color blocks in the figure are all vertical indicates that CO2 emissions are primarily influenced by atmospheric pressure. The impact of temperature variations is confined within the influence of atmospheric pressure.
In addition, the variation trend of emission factors between vehicles is mainly attributed to the differences in fuel type and intake method. Specifically, gasoline combustion requires a proper mixture of oxygen and fuel, followed by ignition through a spark plug to generate energy [26]. On the other hand, diesel combustion involves direct fuel injection into the combustion chamber at high temperature and pressure, resulting in self-ignition and heat generation [27,28]. Therefore, at different altitudes, as the oxygen concentration decreases, the growth rate of CO2 emissions from gasoline vehicles slows down due to limitations in the combustion process. Gasoline fuel itself has a higher oxygen content, requiring less oxygen during combustion, making it less susceptible to the influence of altitude on oxygen concentration and resulting in a slower increase in CO2 emissions compared to diesel vehicles. Conversely, the combustion method of diesel vehicles leads to a stronger dependence on environmental conditions. As altitude increases, diesel vehicles require higher fuel consumption and increased turbocharging to compensate for the lower oxygen concentration. Consequently, the growth rate of CO2 emissions from diesel vehicles accelerates. Additionally, the lower NOx emissions in gasoline vehicles are attributed to their relatively lower combustion temperatures and the use of devices such as three-way catalytic converters to effectively control NOx emissions.
4. Conclusions
This study has investigated gas emission rates based on different elevation ranges using a portable emission measurement system. The effects of driving characteristics and environmental factors on the emission rates were examined on gasoline and diesel-powered vehicles. Actual testing experiments were conducted on diesel and gasoline-powered vehicles at altitudes ranging from 2270 m to 4540 m in the Qinghai–Tibet Plateau region of China. CO2, CO, and NOx emission factors at different altitudes were calculated, and a comprehensive analysis was performed considering factors such as vehicle type, engine conditions, and environmental factors.
The results showed that the CO2, CO, and NOx emission factors for diesel vehicles varied in the range of 161.83–195.54 g/km, 0.59–0.77 g/km, and 4.61–6.58 g/km; the population means with 90% confidence intervals were 178.54, 0.68, and 5.60 g/km, respectively. For gasoline vehicles, the CO2, CO, and NOx emission factors varied in the range of 161.66–181.98 g/km, 0.95–1.06 g/km, and 0.12–0.25 g/km; the population means with 90% confidence intervals was 171.82, 1.01, and 0.19 g/km, respectively. In terms of driving characteristics, as the driving speed of motor vehicles increased, the CO2 emissions also increased, while their relationship with acceleration followed a quadratic function. The CO2, CO, and NOx emission factors of diesel vehicles were higher than those of gasoline vehicles, and their emissions increased with higher altitudes. Atmospheric pressure was found to be the primary environmental factor influencing CO2, CO, and NOx emissions.
Overall, this study provides a comprehensive understanding of the emission characteristics and influencing factors of motor vehicles in high-altitude areas by comparing the CO2, CO, and NOx emission rates of typical vehicle models at different altitudes. This information can serve as an important basis for improving environmental quality and formulating relevant policies. In response to the lower oxygen concentration conditions in high-altitude areas, the selection of engines with characteristics such as turbocharging, small displacement, diesel, and multiple cylinders is more suitable for motor vehicles. Turbocharged engines, by providing more air into the cylinders, compensate for the lower oxygen concentration at high altitudes, contributing to increased power output and combustion efficiency. Smaller displacement engines are generally more efficient, adapting more easily to the thin air conditions in high-altitude areas. Diesel engines, known for higher torque, are well-suited for climbing and high-load situations in high-altitude regions. Multiple-cylinder engines typically exhibit superior performance at high altitudes, providing smoother power output and reducing the potential power loss that may occur in such environments.
Author Contributions
Conceptualization, Z.Q. and W.H.; methodology, Z.Q.; validation, M.G.; formal analysis, M.G.; investigation, Z.Z. and Z.M.; resources, J.C. and C.Y.; data curation, Y.Z.; writing—original draft preparation, Z.Q.; writing—review and editing, W.H.; visualization, M.G.; supervision, W.H.; project administration, Z.Q.; funding acquisition, W.H. All authors have read and agreed to the published version of the manuscript.
Funding
The authors gratefully acknowledge financial support by the Qinghai Provincial Key R&D and Transformation Plan (Grant No. 2022-SF-149, Qinghai Provincial Department of Science and Technology), Qinghai Transportation Science and Technology Project (Grant No. 2023-05, Qinghai Provincial Department of Transportation), and the Basic Research Fund of Central Public-interest Scientific Research Institutes in China (Grant No. TKS20230301, Tianjin Research Institute for Water Transport Engineering, M.O.T.).
Institutional Review Board Statement
Not applicable.
Informed Consent Statement
Not applicable.
Data Availability Statement
The data presented in this study are available on request from the corresponding author. The data are not publicly available due to institutional restrictions.
Conflicts of Interest
The authors declare no conflict of interest. Chuanzhou You, Yue Zhan and Zhongwu Ma are employees of Qinghai Transportation Planning & Design Institute Co., Ltd. The paper reflects the views of the scientists, and not the company.
References
- Varella, R.A.; Giechaskiel, B.; Sousa, L.; Duarte, G. Comparison of portable emissions measurement systems (PEMS) with laboratory grade equipment. Appl. Sci. 2018, 8, 1633. [Google Scholar] [CrossRef]
- Nagpure, A.S.; Gurjar, B.R.; Kumar, P. Impact of altitude on emission rates of ozone precursors from gasoline-driven light-duty commercial vehicles. Atmos. Environ. 2011, 45, 1413–1417. [Google Scholar] [CrossRef][Green Version]
- Brand, C.; Goodman, A.; Rutter, H.; Song, Y.; Ogilvie, D. Associations of individual, household and environmental characteristics with carbon dioxide emissions from motorised passenger travel. Appl. Energy 2013, 104, 158–169. [Google Scholar] [CrossRef] [PubMed]
- He, C.; Ge, Y.; Ma, C.; Tan, J.; Liu, Z.; Wang, C.; Yu, L.; Ding, Y. Emission characteristics of a heavy-duty diesel engine at simulated high altitudes. Sci. Total Environ. 2011, 409, 3138–3143. [Google Scholar] [CrossRef] [PubMed]
- Wang, X.; Yin, H.; Ge, Y.; Yu, L.; Xu, Z.; Yu, C.; Shi, X.; Liu, H. On-vehicle emission measurement of a light-duty diesel van at various speeds at high altitude. Atmos. Environ. 2013, 81, 263–269. [Google Scholar] [CrossRef]
- Giraldo, M.; Huertas, J.I. Real emissions, driving patterns and fuel consumption of in-use diesel buses operating at high altitude. Transp. Res. Part D Transp. Environ. 2019, 77, 21–36. [Google Scholar] [CrossRef]
- Zhang, H.; Zhao, F.; Hao, H.; Liu, Z. Comparative analysis of life cycle greenhouse gas emission of passenger cars: A case study in China. Energy 2023, 265, 126282. [Google Scholar] [CrossRef]
- Yan, G.; Wang, M.; Qin, P.; Yan, T.; Li, K.; Wang, X.; Han, C. Field measurements of vehicle pollutant emissions in road tunnels at different altitudes. Tunn. Undergr. Space Technol. 2021, 118, 104187. [Google Scholar] [CrossRef]
- Kousoulidou, M.; Fontaras, G.; Ntziachristos, L.; Bonnel, P.; Samaras, Z.; Dilara, P. Use of portable emissions measurement system (PEMS) for the development and validation of passenger car emission factors. Atmos. Environ. 2013, 64, 329–338. [Google Scholar] [CrossRef]
- Luján, J.M.; Bermúdez, V.; Dolz, V.; Monsalve-Serrano, J. An assessment of the real-world driving gaseous emissions from a Euro 6 light-duty diesel vehicle using a portable emissions measurement system (PEMS). Atmos. Environ. 2018, 174, 112–121. [Google Scholar] [CrossRef]
- Fu, M.; Ge, Y.; Tan, J.; Zeng, T.; Liang, B. Characteristics of typical non-road machinery emissions in China by using portable emission measurement system. Sci. Total Environ. 2012, 437, 255–261. [Google Scholar] [CrossRef] [PubMed]
- O’Driscoll, R.; ApSimon, H.M.; Oxley, T.; Molden, N.; Stettler, M.E.; Thiyagarajah, A. A Portable Emissions Measurement System (PEMS) study of NOx and primary NO2 emissions from Euro 6 diesel passenger cars and comparison with COPERT emission factors. Atmos. Environ. 2016, 145, 81–91. [Google Scholar] [CrossRef]
- Liu, H.; He, K.; Lents, J.M.; Wang, Q.; Tolvett, S. Characteristics of diesel truck emission in China based on portable emissions measurement systems. Environ. Sci. Technol. 2009, 43, 9507–9511. [Google Scholar] [CrossRef] [PubMed]
- Zhu, X.-h.; Lu, K.-f.; Peng, Z.-r.; Gao, H.O. Characterizing carbon emissions from China V and China VI gasoline vehicles based on portable emission measurement systems. J. Clean. Prod. 2022, 378, 134458. [Google Scholar] [CrossRef]
- Challa, R.; Kamath, D.; Anctil, A. Well-to-wheel greenhouse gas emissions of electric versus combustion vehicles from 2018 to 2030 in the US. J. Environ. Manag. 2022, 308, 114592. [Google Scholar] [CrossRef] [PubMed]
- Zheng, X.; Wu, Y.; Jiang, J.; Zhang, S.; Liu, H.; Song, S.; Li, Z.; Fan, X.; Fu, L.; Hao, J. Characteristics of on-road diesel vehicles: Black carbon emissions in Chinese cities based on portable emissions measurement. Environ. Sci. Technol. 2015, 49, 13492–13500. [Google Scholar] [CrossRef] [PubMed]
- Zhou, X.; Wang, H.; Huang, Z.; Bao, Y.; Zhou, G.; Liu, Y. Identifying spatiotemporal characteristics and driving factors for road traffic CO2 emissions. Sci. Total Environ. 2022, 834, 155270. [Google Scholar] [CrossRef]
- Zhang, S.; Wu, Y.; Liu, H.; Huang, R.; Un, P.; Zhou, Y.; Fu, L.; Hao, J. Real-world fuel consumption and CO2 (carbon dioxide) emissions by driving conditions for light-duty passenger vehicles in China. Energy 2014, 69, 247–257. [Google Scholar] [CrossRef]
- Li, Y.; Lv, C.; Yang, N.; Liu, H.; Liu, Z. A study of high temporal-spatial resolution greenhouse gas emissions inventory for on-road vehicles based on traffic speed-flow model: A case of Beijing. J. Clean. Prod. 2020, 277, 122419. [Google Scholar] [CrossRef]
- Hao, H.; Liu, F.; Liu, Z.; Zhao, F. Compression ignition of low-octane gasoline: Life cycle energy consumption and greenhouse gas emissions. Appl. Energy 2016, 181, 391–398. [Google Scholar] [CrossRef]
- Kim, Y.; Kawahara, N.; Tsuboi, K.; Tomita, E. Combustion characteristics and NOx emissions of biogas fuels with various CO2 contents in a micro co-generation spark-ignition engine. Appl. Energy 2016, 182, 539–547. [Google Scholar] [CrossRef]
- Hudda, N.; Fruin, S. Carbon dioxide accumulation inside vehicles: The effect of ventilation and driving conditions. Sci. Total Environ. 2018, 610, 1448–1456. [Google Scholar] [CrossRef] [PubMed]
- Sun, D.J.; Zhang, Y.; Xue, R.; Zhang, Y. Modeling carbon emissions from urban traffic system using mobile monitoring. Sci. Total Environ. 2017, 599, 944–951. [Google Scholar] [CrossRef] [PubMed]
- Xu, L.; Cui, S.; Tang, J.; Yan, X.; Huang, W.; Lv, H. Investigating the comparative roles of multi-source factors influencing urban residents’ transportation greenhouse gas emissions. Sci. Total Environ. 2018, 644, 1336–1345. [Google Scholar] [CrossRef] [PubMed]
- Wang, Y.; Ge, Y.; Wang, J.; Wang, X.; Yin, H.; Hao, L.; Tan, J. Impact of altitude on the real driving emission (RDE) results calculated in accordance to moving averaging window (MAW) method. Fuel 2020, 277, 117929. [Google Scholar] [CrossRef]
- Huang, J.; Gao, J.; Wang, Y.; Yang, C.; Ma, C.; Tian, G. Effect of asymmetric fuel injection on combustion characteristics and NOx emissions of a hydrogen opposed rotary piston engine. Energy 2023, 262, 125544. [Google Scholar] [CrossRef]
- Göktaş, M.; Balki, M.K.; Sayin, C.; Canakci, M. An evaluation of the use of alcohol fuels in SI engines in terms of performance, emission and combustion characteristics: A review. Fuel 2021, 286, 119425. [Google Scholar] [CrossRef]
- Wyatt, D.W.; Li, H.; Tate, J.E. The impact of road grade on carbon dioxide (CO2) emission of a passenger vehicle in real-world driving. Transp. Res. Part D Transp. Environ. 2014, 32, 160–170. [Google Scholar] [CrossRef]
Disclaimer/Publisher’s Note: The statements, opinions and data contained in all publications are solely those of the individual author(s) and contributor(s) and not of MDPI and/or the editor(s). MDPI and/or the editor(s) disclaim responsibility for any injury to people or property resulting from any ideas, methods, instructions or products referred to in the content. |
© 2023 by the authors. Licensee MDPI, Basel, Switzerland. This article is an open access article distributed under the terms and conditions of the Creative Commons Attribution (CC BY) license (https://creativecommons.org/licenses/by/4.0/).