Assessment of the Emission Characteristics of Major States in the United States using Satellite Observations of CO2, CO, and NO2
Abstract
:1. Introduction
2. Study Area and Data
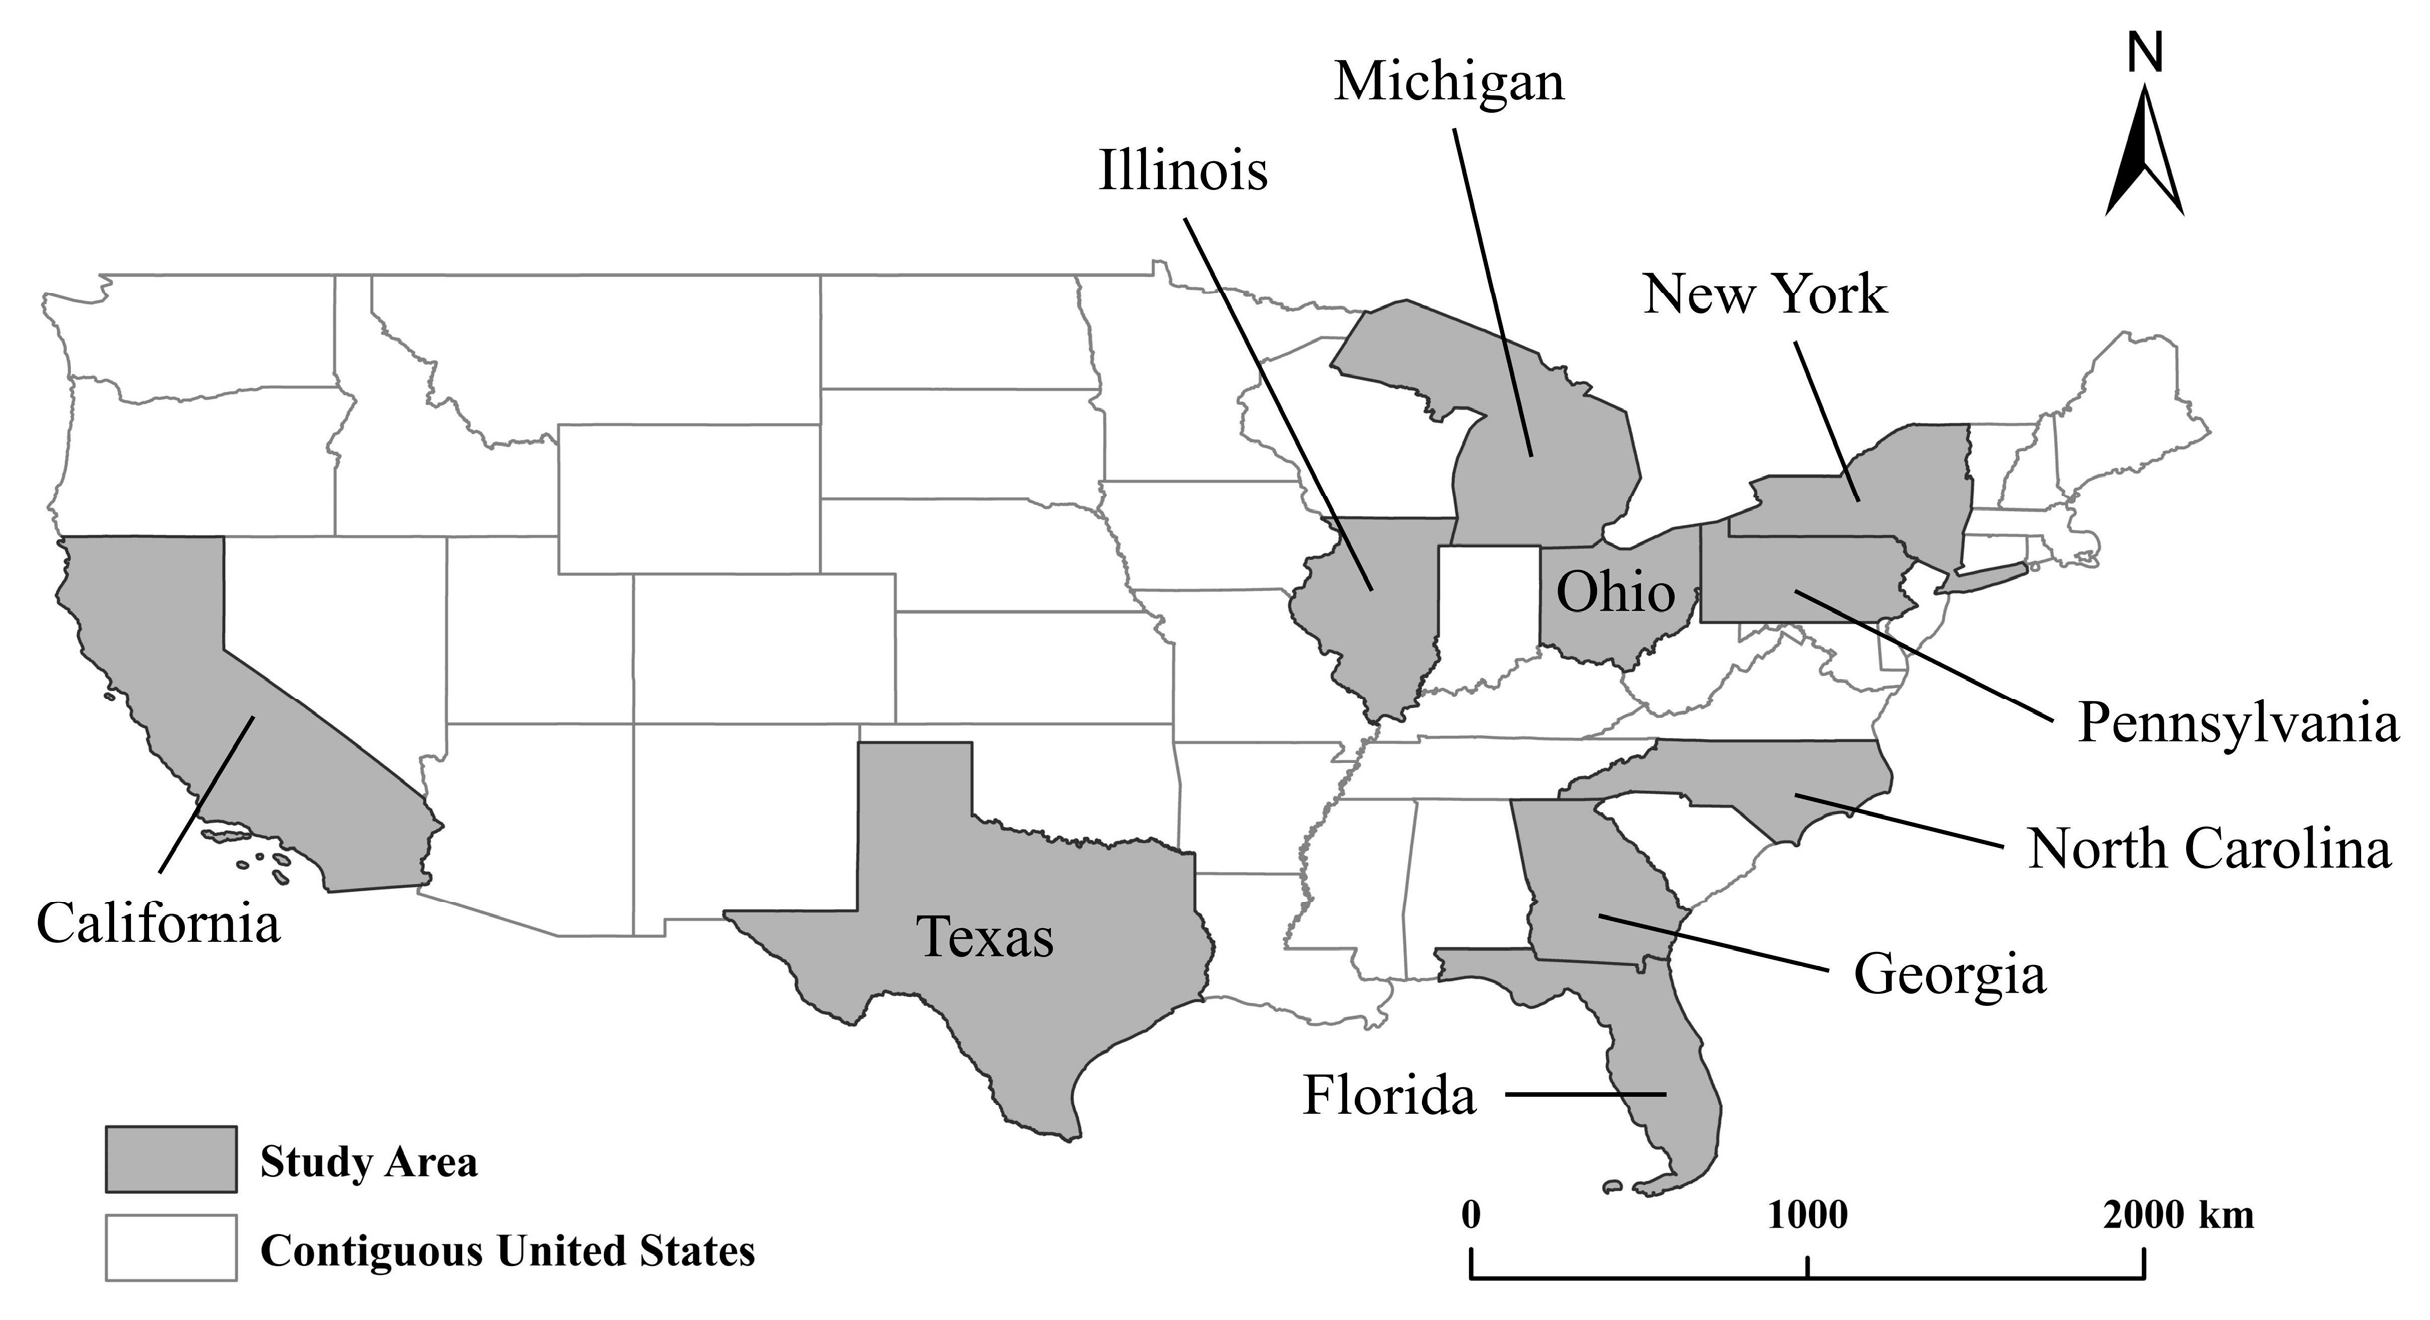
2.1. Study Area
2.2. Data
2.2.1. Sentinel-5 Precursor/TROPOMI
2.2.2. OCO-2
2.2.3. Verification Data
2.2.4. Additional Socio-Economic and Environmental Data
3. Accuracy Verification and Feature Analysis
3.1. Validation of Satellite Product Reliability
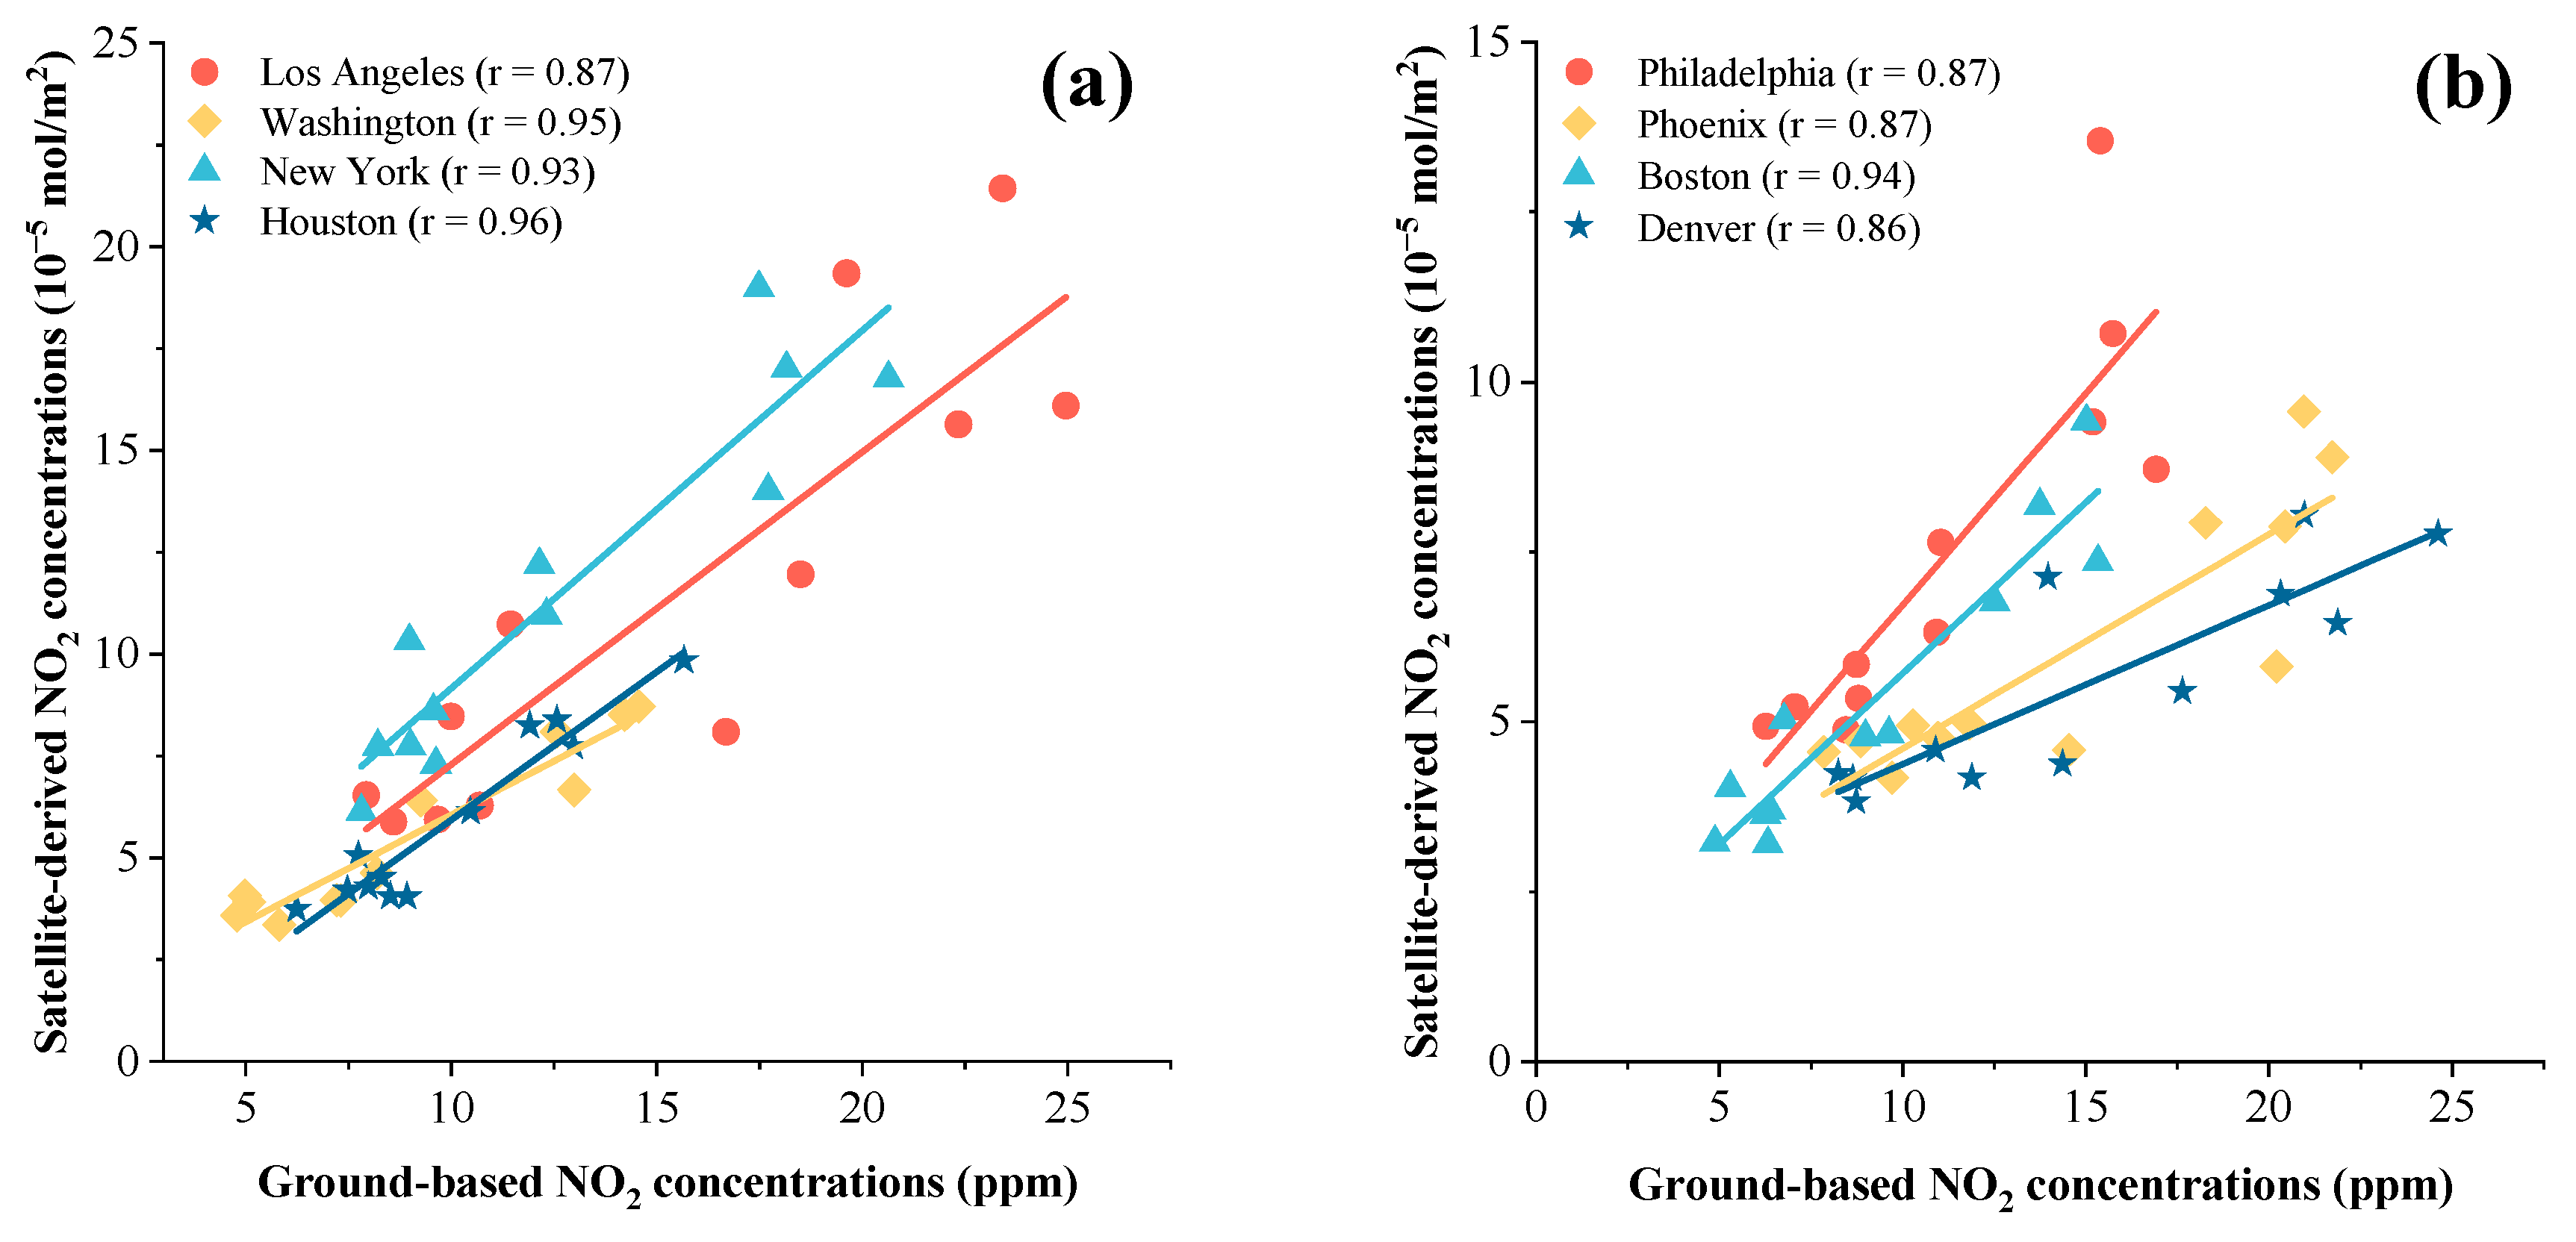
3.1.1. Sentinel-5P Product Validation
3.1.2. Validation of OCO-2 Data Products
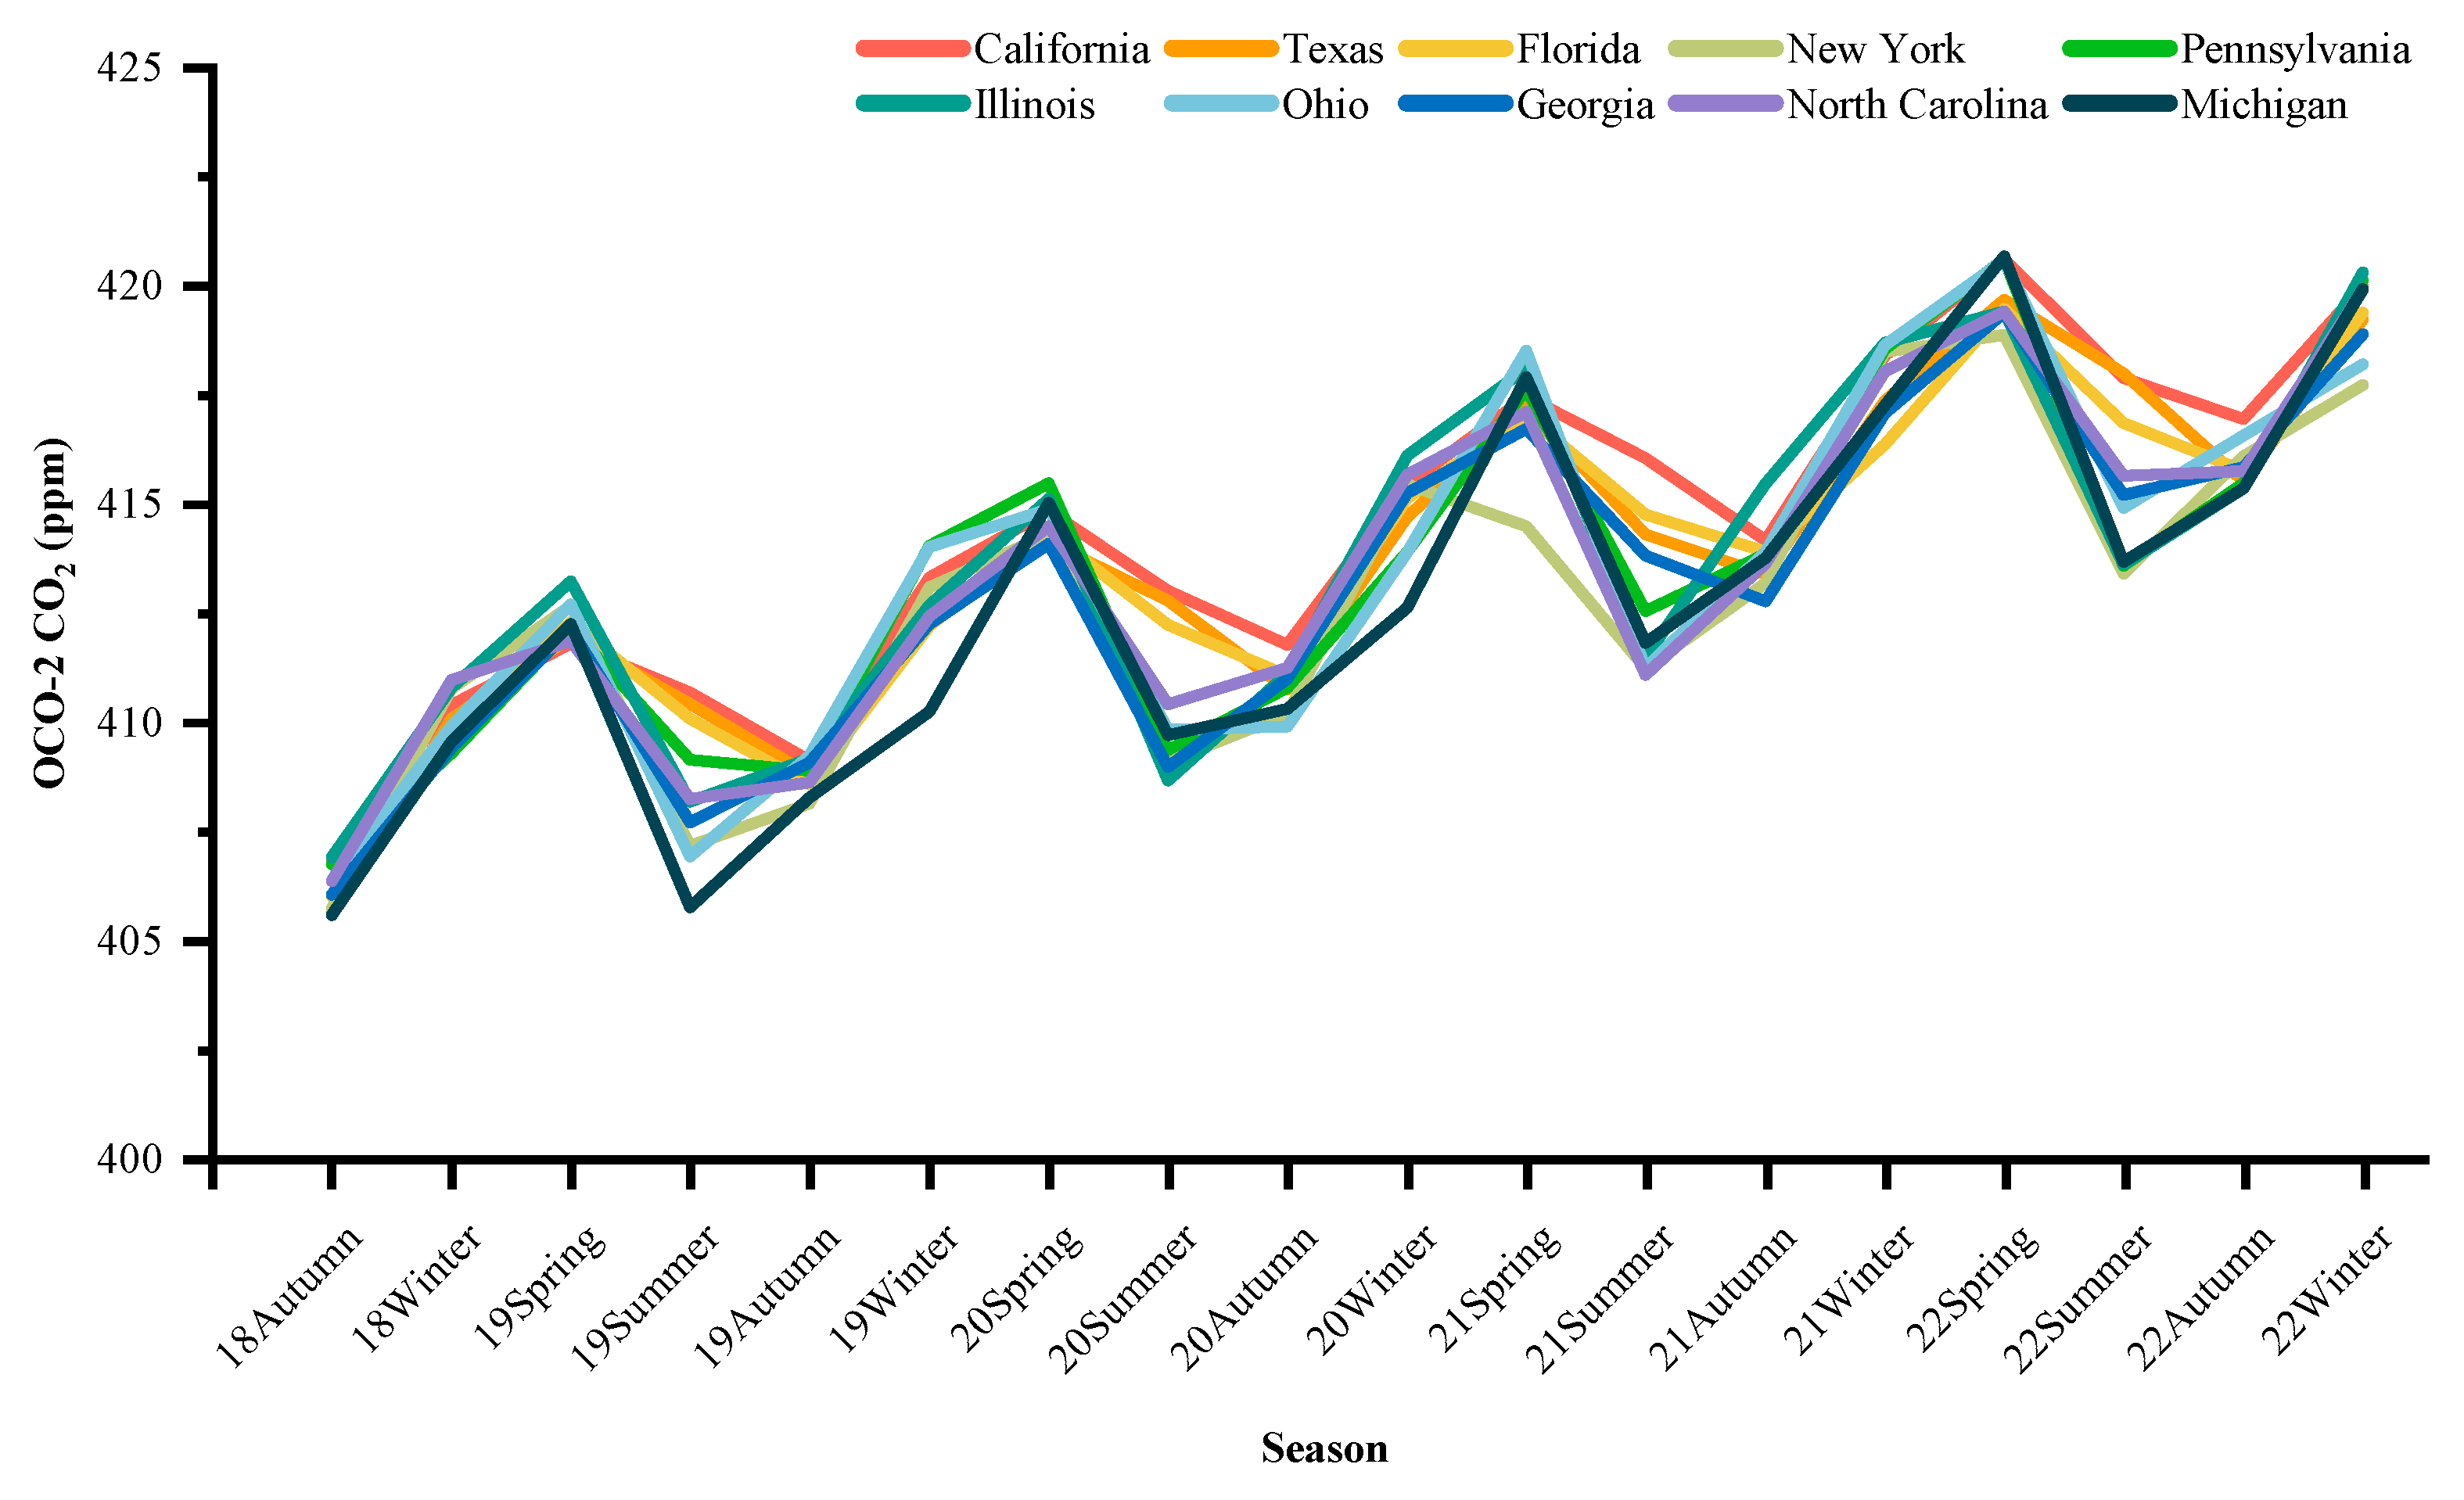
3.2. Analysis of XCO2 Trends
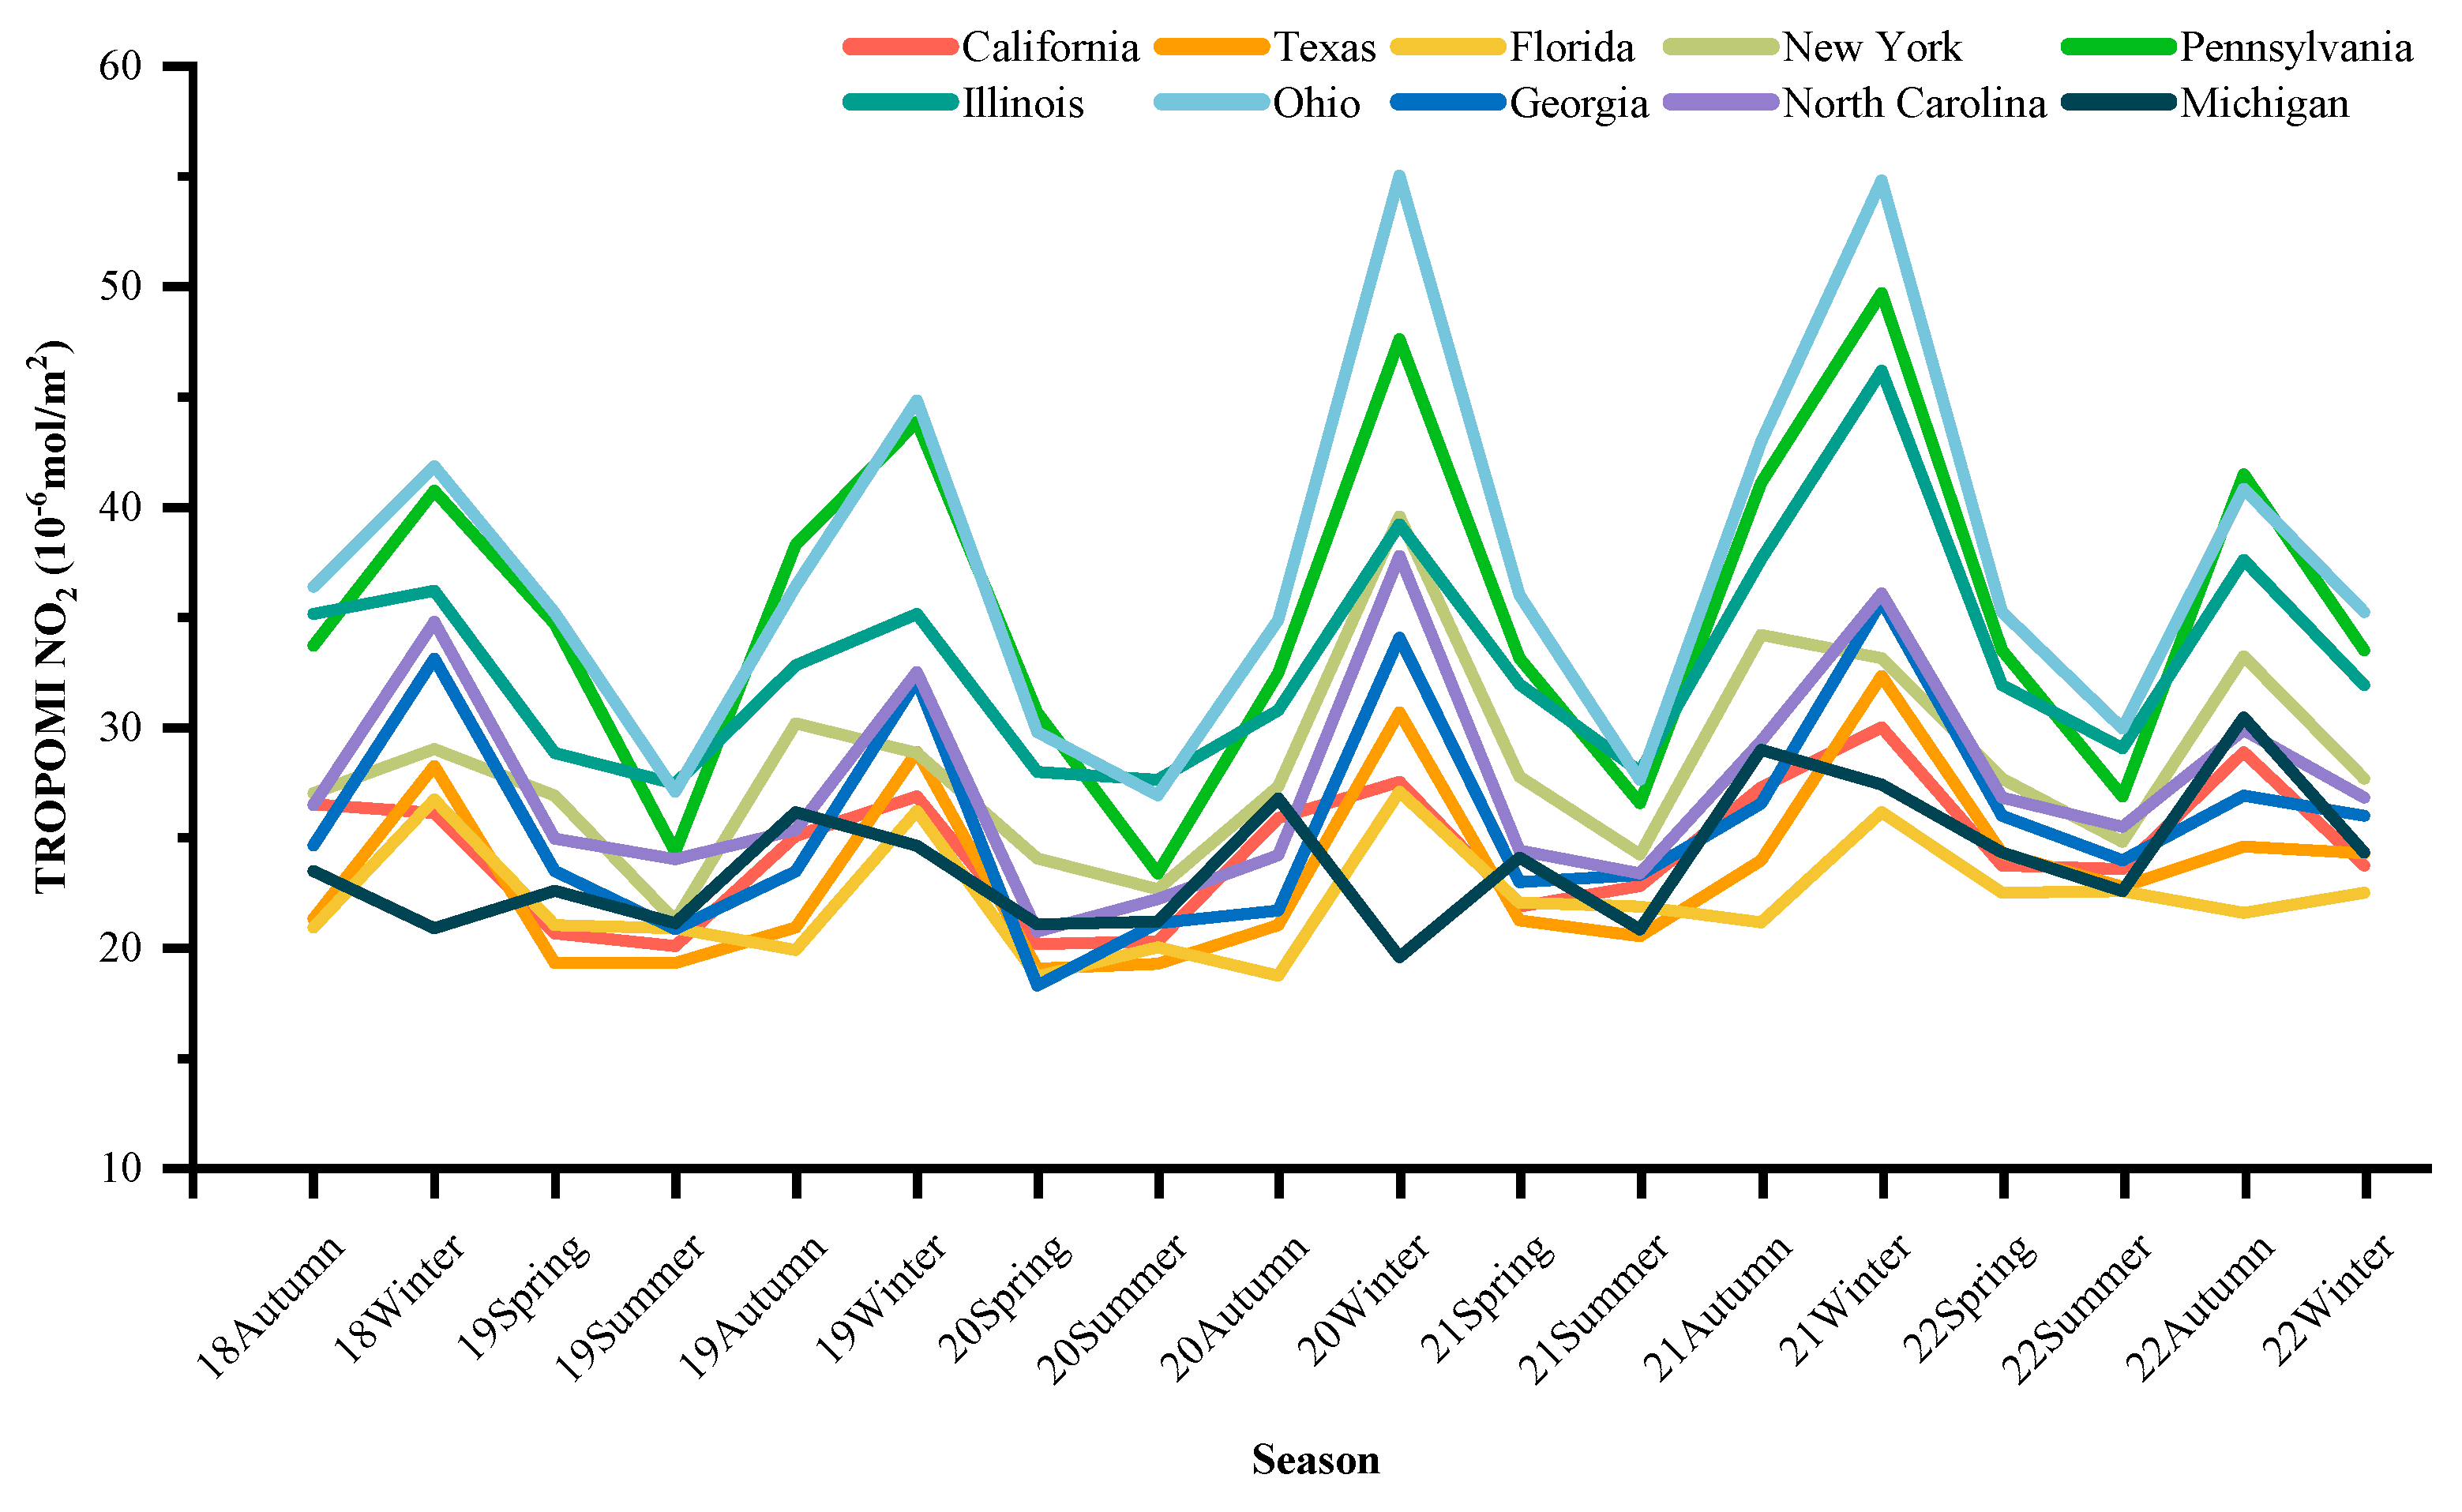
3.3. Analysis of NO2 Trends
3.4. Analysis of CO Trends
4. Synergistic Analysis
4.1. Correlation Analysis
4.1.1. NO2 and CO2
4.1.2. CO and CO2, CO and NO2
4.2. Enhancement Ratio
4.2.1. ΔNO2: ΔXCO2
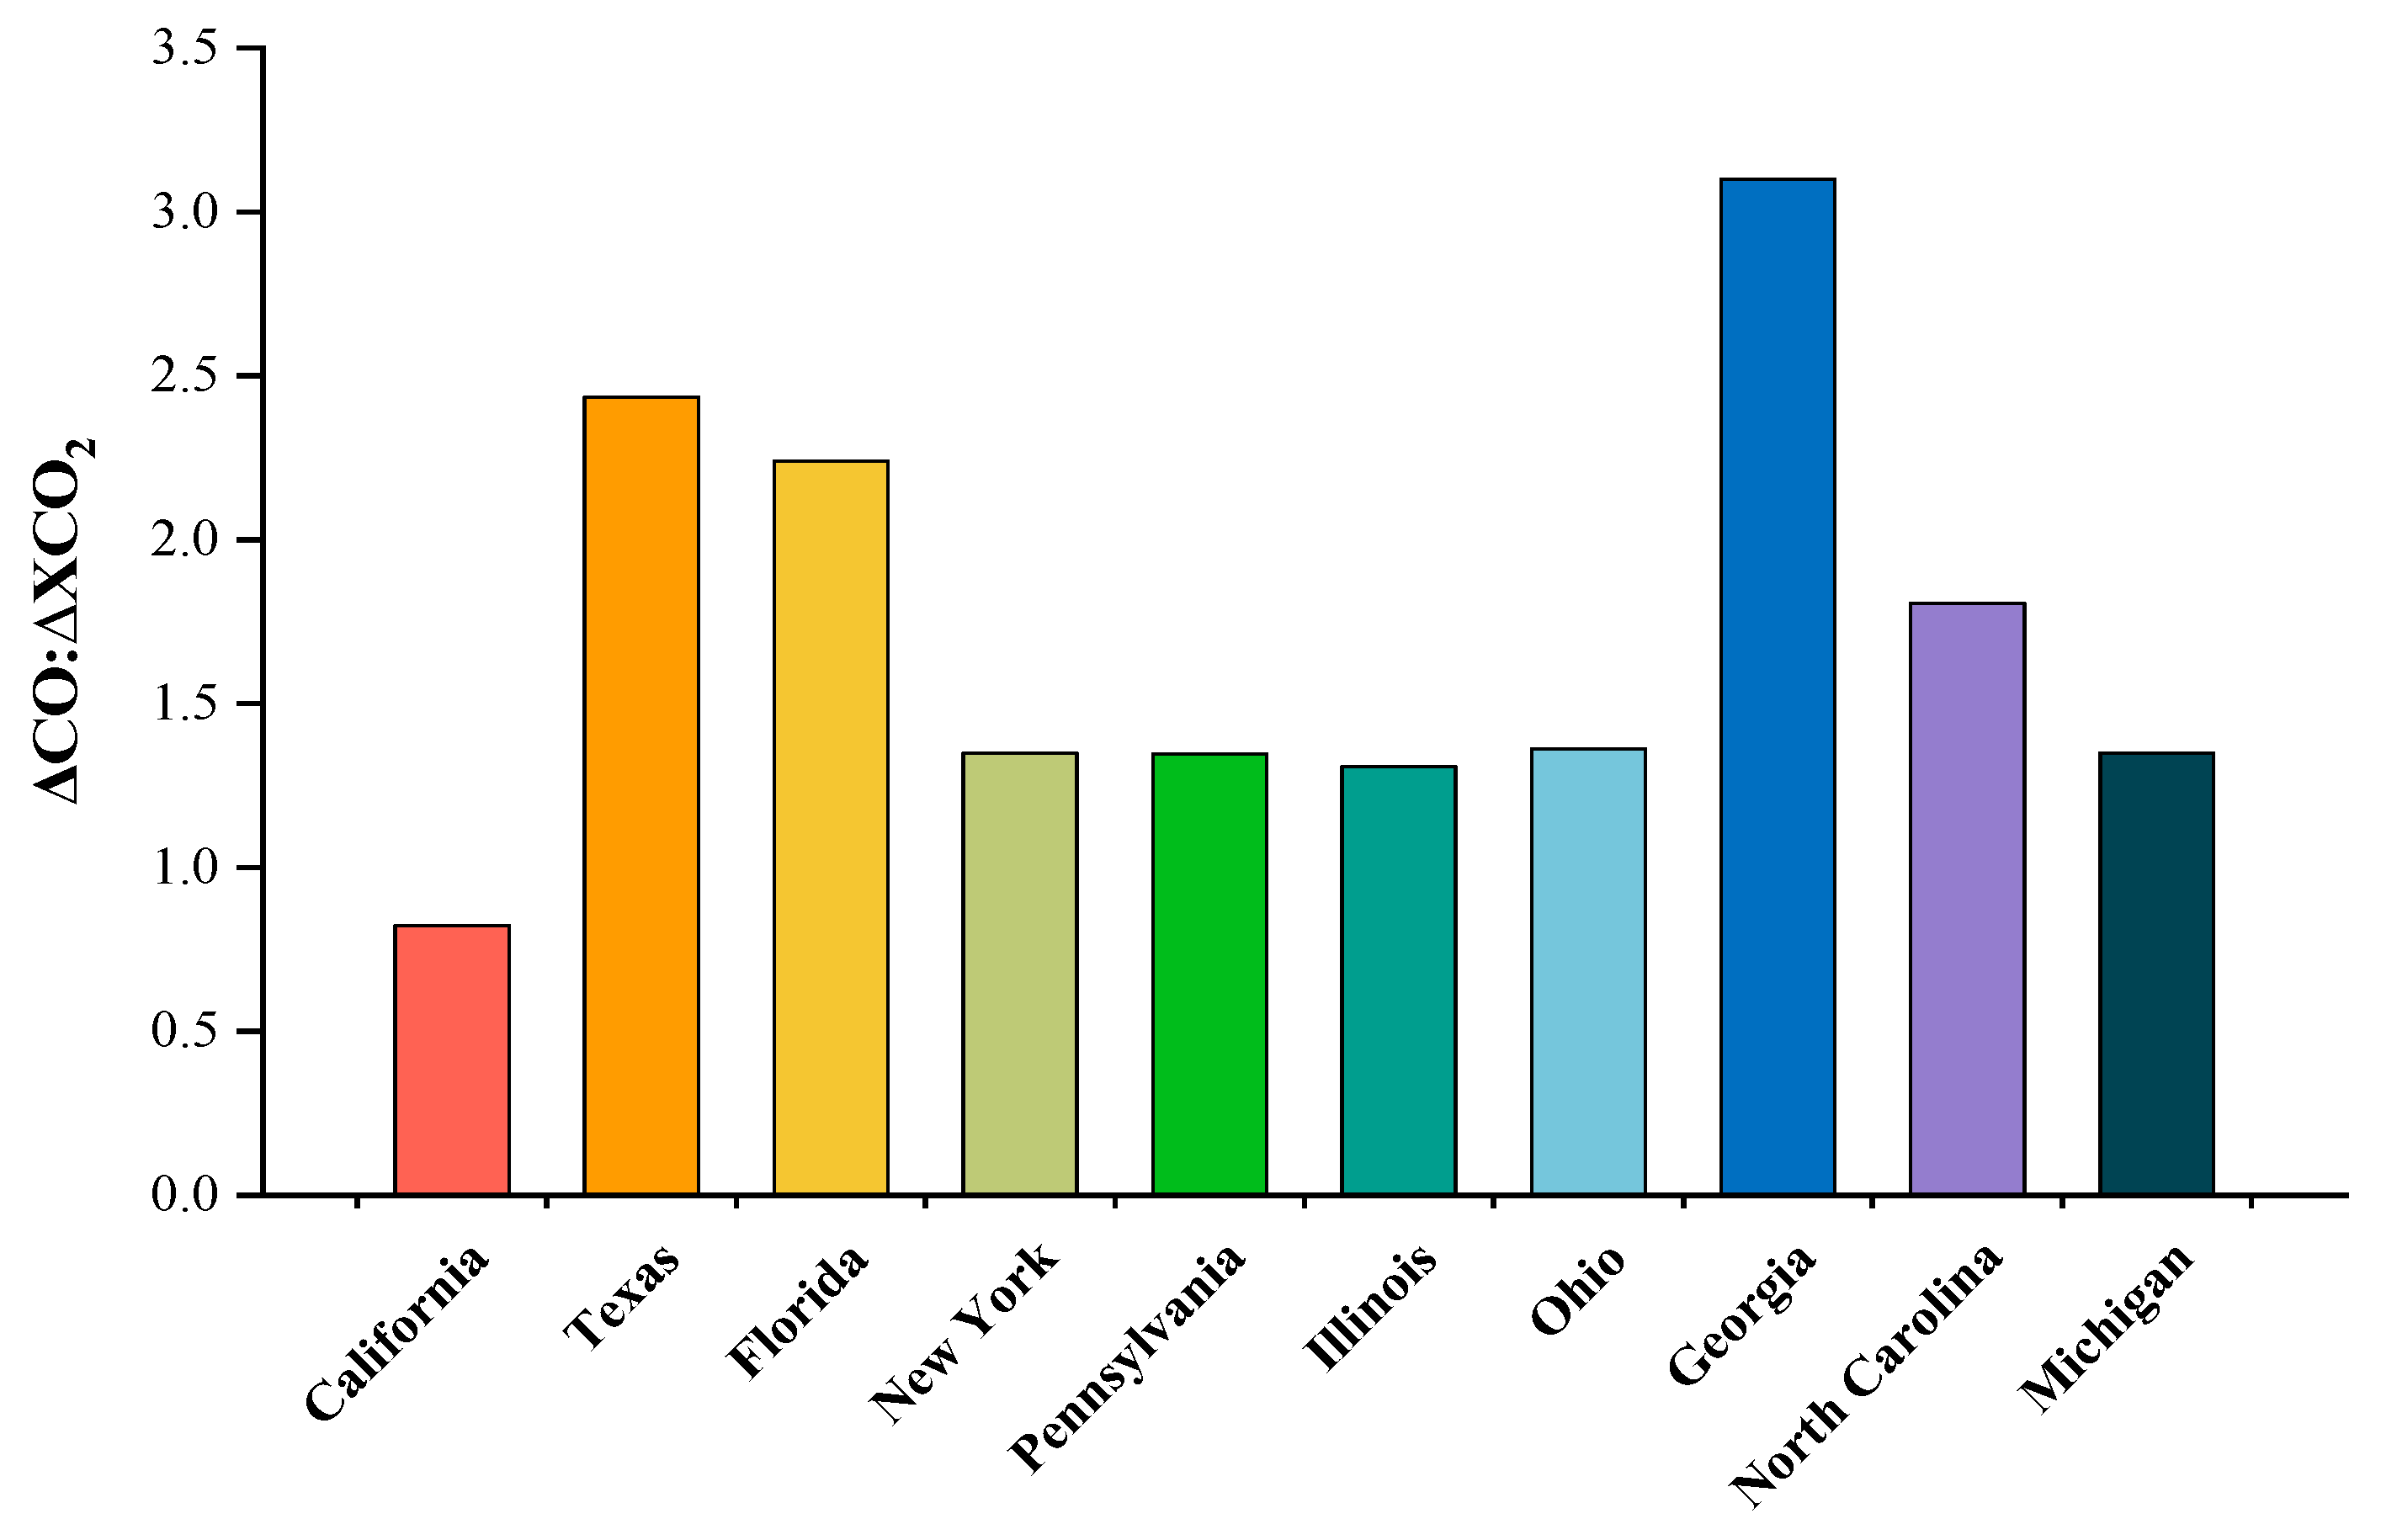
4.2.2. ΔCO: ΔXCO2
5. Discussion
6. Conclusions
Author Contributions
Funding
Data Availability Statement
Acknowledgments
Conflicts of Interest
References
- United Nations Environment Programme. 2021 Annual Report. Available online: https://www.unep.org/resources/annual-report-2021 (accessed on 20 October 2023).
- Arias, P.A.; Bellouin, N.; Coppola, E.; Jones, R.G.; Krinner, G.; Marotzke, J.; Naik, V.; Palmer, M.D.; Plattner, G.-K.; Rogelj, J.; et al. 2021: Technical Summary. In Climate Change 2021: The Physical Science Basis. Contribution of Working Group I to the Sixth Assessment Report of the Intergovernmental Panel on Climate Change; Masson-Delmotte, V., Zhai, P., Pirani, A., Connors, S.L., Péan, C., Berger, S., Caud, N., Chen, Y., Goldfarb, L., Gomis, M.I., et al., Eds.; Cambridge University Press: Cambridge, UK; New York, NY, USA, 2021; pp. 33–144. [Google Scholar] [CrossRef]
- Zhang, H.; Han, G.; Ma, X.; Chen, W.; Zhang, X.; Liu, J.; Gong, W. Robust algorithm for precise XCO2 retrieval using single observation of IPDA LIDAR. Opt. Express 2023, 31, 11846–11863. [Google Scholar] [CrossRef]
- Pei, Z.; Han, G.; Mao, H.; Chen, C.; Shi, T.; Yang, K.; Ma, X.; Gong, W. Improving quantification of methane point source emissions from imaging spectroscopy. Remote Sens. Environ. 2023, 295, 113652. [Google Scholar] [CrossRef]
- Cai, M.; Han, G.; Ma, X.; Pei, Z.; Gong, W. Active–passive collaborative approach for XCO2 retrieval using spaceborne sensors. Opt. Lett. 2022, 47, 4211–4214. [Google Scholar] [CrossRef]
- Jones, M.W.; Peters, G.P.; Gasser, T.; Andrew, R.M.; Schwingshackl, C.; Gütschow, J.; Houghton, R.A.; Friedlingstein, P.; Pongratz, J.; Le Quéré, C. National Contributions to Climate Change Due to Historical Emissions of Carbon Dioxide, Methane, and Nitrous Oxide Since 1850. Sci. Data 2023, 10, 155. [Google Scholar] [CrossRef] [PubMed]
- Watson, D. How Exactly Does Carbon Dioxide Cause Global Warming? Columbia Climate School. 2023. Available online: https://news.climate.columbia.edu (accessed on 14 November 2023).
- Sellers, P.J.; Bounoua, L.; Collatz, G.J.; Randall, D.A.; Dazlich, D.A.; Los, S.O.; Berry, J.A.; Fung, I.; Tucker, C.J.; Field, C.B.; et al. Comparison of Radiative and Physiological Effects of Doubled Atmospheric CO2 on Climate. Science 1996, 271, 1402–1406. [Google Scholar] [CrossRef]
- Shi, T.; Han, G.; Ma, X.; Pei, Z.; Chen, W.; Liu, J.; Zhang, X.; Li, S.; Gong, W. Quantifying strong point sources emissions of CO2 using spaceborne LiDAR: Method development and potential analysis. Energy Convers. Manag. 2023, 292, 117346. [Google Scholar] [CrossRef]
- Qiu, R.; Han, G.; Li, S.; Tian, F.; Ma, X.; Gong, W. Soil moisture dominates the variation of gross primary productivity during hot drought in drylands. Sci. Total Environ. 2023, 899, 165686. [Google Scholar] [CrossRef] [PubMed]
- Pei, Z.; Han, G.; Shi, T.; Ma, X.; Gong, W. A XCO2 Retrieval Algorithm Coupled Spatial Correlation for the Aerosol and Carbon Detection Lidar. Atmos. Environ. 2023, 309, 119933. [Google Scholar] [CrossRef]
- Gorman, D.; Drewry, A.; Huang, Y.L.; Sames, C. The Clinical Toxicology of Carbon Monoxide. Toxicology 2003, 187, 25–38. [Google Scholar] [CrossRef]
- Kawaragi, K.; Sekine, Y.; Kadono, T.; Sugita, S.; Ohno, S.; Ishibashi, K.; Kurosawa, K.; Matsui, T.; Ikeda, S. Direct Measurements of Chemical Composition of Shock-Induced Gases from Calcite: An Intense Global Warming After the Chicxulub Impact Due to the Indirect Greenhouse Effect of Carbon Monoxide. Earth Planet. Sci. Lett. 2009, 282, 56–64. [Google Scholar] [CrossRef]
- Bai, L.; Shin, S.; Burnett, R.T.; Kwong, J.C.; Hystad, P.; van Donkelaar, A.; Goldberg, M.S.; Lavigne, E.; Weichenthal, S.; Martin, R.V.; et al. Exposure to Ambient Air Pollution and the Incidence of Lung Cancer and Breast Cancer in the Ontario Population Health and Environment Cohort. Int. J. Cancer 2020, 146, 2450–2459. [Google Scholar] [CrossRef] [PubMed]
- Khomenko, S.; Cirach, M.; Pereira-Barboza, E.; Mueller, N.; Barrera-Gómez, J.; Rojas-Rueda, D.; de Hoogh, K.; Hoek, G.; Nieuwenhuijsen, M. Premature Mortality Due to Air Pollution in European Cities: A Health Impact Assessment. Lancet Planet. Health 2021, 5, e121–e134. [Google Scholar] [CrossRef] [PubMed]
- Koenig, J.Q. Air Pollution and Asthma. J. Allergy Clin. Immunol. 1999, 104, 717–722. [Google Scholar] [CrossRef] [PubMed]
- Kuhlmann, G.; Henne, S.; Meijer, Y.; Brunner, D. Quantifying CO2 Emissions of Power Plants with CO2 and NO2 Imaging Satellites. Front. Remote Sens. 2021, 2, 14. [Google Scholar]
- Paraschiv, S.; Barbuta-Misu, N.; Paraschiv, S.L. Influence of NO2, NO and Meteorological Conditions on the Tropospheric O3 Concentration at an Industrial Station. Energy Rep. 2020, 6, 231–236. [Google Scholar] [CrossRef]
- Lama, S.; Houweling, S.; Boersma, K.F.; Eskes, H.; Aben, I.; Denier van der Gon, H.A.C.; Krol, M.C.; Dolman, H.; Borsdorff, T.; Lorente, A. Quantifying burning efficiency in megacities using the NO2/CO ratio from the Tropospheric Monitoring Instrument (TROPOMI). Atmos. Chem. Phys. 2020, 20, 10295–10310. [Google Scholar] [CrossRef]
- MacDonald, C.G.; Mastrogiacomo, J.-P.; Laughner, J.L.; Hedelius, J.K.; Nassar, R.; Wunch, D. Estimating enhancement ratios of nitrogen dioxide, carbon monoxide, and carbon dioxide using satellite observations. Atmos. Chem. Phys. 2023, 23, 3493–3516. [Google Scholar] [CrossRef]
- Wan, N.; Xiong, X.; Kluitenberg, G.J.; Hutchinson, J.M.S.; Aiken, R.; Zhao, H.; Lin, X. Estimation of biomass burning emission of NO2 and CO from 2019–2020 Australia fires based on satellite observations. Atmos. Chem. Phys. 2023, 23, 711–724. [Google Scholar] [CrossRef]
- Ritchie, H.; Roser, M.; Rosado, P. CO₂ and Greenhouse Gas Emissions. Our World in Data. 2020. Available online: https://ourworldindata.org/co2-and-greenhouse-gas-emissions (accessed on 5 September 2023).
- Qiu, R.; Li, X.; Han, G.; Xiao, J.; Ma, X.; Gong, W. Monitoring drought impacts on crop productivity of the US Midwest with solar-induced fluorescence: GOSIF outperforms GOME-2 SIF and MODIS NDVI, EVI, and NIRv. Agric. For. Meteorol. 2022, 323, 109038. [Google Scholar] [CrossRef]
- Sentinel-5P TROPOMI NO2 Data Products. Available online: https://developers.google.com/earth-engine/datasets/catalog/COPERNICUS_S5P_OFFL_L3_NO2 (accessed on 10 March 2023).
- Sentinel-5P TROPOMI CO Data Products. Available online: https://developers.google.com/earth-engine/datasets/catalog/COPERNICUS_S5P_OFFL_L3_CO (accessed on 10 March 2023).
- OCO-2/OCO-3 Science Team; Payne, V.; Chatterjee, A. OCO-2 Level 2 Bias-Corrected XCO2 and Other Select Fields from the Full-Physics Retrieval Ag-gregated as Daily Files, Retrospective Processing V11r; GES DISC: Greenbelt, MD, USA, 2020. Available online: https://disc.gsfc.nasa.gov/datasets/OCO2_L2_Lite_FP_11r/summary (accessed on 25 March 2023).
- Zhou, S.; Collier, S.; Jaffe, D.A.; Zhang, Q. Free Tropospheric Aerosols at the Mt. Bachelor Observatory: More Oxidized High. Sulfate Content Comp. Bound. Layer Aerosols. Atmos. Chem. Phys. 2019, 19, 1571–1585. [Google Scholar] [CrossRef]
- Veefkind, J.P.; Aben, I.; McMullan, K.; Förster, H.; De Vries, J.; Otter, G.; Claas, J.; Ekses, H.J.; de Haan, J.F.; Keipool, Q.; et al. TROPOMI on the ESA Sentinel-5 Precursor: A GMES Mission for Global Observations of the Atmospheric Composition for Climate, Air Quality, and Ozone Layer Applications. Remote Sens. Environ. 2012, 120, 70–83. [Google Scholar] [CrossRef]
- Kiel, M.; Das, S.; Osterman, G.; Laughner, J.; Payne, V.; Chatterjee, A. Evaluation of the OCO-2 and OCO-3 ACOS Data Products Against TCCON. In Proceedings of the EGU General Assembly Conference Abstracts, Vienna, Austria, 23–28 April 2023. EGU-10615. [Google Scholar]
- Olivier, J.G.J.; Schure, K.M.; Peters, J. Trends in Global CO2 and Total Greenhouse Gas Emissions. PBL Neth. Environ. Assess. Agency 2017, 5, 1–11. [Google Scholar]
- Dean, A. Deforestation and Climate Change. Climate Council. Available online: https://www.climatecouncil.org.au (accessed on 21 October 2023).
- Griffin, K.L.; Seemann, J.R. Plants, CO2 and Photosynthesis in the 21st Century. Chem. Biol. 1996, 3, 245–254. [Google Scholar] [CrossRef] [PubMed]
- Moore, C.E.; Meacham-Hensold, K.; Lemonnier, P.; Slattery, R.A.; Benjamin, C.; Bernacchi, C.J.; Lawson, T.; Cavanagh, A.P. The Effect of Increasing Temperature on Crop Photosynthesis: From Enzymes to Ecosystems. J. Exp. Bot. 2021, 72, 2822–2844. [Google Scholar] [CrossRef] [PubMed]
- Chen, X.; Ren, X.; He, H.; Zhang, L.; Lv, Y. Seasonal Variation of Ecosystem Photosynthetic Capacity and Its Environmental Drivers in Global Grasslands. Front. Ecol. Evol. 2023, 11, 1193607. [Google Scholar] [CrossRef]
- Van Der, A.R.J.; Eskes, H.J.; Boersma, K.F.; Van Noije TP, C.; Van Roozendael, M.; De Smedt, I.; Peters, D.H.M.U.; Meijer, E.W. Trends, Seasonal Variability and Dominant NOx Source Derived from a Ten Year Record of NO2 Measured from Space. J. Geophys. Res. Atmos. 2008, 113. [Google Scholar] [CrossRef]
- Plaisance, H.; Piechocki-Minguy, A.; Garcia-Fouque, S.; Galloo, J.C. Influence of Meteorological Factors on the NO2 Measurements by Passive Diffusion Tube. Atmos. Environ. 2004, 38, 573–580. [Google Scholar] [CrossRef]
- Van Dop, H.; Krol, M. Changing Trends in Tropospheric Methane and Carbon Monoxide: A Sensitivity Analysis of the OH-Radical. J. Atmos. Chem. 1996, 25, 271–288. [Google Scholar] [CrossRef]
- Holloway, T.; Levy, H.; Kasibhatla, P. Global Distribution of Carbon Monoxide. J. Geophys. Res. Atmos. 2000, 105, 12123–12147. [Google Scholar] [CrossRef]
- Loehman, R.A. Drivers of Wildfire Carbon Emissions. Nat. Clim. Chang. 2020, 10, 1070–1071. [Google Scholar] [CrossRef]
- Pei, Z.; Han, G.; Ma, X.; Shi, T.; Gong, W. A Method for Estimating the Background Column Concentration of CO2 Using the Lagrangian Approach. Ieee Trans. Geosci. Remote Sens. 2022, 60, 1–12. [Google Scholar]
- Reuter, M.; Buchwitz, M.; Hilboll, A.; Richter, A.; Schneising, O.; Hilker, M.; Heymann, J.; Bovensmann, H.; Burrows, J.P. Decreasing emissions of NOx relative to CO2 in East Asia inferred from satellite observations. Nat. Geosci. 2014, 7, 792–795. [Google Scholar] [CrossRef]
- Park, H.; Jeong, S.; Park, H.; Labzovskii, L.D.; Bowman, K.W. An assessment of emission characteristics of Northern Hemisphere cities using spaceborne observations of CO2, CO, and NO2. Remote Sens. Environ. 2021, 254, 112246. [Google Scholar] [CrossRef]
- Pei, Z.; Han, G.; Ma, X.; Su, H.; Gong, W. Response of major air pollutants to COVID-19 lockdowns in China. Sci. Total Environ. 2020, 743, 140879. [Google Scholar] [CrossRef] [PubMed]
- Koukouli, M.-E.; Skoulidou, I.; Karavias, A.; Parcharidis, I.; Balis, D.; Manders, A.; Segers, A.; Eskes, H.; van Geffen, J. Sudden changes in nitrogen dioxide emissions over Greece due to lockdown after the outbreak of COVID-19. Atmos. Chem. Phys. 2021, 21, 1759–1774. [Google Scholar] [CrossRef]
- Poetzscher, J.; Isaifan, R.J. The impact of COVID-19-induced lockdowns during spring 2020 on nitrogen dioxide levels over major American counties. Elem. Sci. Anth. 2021, 9, 00002. [Google Scholar] [CrossRef]
- Habibi, H.; Awal, R.; Fares, A.; Ghahremannejad, M. COVID-19 and the Improvement of the Global Air Quality: The Bright Side of a Pandemic. Atmosphere 2020, 11, 1279. [Google Scholar] [CrossRef]
- Shi, T.; Han, G.; Ma, X.; Mao, H.; Chen, C.; Han, Z.; Pei, Z.; Zhang, H.; Li, S.; Gong, W. Quantifying factory-scale CO2/CH4 emission based on mobile measurements and EMISSION-PARTITION model: Cases in China. Environ. Res. Lett. 2023, 18, 034028. [Google Scholar] [CrossRef]
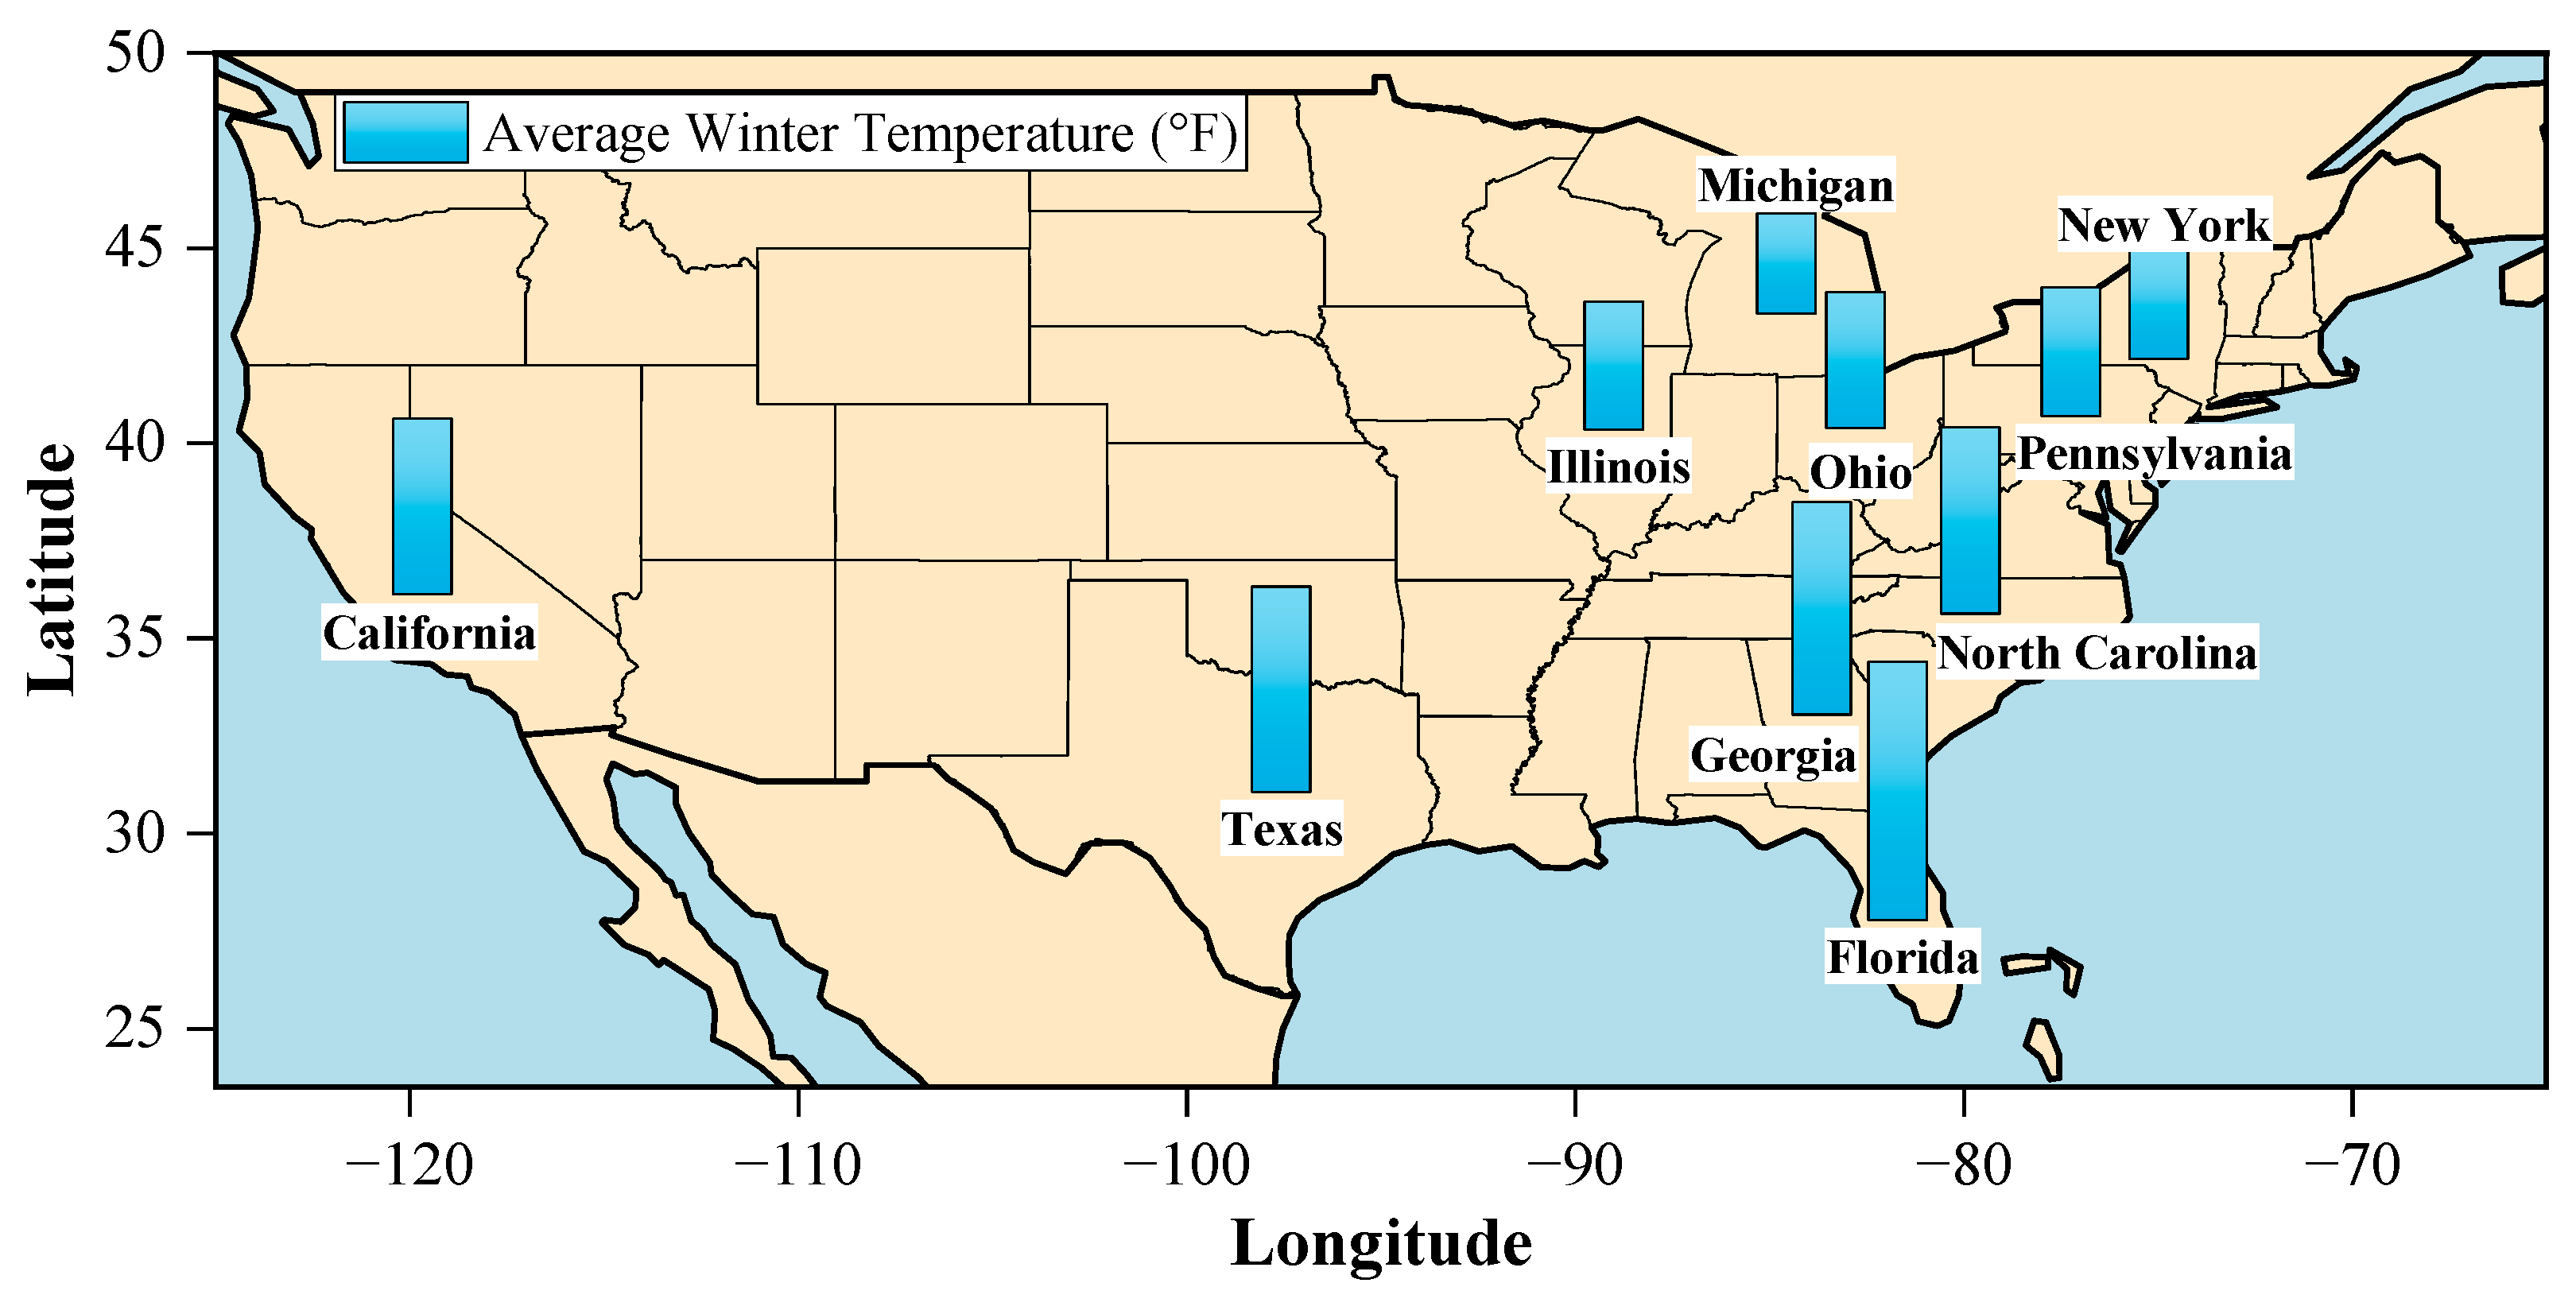
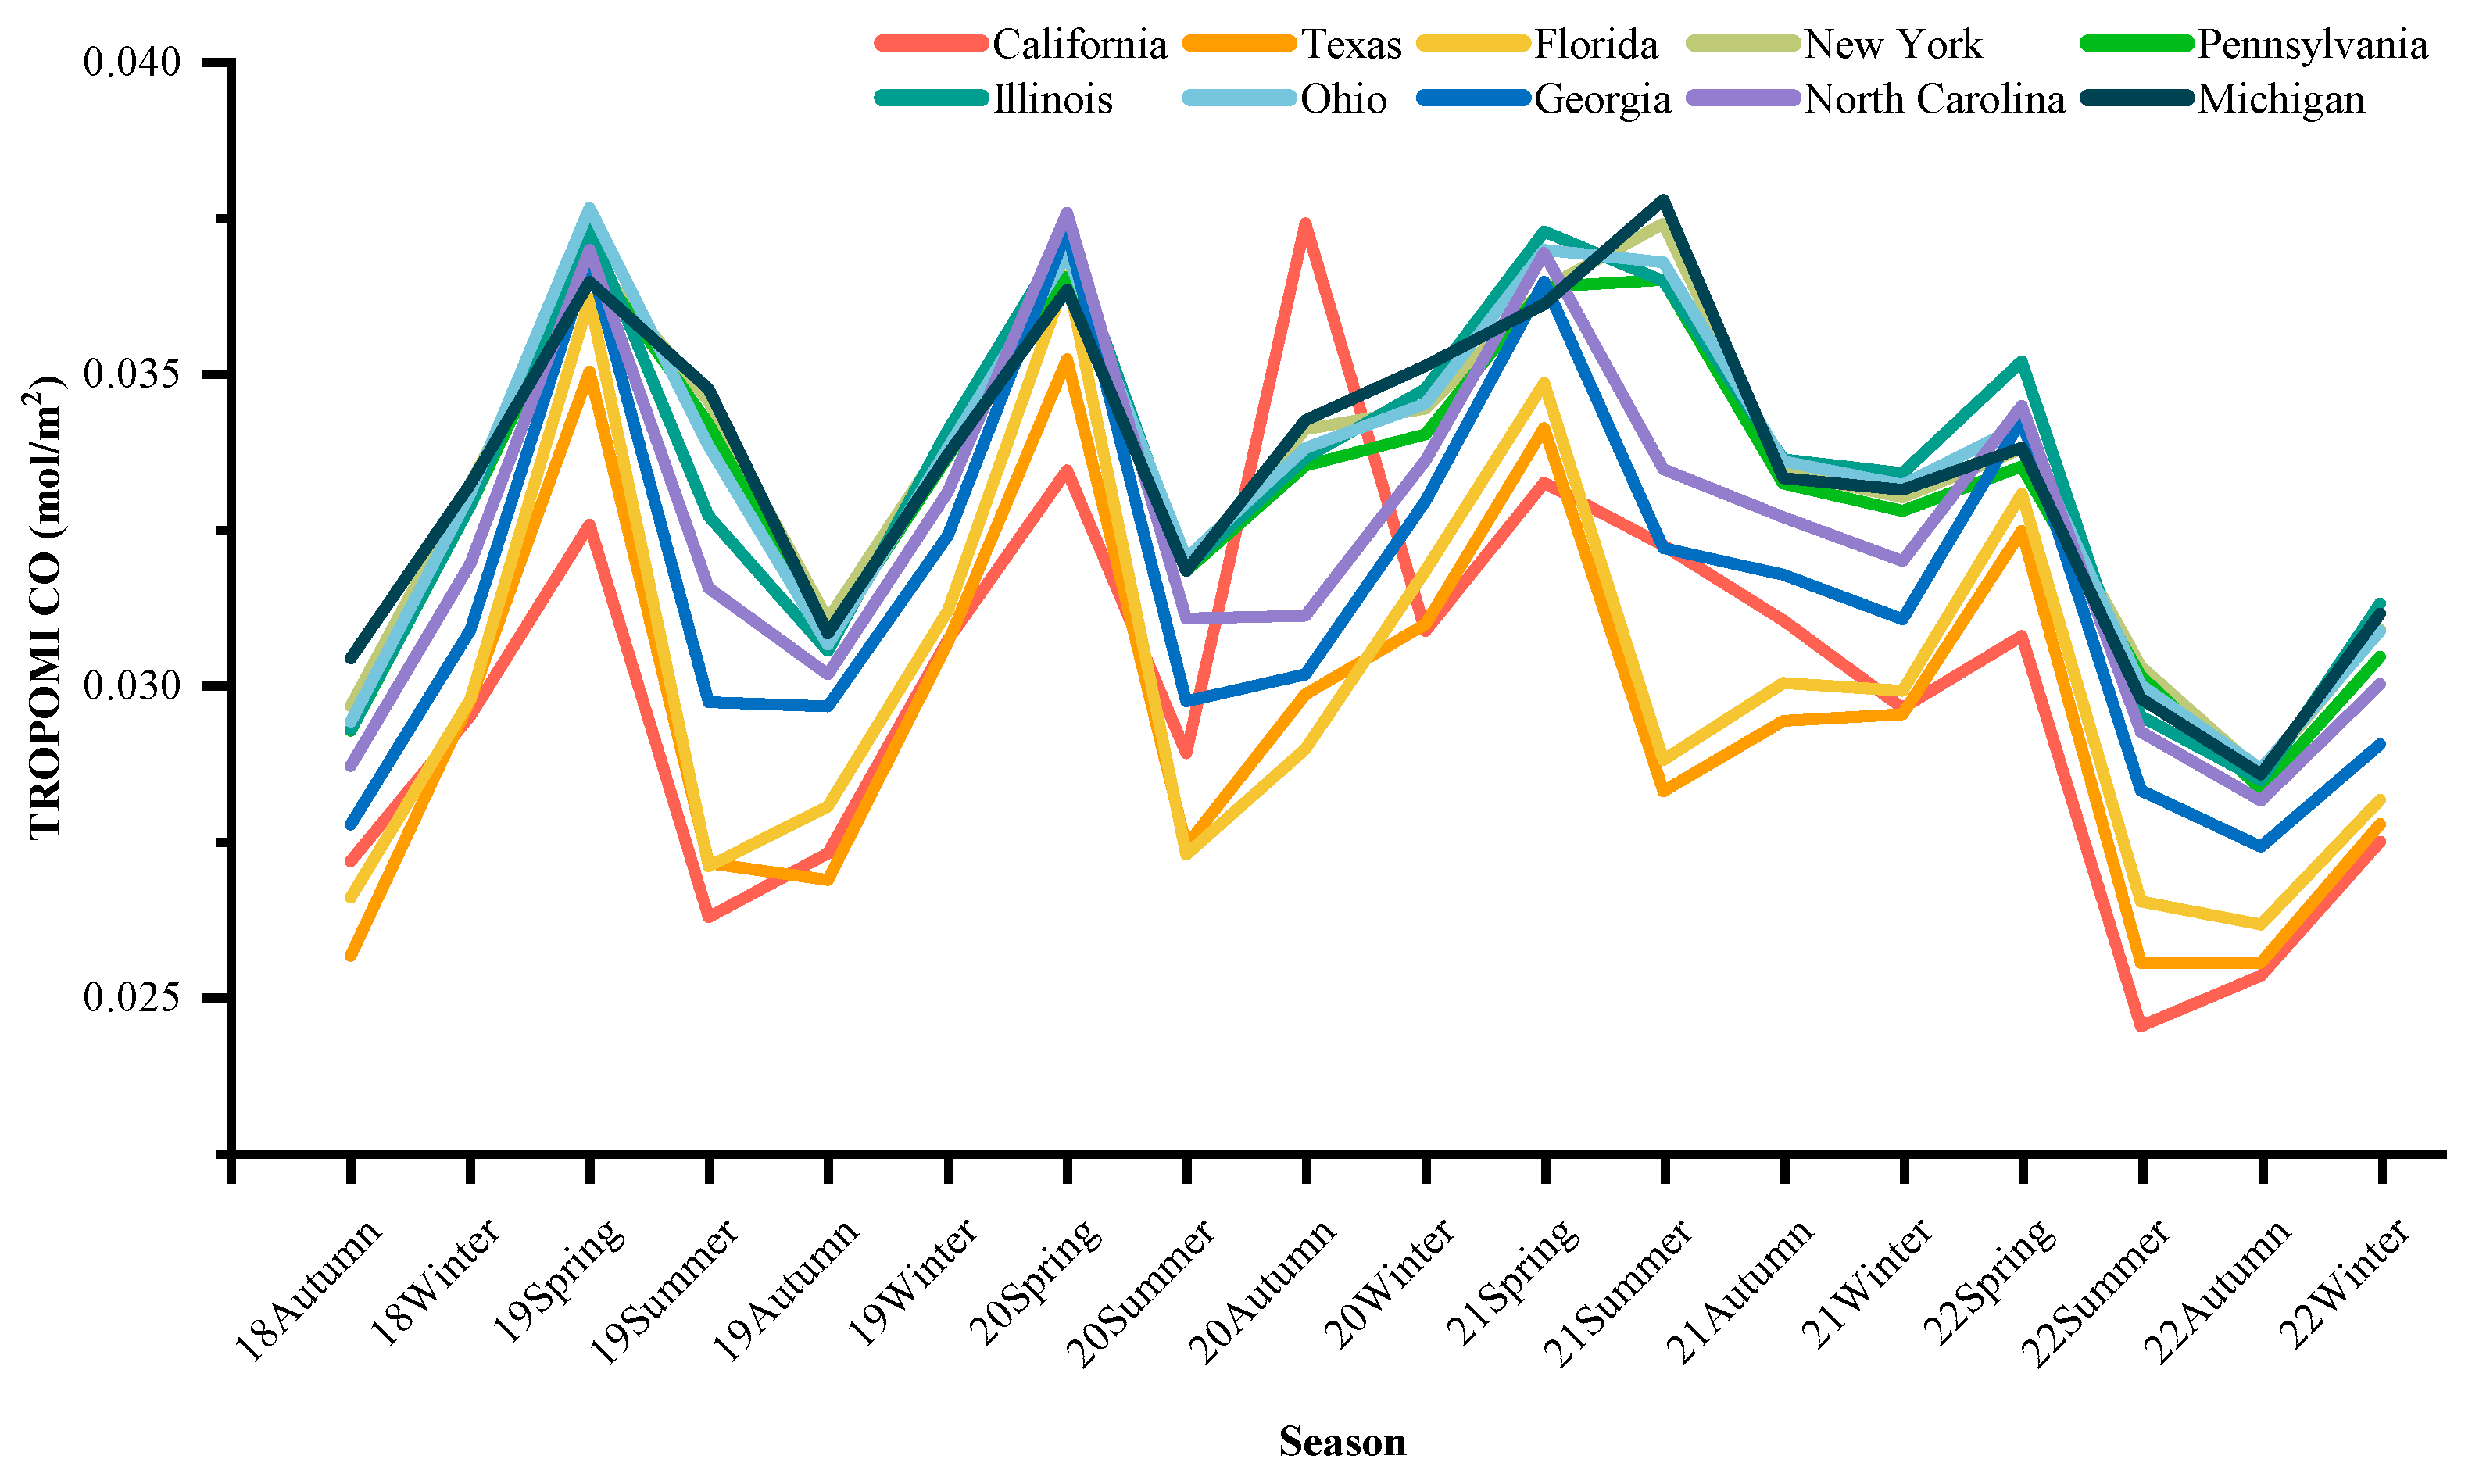
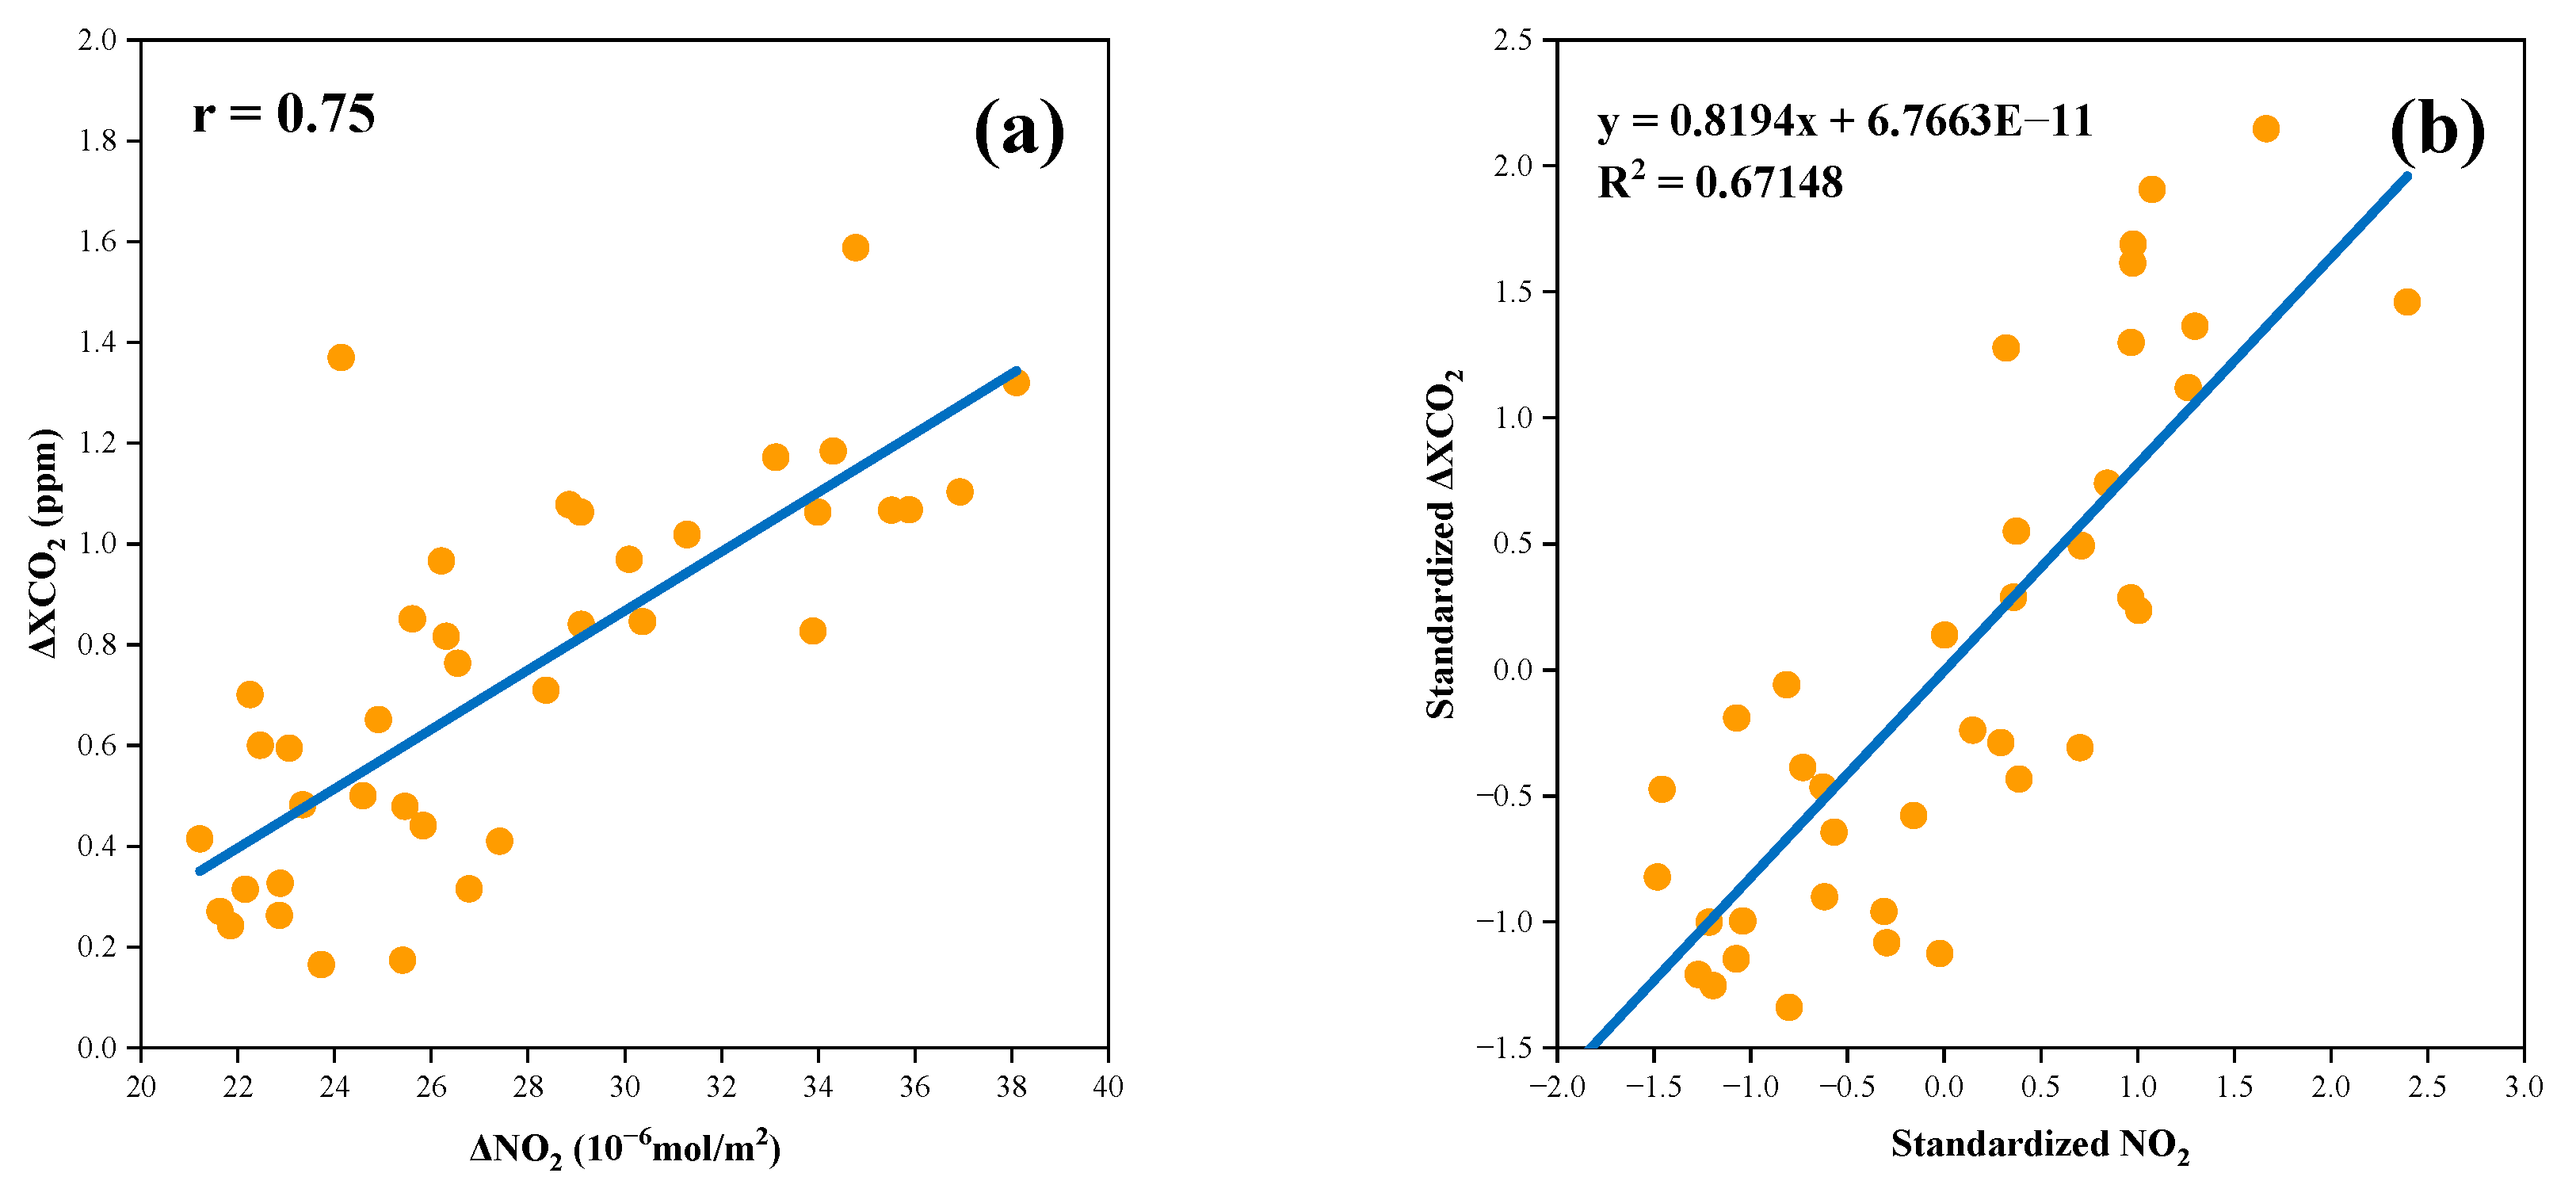

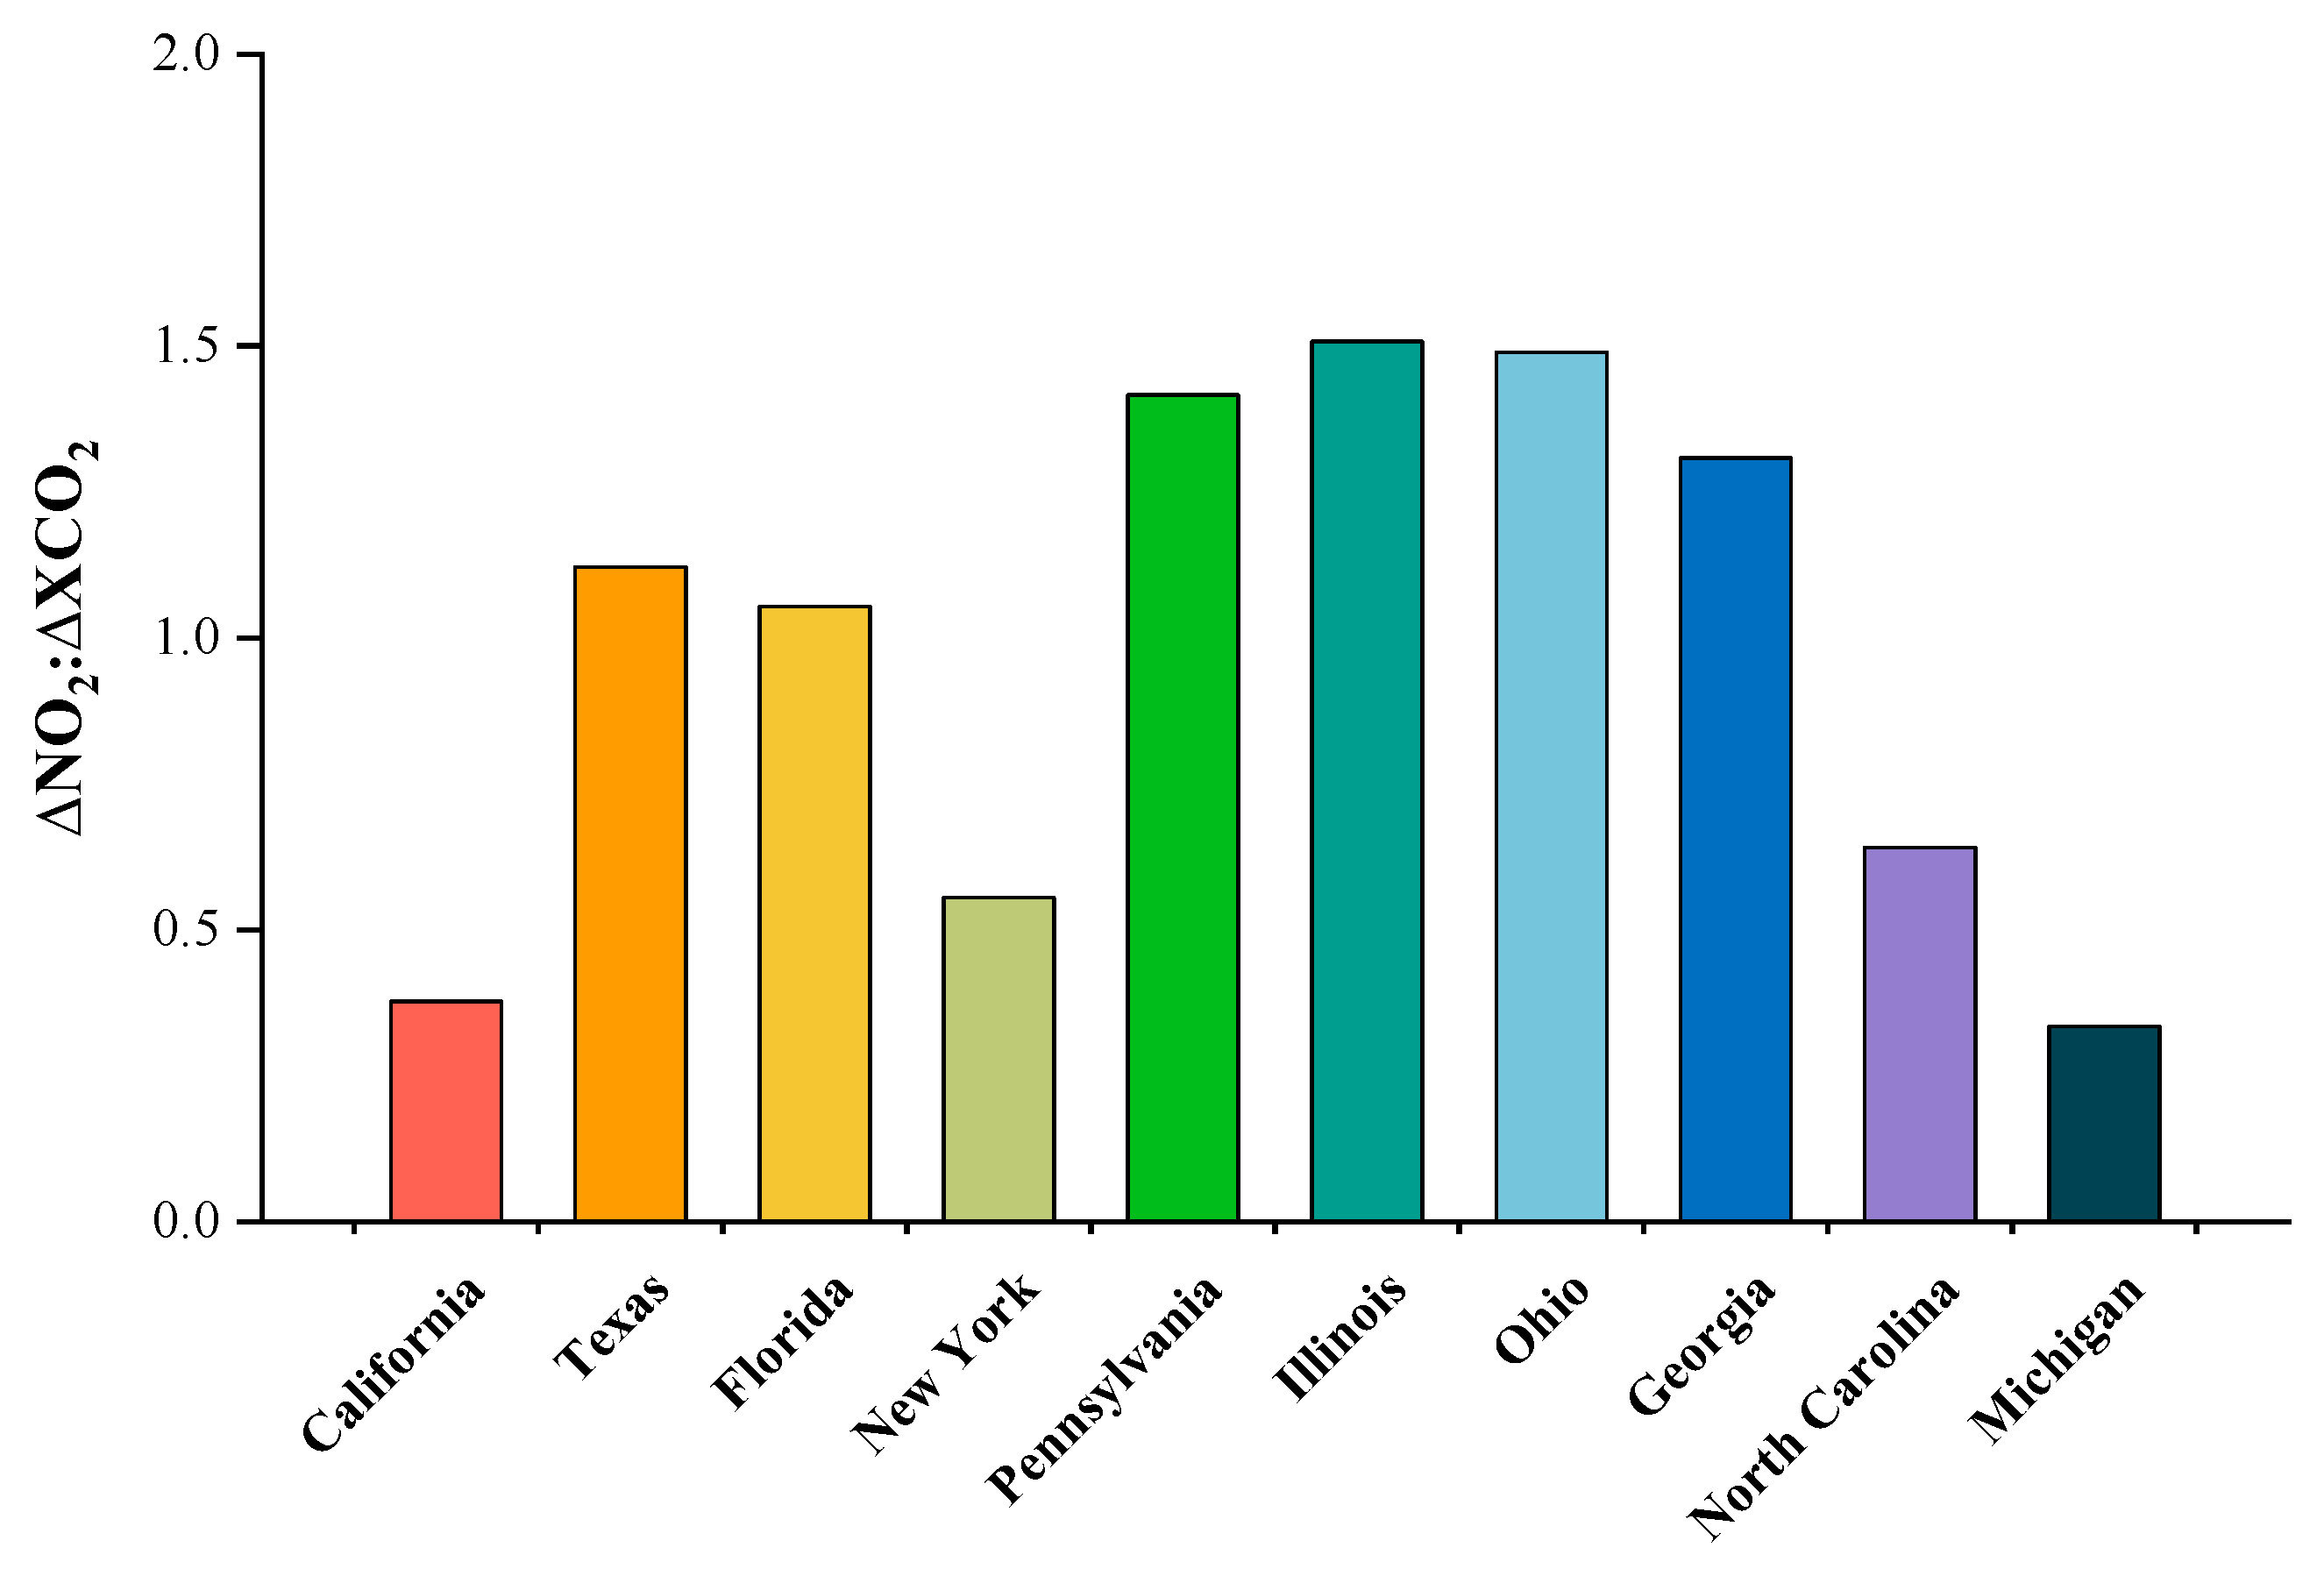
| Variable | Data Source | Spatiotemporal Resolution | Period |
|---|---|---|---|
| NO2 | TROPOMI sensor [24] | 1113.2 m, daily | September 2018–February 2023 |
| CO | TROPOMI sensor [25] | 1113.2 m, daily | September 2018–February 2023 |
| CO2 | OCO-2 satellite inversions [26] | 1.29 × 2.25 km, 16 days | September 2018–February 2023 |
| Period | 2019 | 2020 | |||||||
| State Name | Spring | Summer | Autumn | Winter | Spring | Summer | Autumn | Winter | |
| California | 0.34% | −0.27% | −0.38% | 1.02% | 0.37% | −0.44% | −0.30% | 0.89% | |
| Texas | 0.46% | −0.37% | −0.40% | 0.93% | 0.37% | −0.32% | −0.49% | 0.96% | |
| Florida | 0.63% | −0.54% | −0.36% | 0.89% | 0.52% | −0.51% | −0.28% | 0.99% | |
| New York | 0.46% | −1.34% | 0.24% | 1.21% | 0.29% | −1.26% | 0.27% | 1.28% | |
| Pennsylvania | 0.70% | −0.73% | −0.06% | 1.26% | 0.35% | −1.47% | 0.35% | 0.76% | |
| Illinois | 0.60% | −1.22% | 0.24% | 0.86% | 0.59% | −1.56% | 0.60% | 1.22% | |
| Ohio | 0.68% | −1.40% | 0.57% | 1.17% | 0.21% | −1.22% | 0.02% | 0.98% | |
| Georgia | 0.67% | −1.07% | 0.34% | 0.78% | 0.45% | −1.24% | 0.49% | 1.04% | |
| North Caroline | 0.22% | −0.88% | 0.09% | 0.93% | 0.50% | −0.99% | 0.20% | 1.08% | |
| Michigan | 0.66% | −1.58% | 0.62% | 0.49% | 1.17% | −1.29% | 0.15% | 0.57% | |
| Period | 2021 | 2022 | |||||||
| State name | Spring | Summer | Autumn | Winter | Spring | Summer | Autumn | Winter | |
| California | 0.48% | −0.34% | −0.45% | 1.02% | 0.53% | −0.64% | −0.23% | 0.73% | |
| Texas | 0.60% | −0.70% | −0.22% | 0.96% | 0.56% | −0.40% | −0.59% | 0.89% | |
| Florida | 0.46% | −0.55% | −0.20% | 0.59% | 0.75% | −0.62% | −0.26% | 0.87% | |
| New York | −0.23% | −0.79% | 0.48% | 1.28% | 0.10% | −1.31% | 0.65% | 0.39% | |
| Pennsylvania | 0.90% | −1.22% | 0.32% | 1.14% | 0.49% | −1.68% | 0.46% | 1.12% | |
| Illinois | 0.48% | −1.58% | 0.97% | 0.78% | 0.17% | −1.39% | 0.42% | 1.19% | |
| Ohio | 1.12% | −1.74% | 0.65% | 1.14% | 0.47% | −1.35% | 0.40% | 0.39% | |
| Georgia | 0.35% | −0.70% | −0.25% | 1.04% | 0.55% | −0.99% | 0.15% | 0.73% | |
| North Caroline | 0.35% | −1.45% | 0.62% | 1.06% | 0.33% | −0.90% | 0.03% | 1.00% | |
| Michigan | 1.28% | −1.46% | 0.47% | 0.85% | 0.82% | −1.67% | 0.41% | 1.10% | |
| State Name | Population (Millions) | 2020 Forest Cover (%) |
|---|---|---|
| California | 39.0 | 31.7% |
| Texas | 30.5 | 37.1% |
| Florida | 22.6 | 49.3% |
| New York | 19.6 | 61.7% |
| Pennsylvania | 13.0 | 58.0% |
| Illinois | 12.5 | 13.7% |
| Ohio | 11.8 | 29.9% |
| Georgia | 11.0 | 66.5% |
| North Caroline | 10.8 | 60.3% |
| Michigan | 10.0 | 55.7% |
| State Name | Spring 2019 NO2 Concentration | Spring 2020 NO2 Concentration | Increases |
|---|---|---|---|
| California | 20.59 | 20.11 | −2.37% |
| Texas | 19.26 | 19.01 | −1.27% |
| Florida | 20.99 | 18.64 | −11.19% |
| New York | 26.87 | 24.01 | −10.63% |
| Pennsylvania | 34.67 | 30.64 | −11.63% |
| Illinois | 28.81 | 27.93 | −3.05% |
| Ohio | 35.19 | 29.77 | −15.41% |
| Georgia | 23.45 | 18.23 | −22.25% |
| North Caroline | 24.90 | 20.68 | −16.93% |
| Michigan | 22.55 | 21.03 | −6.74% |
| Period | 2019 | 2020 | |||||||
| State Name | Spring | Summer | Autumn | Winter | Spring | Summer | Autumn | Winter | |
| California | 10.39% | −19.35% | 3.92% | 12.53% | 8.87% | −13.59% | 29.46% | −17.50% | |
| Texas | 17.80% | −22.56% | −0.98% | 14.19% | 14.80% | −22.17% | 8.88% | 3.76% | |
| Florida | 21.61% | −25.17% | 3.56% | 11.17% | 17.27% | −25.44% | 6.25% | 9.88% | |
| New York | 10.91% | −6.26% | −10.14% | 9.42% | 6.93% | −12.17% | 6.89% | 1.00% | |
| Pennsylvania | 12.19% | −7.32% | −10.10% | 9.52% | 8.60% | −12.93% | 5.31% | 1.49% | |
| Illinois | 13.50% | −12.37% | −6.63% | 11.58% | 9.27% | −14.40% | 5.55% | 3.29% | |
| Ohio | 13.86% | −10.17% | −9.40% | 10.27% | 9.19% | −13.19% | 5.53% | 2.10% | |
| Georgia | 19.36% | −19.35% | −0.25% | 9.27% | 15.14% | −20.26% | 1.43% | 9.25% | |
| North Caroline | 15.78% | −14.68% | −4.41% | 9.72% | 13.55% | −17.34% | 0.13% | 8.02% | |
| Michigan | 9.78% | −4.72% | −11.30% | 9.32% | 7.84% | −12.43% | 7.63% | 2.52% | |
| Period | 2021 | 2022 | |||||||
| State name | Spring | Summer | Autumn | Winter | Spring | Summer | Autumn | Winter | |
| California | 7.70% | −3.02% | −3.75% | −4.50% | 3.88% | −20.37% | 3.30% | 8.54% | |
| Texas | 10.20% | −17.11% | 4.01% | 0.33% | 9.98% | −21.36% | 0.00% | 8.72% | |
| Florida | 9.48% | −17.38% | 4.28% | −0.43% | 10.59% | −19.80% | −1.36% | 7.62% | |
| New York | 5.58% | 2.85% | −10.65% | −1.19% | 2.32% | −10.35% | −5.62% | 8.06% | |
| Pennsylvania | 6.98% | 0.32% | −8.95% | −1.34% | 2.19% | −10.06% | −6.03% | 7.49% | |
| Illinois | 7.26% | −2.12% | −7.85% | −0.64% | 5.34% | −16.18% | −3.51% | 10.00% | |
| Ohio | 7.16% | −0.52% | −8.70% | −1.13% | 2.89% | −12.21% | −4.49% | 7.73% | |
| Georgia | 10.68% | −11.71% | −1.35% | −2.23% | 10.30% | −17.41% | −3.17% | 6.01% | |
| North Caroline | 9.92% | −9.38% | −2.34% | −2.13% | 7.77% | −15.18% | −3.75% | 6.62% | |
| Michigan | 2.84% | 4.64% | −11.84% | −0.55% | 2.05% | −11.93% | −4.08% | 9.03% | |
Disclaimer/Publisher’s Note: The statements, opinions and data contained in all publications are solely those of the individual author(s) and contributor(s) and not of MDPI and/or the editor(s). MDPI and/or the editor(s) disclaim responsibility for any injury to people or property resulting from any ideas, methods, instructions or products referred to in the content. |
© 2023 by the authors. Licensee MDPI, Basel, Switzerland. This article is an open access article distributed under the terms and conditions of the Creative Commons Attribution (CC BY) license (https://creativecommons.org/licenses/by/4.0/).
Share and Cite
Xu, A.; Xiang, C. Assessment of the Emission Characteristics of Major States in the United States using Satellite Observations of CO2, CO, and NO2. Atmosphere 2024, 15, 11. https://doi.org/10.3390/atmos15010011
Xu A, Xiang C. Assessment of the Emission Characteristics of Major States in the United States using Satellite Observations of CO2, CO, and NO2. Atmosphere. 2024; 15(1):11. https://doi.org/10.3390/atmos15010011
Chicago/Turabian StyleXu, Anqi, and Chengzhi Xiang. 2024. "Assessment of the Emission Characteristics of Major States in the United States using Satellite Observations of CO2, CO, and NO2" Atmosphere 15, no. 1: 11. https://doi.org/10.3390/atmos15010011
APA StyleXu, A., & Xiang, C. (2024). Assessment of the Emission Characteristics of Major States in the United States using Satellite Observations of CO2, CO, and NO2. Atmosphere, 15(1), 11. https://doi.org/10.3390/atmos15010011


