Article

Cloud and Cloud Shadow Detection of GF-1 Images Based on the Swin-UNet Method

1
College of Remote Sensing and Information Engineering, North China Institute of Aerospace Engineering, Langfang 065000, China
2
Hebei Collaborative Innovation Center for Aerospace Remote Sensing Information Processing and Application, Langfang 065000, China
3
Aerospace Information Research Institute, Chinese Academy of Sciences, Beijing 100094, China
*
Author to whom correspondence should be addressed.
Atmosphere 2023, 14(11), 1669; https://doi.org/10.3390/atmos14111669
Submission received: 10 October 2023 / Revised: 7 November 2023 / Accepted: 8 November 2023 / Published: 10 November 2023
(This article belongs to the Special Issue Atmospheric Environment and Agro-Ecological Environment)

Abstract

:
Cloud and cloud shadow detection in remote sensing images is an important preprocessing technique for quantitative analysis and large-scale mapping. To solve the problems of cloud and cloud shadow detection based on Convolutional Neural Network models, such as rough edges and insufficient overall accuracy, cloud and cloud shadow segmentation based on Swin-UNet was studied in the wide field of view (WFV) images of GaoFen-1 (GF-1). The Swin Transformer blocks help the model capture long-distance features and obtain deeper feature information in the network. This study selects a public GF1_WHU cloud and cloud shadow detection dataset for preprocessing and data optimization and conducts comparative experiments in different models. The results show that the algorithm performs well on vegetation, water, buildings, barren and other types. The average accuracy of cloud detection is 98.01%, the recall is 96.84% and the F1-score is 95.48%. The corresponding results of cloud shadow detection are 84.64%, 83.12% and 97.55%. In general, compared to U-Net, PSPNet and DeepLabV3+, this model performs better in cloud and cloud shadow detection, with clearer detection boundaries and a higher accuracy in complex surface conditions. This proves that Swin-UNet has great feature extraction capability in moderate and high-resolution remote sensing images.

1. Introduction

The rapid development of satellites has provided greater space for the application and research of remote sensing technology. With its advantages of a wide range, a short cycle and abundant information, remote sensing technology has become an important tool in fields such as land use and change monitoring [1,2,3,4,5]. Moderate- and high-resolution satellites like MODIS, Landsat, Sentinel and GaoFen have yielded substantial observational datasets across diverse domains [6,7,8,9], encompassing surface information captured at varying spatiotemporal resolutions. Owing to the influence of natural climate phenomena, including atmospheric circulation, the Earth’s surface remains perpetually shrouded by a substantial cloud cover throughout the year. Global cloud coverage data, as reported by the International Satellite Cloud Climate Program (ISCCP), indicate that cloud coverage reaches nearly 66% [10,11,12]. Seasonal variations in cloud coverage over land exhibit substantial fluctuations, thereby imposing severe constraints on the observational capacity of optical remote sensing satellites. High-resolution satellites, in particular, are notably affected by this phenomenon, resulting in the omission of crucial geospatial data [13]. Abundant cloud cover obstructs the transmission of visible light, while varying degrees of cloud shadows diminish the sensor’s capacity to capture surface information under well-lit conditions. When obtaining land surface information through remote sensing methods, the distribution of clouds and their shadows hinders the effective utilization of data [14]. These factors impose constraints on the precise derivation of surface quantitative parameters and the attainment of spatially continuous products. This has had a negative impact on the research tasks of remote sensing images, especially in the fields of recognition and classification, object detection and tracking. Also, it has caused a significant waste of resources [15]. Therefore, it is necessary to accurately detect clouds and cloud shadows in medium- to high-resolution optical satellite images.
Currently, cloud and cloud shadow detection algorithms for remote sensing images are usually divided into two categories based on the number of images used. They are Single-date-based algorithms and Multi-date-based algorithms. Among them, the Single-date-based approach has gained prominence due to its reduced demand for intricate input data, making it a widely adopted and user-friendly detection technique. Since the 1980s, the technology for detecting clouds and cloud shadows in single-scene images has been in continuous evolution. Detection methods based on physical features of images often use one or more of the spectral, texture and geometric features of the image. On the basis of the single threshold method [16], Zhu et al. proposed the Fmask method [17], while Li et al. proposed the MFC method [18]. Fisher introduced morphological feature extraction based on spectral features [19]. The comprehensive application of multiple features has indeed gradually improved the accuracy of cloud and cloud shadow detection. Nevertheless, due to the influence of mixed pixels on the image, achieving high-precision recognition of slender and fragmented clouds remains challenging with the threshold method. With the advent of machine learning’s popularity, Kang et al. employed unsupervised cloud detection through support vector machine (SVM) methodologies along with guided filtering techniques [20]. Fu et al. attained a heightened detection accuracy and execution efficiency by employing random forest (RF) technology [21]. Hughes and Hayes combined spectral and spatial texture features to construct a neural network and tried to use it for cloud and cloud shadow detection in Landsat [22]. Deep learning methods are renowned for their intricate multi-layered neural network architecture and enhanced capacity for intricate feature extraction. Deep learning models, exemplified by Convolutional Neural Networks (CNNs) like VGG [23], AlexNet [24] and ResNet [25], have gained extensive adoption in the classification of remote sensing imagery [26]. Wu et al., focusing on GF-1 WFV imagery, acquired high-precision probability maps of clouds by amalgamating low-level and high-level features extracted through CNNs [27]. On the basis of fully considering the model structure, Yan et al. improved the detection performance by incorporating an improved residual model and pyramid pool module [28]. However, even if people use the improved methods of model fusion and module modification, the convolution-based method still has the inherent limitation that it can only obtain the features of a small range of neighborhoods. It is hard to capture global information and long-term feature dependence. Consequently, accurately monitoring high- and moderate-resolution satellite imagery, particularly thin and fragmented clouds against bright surfaces and shadows in low-reflectivity backgrounds, becomes arduous. These challenges increase the risk of losing critical edge details. Ultimately, it leads to a decrease in the accuracy of cloud and cloud shadow detection.
In addition to the development and evolution of CNN-based models, Transformer architecture models are also becoming increasingly mature. Transformer’s achievements in natural language processing and computer vision tasks related to image classification have received great praise [29,30]. It can utilize the advantages of structure to capture abundant feature information, achieving advanced performance in segmentation tasks [31,32]. In order to simultaneously obtain local- and global-scale feature information in the image, this model innovates a hierarchical window mechanism. Furthermore, it enhances the model’s processing efficiency through the application of the shifted-windows technique. Simultaneously, under the influence of traditional CNN-based models, Cao et al. enhanced the U-Net model, introducing an entirely Transformer-based architecture known as Swin-UNet [33].
It can be seen that in the semantic segmentation of remote sensing images, any irregular and unclear spectral feature target recognition is challenging. Therefore, the main motivation of each cloud and cloud shadow detection method is to effectively optimize the model structure and refine feature thresholds during the algorithm iteration. The Swin-UNet in this study compensates for the inability of the original CNN to capture long-distance features by adding Swin Transformer blocks, while preserving the original compact structure. It can better extract the local and global semantic features of large-scale complex features in high-resolution and medium-resolution images and demonstrates better performance [34]. Especially when facing high-resolution images with complex features, this model has been proven to be a great choice for detection tasks in different kinds of target recognition.
This paper introduces a methodology for cloud and cloud shadow detection using the Swin-UNet model, tailored for four-channel GF-1 WFV multi-spectral remote sensing imagery. Specifically, this study contrasts the detection outcomes of various models by employing preprocessing, data filtering and enhancement techniques and manipulating sample proportions. This study evaluates the feasibility of using the Swin-UNet model to detect clouds and cloud shadows in GF-1 WFV data through various parameter indicators. Additionally, the accuracy and robustness of this model in remote sensing image recognition and segmentation tasks are also the focus of our analysis. This endeavor aimed to address challenges like inadequate precision in cloud and cloud shadow detection and complexities related to boundary segmentation within moderate- and high-resolution imagery. This novel research field attempts to effectively combine machine learning and swarm intelligence methods [35,36] and has been proven to achieve outstanding results in different fields. In conclusion, a summary and outlook were made on the existing problems.
Section 2 introduces the materials and methods. Section 3 presents the experimental results. The discussion and conclusions are given in Section 4 and Section 5, respectively.

2. Materials and Methods

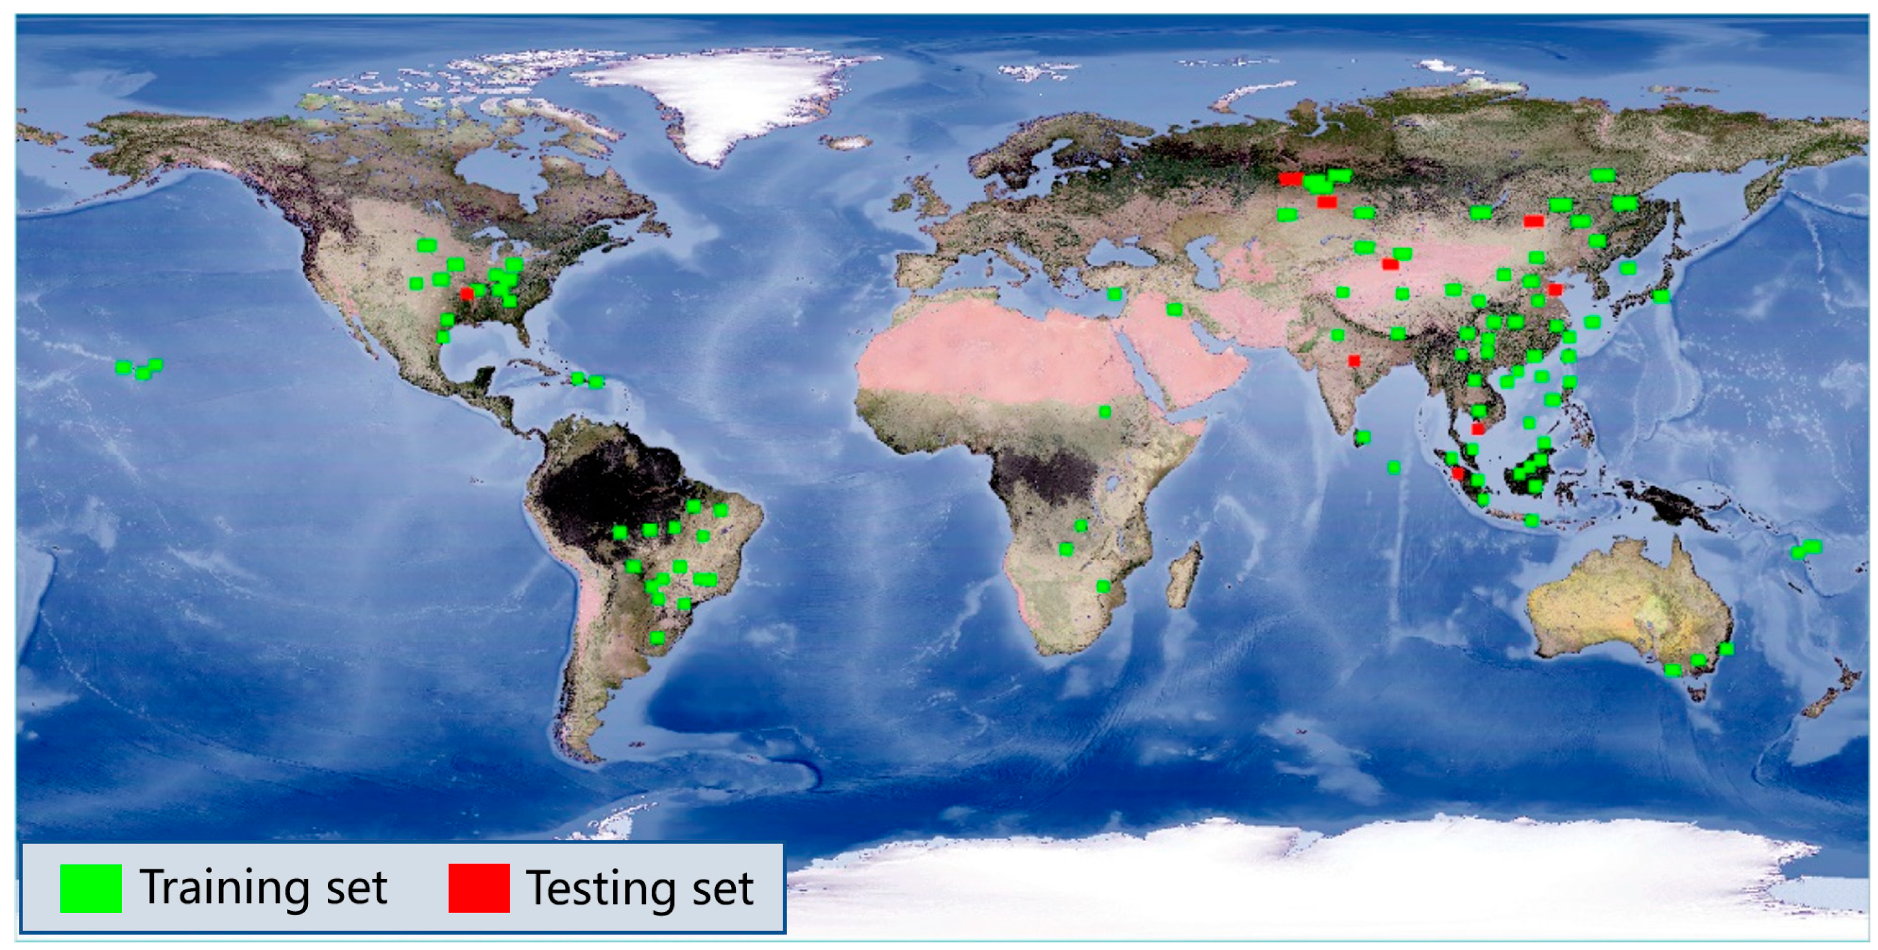
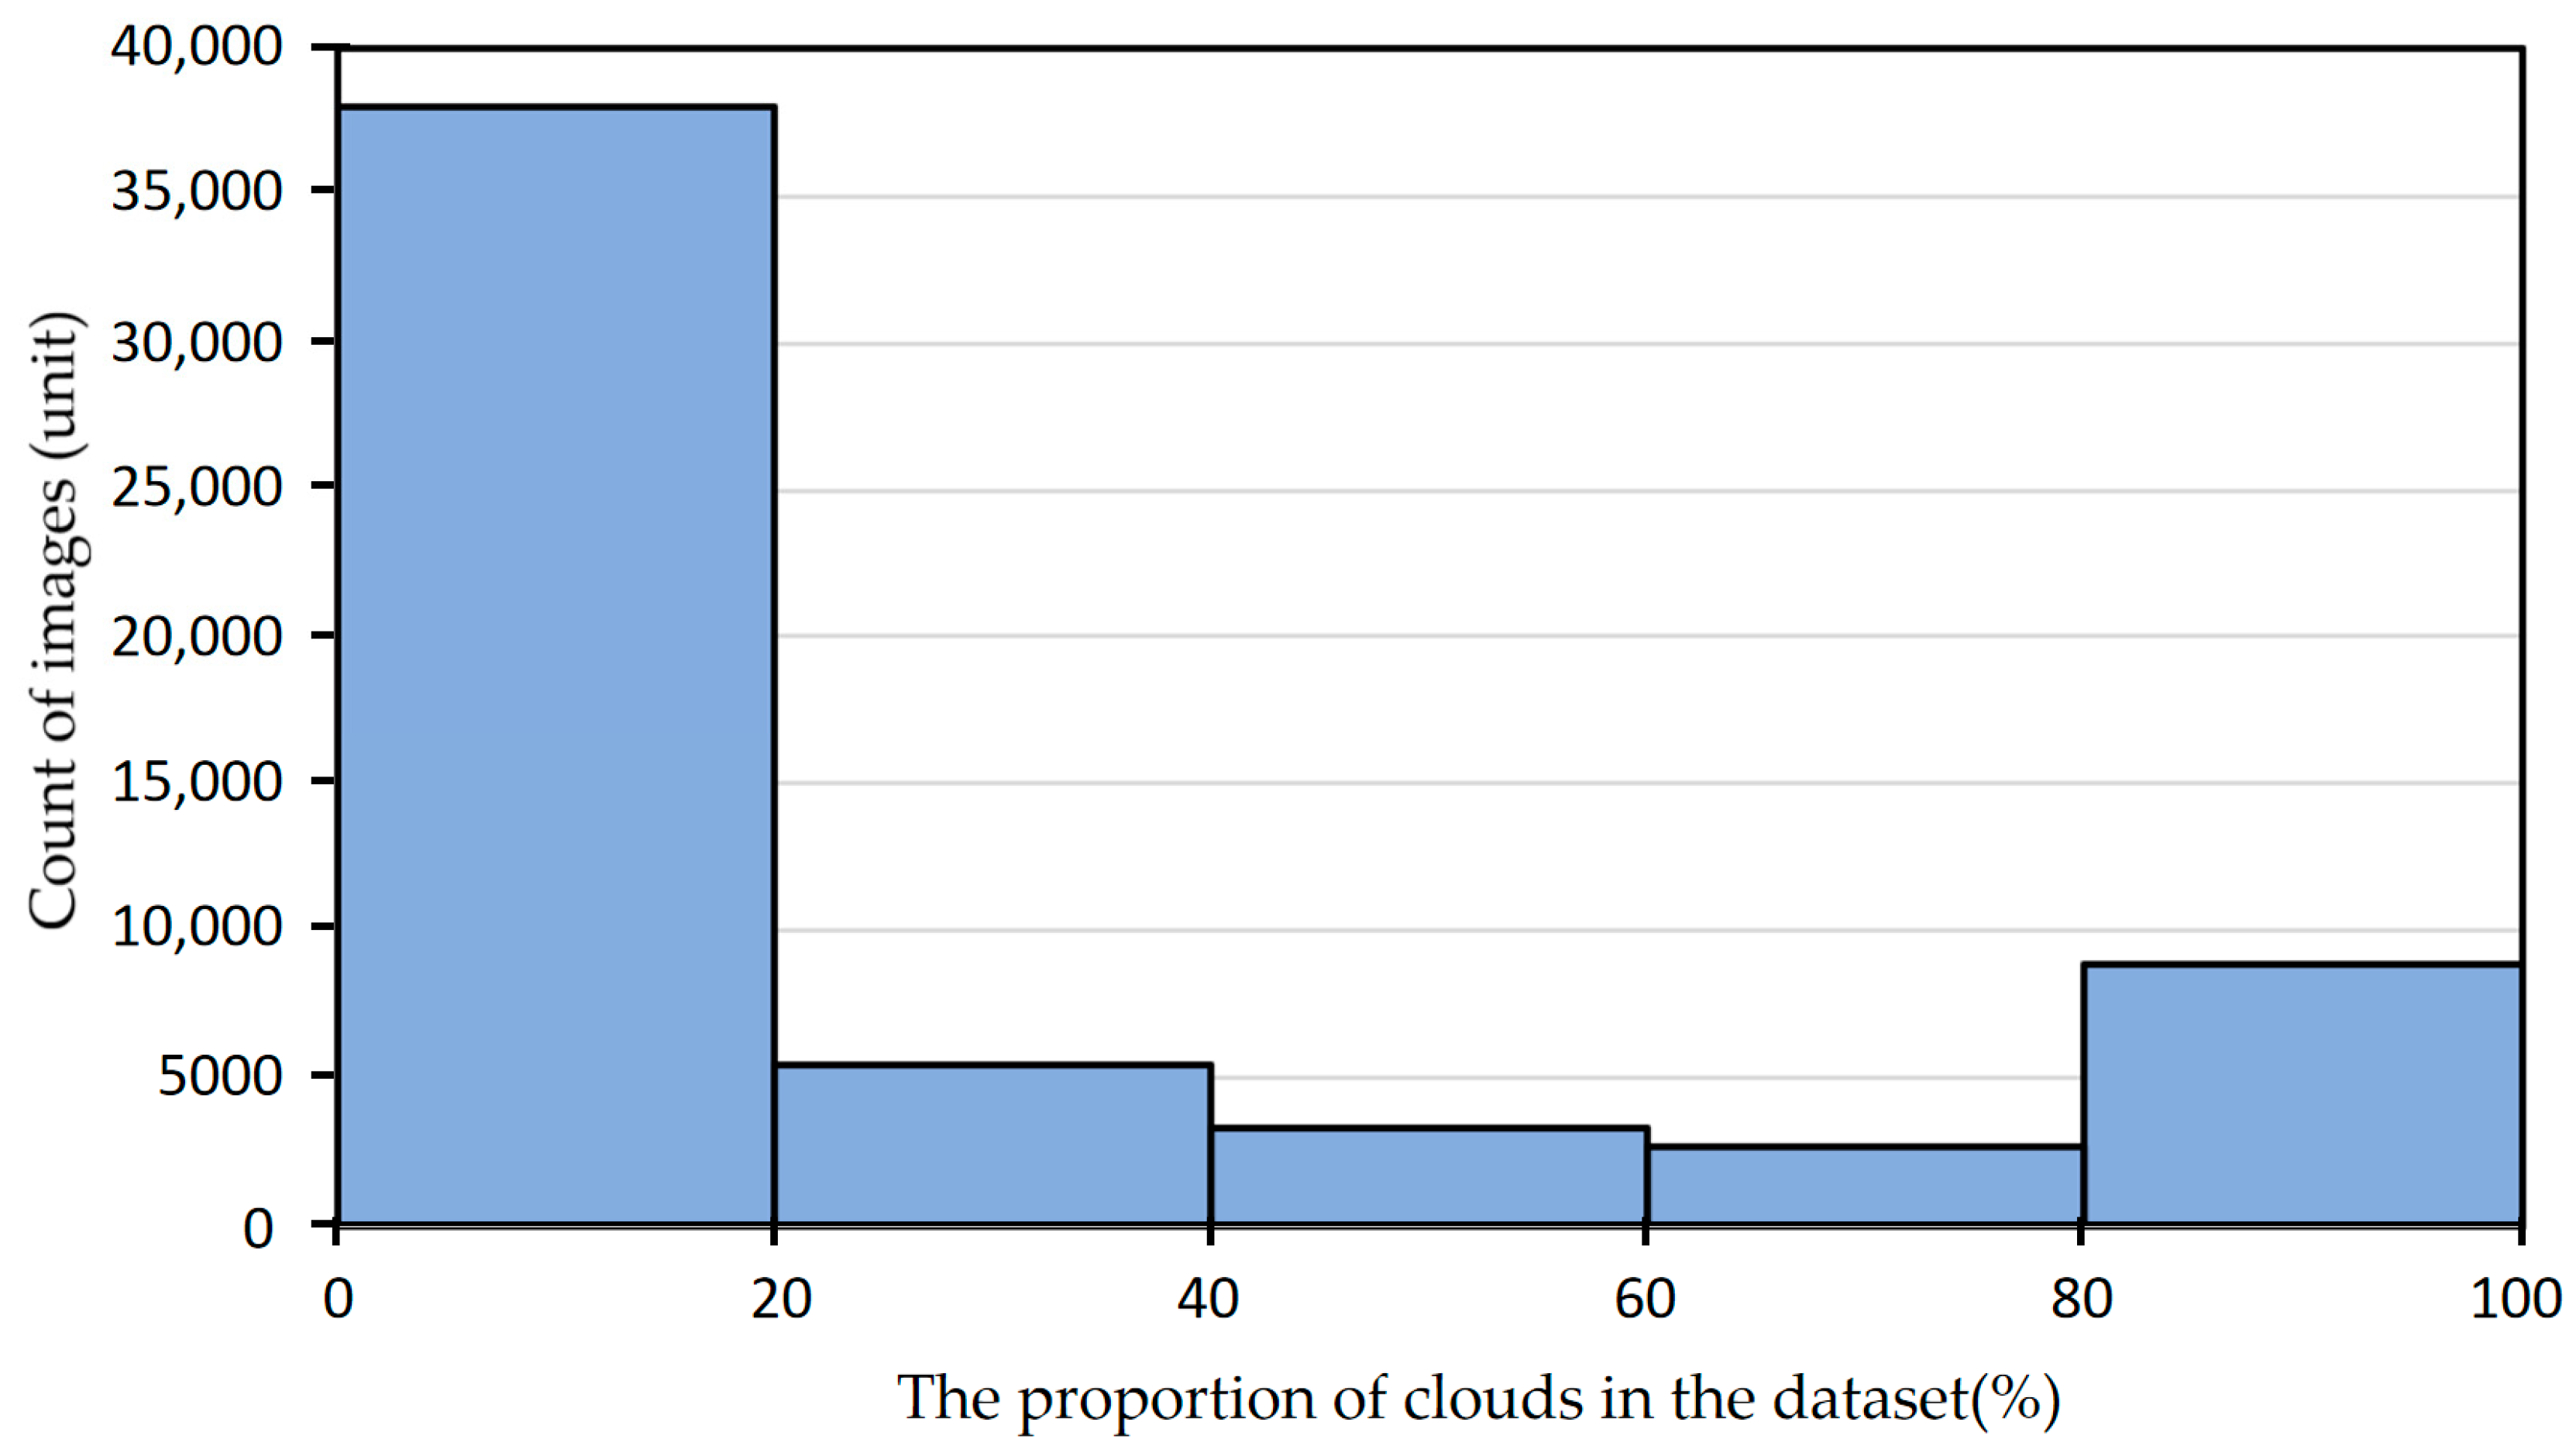
2.1. Datasets and Preprocessing

This study selected GF-1 WFV multi-spectral images, specifically using the publicly available GF1_WHU cloud and cloud shadow detection dataset [18] for related research. As the first major satellite of the civilian High-Definition Earth Observation Satellite (HDEOS) program, the GF-1 satellite was successfully launched by the Long March 2 carrier rocket in 2013. There are four WFV cameras installed on GF-1, capable of capturing multispectral images at a spatial resolution of 16 m. It comprises four spectral bands: blue (0.45–0.52 µm), green (0.52–0.59 µm), red (0.63–0.69 µm) and near-infrared (NIR) (0.77–0.89 µm). Furthermore, the satellite features four WFV sensors that concurrently cover a swath width of up to 800 km. Impressively, it offers a revisit period of merely 4 days, facilitating large-scale, short-term surface observation and monitoring capabilities [37].
The GF1_WHU dataset, released by the SENDIMAGE Laboratory at Wuhan University, provides 108 cloud and shadow cover validation images and its reference masks. It is important to note that the provided images are GF-1 WFV level-2A products, and these images were acquired across diverse global regions spanning the period from May 2013 to August 2016. They encompass a wide array of land cover categories, such as forests, bare land, ice and snow, rivers, urban areas and more. The diversity in scene types contributes to enhancing the model’s training generalization and robustness. The dataset needs to be allocated according to certain principles to achieve the best effect of model training. Notably, within the training set, 10% of the data were allocated for validation purposes. The dataset’s distribution is illustrated in Figure 1.
Moreover, preprocessing of the dataset is essential, including converting the Digital Number (DN) of remote sensing images into Top of Atmosphere Reflectance (TOA). This step aimed to retain the influence of clouds on reflectance in the calculation process. Given the inherent regularity in data processing for deep learning models, images and labels require unified cropping and filtering. This involved discarding slices containing irrelevant background values, resulting in the creation of 58,267 slices, each sized at 512 × 512 pixels. Simultaneously, it was imperative to recalibrate the DN values of the labeled data within the GF1_WHU dataset, aligning them with the values suitable for training the deep learning model. Within this study, the cloud and cloud shadow detection of the Swin-UNet is considered as multiple binary classification problems. Following the adjustment of DN values in the label data, separate datasets were created for cloud detection and cloud shadow detection. Concretely, the underlying surface and cloud, as well as the underlying surface and cloud shadow, are assigned values separately. The reference masks in the dataset are crafted through a manual process, involving the manual delineation of cloud and cloud shadow boundaries following visual assessment by experienced users. Despite its high accuracy, the manual drawing approach is not immune to occasional errors and biases. Consequently, this study conducted a more comprehensive investigation and dataset refinement. While maintaining sample diversity, the dataset excluded scenes containing glaring errors or those posing challenges in terms of differentiation. Figure 2 shows some scene examples, including misjudgment areas in different situations. Ultimately, a total of 1772 slices were discarded. Following the filtration process, owing to the distinctive brightness exhibited by clouds in the imagery, flipping operations are used to enhance existing datasets. This augmentation enhances the robustness of model training to some degree.

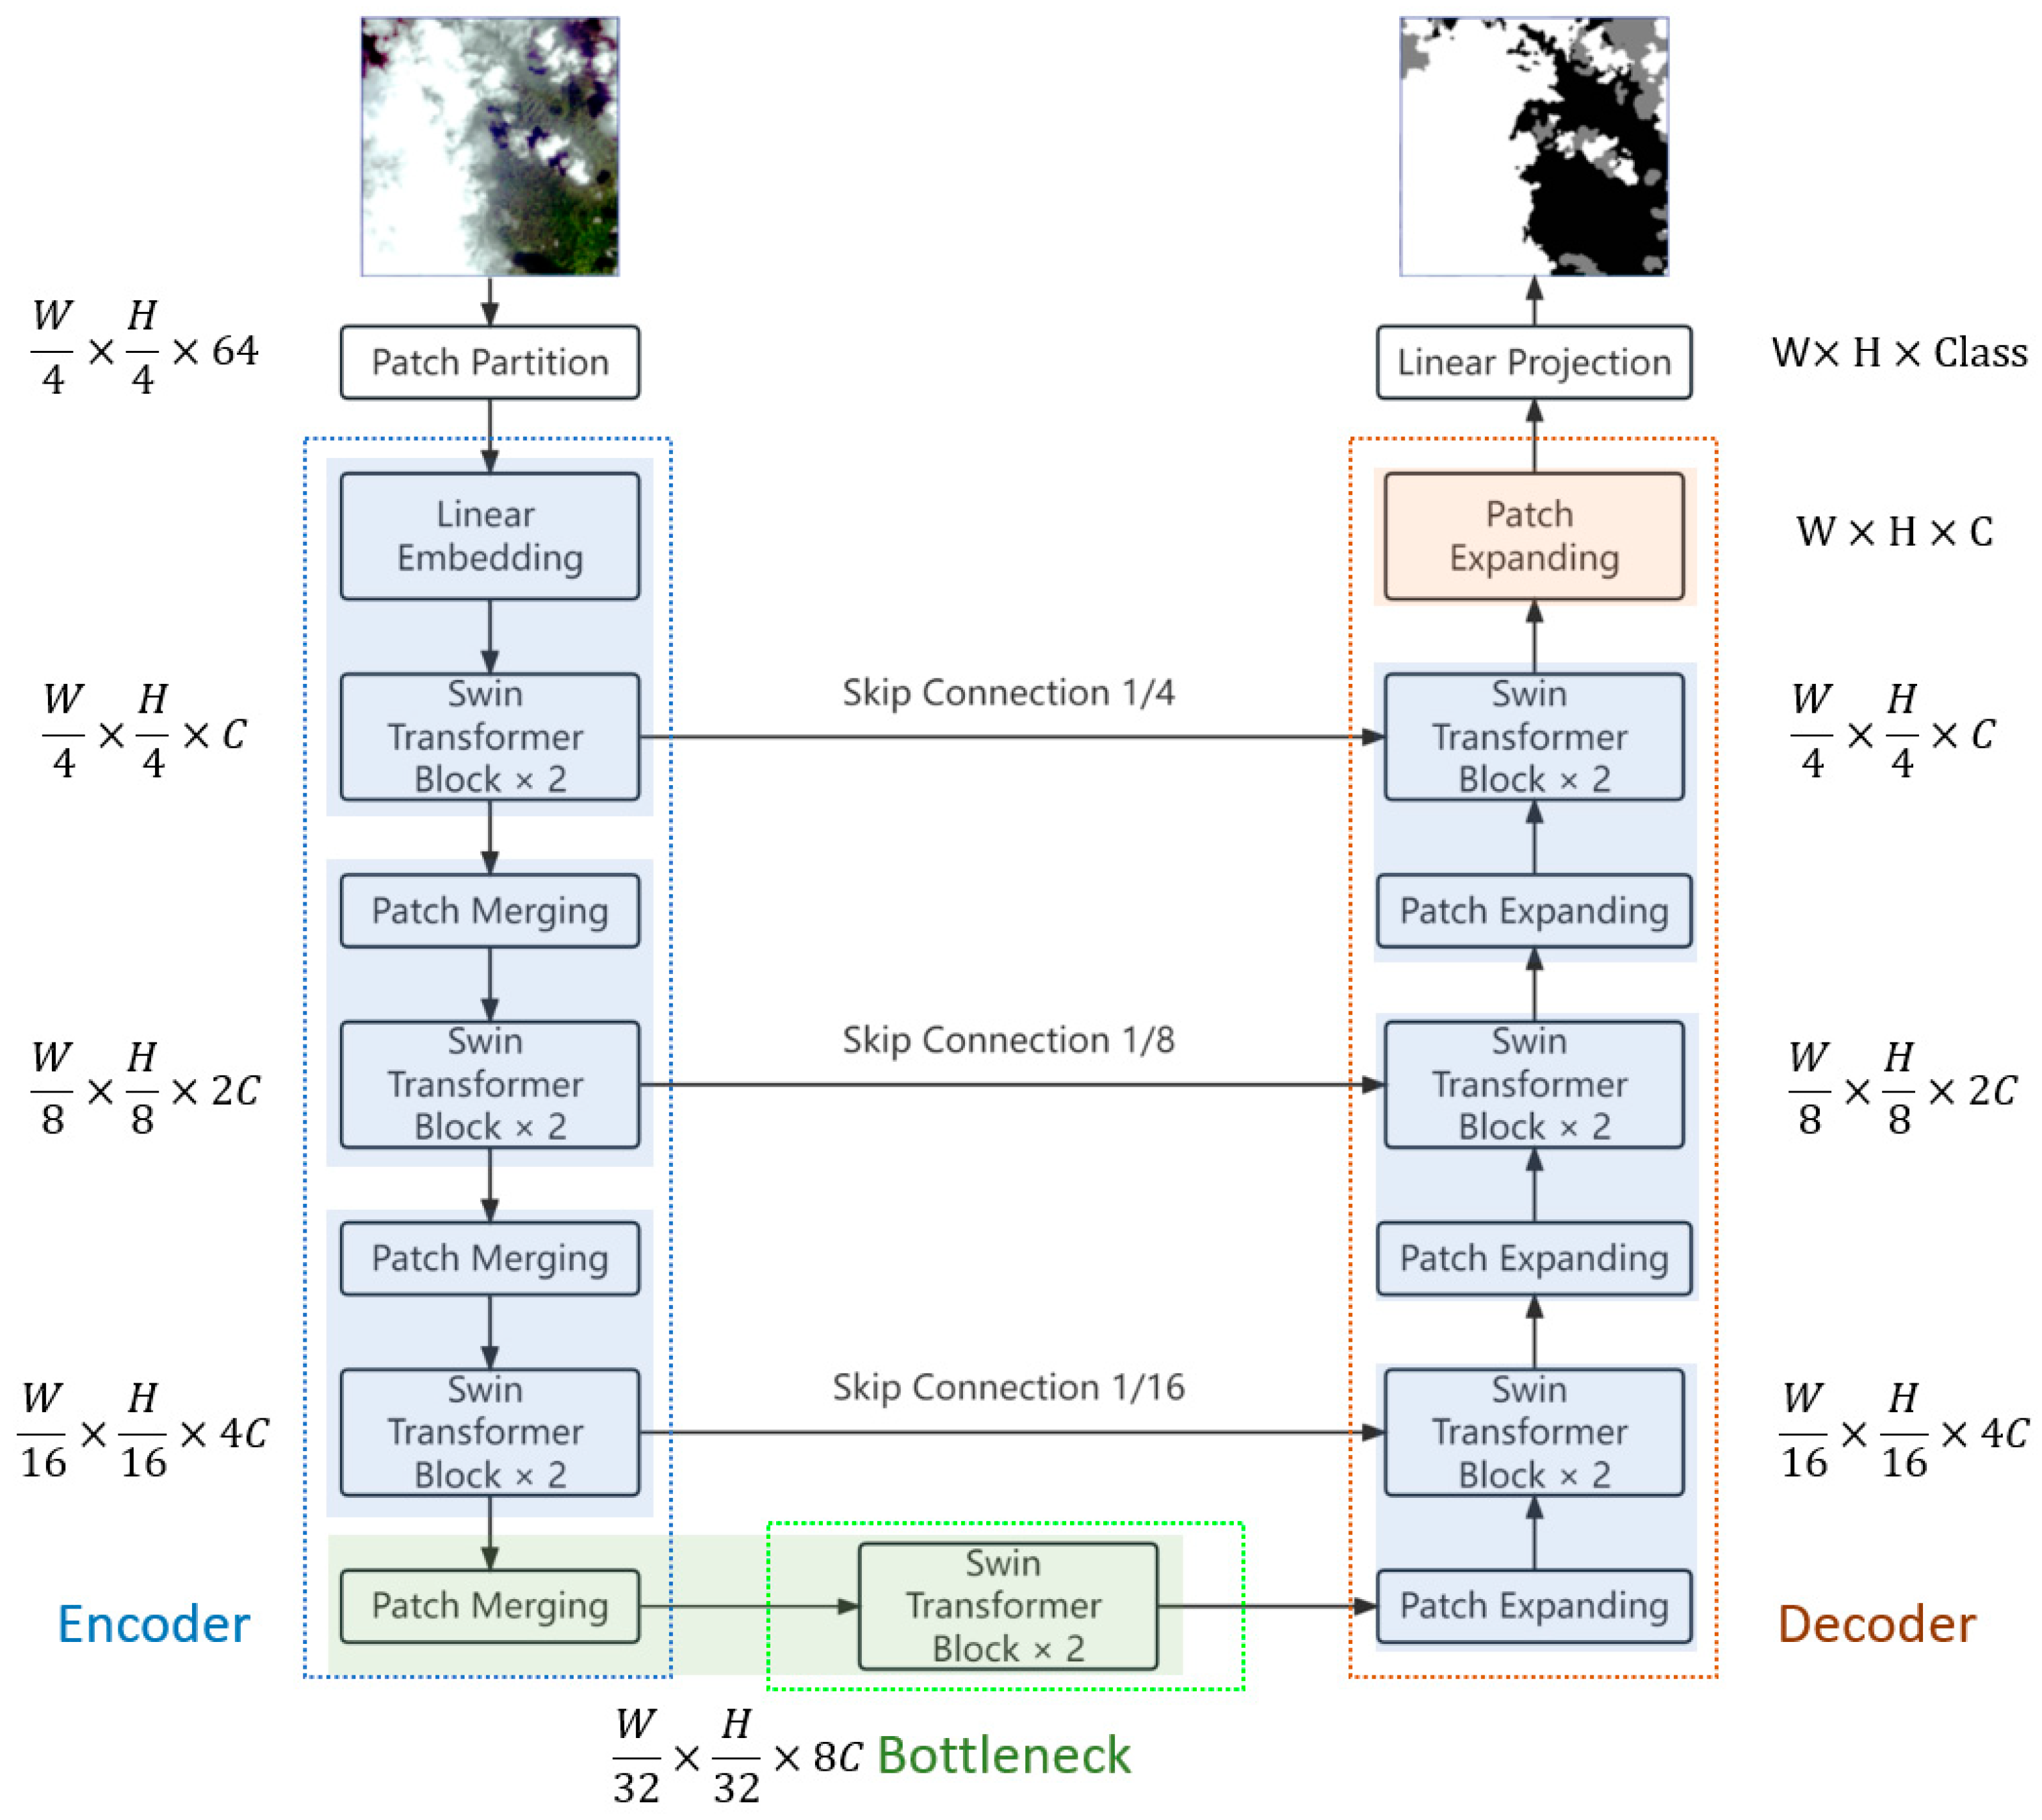
2.2. Technical Route and Swin-UNet

Figure 3 shows the technical methods used in this study. Data and preprocessing details are presented in the preceding section, with the current section dedicated to elucidating the employed models. The processed dataset is fed into the model, which subsequently undergoes a multi-layer training process to establish a robust and precise network structure for predictive purposes.
Swin-UNet adopts a Transformer architecture, preserving the U-shaped network structure in U-Net, while replacing convolutional operations with the Swin Transformer block. In order to gain a clearer understanding of the Swin-UNet network structure and the Swin Transformer block, this paper provides corresponding schematic diagrams. Simultaneously, Swin-UNet proficiently addresses two persistent challenges: the inability of CNNs to capture long-distance features and the inherent difficulty in training Transformers. Swin, alternatively referred to as “Shifted Windows”, offers a hierarchical interaction approach and the capability to extract local features, rendering it apt for handling extensive image datasets. This enables it to maintain commendable accuracy and efficiency. Swin Transformer solves the intensive prediction tasks that traditional architectures struggle to handle with sliding windows. The shifted window mechanism breaks the inherent limitations of local windows, and flexible connectivity ensures the effective operation of cross window methods.
Figure 4 reveals the overall network structure, comprising three core components: the encoder, decoder and skip connection. Initially, the input remote sensing image undergoes processing through a patch partition block. This block segments the GF-1 WFV slice image into 512 × 512 patches using a 4 × 4 processing unit, concurrently expanding the number of channels to sixteen times the original size. The segmented data then proceed to the encoder section, where semantic feature extraction takes place. The linear embedding layer adjusts the number of input data channels based on a threshold denoted as C. Subsequently, the alternating arrangement of Swin Transformer blocks and patch merging layers enables the production of feature representations at different scales in the encoder section. In this process, the data’s dimensions in length and width are halved, while the number of channels doubles with each step. The Swin Transformer block is tasked with extracting high-resolution image features, while the patch merging layer handles down-sampling to reduce the resolution of the feature map at this stage by half. Bottleneck layers are incorporated to prevent the models from becoming excessively deep, which could hinder convergence. The neatly symmetrical network structure elucidates the decoder’s functionality. In order to improve resolution and reduce dimensionality, the model performs up-sampling in the decoder section. The skip connection layer plays an important role in concatenating contextual information, by fusing deep and shallow layer features to compensate for the loss in the down-sampling process. Upon restoration to the original size, the linear projection block is employed for pixel-level predictions, ultimately yielding the final output.
The Swin Transformer block (Figure 5) employs a sequential structure comprising a window-based multi-head self-attention (W-MSA) module, a shifted window-based multi-head self-attention (SW-MSA) module and a 2-layer Multilayer Perceptron (MLP) with Gaussian Error Linear Units (GELU) non-linearity. These components are organized alternately within four LayerNorm (LN) layers. To express this, the Swin Transformer block can be represented as follows:
z ^ l = W M S A L N z l 1 + z l 1 ,
z l = M L P L N z ^ l + z ^ l ,
z ^ l + 1 = S W M S A L N z l + z l ,
z l + 1 = M L P L N z ^ l + 1 + z ^ l + 1 ,
Among them, z ^ l and z l represent the outputs of the l t h  W-MSA module and MLP module, respectively. Utilizing a window partitioning mechanism in its design, the Swin-UNet enhances its capacity to comprehend and represent semantic information within images, thereby elevating its performance in image segmentation tasks.

2.3. Evaluation Index

Currently, the main method for evaluating image segmentation relies on the confusion matrix (Table 1), with four basic parameters as the core evaluation. By performing linear operations on four parameters, more authoritative evaluation indicators for semantic segmentation can be derived.
Employing appropriate performance metrics to assess cloud and cloud shadow detection methods is essential for evaluating their effectiveness. Therefore, the validation indicators selected for the experiment include the Overall Accuracy (OA), Precision (P), Recall (R), Intersection over Union (IoU) and F1-Score. The specific formulas are outlined below:
O A = T P + T N T P + F P + T N + F N ,
P = T P T P + F P ,
R = T P T P + F N ,
F 1 = 2 P R P + R ,
I o U = T P T P + F P + F N ,

2.4. Experimental Setting and Implementation Details

The algorithm presented in this paper is implemented using the PyTorch deep learning framework on a Windows 10 system equipped with an NVIDIA GeForce RTX 3060 GPU (Graphics Processing Unit). This experiment is centered on binary classification at distinct levels, specifically targeting cloud detection and cloud shadow detection. The analysis of network behavior and the extraction of target-specific feature information is conducted for each category individually, with a particular emphasis on identifying the features that differentiate the target category from others.
Network training employs the AdamW optimizer, an adaptive gradient method that leverages both first-order and second-order moment estimates. The exponential decay rates used to estimate the first and second moments are set to β 1 , β 2 . Some essential parameters in model training are shown in Table 2.
The loss function of binary classification consists of Dice Loss and Binary Cross Entropy Loss. The Dice coefficient serves as a similarity measurement function for sets and is commonly employed to assess the similarity between two samples. Its values fall within the range of 0 to 1. The optimizer is utilized for parameter updates, and the best training outcomes are employed for multiple training iterations. To facilitate pre-training, the best model weights obtained during the training process can serve as the initial weights for subsequent training sessions.

3. Results

3.1. Comparison of Results between Models and Distribution Analysis

Numerous studies have demonstrated the effectiveness of CNN-based models in cloud detection. To investigate the influence of different backbone networks on segmentation outcomes, this study carefully selected various mainstream CNN-based network models, including their enhanced versions, for comparative experiments aimed at a comprehensive evaluation of model predictions. Specifically, the models used for comparison include U-Net, DeepLabV3+ [38,39] and PSPNet [40]. DeepLabV3+ has a higher detection performance by combining with Atrus convolution. It can obtain multi-scale information of images under complex feature conditions and is capable of performing target recognition tasks under certain conditions. PSPNet has been optimized based on the pyramid pool module. The models selected in this study have certain representativeness and typicality, which can reflect the current level of cloud and cloud shadow detection methods based on CNN models. Among them, U-Net adopts VGG16 architecture, while DeepLabV3+ and PSPNet adopt MobileNet. These choices represent optimal configurations. In comparison to alternative backbone networks, these selections consistently yielded superior performance and currently represent the prevailing approaches for cloud detection in remote sensing imagery. All models underwent uniform training from scratch. Additionally, the dataset includes data from four WFV sensors, confirming the model’s suitability across various sensor types. The similarity and difference of target distribution often need to be evaluated through pixel-by-pixel analysis methods. The experimental results, as presented in Table 3 and Table 4, highlight the exceptional performance of the Swin-UNet across all evaluation metrics for GF-1 WFV.
Figure 6 presents a histogram depicting the overall accuracy of Swin-UNet for cloud and cloud shadow detection, revealing that over 90% of the validation results achieved an overall accuracy exceeding 90%. The exceptions were limited to validation datasets encompassing water bodies and adjacent bright surfaces. Overall, despite the input data consisting of only three visible light and one near-infrared channels, contemporary cloud detection methods relying on deep learning models exhibit relatively effective detection capabilities. As depicted in Table 3, except for Swin-UNet, other models have relatively higher recall than accuracy, implying that the model tends to produce more instances of over-detection than missed detection. Distinguishing the local high-light surface from the cloud is challenging, particularly in areas where the high-light surface is adjacent to the cloud. This includes bare ground, buildings and other man-made structures. Apart from IoU, Swin-UNet outperforms all other metrics. It achieves precision, F1-score and recall rates of 98.01%, 95.48% and 96.84%, respectively. Table 4 presents the performance indicators for various models in cloud shadow detection. The average overall accuracy across all models is quite similar, with each exceeding 97%. Swin-UNet exhibits the highest precision and F1-score, although its recall rate and cloud shadow IoU are slightly lower compared to those of U-Net, by 1.22% and 3.48%, respectively. PSPNet exhibits subpar detection results due to its reliance on pyramid pooling modules for global information gathering. However, to maintain uniform input and output dimensions, the feature layers before and after pooling are directly combined for up-sampling, resulting in a coarser detection outcome that is more susceptible to missed detections. DeepLabV3+ delivers superior detection performance by leveraging the hollow space pyramid module to extract information from varying fields of view. It comprehensively addresses the multi-scale challenge posed by the detected object and integrates multi-scale features, resulting in a more detailed detection outcome. The Swin Transformer block has proven its efficacy in the feature extraction process of moderate- and high-resolution images. Its optimized multi-head self-attention mechanism allows for more precise concentration on target features while mitigating potential interference. It is evident that Swin-UNet excels in multiple performance metrics, underscoring its effectiveness in addressing the limitations associated with limited spatial information and a narrow spectral range in moderate- and high-resolution remote sensing images. These challenges have historically constrained data processing and application in the context of GF-1 WFV images.
Figure 7 is a visual display of the global detection results of true color images using Swin-UNet. It is evident that Swin-UNet exhibits minimal errors in the overall view, and its distribution accuracy is noteworthy. It only has false detections in a small range of bright surfaces and shallow thin clouds. The model achieves high-precision image segmentation by extracting spectral, textural and other features from four-channel data. It excels in refining target edges and recognizing small and subtle clouds and cloud shadow areas. Clearly, Swin-UNet, trained on a large dataset, adeptly tackles image segmentation tasks at moderate and high resolutions, such as GF-1 WFV. It efficiently generates accurate cloud and cloud shadow masks.

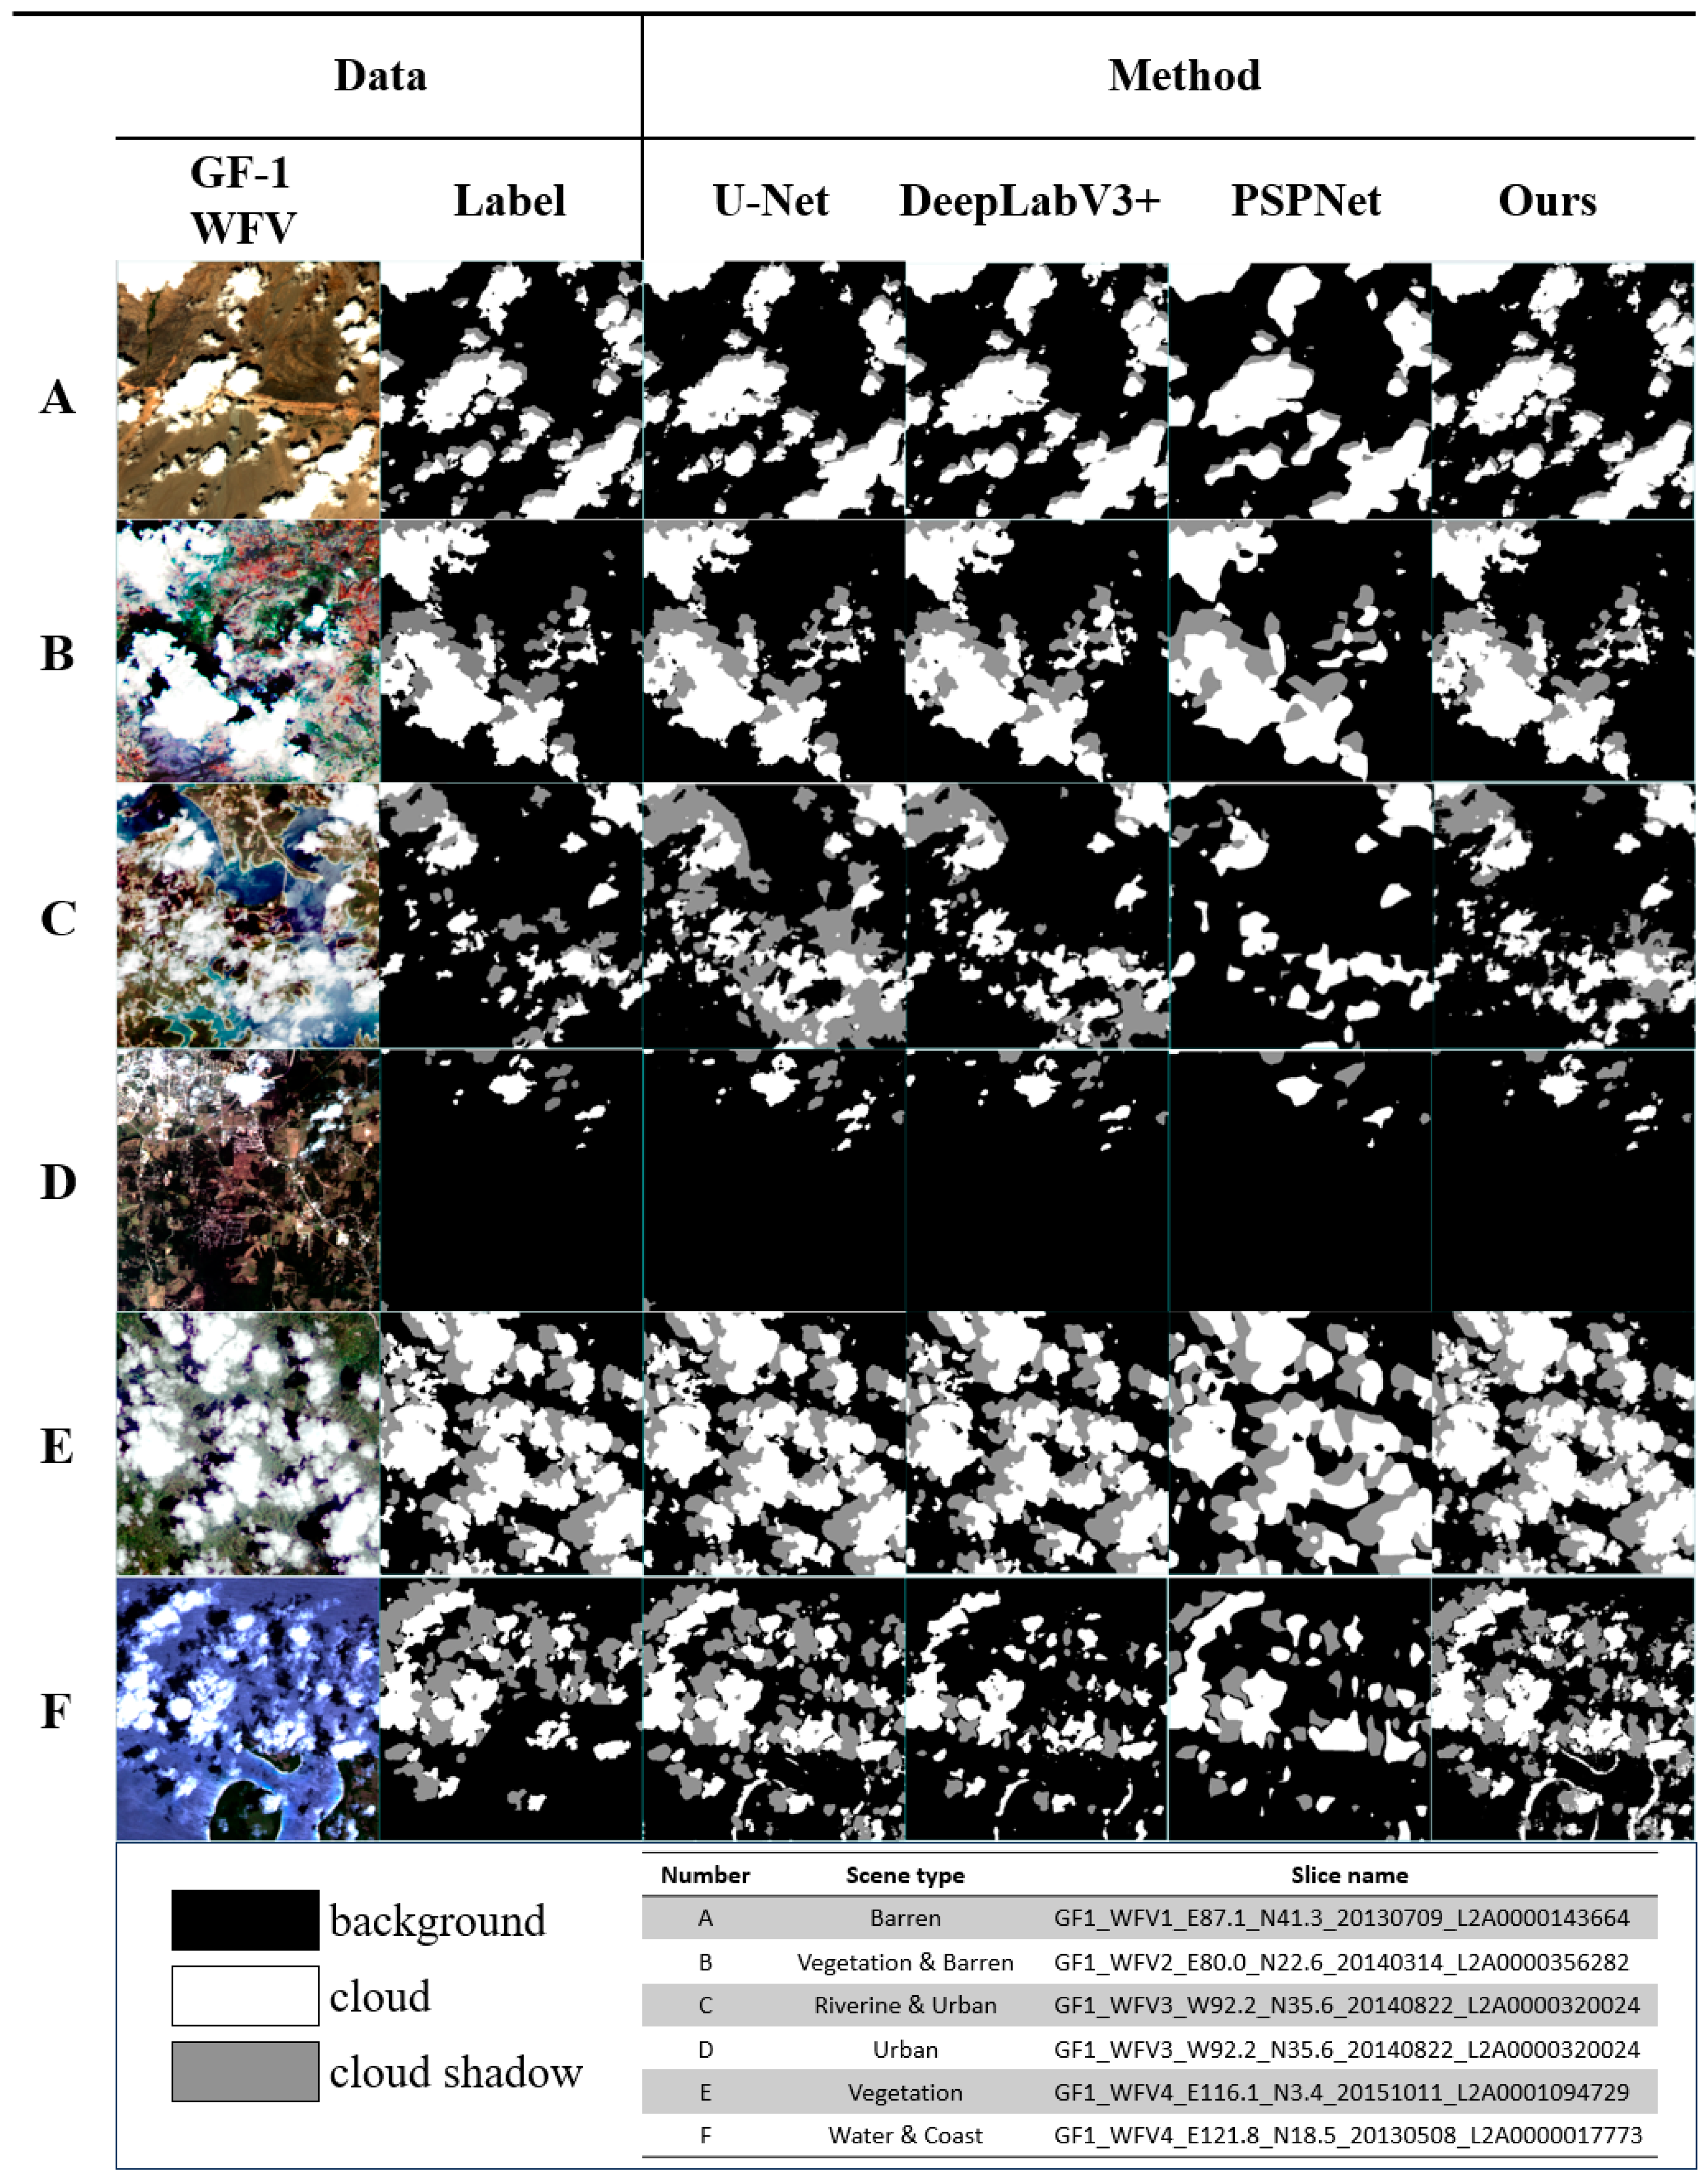
3.2. Comparison of Different Land Cover Scenarios

The model’s detection performance exhibits some degree of applicability but frequently yields substantial variations in detection outcomes across different scene contexts. Generally, cloud and cloud shadow detection demonstrate high precision in vegetated regions like grasslands. However, it can occasionally suffer distortion in areas like barren land and water bodies, particularly in terrain scenarios where spectral and texture features exhibit similarities. The model often encounters challenges distinguishing clouds from bright surfaces like ice and snow, as well as distinguishing cloud shadows from dark surfaces like water bodies. In this section, in order to evaluate the applicability and robustness of the model, the results of various land cover scenarios are used for comparative analysis. To be specific, the experimental validation data can be categorized into scenarios including barren land, vegetation, water bodies, urban areas and coastal regions.
Figure 8 illustrates that the Swin-UNet, employed in this study, exhibits superior segmentation performance in comparison to other models. The Swin-UNet demonstrates strong performance in a majority of scenarios, effectively delineating cloud and cloud shadow areas and their boundaries. However, it exhibits weaker recognition performance in a minority of cases. In scenes featuring barren land and vegetation, all models consistently excel in detecting clouds and cloud shadows, primarily because there are no visually ambiguous ground objects in these environments. However, when faced with water bodies in scenarios C and F, the detection performance is frequently suboptimal. Water surfaces inherently possess low reflectivity and are dark in appearance, which complicates the model’s ability to identify targets, particularly minor clouds above the water. Notably, the Swin-UNet consistently maintains relatively stable performance, providing evidence that the unique attention mechanism of it plays a crucial role in the classification task of remote sensing images. In the case of cloud shadow regions, which are challenging for traditional CNN models to recognize, this model ensures accurate detection while minimizing the likelihood of false positives and missed detections. PSPNet consistently underestimates cloud shadows over water areas, and the model exhibits a relatively smoothed edge detection behavior across all scenarios. This results in challenges related to the missed detection of thin clouds and the loss of edge details. DeepLabV3+ performs relatively well, offering finer boundary detection and capturing minor details within the scenes. However, it continues to disregard the impact of cloud shadows in scene F. In scene D, a bright surface is present in the urban area, resembling the ice and snow area, which can be easily mistaken for clouds. Nonetheless, in this scenario, all models perform admirably, with no conspicuous erroneous detections across a substantial area. In scene F, nearly all experimental models identify the prominent features in the coastal region as clouds. This recognition might be attributed to the textural similarities between these features and actual clouds.

4. Discussion

4.1. Influencing Factors of the Accuracy

In deep learning models, increased band information frequently enhances classification performance. While high-resolution satellite data offer greater imaging detail, their constrained number of channels restricts the accessibility of image information. Consequently, this limitation partially hinders the capacity of deep learning models to extract data information. Furthermore, in the binary classification of specific targets, the proportion of positive and negative samples constitutes a relevant influencing factor. Figure 9 and Figure 10 depict the cloud coverage and cloud shadow coverage for all images within the dataset. The results indicate that the distribution of clouds and shadows is mostly concentrated within 20%. There are almost no datasets with cloud shadows greater than 40%. Specifically, the dataset’s cloud shadow content is typically limited, encompassing merely 15% of the data, with cloud shadows equal to or exceeding 10%.
In this study, 7602 slices with a cloud shadow content exceeding 10% were extracted, and the influence of sample proportion factors on the experimental results was compared. Figure 11 presents a weight chart that visually illustrates the segmentation outcomes under varying sample proportions in the comparative experiment. The weight map demonstrates Swin-UNet’s focus on cloud shadow targets. Pixel colors in the range from red to purple signify a decreasing weight ratio attributed to cloud shadows, similar to a probability map for cloud shadow detection. A concentration of red, yellow and green areas on actual cloud shadows within the weight map signifies heightened attention, a larger recognition decision proportion and improved segmentation effectiveness. In Figure 11, two distinct data samples with varying surface conditions were chosen as test images. It is evident that, under conditions featuring a more abundant and balanced distribution of cloud shadow samples, the model can precisely direct its attention toward cloud shadows, thereby substantially mitigating background noise interference. Therefore, in order to achieve better detection performance in the model, it is necessary to allocate the proportion of positive and negative samples reasonably. The GF1_WHU dataset employed in this study falls slightly short in this regard. It was originally intended for rule-based physical validation research rather than for deep learning model applications. In this study, the dataset underwent manual screening, a process that proves beneficial for model training.
Furthermore, the model’s utilization of a sliding window mechanism restricts its detection field of view. Consequently, in certain scenarios, detecting the boundary between clouds and cloud shadows, along with subtle cloud shadow regions, becomes challenging.

4.2. Limitations and Prospects

Following an analysis of existing studies, it becomes evident that cloud and cloud shadow detection accuracy tends to be higher in low-latitude plains and similar regions. This phenomenon arises due to differences in surface conditions, such as vegetation and bare land, which contrast distinctly with clouds and cloud shadows. Consequently, the model excels at accurately extracting feature information for recognition purposes. Nonetheless, the accuracy of detection in areas featuring water and snow cover is somewhat lacking. These long-term impacts based on spectral feature information have been difficult to be effectively recognized by machine learning models, especially for cloud shadow targets. Furthermore, the experimental dataset has inherent limitations, as it lacks comprehensive representation of areas like ice and snow. Although Swin-UNet currently performs better in the semantic segmentation of GF-1 images than CNN-based models, it still faces challenges in its applicability when dealing with these challenging, hard-to-distinguish targets. Simultaneously, as the utilization of deep learning models matures, we aspire to gather and furnish additional high-quality datasets for cloud and cloud shadow detection, with a particular emphasis on enhancing datasets related to cloud shadows. Furthermore, it is very meaningful to explore other Transformer-based network models for related research, which can further provide new detection methods that integrate multiple feature information sources.

5. Conclusions

Presently, the Gaofen series satellites have reached a high level of maturity, offering remote sensing services within a global multi-scale framework. They hold substantial importance for a wide range of environmental monitoring endeavors. Cloud detection, as a preprocessing step in remote sensing image analysis, serves as a critical cornerstone for subsequent quantitative analysis and monitoring applications. When facing data with limited available band information such as GF-1, the accuracy of traditional methods is usually insufficient, especially in thin clouds and cloud shadow areas. In this study, Swin-UNet, which was used for cloud and cloud shadow detection in GF-1 images, achieved commendable results. The experimental findings lead to the following conclusions:
(1)
Swin-UNet demonstrates exceptional performance in the detection of clouds and cloud shadows within GF-1 WFV optical imagery. It attains an average accuracy of 98.01% in cloud detection, with a recall rate of 96.84% and an F1-score of 95.48%, all surpassing results achieved by other models. Furthermore, its performance in cloud shadow detection is equally impressive.
(2)
Compared with CNN-based models such as U-Net, DeepLabV3+ and PSPNet, it is evident that Swin-UNet exhibits excellent performance, stability and robustness in the classification task of remote sensing images.
(3)
The network’s performance can be improved by adopting a more balanced sample proportion. In the future, the establishment of an extensive sample library and the integration of multiple feature relationships will hold significant research importance in the field of cloud and cloud shadow detection. Furthermore, Swin-UNet retains untapped potential for model improvement and migration applications, offering enhanced capabilities for the processing of high-resolution satellite data.
In optical satellite images, it is difficult for people to utilize a small number of bands. There are certain limitations in the theory of this study. It makes the effective extraction and filtering of complex features a valuable challenge, especially in cloud-shaded areas. In addition, the manual annotation accuracy of samples also brings certain limitations to the model. These factors all pose obstacles to the detection of clouds and cloud shadows. Therefore, modifying the model structure, attempting to combine meta-heuristic methods and improving sample accuracy are all key research topics in the next stage. It is worth noting that due to the relatively simple frequency bands involved in the model proposed in this study, this method still has reference value in other optical satellite images.

Author Contributions

Conceptualization, Y.T. and W.Z.; methodology, Y.T. and W.Z.; validation, Y.T., X.Y. and W.Z.; formal analysis, Y.T. and Q.L.; investigation, Y.T., W.Z. and Q.L.; resources, X.Y., W.Z. and X.M.; data curation, Y.T. and J.Y.; writing—original draft preparation, Y.T.; writing—review and editing, Y.T. and W.Z.; supervision, J.L. and X.M.; project administration, X.Y. and J.L.; funding acquisition, X.Y. and X.G. All authors have read and agreed to the published version of the manuscript.

Funding

This research was funded by the National Key R&D Program of China, grant number 2019YFE0127300, Science and Technology Research Project of Universities in Hebei, grant number ZD2021303, North China Institute of Aerospace Engineering Foundation of Doctoral Research, grant number BKY-2021-31, Major Special Project of the China High-Resolution Earth Observation System, grant number (30-Y30F06-9003-20/22, 30-Y60B01-9003-22/23, 67-Y50G04-9001-22/23), Youth Fund project of the Department of Education of Hebei province, grant number QN2022076, Department of Science and Technology of Hebei Province Central guidance of local science and technology development funds project, grant number 236Z0106G, Full-time introduced top talent scientific research projects in Hebei Province, grant number 2020HBQZYC002, and North China Institute of Aerospace Engineering Foundation of Graduate Innovation Funding Project, grant number YKY-2022-55.

Institutional Review Board Statement

Not applicable.

Informed Consent Statement

Not applicable.

Data Availability Statement

Data available in a publicly accessible repository that does not issue DOIs. Publicly available datasets were analyzed in this study. This data can be found here: [https://github.com/Ta111N/GF1-dataset] (accessed on 25 September 2023).

Acknowledgments

The authors thank SENDIMAGE from Wuhan University for providing high-quality datasets (GF1_WHU) and the reviewers for this study for providing valuable suggestions.

Conflicts of Interest

The authors declare no conflict of interest.

References

  1. Hansen, M.C.; Loveland, T.R. A review of large area monitoring of land cover change using Landsat data. Remote Sens. Environ. 2012, 122, 66–74. [Google Scholar] [CrossRef]
  2. Foley, J.A.; Defries, R.; Asner, G.P.; Barford, C.; Bonan, G.; Carpenter, S.R.; Stuart, C.F.; Coe, M.T.; Daily, G.C.; Gibbs, H.K.; et al. Global consequences of land use. Science 2005, 309, 570–574. [Google Scholar] [CrossRef] [PubMed]
  3. Vörösmarty, C.J.; McIntyre, P.B.; Gessner, M.O.; Dudgeon, D.; Prusevich, A.; Green, P.; Glidden, S.; Bunn, S.E.; Sullivan, C.A.; Liermann, C.R.; et al. Global threats to human water security and river biodiversity. Nature 2010, 467, 555–561. [Google Scholar] [CrossRef] [PubMed]
  4. Findell, K.L.; Berg, A.; Gentine, P.; Krasting, J.P.; Lintner, B.R.; Malyshev, S.; Santanello, J.A., Jr.; Shevliakova, E. The impact of anthropogenic land use and land cover change on regional climate extremes. Nat. Commun. 2017, 8, 989. [Google Scholar] [CrossRef] [PubMed]
  5. Haddeland, I.; Heinke, J.; Biemans, H.; Eisner, S.; Flörke, M.; Hanasaki, N.; Konzmann, M.; Ludwig, F.; Masaki, Y.; Schewe, J.; et al. Global water resources affected by human interventions and climate change. Proc. Natl. Acad. Sci. USA 2014, 111, 3251–3256. [Google Scholar] [CrossRef]
  6. Drusch, M.; Del Bello, U.; Carlier, S.; Colin, O.; Fernandez, V.; Gascon, F.; Hoersch, B.; Isola, C.; Laberinti, P.; Martimort, P.; et al. Sentinel-2: ESA’s Optical High-Resolution Mission for GMES Operational Services. Remote Sens. Environ. 2012, 120, 25–36. [Google Scholar] [CrossRef]
  7. Roy, D.P.; Wulder, M.A.; Loveland, T.R.; Woodcock, C.E.; Allen, R.G.; Anderson, M.C.; Helder, D.; Irons, J.R.; Johnson, D.M.; Kennedy, R.; et al. Landsat-8: Science and product vision for terrestrial global change research. Remote Sens. Environ. 2014, 145, 154–172. [Google Scholar] [CrossRef]
  8. Wulder, M.A.; Hilker, T.; White, J.C.; Coops, N.C.; Masek, J.G.; Pflugmacher, D.; Crevier, Y. Virtual constellations for global terrestrial monitoring. Remote Sens. Environ. 2015, 170, 62–76. [Google Scholar] [CrossRef]
  9. Storey, J.; Roy, D.P.; Masek, J.; Gascon, F.; Dwyer, J.; Choate, M. A note on the temporary misregistration of Landsat-8 Operational Land Imager (OLI) and Sentinel-2 Multi Spectral Instrument (MSI) imagery. Remote Sens. Environ. 2016, 186, 121–122. [Google Scholar] [CrossRef]
  10. Zhang, Y.C. Calculation of radiative fluxes from the surface to top of atmosphere based on ISCCP and other global data sets: Refinements of the radiative transfer model and the input data. J. Geophys. Res. Atmos. 2004, 109, D19. [Google Scholar] [CrossRef]
  11. Meng, Q.Y.; Wang, C.M.; Gu, X.F.; Sun, Y.X.; Zhang, Y.; Vatseva, R.; Jancso, T. Hot dark spot index method based on multi-angular remote sensing for leaf area index retrieval. Environ. Earth Sci. 2016, 75, 732–733. [Google Scholar] [CrossRef]
  12. Meng, Q.Y.; Liu, W.X.; Zhang, L.L.; Allam, M.; Bi, Y.X.; Hu, X.L.; Gao, J.F.; Hu, D.; Jancsó, T. Relationships between Land Surface Temperatures and Neighboring Environment in Highly Urbanized Areas: Seasonal and Scale Effects Analyses of Beijing, China. Remote Sens. 2022, 14, 4340. [Google Scholar] [CrossRef]
  13. Gong, J.Y.; Ji, S.P. Photogrammetry and Deep Learning. Acta Geod. Cartogr. Sin. 2018, 47, 693–704. [Google Scholar]
  14. An, Z.Y.; Shi, Z.W. Scene learning for cloud detection on remote-sensing images. IEEE J. Sel. Topics Appl. Earth Observ. Remote Sens. 2015, 8, 4206–4222. [Google Scholar] [CrossRef]
  15. Zhu, Z.; Wang, S.; Woodcock, C.E. Improvement and expansion of the fmask algorithm: Cloud, cloud shadow, and snow detection specifically for monitoring land cover change. Remote Sens. Environ. 2015, 159, 269–277. [Google Scholar] [CrossRef]
  16. Kegelmeyer, W.P. Extraction of Cloud Statistics from Whole Sky Imaging Cameras; Sandia National Lab. (SNL-CA): Livermore, CA, USA, 1994. [Google Scholar]
  17. Zhu, Z.; Woodcock, C.E. Object-based cloud and cloud shadow detection in Landsat imagery. Remote Sens. Environ. 2012, 118, 83–94. [Google Scholar] [CrossRef]
  18. Li, Z.; Shen, H.; Li, H.; Xia, G.; Gamba, P.; Zhang, L. Multi-feature combined cloud and cloud shadow detection in GaoFen-1 wide field of view imagery. Remote Sens. Environ. 2016, 191, 342–358. [Google Scholar] [CrossRef]
  19. Fisher, A. Cloud and Cloud-Shadow Detection in SPOT5 HRG Imagery with Automated Morphological Feature Extraction. Remote Sens. 2014, 6, 776–800. [Google Scholar] [CrossRef]
  20. Kang, X.; Gao, G.; Hao, Q.; Li, S. A Coarse-to-Fine Method for Cloud Detection in Remote Sensing Images. IEEE Geosci. Remote Sens. Lett. 2019, 16, 110–114. [Google Scholar] [CrossRef]
  21. Fu, H.; Shen, Y.; Liu, J.; He, G.; Chen, J.; Liu, P.; Qian, J. Cloud Detection for FY Meteorology Satellite Based on Ensemble Thresholds and Random Forests Approach. Remote Sens. 2018, 11, 95–99. [Google Scholar] [CrossRef]
  22. Hughes, M.; Hayes, D. Automated Detection of Cloud and Cloud Shadow in Single-Date Landsat Imagery Using Neural Networks and Spatial Post-Processing. Remote Sens. 2014, 6, 4907–4926. [Google Scholar] [CrossRef]
  23. Simonyan, K.; Zisserman, A. Very Deep Convolutional Networks for Large-Scale Image Recognition. Comput. Sci. 2014, 30, 330–335. [Google Scholar]
  24. Krizhevsky, A.; Sutskever, I.; Hinton, G.E. Imagenet classification with deep convolutional neural networks. Adv. Neural Inf. Process. Syst. 2012, 25, 84–90. [Google Scholar] [CrossRef]
  25. He, K.; Zhang, X.; Ren, S.; Sun, J. Deep Residual Learning for Image Recognition. In Proceedings of the IEEE Conference on Computer Vision and Pattern Recognition, Las Vegas, NV, USA, 26 June–1 July 2016; pp. 770–778. [Google Scholar]
  26. Zhu, X.X.; Tuia, D.; Mou, L.; Xia, G.S.; Zhang, L.; Xu, F.; Fraundorfer, F. Deep Learning in Remote Sensing: A Comprehensive Review and List of Resources. IEEE Geosci. Remote Sens. Mag. 2018, 5, 8–36. [Google Scholar] [CrossRef]
  27. Wu, X.; Shi, Z.W. Utilizing Multilevel Features for Cloud Detection on Satellite Imagery. Remote Sens. 2018, 10, 1853. [Google Scholar] [CrossRef]
  28. Yan, Z.; Yan, M.; Sun, H.; Fu, K.; Hong, J.; Sun, J.; Zhang, Y.; Sun, X. Cloud and cloud shadow detection using multilevel feature fused segmentation network. IEEE Geosci. Remote Sens. Lett. 2018, 15, 1600–1604. [Google Scholar] [CrossRef]
  29. Vaswani, A.; Shazeer, N.; Parmar, N.; Uszkoreit, J.; Jones, L.; Gomez, A.N.; Kaiser, Ł.; Polosukhin, I. Attention is all you need. Adv. Neural Inf. Process. Syst. 2017, 30, 1–11. [Google Scholar]
  30. Dosovitskiy, A.; Beyer, L.; Kolesnikov, A.; Weissenborn, D.; Zhai, X.; Unterthiner, T.; Dehghani, M.; Minderer, M.; Heigold, G.; Gelly, S. An image is worth 16x16 words: Transformers for image recognition at scale. arXiv 2020, arXiv:2010.11929. [Google Scholar]
  31. Zheng, S.; Lu, J.; Zhao, H.; Zhu, X.; Zhang, L. Rethinking Semantic Segmentation from a Sequence-to-Sequence Perspective with Transformers. In Proceedings of the IEEE Conference on Computer Vision and Pattern Recognition, Virtual, 20–25 June 2021; Volume 19, pp. 6881–6890. [Google Scholar]
  32. Liu, Z.; Lin, Y.; Cao, Y.; Hu, H.; Wei, Y.; Zhang, Z.; Lin, S.; Guo, B. Swin Transformer: Hierarchical Vision Transformer Using Shifted Windows. In Proceedings of the IEEE/CVF International Conference on Computer Vision, Montreal, QC, Canada, 11–17 October 2021; pp. 10012–10022. [Google Scholar]
  33. Cao, H.; Wang, Y.; Chen, J.; Jiang, D.; Zhang, X.; Tian, Q.; Wang, M. Swin-unet: Unet-like pure transformer for medical image segmentation. arXiv 2020, arXiv:2105.05537. [Google Scholar]
  34. He, X.; Zhou, Y.; Zhao, J.; Zhang, D.; Yao, R.; Xue, Y. Swin Transformer Embedding UNet for Remote Sensing Image Semantic Segmentation. IEEE Trans. Geosci. Remote Sens. 2022, 60, 1–15. [Google Scholar] [CrossRef]
  35. Malakar, S.; Ghosh, M.; Bhowmik, S.; Sarkar, R.; Nasipuri, M. A GA based hierarchical feature selection approach for handwritten word recognition. Neural Comput. Applic. 2020, 32, 2533–2552. [Google Scholar] [CrossRef]
  36. Bacanin, N.; Stoean, R.; Zivkovic, M.; Petrovic, A.; Rashid, T.A.; Bezdan, T. Performance of a Novel Chaotic Firefly Algorithm with Enhanced Exploration for Tackling Global Optimization Problems: Application for Dropout Regularization. Mathematics 2021, 9, 2705. [Google Scholar] [CrossRef]
  37. Lu, C.L.; Bai, Z.G. Characteristics and Typical Applications of GF-1 Satellite. In Proceedings of the 2015 IEEE International Geoscience & Remote Sensing Symposium: 2015 IEEE International Geoscience and Remote Sensing Symposium (IGARSS 2015), Milan, Italy, 26–31 July 2015; Institute of Electrical and Electronics Engineers: Piscataway, NJ, USA, 2015; Volume 15, pp. 1246–1249. [Google Scholar]
  38. Chen, L.C.; Zhu, Y.; Papandreou, G.; Schroff, F.; Adam, H. Encoder-Decoder with Atrous Separable Convolution for Semantic Image Segmentation. In Proceedings of the Computer Vision—ECCV 2018: 15th European Conference, Munich, Germany, 8–14 September 2018; Proceedings, p. VII. Springer: Berlin/Heidelberg, Germany; pp. 833–851. [Google Scholar]
  39. Chen, L.C.; Papandreou, G.; Schroff, F.; Adam, H. Rethinking atrous convolution for semantic image segmentation. arXiv 2017, arXiv:1706.05587. [Google Scholar]
  40. Zhao, H.; Shi, J.; Qi, X.; Wang, X.; Jia, J. Pyramid Scene Parsing Network. In Proceedings of the 2017 IEEE Conference on Computer Vision and Pattern Recognition: CVPR 2017, Honolulu, HI, USA, 21–26 July 2017; pp. 5987–6737. [Google Scholar]
Figure 1. Global distribution of the dataset (green area for the training set; red area for the testing set).
Atmosphere 14 01669 g001
Figure 2. Partial error labels in the original GF1_WHU dataset under different surface types. (The black, white and gray areas represent the underlying surface, clouds and cloud shadows.) At the top of each scene, the type of misjudgment area is given. The bottom presents the main misjudgment targets in the area.
Atmosphere 14 01669 g002
Figure 3. The flow chart of the Swin-UNet-based cloud and cloud shadow detection method.
Atmosphere 14 01669 g003
Figure 4. The architecture of Swin-UNet.
Atmosphere 14 01669 g004
Figure 5. Swin Transformer block.
Atmosphere 14 01669 g005
Figure 6. Distribution of Swin-UNet cloud and cloud shadow overall accuracy.
Atmosphere 14 01669 g006
Figure 7. GF-1 WFV scenes and masks produced by Swin-UNet.
Atmosphere 14 01669 g007
Figure 8. Comparison of the scene results of various models.
Atmosphere 14 01669 g008
Figure 9. Distributions of the cloud proportion in the dataset.
Atmosphere 14 01669 g009
Figure 10. Distributions of the cloud shadow proportion in the dataset.
Atmosphere 14 01669 g010
Figure 11. Cloud shadow detection weight map under different sample scale model training. (a) Test image; (b) cloud shadow mask; (c) complete sample; (d) samples with a cloud shadow content of more than 10%. The red circle is the key reference area affected by sample differences.
Atmosphere 14 01669 g011
Table 1. Confusion matrix.
PredictionReferenceResult
PositivePositiveTrue Positive
NegativeFalse Positive
NegativePositiveFalse Negative
NegativeTrue Negative
Table 2. Partial parameter description in model training.
ParameterValue
β 1 0.9
β 2 0.999
Base learning rate0.001
Decay rate0.1
Window size16
Table 3. Statistics of cloud detection results for different models.
MethodOA(%)P(%)F1-Score(%)R(%)IoU(%)
U-Net93.5781.2393.7594.5478.38
DeepLabV3+95.593.2195.4795.8683.82
PSPNet95.3689.4495.4196.4586.54
Swin-UNet95.6198.0195.4896.8482.24
Table 4. Statistics of cloud shadow detection results for different models.
MethodOA(%)P(%)F1-Score(%)R(%)IoU(%)
U-Net97.8674.5696.8785.3460.04
DeepLabV3+97.9284.0397.1783.0956.1
PSPNet97.782.297.5178.9251.85
Swin-UNet97.4684.6497.5584.1256.56
Disclaimer/Publisher’s Note: The statements, opinions and data contained in all publications are solely those of the individual author(s) and contributor(s) and not of MDPI and/or the editor(s). MDPI and/or the editor(s) disclaim responsibility for any injury to people or property resulting from any ideas, methods, instructions or products referred to in the content.

