Article

Analysis of Air Pollutants and Their Potential Sources in Eastern Xinjiang, Northwestern Inland China, from 2018 to 2022

1
Jiangsu Mineral Resources and Geological Designand Research Institute, China National Administration of Coal Geology, Xuzhou 221006, China
2
Xinjiang Meteorological Observatory, Urumqi 830000, China
3
Coal & CBM Test Institute of Xinjiang Uygur Autonomous Region, Urumqi 830000, China
4
Collaborative Innovation Center of Atmospheric Environment and Equipment Technology, Jiangsu Key Laboratory of Atmospheric Environment Monitoring and Pollution Control, School of Environmental Science and Engineering, Nanjing University of Information Science & Technology, 219 Ningliu Road, Nanjing 210044, China
*
Authors to whom correspondence should be addressed.
Atmosphere 2023, 14(11), 1670; https://doi.org/10.3390/atmos14111670
Submission received: 23 October 2023 / Revised: 6 November 2023 / Accepted: 8 November 2023 / Published: 10 November 2023
(This article belongs to the Section Air Quality)

Abstract

:
Air pollution in the developed regions of eastern China has been intensively investigated in the past decade. However, there is a relative dearth of air pollution studies on the northwest of inland China (e.g., Xinjiang). In this work, hourly measurement data of six criteria air pollutants (PM2.5, PM10, CO, NO2, O3, and SO2) for the past five years (2018–2022) from Hami and Turpan cities of eastern Xinjiang were analyzed to reveal air pollution characteristics and the distribution of potential sources. Hami and Turpan had the highest AQI values in winter due to increased coal combustion for domestic heating and unfavorable meteorological conditions. The slight elevations of AQI values in spring were caused by frequent dust storms. PM10 was the most frequent main pollutant in both Hami (63.1%) and Turpan (74.1%), followed by PM2.5 and O3. Except for O3, PM2.5, PM10, SO2, NO2, and CO exhibited a generally decreasing pattern in annual average values. But the annual average concentrations of PM10 in Hami (83.5 μg·m−3) and Turpan (139 μg·m−3) in 2022 were still higher than those in eastern China. Diurnal and monthly variations of the six criteria pollutants were influenced by a combination of emission sources and meteorological conditions. The air masses in eastern Xinjiang mainly originated from the west and north and were affected by both inter-regional and intra-regional transport. Analysis of the distribution of potential sources showed that local emissions strongly impacted particulate matter pollution in winter, while regional transport played a dominant role in other seasons. O3 showed a broad distribution of potential sources across all four seasons. Considering that the trend that O3 pollution increased year by year, eastern Xinjiang might face a similar pollution situation as eastern China, i.e., the combined pollution of particulate matter and O3.

1. Introduction

Due to rapid urbanization and industrialization in China, air pollution has become an urgent problem affecting public health and climate [1,2,3]. It ranks fourth among widespread health risks in China, following nutritional risks, hypertension, and smoking [4]. Based on the criteria set forth by the World Health Organization (WHO), safe air quality standards are met in only 1.00% of China’s major cities [5]. After the implementation of the Air Pollution Prevention and Control Action Plan (APPCAP) [6,7,8], the average concentrations of PM10 and SO2 in 338 Chinese cities decreased by 17.6% and 47.7% from 2013 to 2017 [9]. Owing to industrial transformation and upgrading, energy structure reform, and major emission reduction projects, the annual average PM2.5 concentrations in well-developed regions of China such as Beijing–Tianjin–Hebei (BTH, 39.6%), the Yangtze River Delta (YRD, 34.3%), and the Pearl River Delta (PRD, 27.7%) decreased substantially during 2013–2017 (https://www.cma.gov.cn, accessed on 11 October 2023.) [9,10]. After that, the execution of a follow-up plan, the “Three-year Action Plan to Win the Blue Sky Defense War” (2018–2020), has led to a decrease in monthly average concentrations of PM2.5 and PM10 in 354 cities across China by about 14.5 μg·m−3 and 23.4 μg·m−3, respectively [11].
Air pollution in the northwest, especially in the Xinjiang Uyghur Autonomous Region (hereafter referred to as Xinjiang), has not yet been effectively alleviated, possibly due to the increase in coal consumption, unique terrain, unfavorable meteorological conditions, and regional transport. In 2016–2017, the annual average concentrations of PM2.5, PM10, and NO2 in provincial capitals in northwest China (e.g., Lanzhou, 61.2 μg·m−3, 147 μg·m−3, and 58.7 μg·m−3; Urumqi, 76.4 μg·m−3, 105 μg·m−3, and 62.8 μg·m−3; Xining, 46.7 μg·m−3, 99.7 μg·m−3, and 46.6 μg·m−3) were much higher than those of southeastern China (e.g., YRD, 40.4 μg·m−3, 68.6 μg·m−3, and 34.4 μg·m−3; PRD, 39.4 μg·m−3, 53.2 μg·m−3, and 24.8 μg·m−3) [12,13]. Meanwhile, PM2.5 pollution in the Urumqi–Changji–Shihezi region of Xinjiang is more frequent (18.0%) than the highly polluted regions (16.0%) in central and eastern China [14]. In the last decade, air pollution in the most developed regions of China, such as the BTH, YRD, PRD, and Sichuan Basin, has been intensively investigated [15,16,17]. However, there is a relative dearth of studies on air pollution in northwestern inland China, and it is of great significance to investigate the status and potential source of air pollutants in Xinjiang.
Xinjiang has established a province-wide air-quality monitoring network since 2013 to assess regional air pollution [18]. In this work, hourly measurement data of the six criteria air pollutants (PM2.5, PM10, SO2, CO, NO2, and O3) were obtained from the National Environmental Monitoring Station in eastern Xinjiang from 2018 to 2022. MeteoInfo, a backward trajectory model software [19,20], was used to analyze the distribution of atmospheric trajectories in the study area. Finally, the potential source areas of the individual air pollutants were determined by calculating the potential source contribution factor (PSCF) and the concentration weight trajectory (CWT). The results of the study contribute to a better understanding of air pollution in northwestern inland China and the development of strategies to control pollution in the future.

2. Materials and Methods

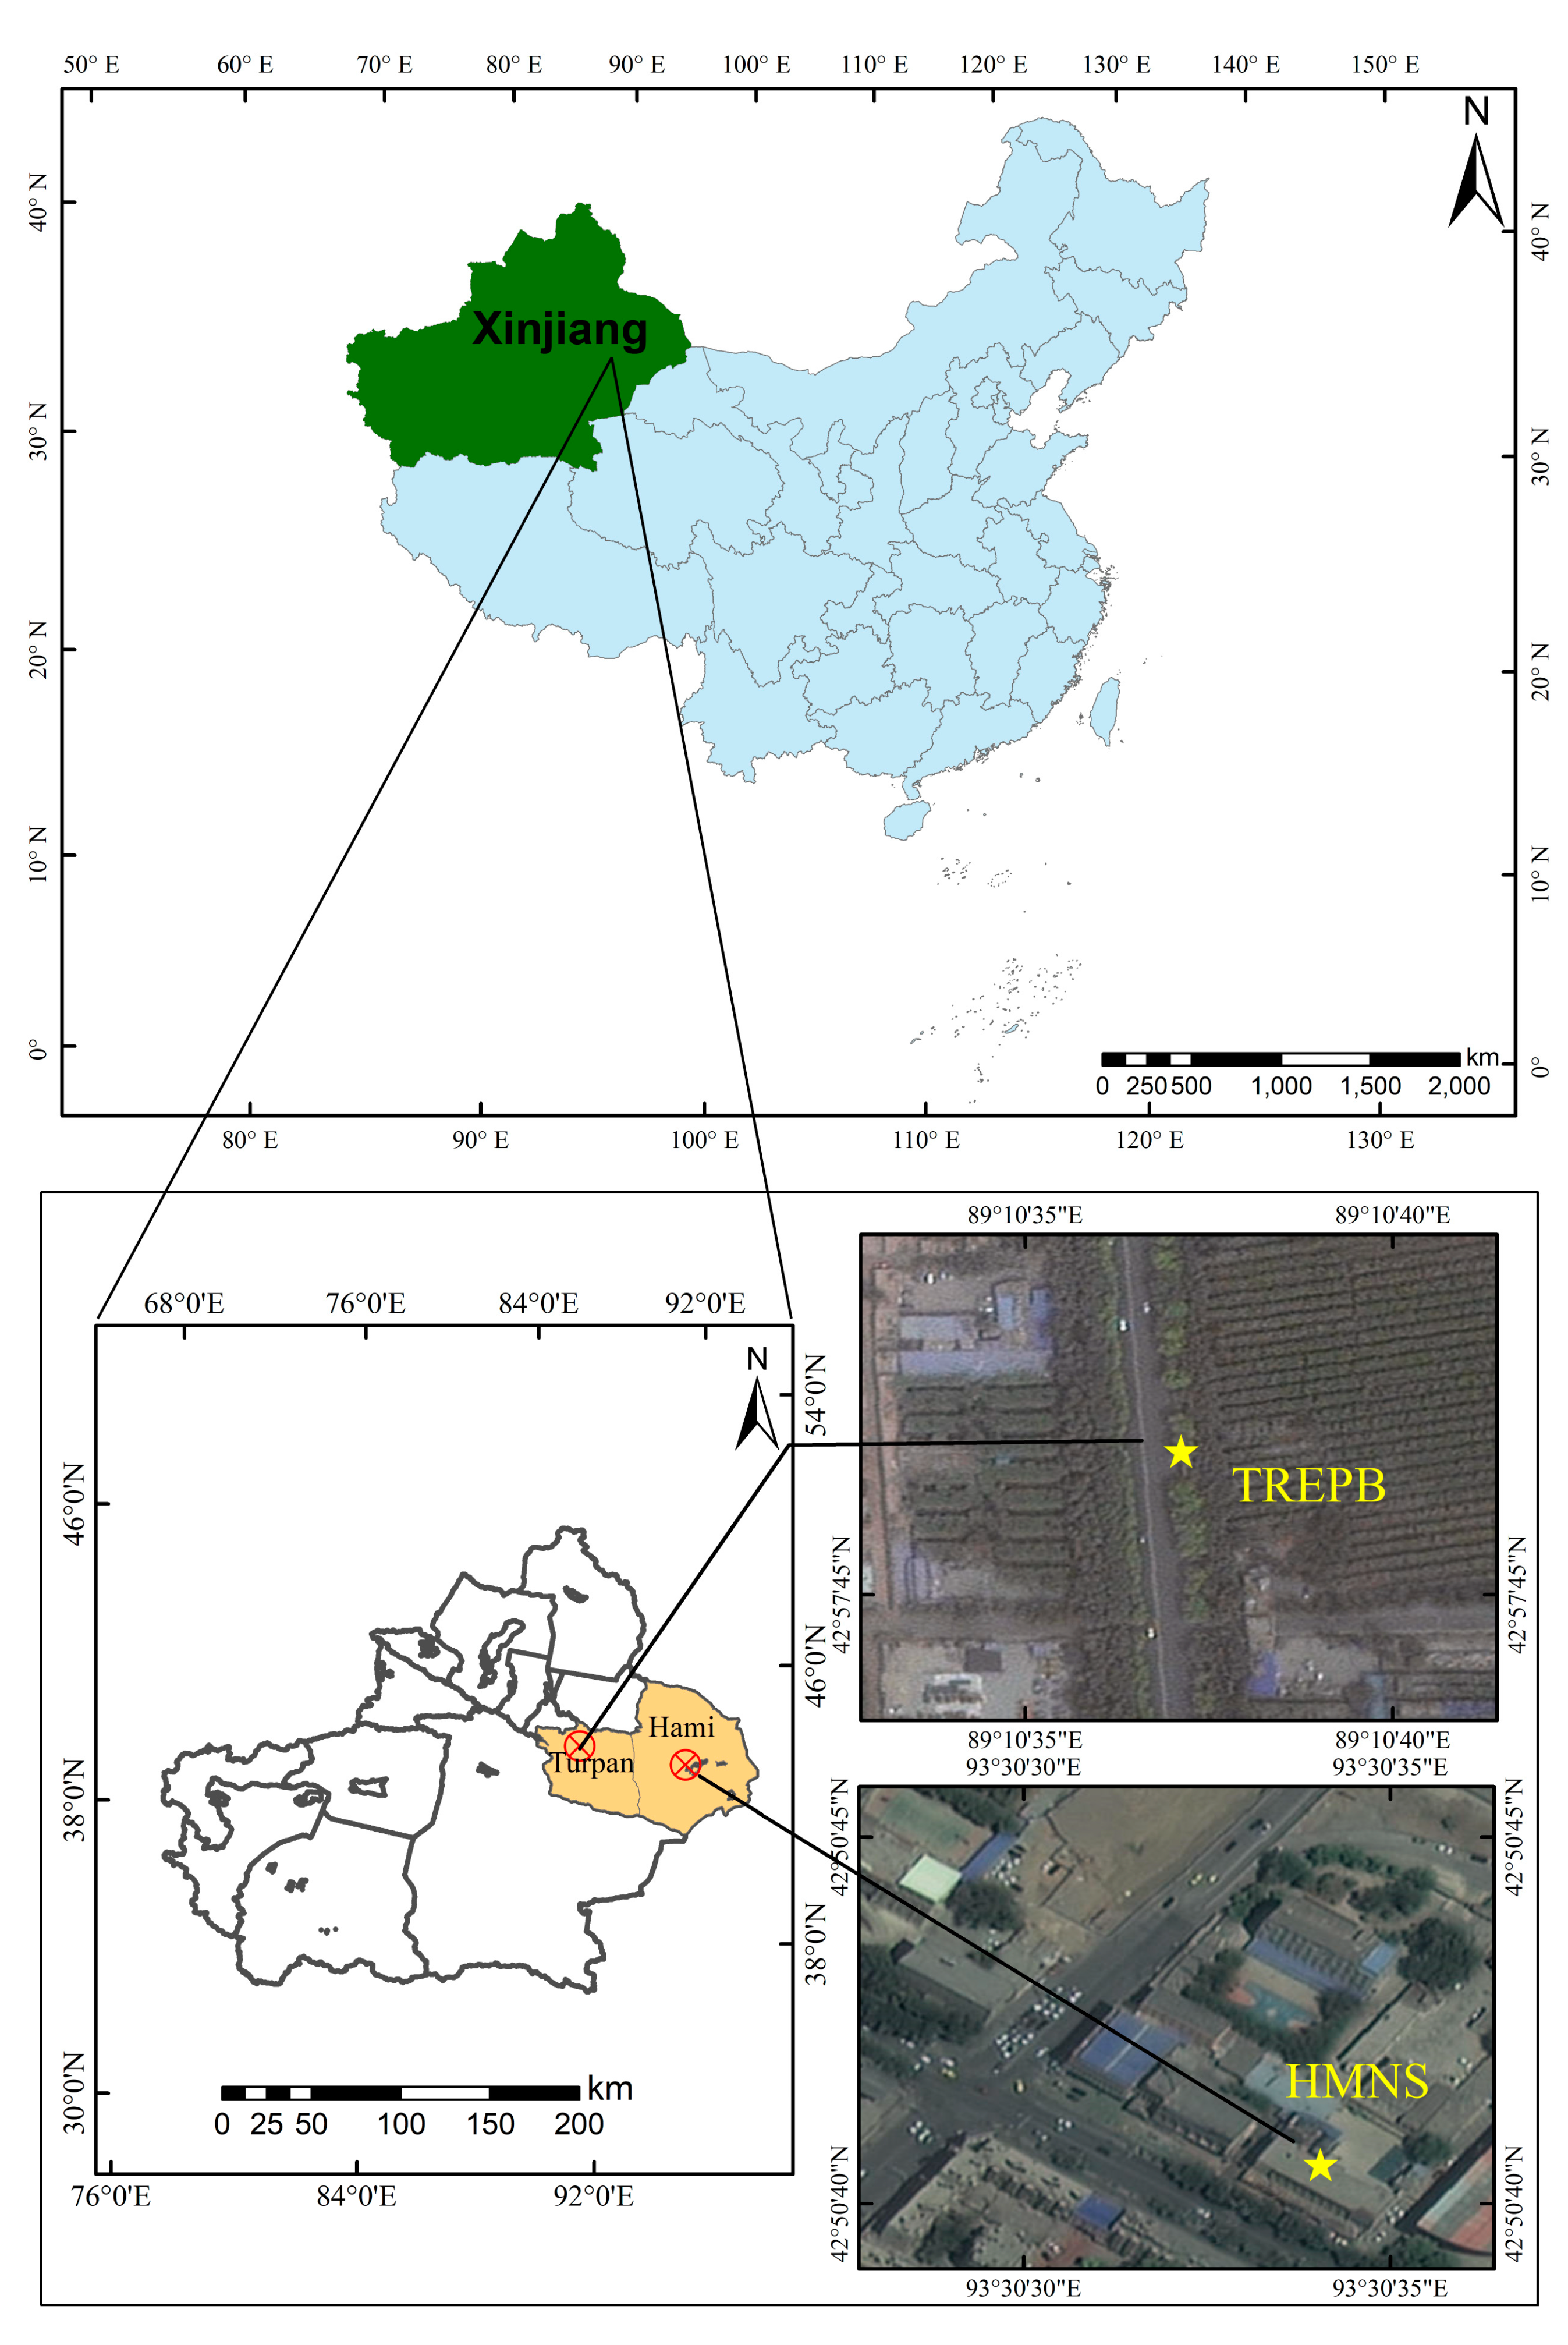
2.1. Study Area and Data Source

Hami and Turpan are located in the eastern region of Xinjiang, nestled between the Tianshan Mountains to the west and the Gobi Desert to the east. This region has a typical continental climate characterized by sultry summers and freezing winters with average temperatures of 29.6 °C and −5.86 °C, respectively. This area is mostly flat and has no significant topographic relief, which is favorable for wind power generation and transmission. Eastern Xinjiang is rich in mineral and agricultural resources, including coal, natural gas, and cotton, which are the backbone of economic development. Moreover, this region also serves as an important hub connecting Central Asia and other regions of China.
Hourly measurement data of the six criteria air pollutants, including PM2.5, PM10 (5014i Beta Continuous Ambient Particulate Monitor, Thermo Fisher Scientific Inc., Waltham, MA, USA), CO (Model 48i CO Analyzer, Thermo Fisher Scientific Inc., Waltham, MA, USA), NO2 (Model 42i Analyzer, Thermo Fisher Scientific Inc., Waltham, MA, USA), maximum daily average 8 h (MDA 8) O3 (Model 49i Ozone Analyzer, Thermo Fisher Scientific Inc., Waltham, MA, USA), and SO2 (Model 43i SO2 Analyzer, Thermo Fisher Scientific Inc., Waltham, MA, USA), were collected from the National Environmental Monitoring Stations in Hami (Hami Normal School: HMNS) and Turpan (Turpan Regional Environmental Protection Bureau: TREPB), China (Figure 1), for the period from 2018 to 2022. Synchronous meteorological data were obtained from the National Meteorological Stations in Hami and Turpan. Monthly variations in ambient temperature, relative humidity, barometric pressure, and wind speed are shown in Figure S1. As part of backward trajectory analysis, meteorological data were automatically retrieved from the National Oceanic and Atmospheric Administration (NOAA) Global Data Assimilation System (GDAS1, ftp://arlftp.arlhq.noaa.gov/pub/archives/gdas1, last accessed on 7 July 2023). The GDAS1 records data every six hours at 00:00, 06:00, 12:00, and 18:00 UTC (coordinated universal time).

2.2. Source Analysis Models

The Hybrid Single Particle Lagrangian Integrated Trajectory (HYSPLIT) model developed by the National Oceanic and Atmospheric Administration (NOAA) of the United States and the Bureau of Meteorology of Australia is widely used to analyze the transport and dispersion pathways of pollutants in the atmosphere [21,22]. The PSCF method, based on the conditional probability function, is used to identify potential pollution sources by analyzing the trajectory of air masses and to determine pollution thresholds [23,24]. Higher PSCF values indicate a higher probability of being potential source regions of air pollution. The calculation of the PSCF value is as follows:
P S C F = m i j n i j
where mij is the number of pollution route endpoints passing through the grid (ij), and nij is the total number of route endpoints within the grid (ij). To mitigate the increased uncertainty associated with small nij values in PSCF, a weighting coefficient Wij is introduced to calculate weighted PSCF (WPSCF) for reduction: [25]
W P S C F i j   = P S C F i j   ×   W i j
W i j   1 . 00 , n i j   >   80 0 . 70 , 80   n i j   > 20   0 . 42 , 20   n i j   > 10   0 . 05 , 10     n i j  
However, the PSCF method is incapable of distinguishing the magnitude of contribution to pollutant concentration at the receptor point among grid cells with the same PSCF value. The CWT method can quantify the average weight concentration for each grid, reflecting the pollution levels associated with different trajectories. The weighting coefficients, Wij, are identical to the weighting factors used in the analysis of potential source contributions. The weighted CWT (WCWT) is calculated as [26]:
  W C W T i   j = l = 1 M C 1 × τ i j l l = 1 M τ i j l   W i j
where l is the trajectory of the air mass, M is the total number of trajectories, Cl is the pollutant concentration as trajectory l passes through the grid (i, j), and τijl is the time of residence of trajectory l in the grid (i, j). The resolution of each grid cell in the PSCF and CWT methods is 0.5° × 0.5°.

3. Results

3.1. Air Quality and Main Pollutants

In this study, the air quality index (AQI) was used to parameterize the air quality in eastern Xinjiang. Details of the calculation method can be found in Text S1 in the supplement. Statistics of the six criteria air pollutants involved for AQI calculation are listed in Table S1 in the supplement, where the percentages of missing data of individual pollutants are all less than 10%.
Daily and annual average AQI values for Hami and Turpan during the whole period are shown in Figure 2 and Figure S2a, respectively. A decreasing trend of AQI was observed for Turpan, but not for Hami, from 2018 to 2022, noting that the annual average values of AQI in Turpan were 1.19- to 1.51-times higher than those in Hami (Figure S2a). This could be partly ascribed to the fact that Turpan is lowest, located in the Turpan basin surrounded by mountains, and is more susceptible to the influences of sandstorms [27,28]. In Hami, 175 days had AQI values larger than 100 (Grade III limit value of technical regulation on ambient AQI (HJ 633-2012)), accounting for 9.62% of the total number of monitoring days, whereas 655 days (35.9% of the total) with AQI values above 100 were found in Turpan (Figure S2a and Figure 2). AQI values in eastern Xinjiang were significantly higher in winter (December–January–February) than in summer (June–July–August) and had slight elevations in spring (March–April–May; Figure S2b). These variations are consistent with previous observations in Xinjiang and can be attributed to intensive coal burning for domestic heating and unfavorable meteorological conditions in winter (Figure S1) and frequent dust storms in spring [29,30,31,32,33].
As described in Text S1 in the supplement, the main pollutant is identified during the calculation of the AQI. Table 1 shows the occurrence frequencies of individual criteria pollutants as the main pollutant in Hami and Turpan from 2018 to 2022. Unlike eastern China, where PM2.5, NO2, and O3 were typical main pollutants [34,35], PM10 was the most frequent main pollutant in eastern Xinjiang, followed by PM2.5 and O3. In Hami and Turpan, the occurrence frequencies of PM10 as the main pollutant were 63.1% and 74.1%, respectively, which is much higher than that in eastern Chinese cities (e.g., Shanghai, 5.00%) [34]. The reason is that eastern Xinjiang is located near sand and dust sources, and the combined effects of dust and anthropogenic emissions significantly affect the particulate matter (PM) pollution in this area [36,37,38].

3.2. Temporal Variations of Air Pollutants

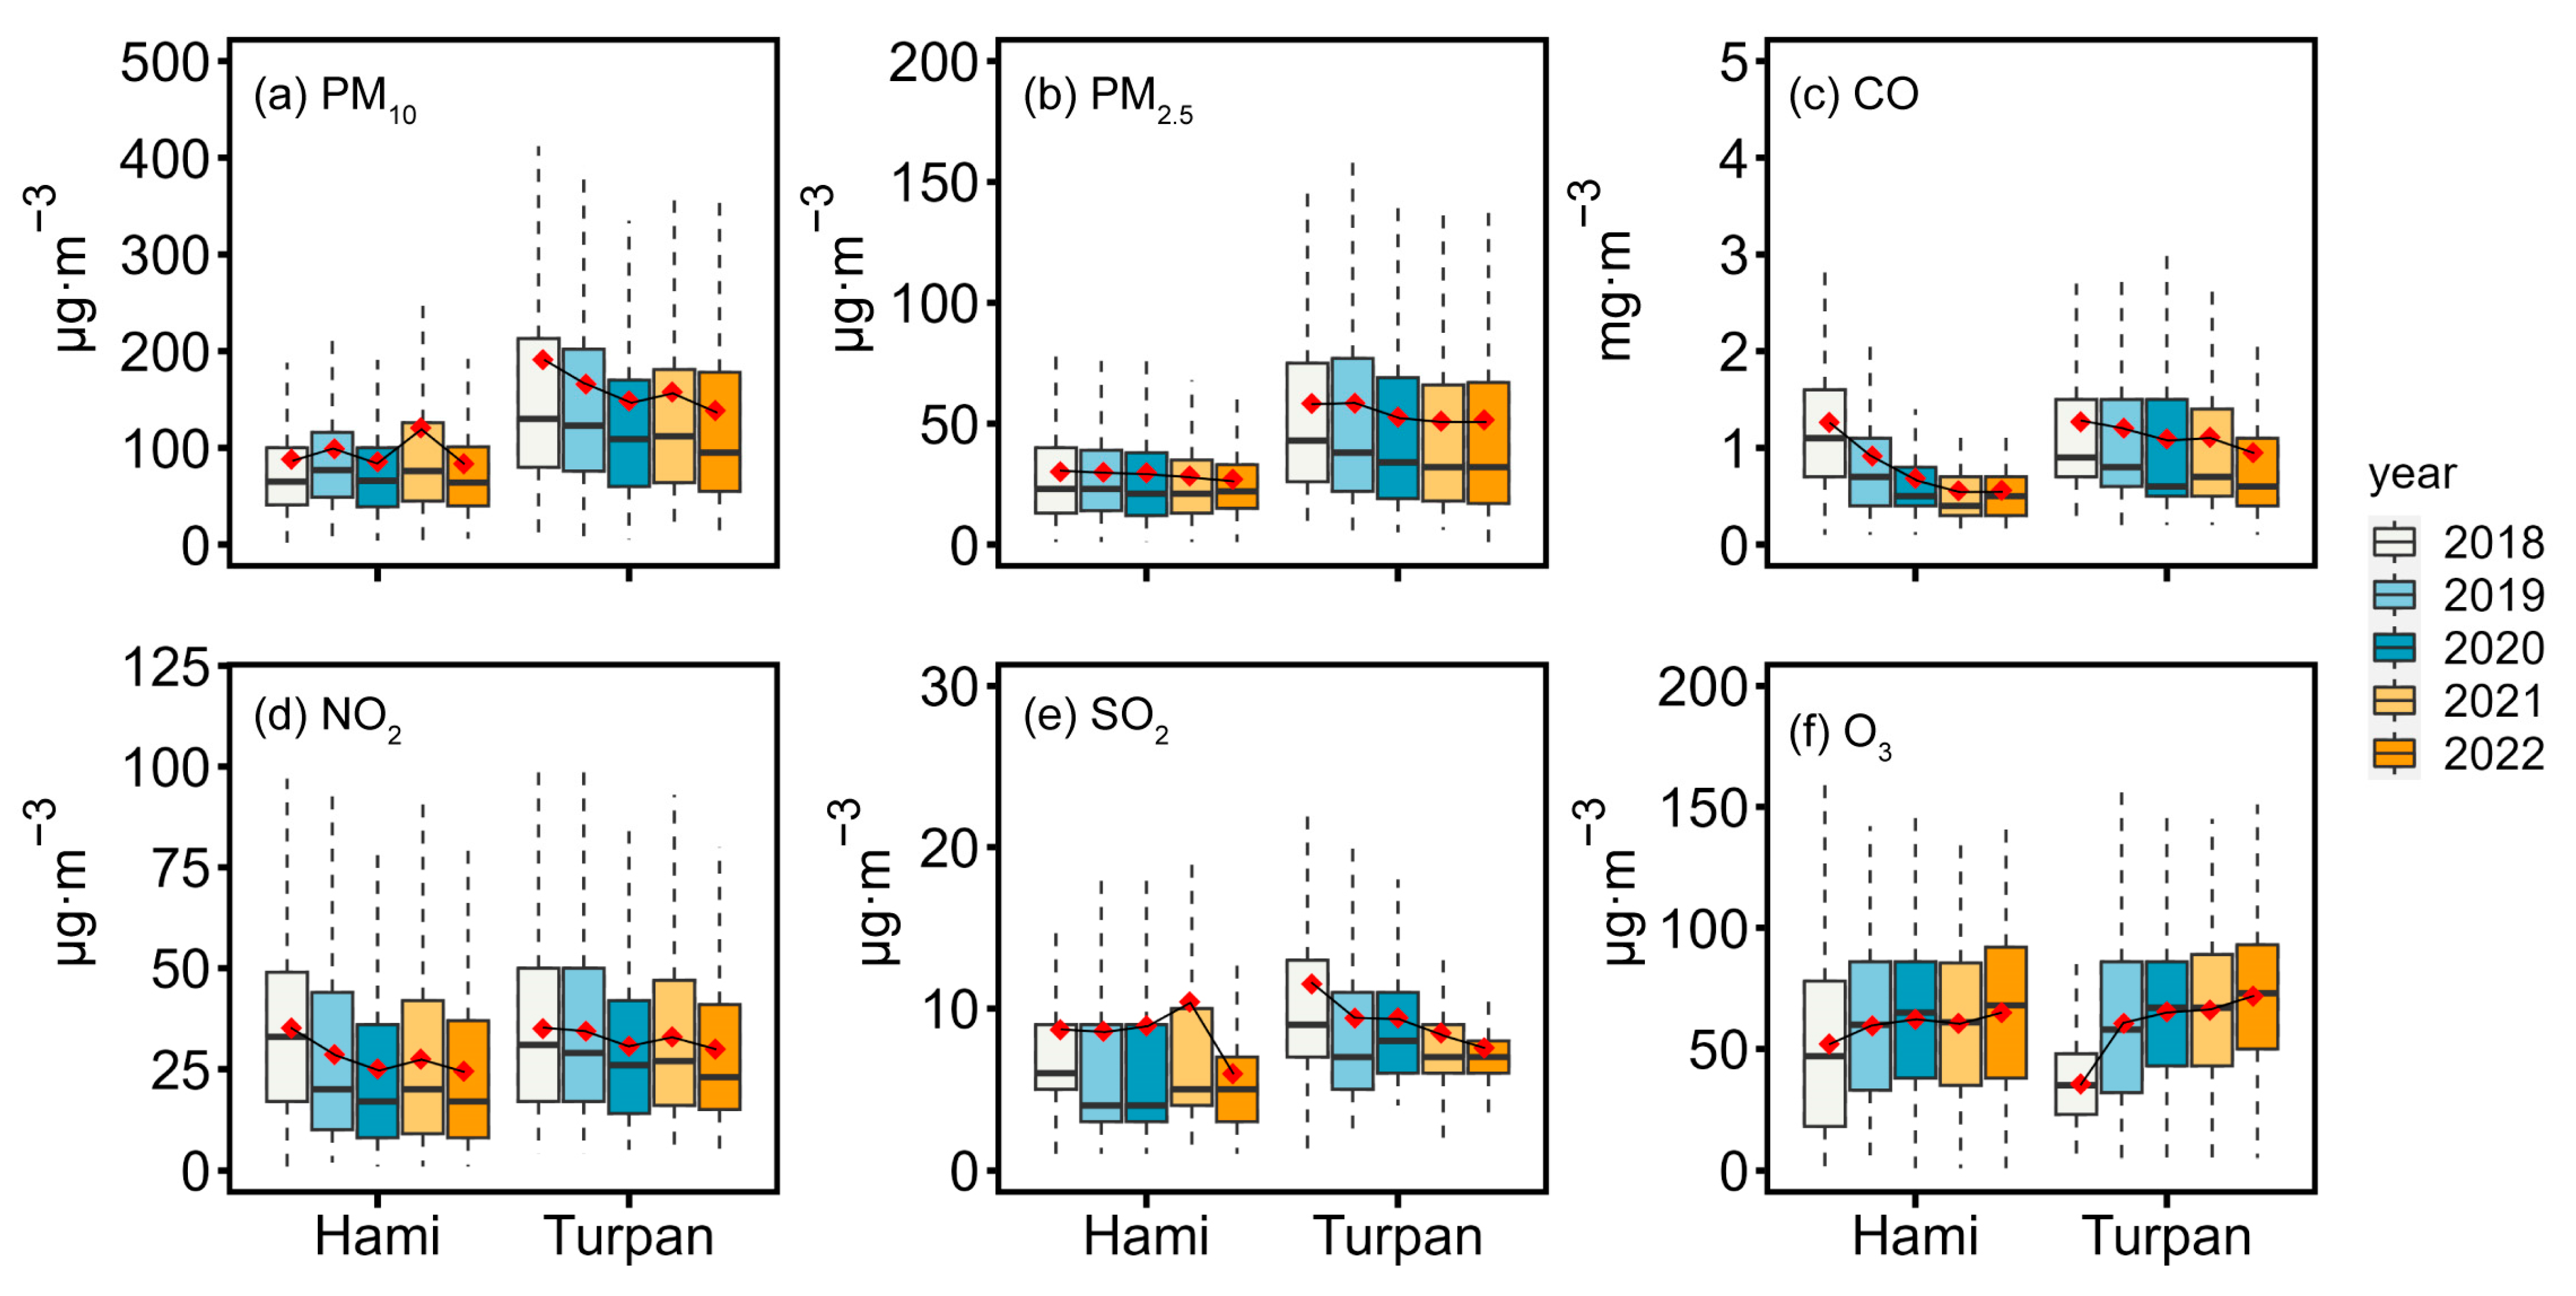
3.2.1. Interannual Changes

The interannual changes in concentrations of individual criteria pollutants in eastern Xinjiang during the study period are shown in Figure 3. The annual average concentrations of CO and NO2 in Hami and Turpan showed a prominent downward trend (Figure 3c,d). The annual averages of PM2.5 showed a continuous decline in Hami, decreasing from 30.1 μg·m3 in 2018 to 27.0 μg·m3 in 2022 (Figure 3b). In Turpan, PM2.5 showed a general downward trend with a slight increase in 2019, but its average in 2022 (51.5 μg·m3) was still higher than the limit II of National Ambient Air Quality Standards (NAAQS, 35.0 μg·m3). Although the annual average concentrations of PM10 in Turpan show an overall decreasing trend with a rate of −7.36% yr1 from 2018 to 2022, the average PM10 concentrations in Hami and Turpan in 2022 (83.5 μg·m3 and 139 μg·m3) were still higher than those in eastern China (e.g., BTH, 66.0 μg·m3; YRD, 52.0 μg·m3; PRD, 35.0 μg·m3; https://www.cma.gov.cn, accessed on 11 October 2023). SO2 concentrations in Turpan showed a continuous downward trend (−8.54% yr1), while in Hami the average SO2 concentrations increased during 2018–2021 and then decreased in 2022. The annual average upward or downward rates of PM10 and SO2 were calculated as the averages of their annual percentage changes during 2018–2022. These results indicate that air pollution control measures in eastern Xinjiang have achieved some effectiveness in recent years, but the PM concentrations in eastern Xinjiang remain at high levels, possibly due to its unique geographic location, frequent dust storms, and the influence of regional transport.
It is worth noting that PM10 concentrations in 2021 were significantly (p < 0.05) higher than those in 2020 and 2022 in both Hami and Turpan, possibly due to the severe dust event in central Xinjiang in Spring 2021 [33,39]. The average concentrations of NO2 in 2020 (Hami, 25.1 μg·m3; Turpan, 30.6 μg·m3) were significantly (p < 0.05) lower than those in 2019 (28.6 μg·m3; 34.4 μg·m3) and 2021 (27.5 μg·m3; 32.9 μg·m3), which was likely ascribed to the sharp decrease in urban traffic as a result of the COVID-19 control [40]. PM2.5/PM10 ratios at Hami and Turpan ranged from 0.23 to 0.38, and were much lower than those at BTH (0.53) and YRD (0.60) [41,42]. Therefore, coarse particles from dust emissions are the main cause of PM pollution in eastern Xinjiang [43]. In Hami and Turpan, the NO2/SO2 ratio ranged from 2.64 to 4.05, much lower than those in YRD (9.07) and PRD (6.69) [44], indicating a stronger relationship between air pollution and stationary sources in eastern Xinjiang [45,46].
Unlike other criteria pollutants, the annual average MDA8 O3 exhibited a significant upward trend in Hami (4.98% yr1) and Turpan (12.6% yr1), reaching 65.0 μg·m3 (Hami) and 71.7 μg·m3 (Turpan) by 2022. A similar increasing trend of O3 has also been observed in eastern China. For example, in Lianyungang, a coastal city, the annual average concentration of O3 increased by 0.92 μg·m3·yr1 from 2015 to 2018; a continuous upward trend with a growth rate of 3.50% yr1 was observed in Shandong from 2014 to 2020 [35,47]. Although the O3 pollution in eastern Xinjiang has not attained the level in eastern China, its rapid growth indicated that a combined pollution of PM and O3 might become the main situation of air pollution in eastern Xinjiang.

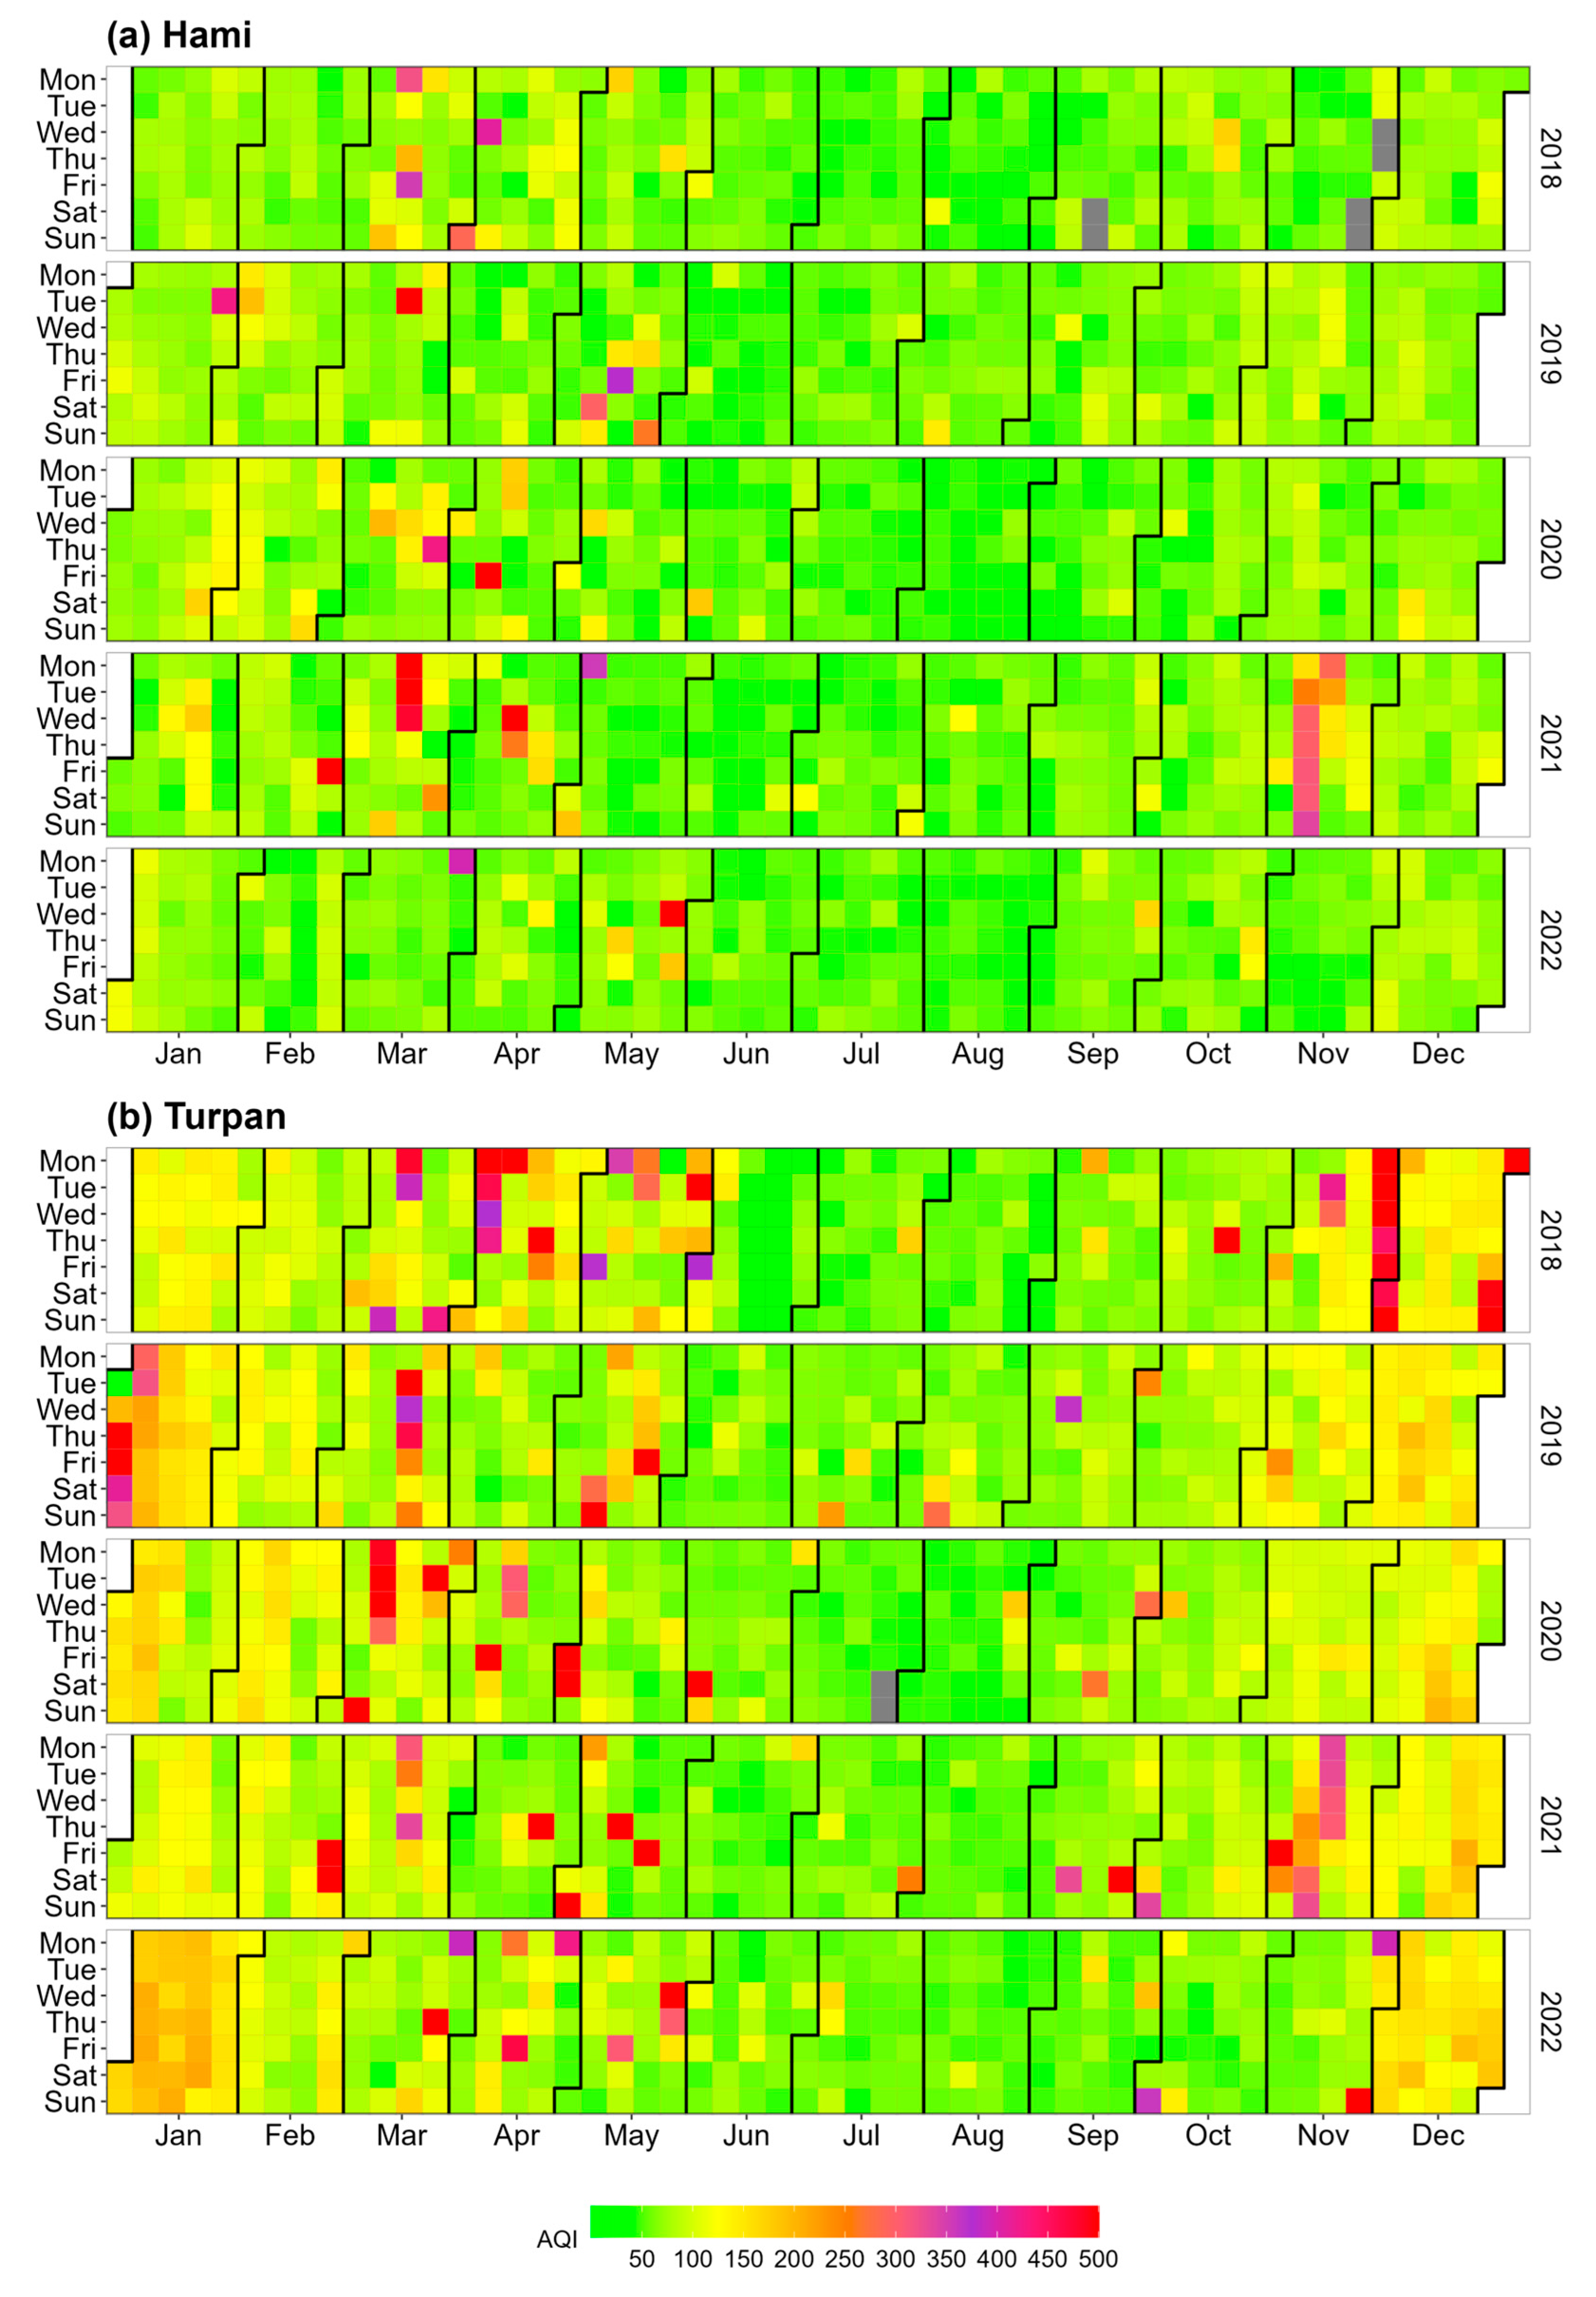
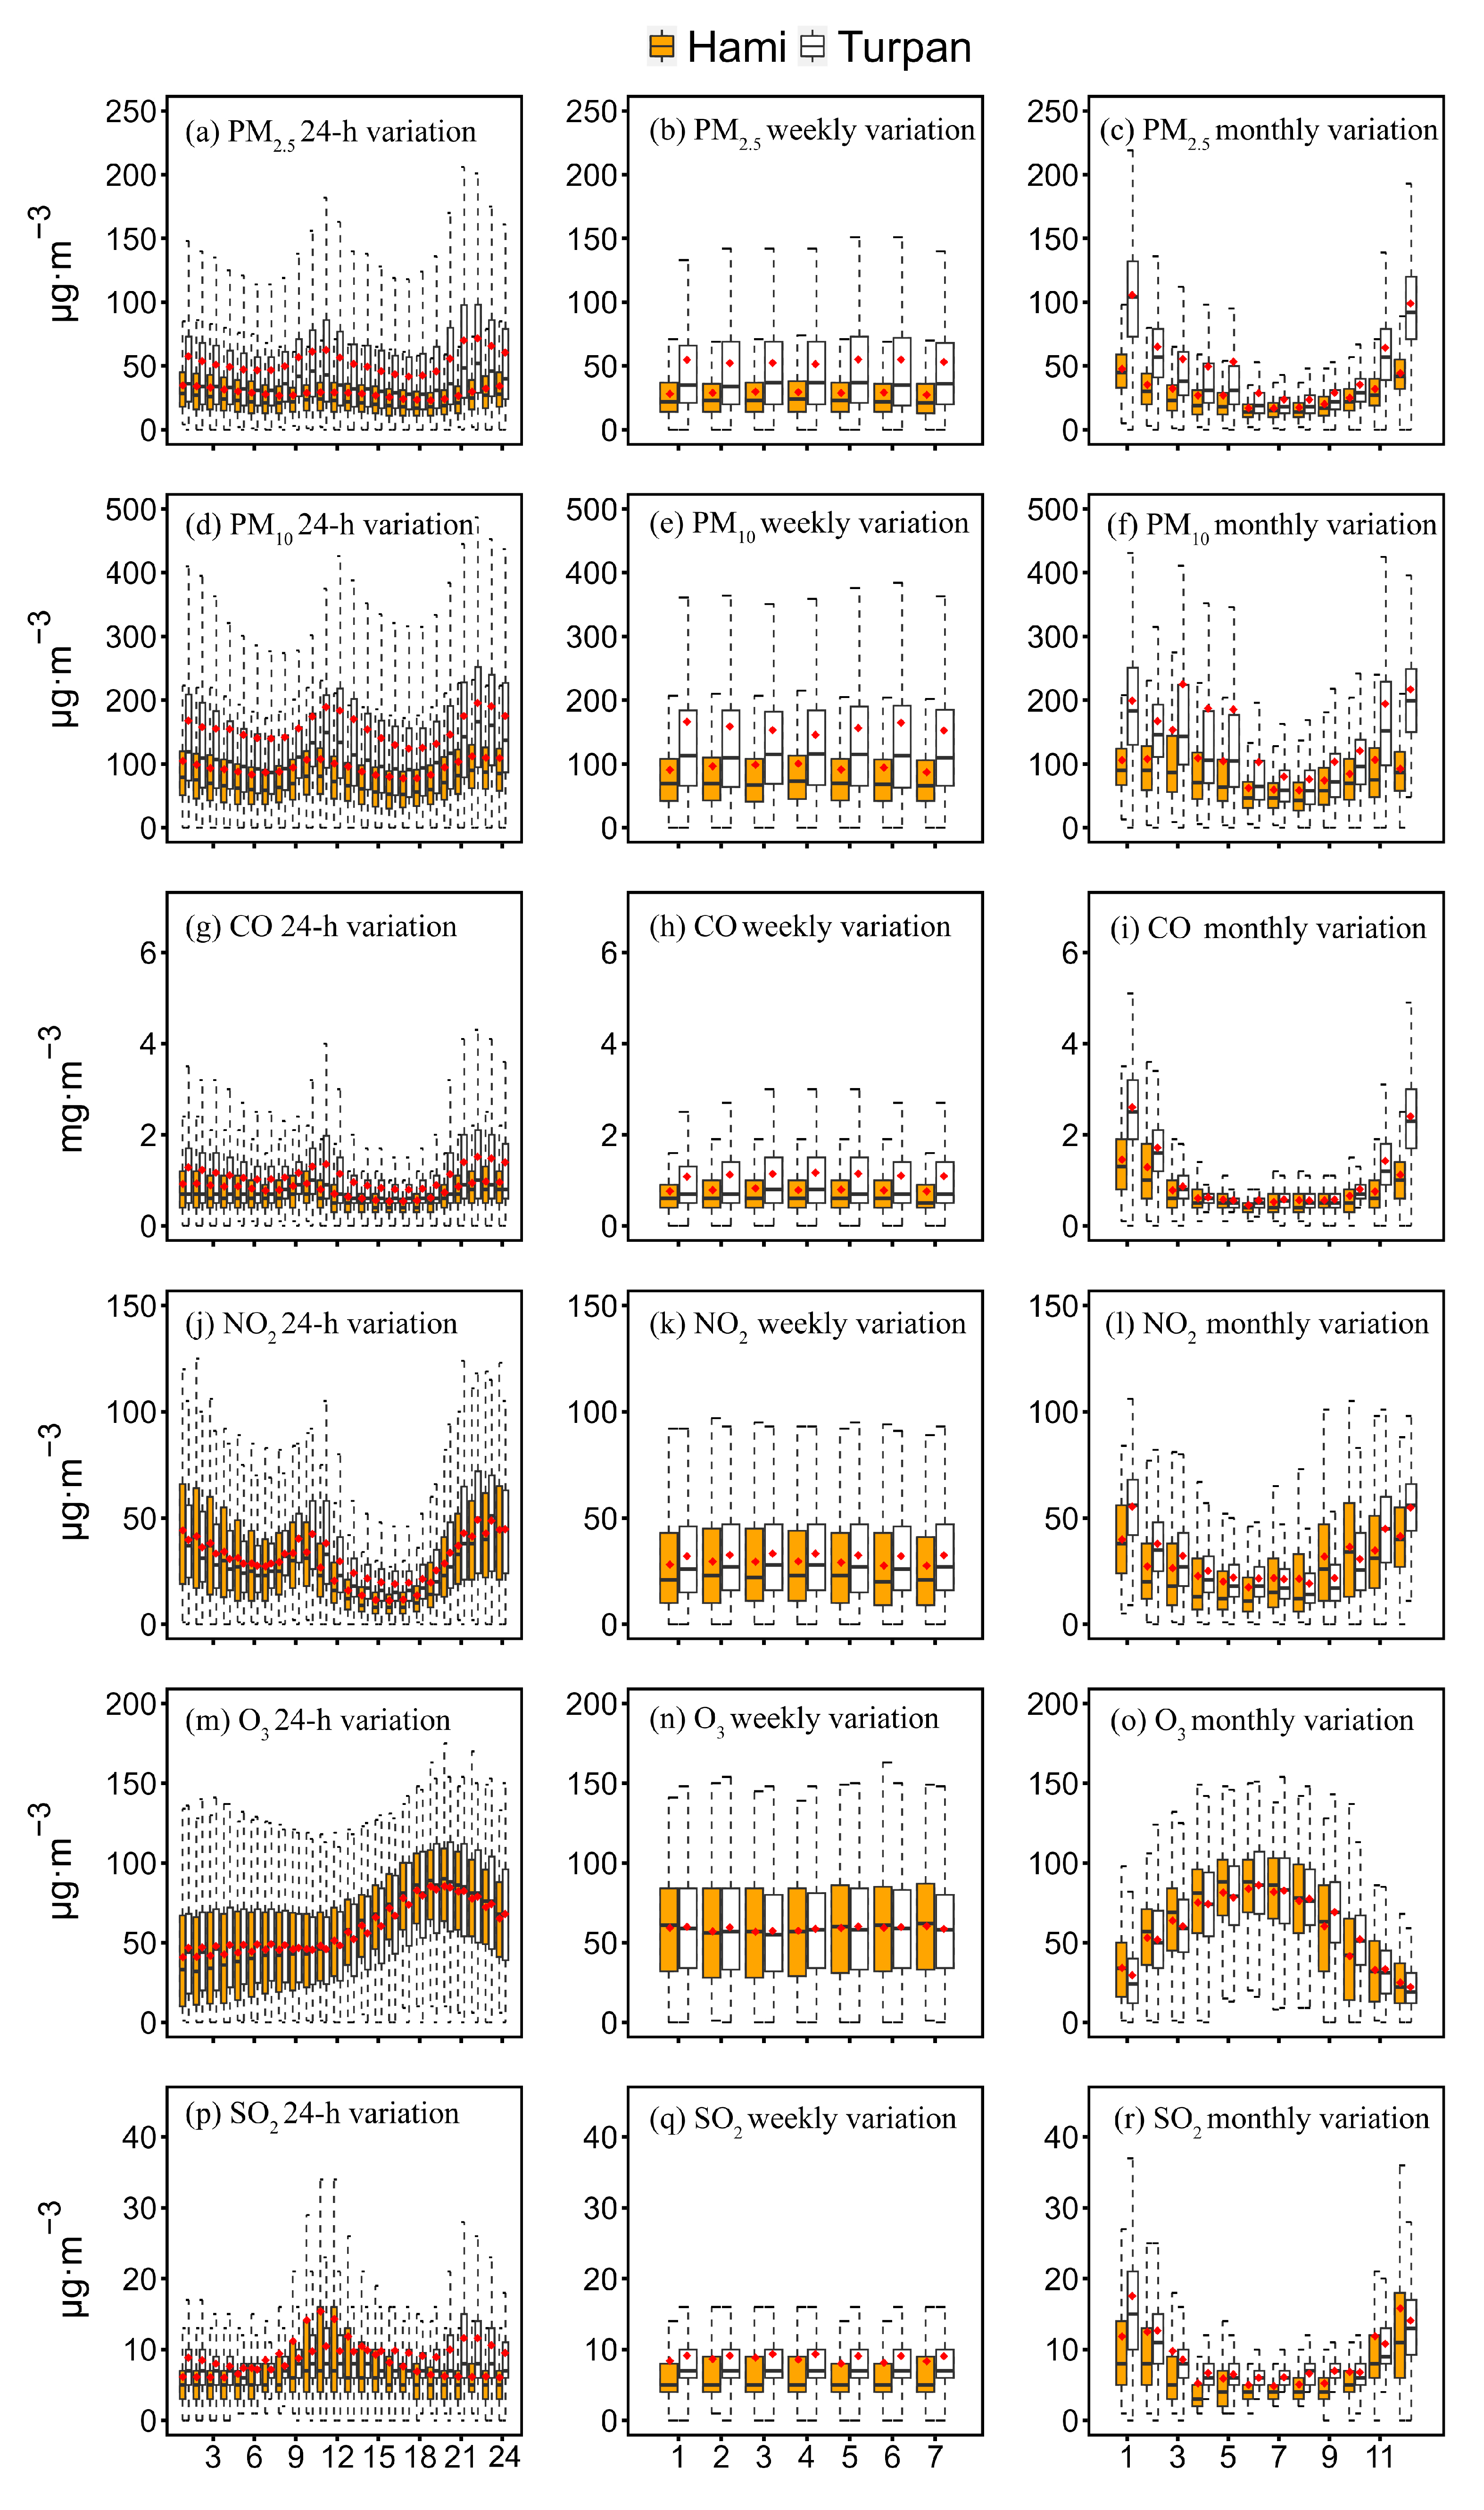
3.2.2. Diurnal, Weekly, and Monthly Variations

Hourly-resolved data provide a comprehensive understanding of diurnal variations in air pollutants. The boxplots in Figure 4 show daily, weekly, and monthly variations of air pollutants in Hami and Turpan during the whole period. The diurnal patterns of PM2.5, PM10, NO2, and CO presented a sinusoidal distribution, peaking at 10:00 and 22:00 of the day, respectively. Some studies have shown that the atmospheric boundary layer height in the Xinjiang region exhibits a distinct unimodal variation, gradually increasing during the daytime and decreasing during the nighttime [48,49]. Therefore, these variations are mainly influenced by local rush hour traffic and changes in the height of the atmospheric boundary layer. SO2 in Hami shows a “single peak” pattern maximizing at 11:00, while the diurnal cycle of SO2 in Turpan had an additional peak at 21:00. This could be related to nighttime emissions from surrounding industries. The elevations of O3 from 12:00 to 19:00 were due to increased photochemical reactions and the transport of air masses with higher O3 concentrations [27,50,51]. Considering the variation in sunlight intensity between Xinjiang and the eastern regions of China at the same time, the peak O3 concentration typically lags behind by 2 to 3 h compared to the eastern regions [52]. None of the six air pollutants showed decreased concentrations during the weekend. One possible explanation is that the monitoring sites are located in urban areas, where the influence of industry and traffic had little weekday–weekend difference. Except for O3, the other air pollutants in Hami and Turpan show a “U”-shaped monthly pattern from January to December, mainly caused by increased coal consumption and unfavorable meteorological conditions (e.g., low temperature and boundary layer height) in winter [53]. In contrast, O3 concentrations exhibited maximum values in summer, due to enhanced formation with strong solar radiation and high temperatures [29]. In addition, the elevated PM2.5 and PM10 levels in March and April suggested the influence of dust and sand storms in spring.

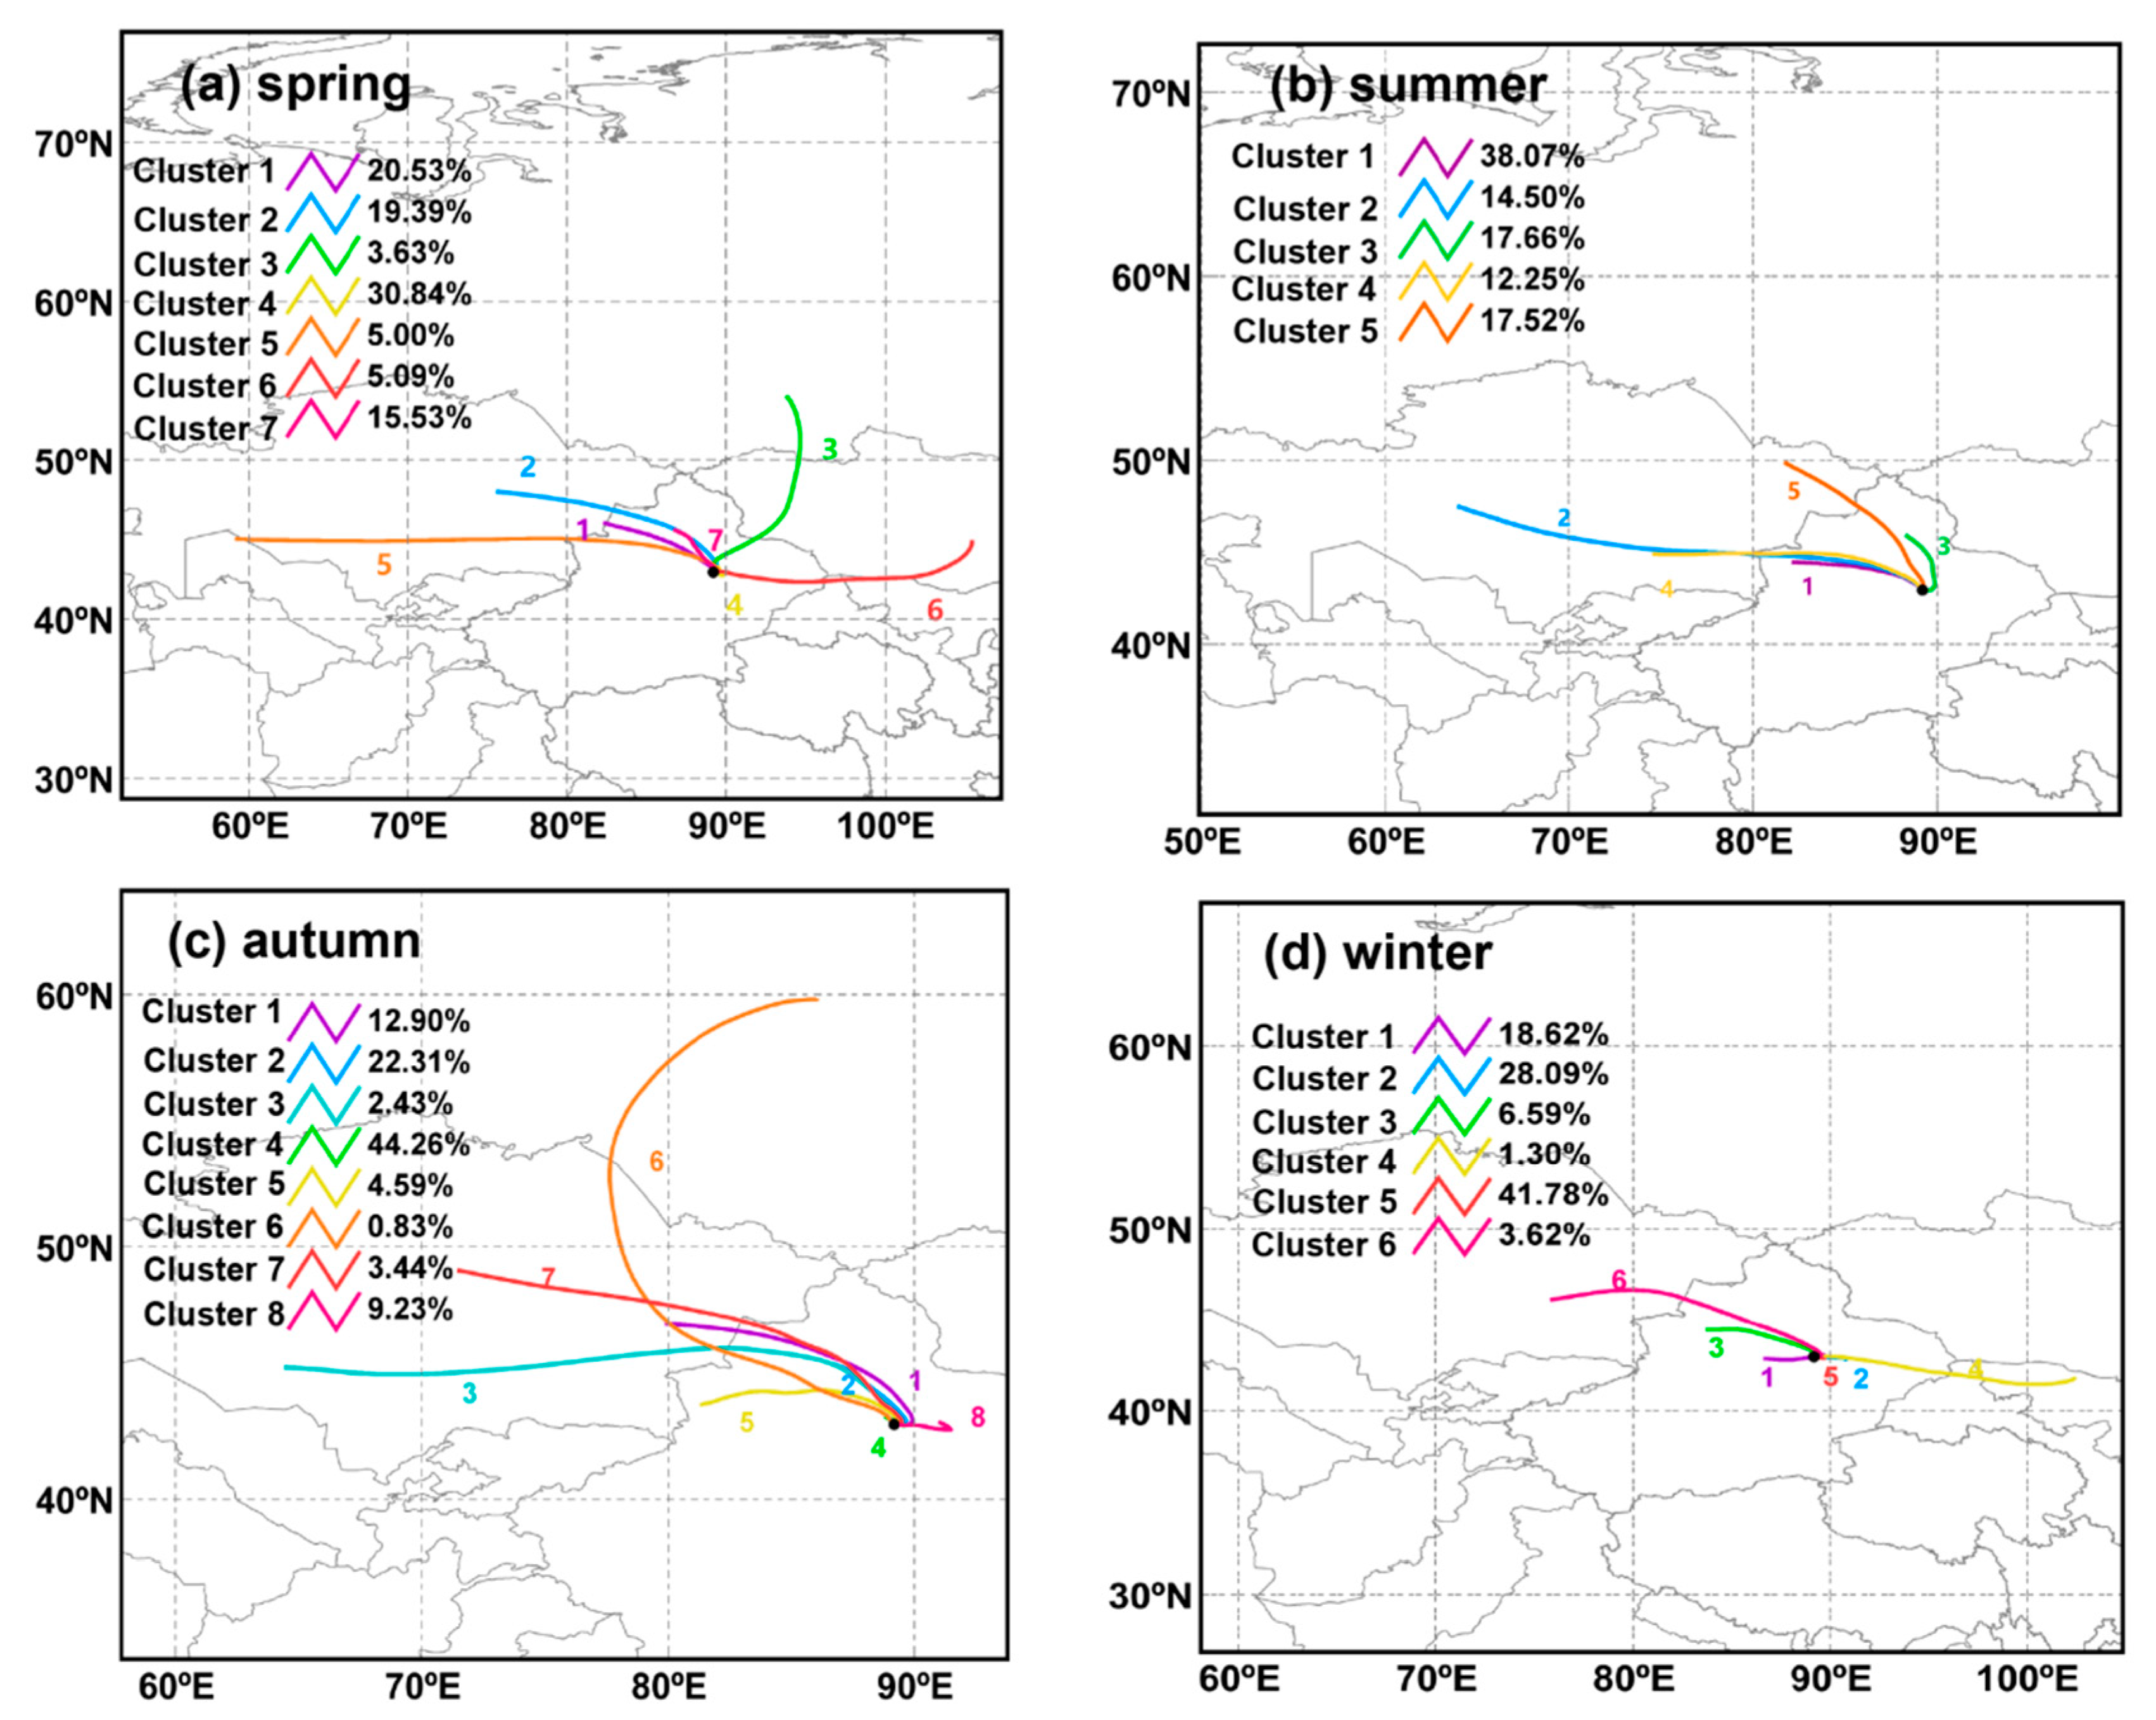
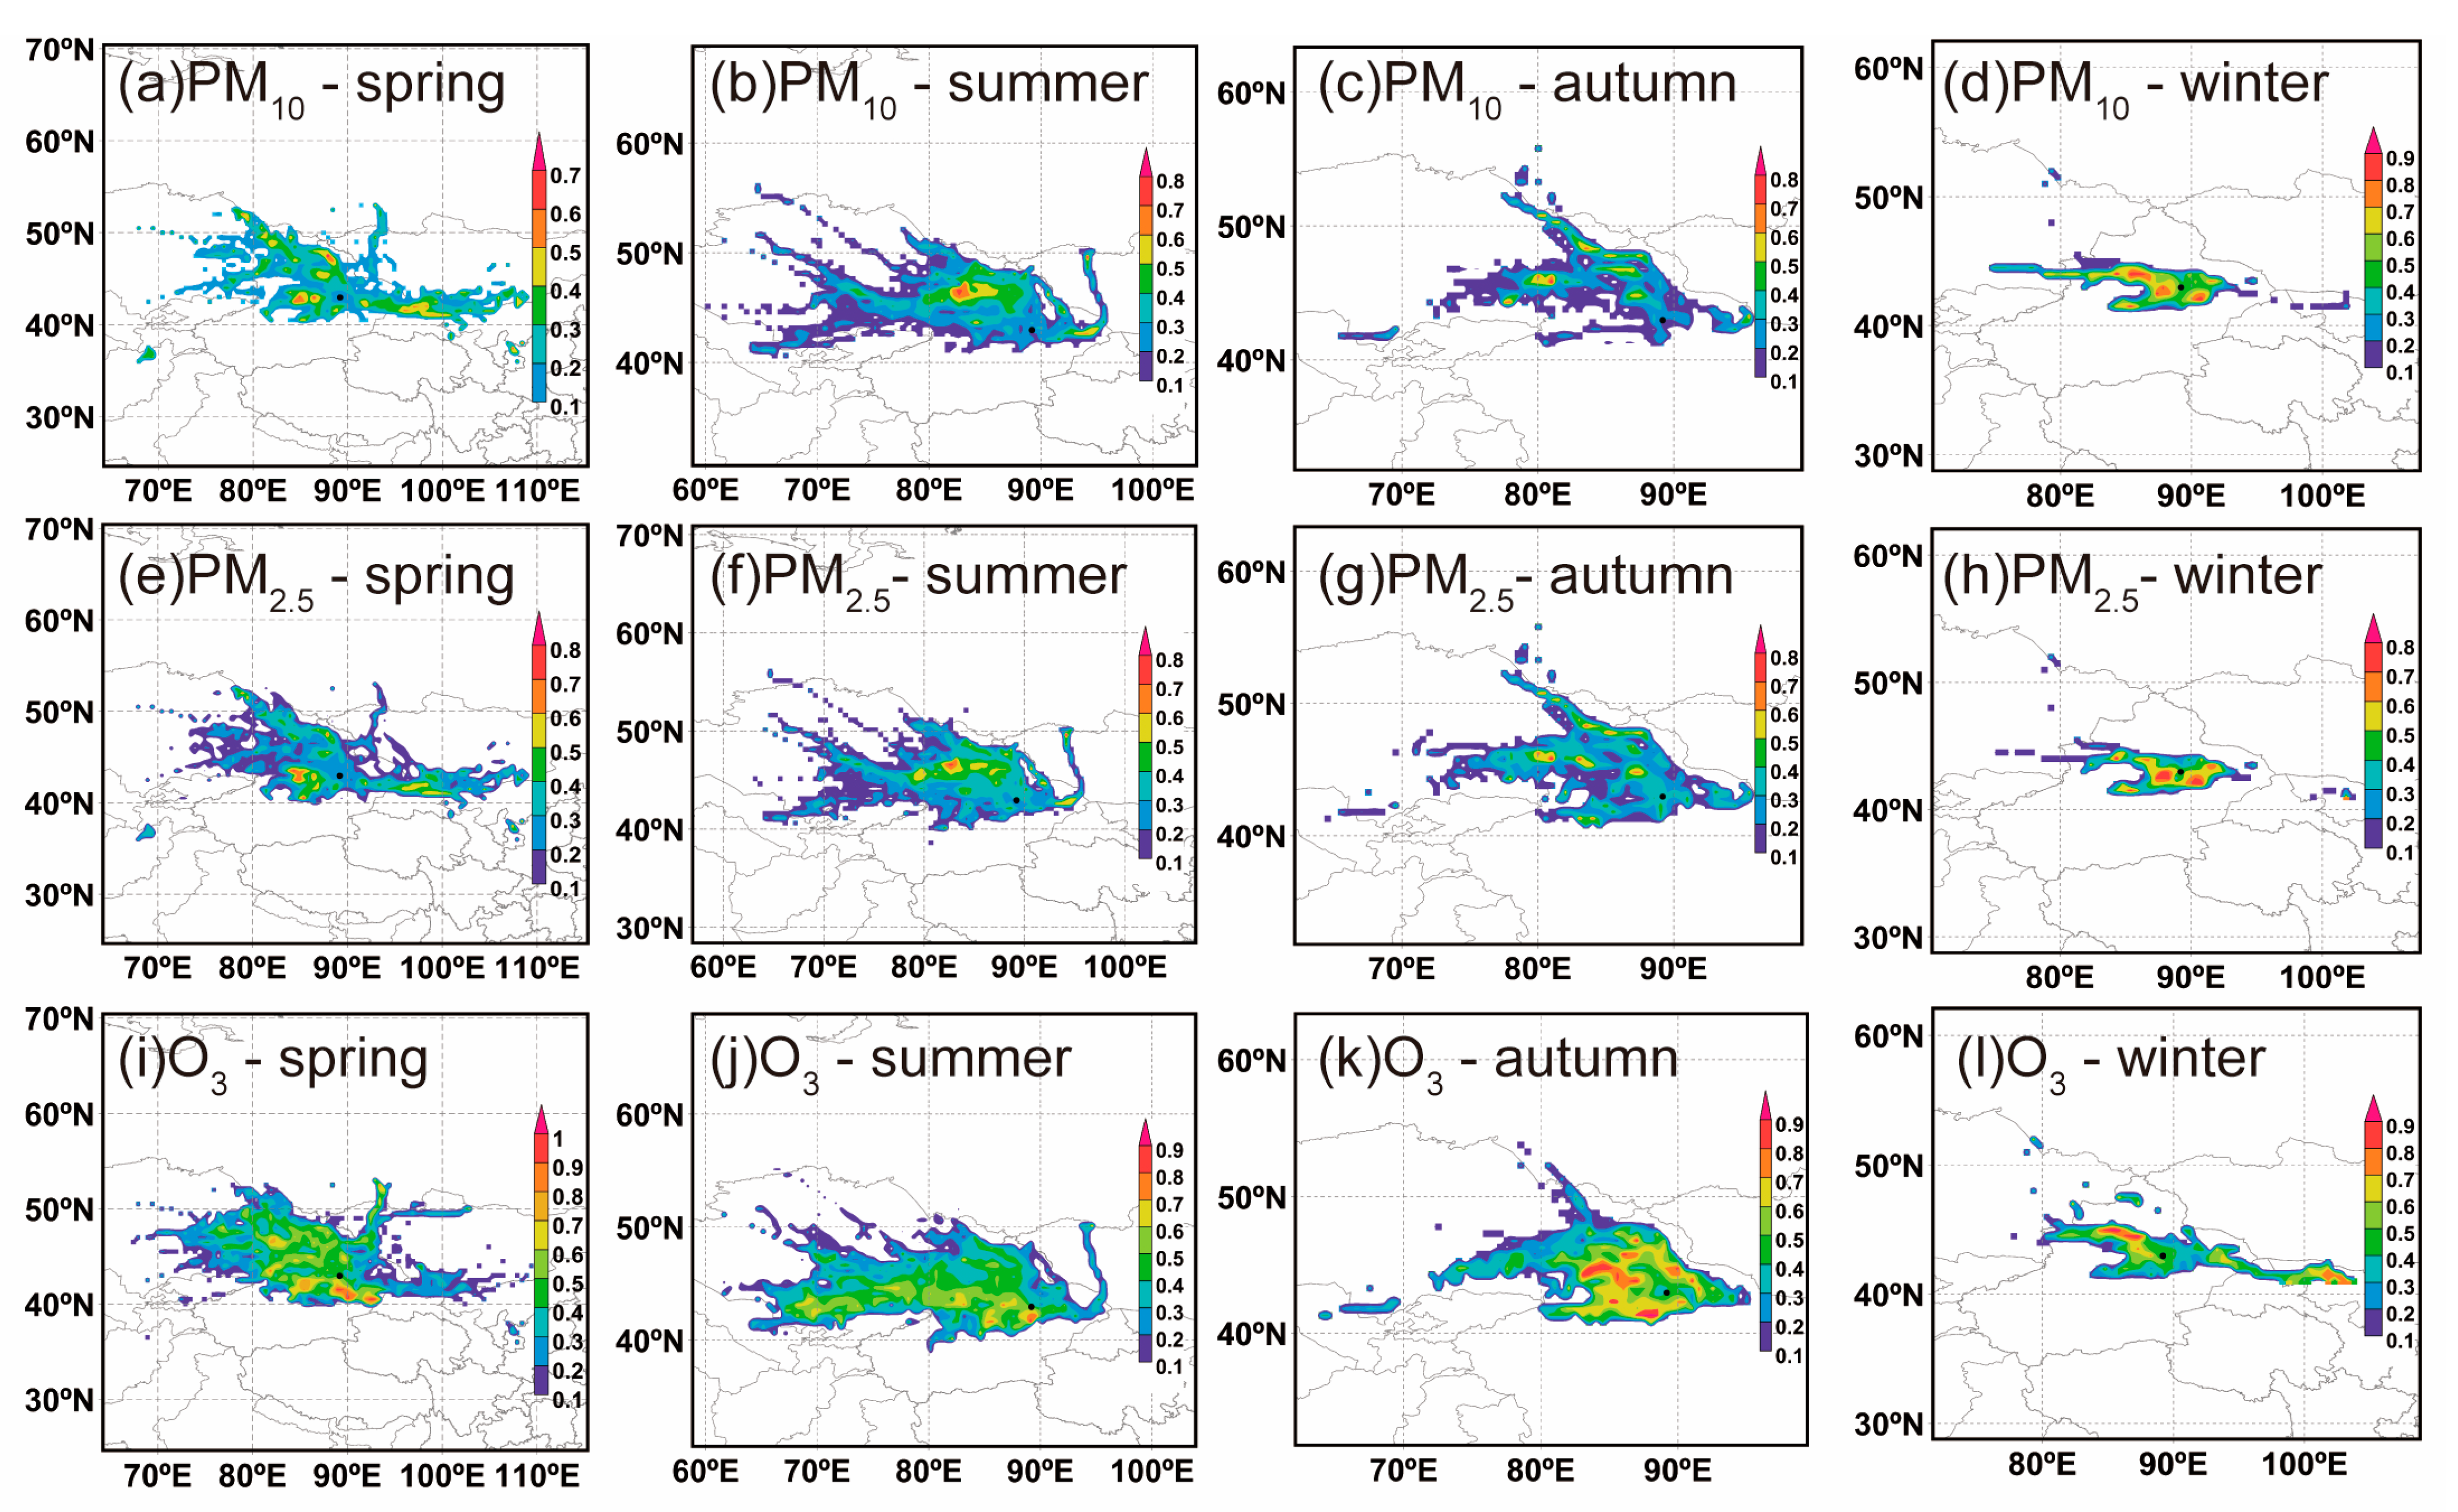
3.3. Regional Transport and Potential Contributing Sources

As described in Section 3.1 and 3.2, air pollution is more severe in Turpan compared to Hami, and we selected the TREPB site in Turpan as the trajectory receiving point. To avoid double counting contributions from the same source over years, the backward trajectories of major main pollutants (PM10, PM2.5, and O3) are simulated at 72 h intervals by season for 2022. MeteoInfo modeling was performed at an altitude of 500 m, which is applicable for considerations of both the long-range transport and transport in the planetary boundary layer [54,55]. Figure 5 shows the trajectory distributions, and Table S2 lists the averages of main pollutants (PM10, PM2.5, and O3) in different clusters in eastern Xinjiang during the four seasons in 2022.
In Figure 5, the air masses at the trajectory receiving point in eastern Xinjiang mainly come from the west and north. Cluster 1, 2, 5, 7 (60.4%) in spring, Cluster 1, 2, 4 (64.8%) in summer, Cluster 1, 2, 3, 5, 6, 7 in autumn (46.5%), and Cluster 1, 3, 6 in winter (28.8%) originated from eastern Uzbekistan, central and eastern Kazakhstan, and central Russia, and then entered eastern Xinjiang via Ili Kazak, Bayingol Mongolian Autonomous Prefecture (hereafter Bayingol Mongolian), Tacheng, Karamay, Changji, and Urumqi. The trajectory receiving point in spring and winter was also influenced by the transport of air masses from northeast Xinjiang via northwestern Mongolia, northern Gansu, and the Hami region (e.g., Cluster 6 in spring and Cluster 4 in winter). In 2022, the primary clusters with the highest proportions in the four seasons were Cluster 4 (spring, 30.8%), Cluster 1 (summer, 38.1%), Cluster 4 (autumn, 44.3%), and Cluster 5 (winter, 41.8%, Table S2). Moreover, the trajectories of these four air mass clusters had relatively shorter transport distances than other clusters during the same season (Figure 5), indicating that eastern Xinjiang is mainly affected by local emissions.
Cluster 3 in winter was characterized by relatively short distances and had the highest average mass concentration of PM10 (213 μg·m3, Table S2). Cluster 6 in spring, Cluster 4 in summer, and Cluster 6 in autumn carried the highest concentrations of PM10 (423 μg·m3, 77.4 μg·m3, and 1555 μg·m3), and the trajectories of these air masses were characterized by longer distances and higher velocities, indicating that the variations of PM10 in eastern Xinjiang in spring, summer, and autumn were majorly influenced by long-range transport. Except for O3, winter had the highest average concentrations of air pollutants in different air mass clusters (Table S2). During the summer season, the trajectories of air masses had the lowest PM concentrations but carried higher average concentrations of O3.
The WPSCF and WCWT results for the four seasons in eastern Xinjiang are shown in Figure 6 and Figure S3. The potential source regions identified through CWT analysis were generally consistent with those derived from the WPSCF analysis. Here, the average concentrations of target pollutants in each season were used as the criteria for assessing the pollution trajectory, and a WPSCF value of >0.50 indicated an area with high pollution potential.
Generally, the potential sources of pollution were mainly east–west distributed and showed significant seasonal variations, and the distributions of PM10 and PM2.5 potential source areas were smaller in winter. These were closely associated with the seasonal changes in predominant wind directions and wind speed in Turpan (Figure S4). However, the high-value areas of WPSCF were larger than in other seasons and concentrated in the northern part of Bayingol Mongolian, Changji, as well as the surroundings of Turpan and Hami, and the corresponding WCWT values of PM10 and PM2.5 were greater than 180 μg·m3 and 90.0 μg·m3, respectively. These results suggested a significant contribution of local emissions (Figure S3). In contrast, the potential sources of PM10 and PM2.5 in spring, summer, and autumn were relatively low for local areas (WPSCF < 0.30), and high-value areas of WPSCF were more dispersed. In summer, the high-value areas of WPSCF were mainly located in Tacheng with WCWT values of >90.0 μg·m3 and >36.0 μg·m3 for PM10 and PM2.5, respectively. In spring and autumn, the high potential source areas of PM10 and PM2.5 were distributed in the northwest and northeast of our trajectory receiving point, including eastern Kazakhstan, northeastern Kazakhstan, Altai, Changji, Bayingol Mongolian, and northwestern Inner Mongolia with WCWT contribution values greater than 300 μg·m3 and 60.0 μg·m3, respectively. Compared to PM, the potential O3 pollution sources were more widely distributed in winter and had smaller areas with high WPSCF values compared to the other seasons. Except for winter, WCWT values of O3 kept >90.0 μg·m3, indicating that O3 pollution in eastern Xinjiang was more influenced by regional transport with less seasonality.

4. Conclusions

In this paper, air quality and its temporal variations of Hami and Turpan in eastern Xinjiang were investigated by using hourly observations of the six criteria air pollutants (PM2.5, PM10, SO2, CO2, NO2, and O3) from 2018 to 2022. Moreover, the trajectory of air masses and the potential sources of pollutants were analyzed based on backward trajectory analysis, PSCF, and CWT methods. In eastern Xinjiang, the AQI exhibited notably higher values in winter than in summer and a slight increase in spring. Unlike eastern China, the most frequent main pollutant in eastern Xinjiang was PM10, followed by PM2.5 and O3. Except for O3, the average annual concentrations of air pollutants generally showed a continuous decline trend. These results indicate that air pollution control measures in eastern Xinjiang have achieved some effectiveness in recent years, but the PM concentrations in eastern Xinjiang remain at high levels. The diurnal and monthly patterns of target pollutants reflected combined impacts stemming from diverse emission sources and meteorological dynamics. The backward trajectory analysis demonstrated significant influences of both inter-regional and intra-regional transport on air pollution in eastern Xinjiang. The potential source areas of PM exhibited distinct distributions across seasons, with pronounced impacts from local emissions in winter and regional transport during other seasons. O3 had a widespread dispersion of potential sources throughout the year. Generally, reducing PM pollution, especially PM10 pollution, is urgent in eastern Xinjiang. In future, local emission reduction and joint prevention and controls with neighboring regions should be strengthened. Because eastern Xinjiang features dry, windy, and dust-prone areas, alleviating land degradation and desertification should also be considered.

Supplementary Materials

The following supporting information can be downloaded at: https://www.mdpi.com/article/10.3390/atmos14111670/s1, Text S1. Air quality index (AQI) calculation; Figure S1: The monthly variations of meteorological factors in Hami and Turpan; Figure S2: The number of days exceeding AQI standards in each year (a) and month (b) for Hami and Turpan during the whole period; Figure S3: CWT analysis results for PM2.5, PM10, and O3 in the eastern Xinjiang region during different seasons in 2022; Figure S4: Seasonal wind rose diagram for the Turpan region in 2022; Table S1: Statistics of hourly measurements of the six criteria air pollutants for AQI calculation; Table S2: Average PM2.5, PM10, and O3 concentrations in different clusters of eastern Xinjiang during the four seasons of 2022.

Author Contributions

Conceptualization, Y.Z. (Yuanyuan Zhang) and H.X.; methodology, Y.Z. (Yuanyuan Zhang) and M.X.; software, Y.Z. (Yuanyuan Zhang); validation, Y.Z. (Yuanyuan Zhang) and M.X.; formal analysis, Y.Z. (Yuanyuan Zhang); investigation, F.C. and B.C.; resources, J.L. and Y.Z. (Yunhui Zhang); data curation, Y.Z. (Yunhui Zhang) and Y.Z. (Yuanyuan Zhang); writing—original draft preparation, Y.Z. (Yuanyuan Zhang); writing—review and editing, Y.Z. (Yuanyuan Zhang) and M.X.; visualization, M.X.; supervision, M.X.; project administration, H.X. and J.L.; funding acquisition, H.X. and J.L. All authors have read and agreed to the published version of the manuscript.

Funding

This research was funded by the Xinjiang Uygur Autonomous Region Key Research and Development Program, grant number (2022B01012-3; 2022B01012-1), the Xuzhou Science and Technology Project, grant number (KC22345), and the Science and Technology Innovation Project of China National Administration of Coal Geology, grant number (ZMKJ-2021-ZX02-01).

Institutional Review Board Statement

Not applicable.

Informed Consent Statement

Not applicable.

Data Availability Statement

The data presented in this study are available on request from the corresponding author. The data are not publicly available due to privacy.

Conflicts of Interest

The authors declare no conflict of interest.

References

  1. Hu, J.; Wang, Y.; Ying, Q.; Zhang, H. Spatial and temporal variability of PM2.5 and PM10 over the North China Plain and the Yangtze River Delta, China. Atmos. Environ. 2014, 95, 598–609. [Google Scholar] [CrossRef]
  2. Huang, R.J.; Zhang, Y.; Bozzetti, C.; Ho, K.F.; Cao, J.J.; Han, Y.; Daellenbach, K.R.; Slowik, J.G.; Platt, S.M.; Canonaco, F. High secondary aerosol contribution to particulate pollution during haze events in China. Nature 2014, 514, 218–222. [Google Scholar] [CrossRef] [PubMed]
  3. Li, Y.; Liu, X. How did urban polycentricity and dispersion affect economic productivity? A case study of 306 Chinese cities. Landsc. Urban Plan. 2018, 173, 51–59. [Google Scholar] [CrossRef]
  4. Polk, H. State of Global Air 2019: A Special Report on Global Exposure to Air Pollution and Its Disease Burden; Health Effects Institute: Boston, MA, USA, 2019. [Google Scholar]
  5. Wang, L.; Li, P.; Yu, S.; Mehmood, K.; Li, Z.; Chang, S.; Liu, W.; Rosenfeld, D.; Flagan, R.C.; Seinfeld, J.H. Predicted impact of thermal power generation emission control measures in the Beijing-Tianjin-Hebei region on air pollution over Beijing, China. Sci. Rep. 2018, 8, 934. [Google Scholar] [CrossRef] [PubMed]
  6. Shi, H.; Wang, Y.; Chen, J.; Huisingh, D. Preventing smog crises in China and globally. J. Clean. Prod. 2016, 112, 1261–1271. [Google Scholar] [CrossRef]
  7. Sheehan, P.; Cheng, E.; English, A.; Sun, F. China’s response to the air pollution shock. Nat. Clim. Change 2014, 4, 306–309. [Google Scholar] [CrossRef]
  8. Li, X.; Qiao, Y.; Shi, L. The aggregate effect of air pollution regulation on CO2 mitigation in China’s manufacturing industry: An econometric analysis. J. Clean. Prod. 2017, 142, 976–984. [Google Scholar] [CrossRef]
  9. Feng, Y.Y.; Ning, M.; Lei, Y.; Sun, Y.M.; Liu, W.; Wang, J.N. Defending blue sky in China: Effectiveness of the “Air Pollution Prevention and Control Action Plan” on air quality improvements from 2013 to 2017. J. Environ. Manag. 2019, 252, 109603. [Google Scholar] [CrossRef]
  10. Wang, J.; Lei, Y.; Ning, M. Chinese model for improving air quality: An assessment of action plan of air pollution prevention and control. Environ. Prot. 2018, 46, 7–11. [Google Scholar]
  11. Jiang, X.; Li, G.; Fu, W. Government environmental governance, structural adjustment and air quality: A quasi-natural experiment based on the Three-year Action Plan to Win the Blue Sky Defense War. J. Environ. Manag. 2021, 277, 111470. [Google Scholar] [CrossRef]
  12. Yang, J.; Ji, Z.; Kang, S.; Zhang, Q.; Chen, X.; Lee, S.-Y. Spatiotemporal variations of air pollutants in western China and their relationship to meteorological factors and emission sources. Environ. Pollut. 2019, 254, 112952. [Google Scholar] [CrossRef] [PubMed]
  13. Guo, P.; Umarova, A.B.; Luan, Y. The spatiotemporal characteristics of the air pollutants in China from 2015 to 2019. PLoS ONE 2020, 15, e0227469. [Google Scholar] [CrossRef] [PubMed]
  14. Yao, X.; Ge, B.; Li, A.; Chen, G.; Fan, F.; Xu, D.; Wang, Y.; Tang, X.; Kong, L.; Wang, Z. Spatio-temporal variation of PM2. 5 pollution in Xinjiang and its causes: The growing importance in air pollution situation in China. Front. Environ. Sci. 2023, 10, 1051610. [Google Scholar] [CrossRef]
  15. Zhou, W.; Chen, C.; Lei, L.; Fu, P.; Sun, Y. Temporal variations and spatial distributions of gaseous and particulate air pollutants and their health risks during 2015–2019 in China. Environ. Pollut. 2021, 272, 116031. [Google Scholar] [CrossRef]
  16. Qi, J.; Zheng, B.; Li, M.; Yu, F.; Chen, C.; Liu, F.; Zhou, X.; Yuan, J.; Zhang, Q.; He, K. A high-resolution air pollutants emission inventory in 2013 for the Beijing-Tianjin-Hebei region, China. Atmos. Environ. 2017, 170, 156–168. [Google Scholar] [CrossRef]
  17. Zhao, S.; Yu, Y.; Yin, D.; Qin, D.; He, J.; Dong, L. Spatial patterns and temporal variations of six criteria air pollutants during 2015 to 2017 in the city clusters of Sichuan Basin, China. Sci. Total Environ. 2018, 624, 540–557. [Google Scholar] [CrossRef]
  18. Dong, J.; Chen, X.; Cai, X.; Xu, Q.; Guan, Y.; Li, T.; Liu, S.; Chen, F. Analysis of the temporal and spatial variation of atmospheric quality from 2015 to 2019 based on China atmospheric environment monitoring station. J. Geo-Inf. Sci. 2020, 22, 1983–1995. [Google Scholar]
  19. Wang, Y.Q. MeteoInfo: GIS software for meteorological data visualization and analysis. Meteorol. Appl. 2014, 21, 360–368. [Google Scholar] [CrossRef]
  20. Wang, Y.Q. An Open Source Software Suite for Multi-Dimensional Meteorological Data Computation and Visualisation. J. Open Res. Softw. 2019, 7, 21. [Google Scholar] [CrossRef]
  21. Draxler, R.R.; Hess, G.D. An overview of the HYSPLIT_4 modelling system for trajectories. Aust. Meteorol. Mag. 1998, 47, 295–308. [Google Scholar]
  22. Wang, Y.; Stein, A.F.; Draxler, R.R.; de la Rosa, J.D.; Zhang, X. Global sand and dust storms in 2008: Observation and HYSPLIT model verification. Atmos. Environ. 2011, 45, 6368–6381. [Google Scholar] [CrossRef]
  23. Begum, B.A.; Kim, E.; Jeong, C.-H.; Lee, D.-W.; Hopke, P.K. Evaluation of the potential source contribution function using the 2002 Quebec forest fire episode. Atmos. Environ. 2005, 39, 3719–3724. [Google Scholar] [CrossRef]
  24. Wang, Y.; Zhang, X.; Arimoto, R. The contribution from distant dust sources to the atmospheric particulate matter loadings at XiAn, China during spring. Sci. Total Environ. 2006, 368, 875–883. [Google Scholar] [CrossRef] [PubMed]
  25. Polissar, A.; Hopke, P.; Paatero, P.; Kaufmann, Y.; Hall, D.; Bodhaine, B.; Dutton, E.; Harris, J. The aerosol at Barrow, Alaska: Long-term trends and source locations. Atmos. Environ. 1999, 33, 2441–2458. [Google Scholar] [CrossRef]
  26. Hsu, Y.-K.; Holsen, T.M.; Hopke, P.K. Comparison of hybrid receptor models to locate PCB sources in Chicago. Atmos. Environ. 2003, 37, 545–562. [Google Scholar] [CrossRef]
  27. Zhang, L.; Jin, L.; Zhao, T.; Yin, Y.; Zhu, B.; Shan, Y.; Guo, X.; Tan, C.; Gao, J.; Wang, H. Diurnal variation of surface ozone in mountainous areas: Case study of Mt. Huang, East China. Sci. Total Environ. 2015, 538, 583–590. [Google Scholar] [CrossRef] [PubMed]
  28. Yin, Z.; Cui, K.; Chen, S.; Zhao, Y.; Chao, H.-R.; Chang-Chien, G.-P. Characterization of the air quality index for Urumqi and Turfan cities, China. Aerosol Air Qual. Res. 2019, 19, 282–306. [Google Scholar] [CrossRef]
  29. Luo, Y.; Xu, L.; Li, Z.; Zhou, X.; Zhang, X.; Wang, F.; Peng, J.; Cao, C.; Chen, Z.; Yu, H. Air pollution in heavy industrial cities along the northern slope of the Tianshan Mountains, Xinjiang: Characteristics, meteorological influence, and sources. Environ. Sci. Pollut. Res. Int. 2023, 30, 55092–55111. [Google Scholar] [CrossRef]
  30. Turap, Y.; Rekefu, S.; Wang, G.; Talifu, D.; Gao, B.; Aierken, T.; Hao, S.; Wang, X.; Tursun, Y.; Maihemuti, M. Chemical characteristics and source apportionment of PM2. 5 during winter in the southern part of Urumqi, China. Aerosol Air Qual. Res. 2019, 19, 1325–1337. [Google Scholar] [CrossRef]
  31. Xu, G.; Jiao, L.; Zhang, B.; Zhao, S.; Yuan, M.; Gu, Y.; Liu, J.; Tang, X. Spatial and temporal variability of the PM2. 5/PM10 ratio in Wuhan, Central China. Aerosol Air Qual. Res. 2017, 17, 741–751. [Google Scholar] [CrossRef]
  32. Song, C.; Wu, L.; Xie, Y.; He, J.; Chen, X.; Wang, T.; Lin, Y.; Jin, T.; Wang, A.; Liu, Y. Air pollution in China: Status and spatiotemporal variations. Environ. Pollut. 2017, 227, 334–347. [Google Scholar] [CrossRef] [PubMed]
  33. Filonchyk, M. Characteristics of the severe March 2021 Gobi Desert dust storm and its impact on air pollution in China. Chemosphere 2022, 287, 132219. [Google Scholar] [CrossRef] [PubMed]
  34. Yang, J.; Fu, X.; Qiao, L.; Yao, L.; Zhang, F.; Li, W. Characteristics of Atmospheric Pollution in a Chinese Megacity: Insights from Three Different Functional Areas. Sustainability 2023, 15, 2429. [Google Scholar] [CrossRef]
  35. Wang, N.; Zhu, C.; Li, W.; Qiu, M.; Wang, B.; Li, X.; Jiang, B.; Qu, X.; Li, Z.; Cheng, H. Air quality improvement assessment and exposure risk of Shandong Province in China during 2014 to 2020. Int. J. Environ. Sci. Technol. 2022, 20, 9495–9504. [Google Scholar] [CrossRef] [PubMed]
  36. Li, J. Characteristics, Source, Long-Range Transport of Dust Aerosol Over the Central Asia and Its Potential Effect on Global Change; Fudan Universtiy: Shanghai, China, 2009. [Google Scholar]
  37. Xuan, J. Dust emission factors for environment of Northern China. Atmos. Environ. 1999, 33, 1767–1776. [Google Scholar] [CrossRef]
  38. Zhang, X.-X.; Sharratt, B.; Chen, X.; Wang, Z.-F.; Liu, L.-Y.; Guo, Y.-H.; Li, J.; Chen, H.-S.; Yang, W.-Y. Dust deposition and ambient PM 10 concentration in northwest China: Spatial and temporal variability. Atmos. Chem. Phys. 2017, 17, 1699–1711. [Google Scholar] [CrossRef]
  39. Wang, Y.; Tang, J.; Zhang, Z.; Wang, W.; Wang, J.; Wang, Z. Hybrid Methods’ Integration for Remote Sensing Monitoring and Process Analysis of Dust Storm Based on Multi-Source Data. Atmosphere 2022, 14, 3. [Google Scholar] [CrossRef]
  40. Wang, P.; Chen, K.; Zhu, S.; Wang, P.; Zhang, H. Severe air pollution events not avoided by reduced anthropogenic activities during COVID-19 outbreak. Resour. Conserv. Recycl. 2020, 158, 104814. [Google Scholar] [CrossRef]
  41. Zhai, H.; Yao, J.; Wang, G.; Tang, X. Spatio-Temporal Characteristics and Variation Pattern of the Atmospheric Particulate Matter Concentration: A Case Study of the Beijing–Tianjin–Hebei Region, China. Atmosphere 2022, 13, 120. [Google Scholar] [CrossRef]
  42. Javed, Z.; Bilal, M.; Qiu, Z.; Li, G.; Sandhu, O.; Mehmood, K.; Wang, Y.; Ali, M.A.; Liu, C.; Wang, Y. Spatiotemporal characterization of aerosols and trace gases over the Yangtze River Delta region, China: Impact of trans-boundary pollution and meteorology. Environ. Sci. Eur. 2022, 34, 86. [Google Scholar] [CrossRef]
  43. Blanco-Becerra, L.C.; Gáfaro-Rojas, A.I.; Rojas-Roa, N.Y. Influence of precipitation scavenging on the PM2.5PM10 ratio at the Kennedy locality of Bogotá, Colombia. Rev. Fac. Ing. Univ. De Antioq. 2015, 76, 58–68. [Google Scholar] [CrossRef]
  44. Bai, Y.; Wang, Z.; Xie, F.; Cen, L.; Xie, Z.; Zhou, X.; He, J.; Lü, C. Changes in stoichiometric characteristics of ambient air pollutants pre-to post-COVID-19 in China. Environ. Res. 2022, 209, 112806. [Google Scholar] [CrossRef] [PubMed]
  45. Nirel, R.; Dayan, U. On the Ratio of Sulfur Dioxide to Nitrogen Oxides as an Indicator of Air Pollution Sources. J. Appl. Meteorol. 2001, 40, 1209–1222. [Google Scholar] [CrossRef]
  46. Aneja, V.P.; Agarwal, A.; Roelle, P.A.; Phillips, S.B.; Tong, Q.; Watkins, N.; Yablonsky, R. Measurements and analysis of criteria pollutants in New Delhi, India. Environ. Int. 2001, 27, 35–42. [Google Scholar] [CrossRef] [PubMed]
  47. Qian, Z.; Meng, Q.; Chen, K.; Zhang, Z.; Liang, H.; Yang, H.; Huang, X.; Zhong, W.; Zhang, Y.; Wei, Z. Machine Learning Explains Long-Term Trend and Health Risk of Air Pollution during 2015–2022 in a Coastal City in Eastern China. Toxics 2023, 11, 481. [Google Scholar] [CrossRef]
  48. Li, S.; Li, X.; Deng, Z.; Xia, X.; Ren, G.; An, D.; Ayikan, M.; Zhong, Y. Characteristics of atmospheric boundary layer and its relation with PM2. 5 during winter in Shihezi, an Oasis city in Northwest China. Atmos. Pollut. Res. 2023, 14, 101902. [Google Scholar] [CrossRef]
  49. Wang, Y.; Gao, J.; Mamtimin, A.; Sayit, H.; Zhou, C.; Li, R.; Dawut, M.; Yang, F.; Huo, W.; Wen, C. Evolution law of atmospheric boundary layer in Gurbantünggüt Desert based on reanalysis dataset and in situ observation data. Heliyon 2023, 9, e14147. [Google Scholar] [CrossRef]
  50. Li, H.; Zhou, D.; Wei, Y. An Assessment of PM2.5-Related Health Risks and Associated Economic Losses in Chinese Cities. Huan Jing Ke Xue Huanjing Kexue 2018, 39, 3467–3475. [Google Scholar] [CrossRef]
  51. Liu, Y.; Zhou, Y.; Lu, J. Exploring the relationship between air pollution and meteorological conditions in China under environmental governance. Sci. Rep. 2020, 10, 14518. [Google Scholar] [CrossRef]
  52. Fang, C.; Li, Z.; Shi, W.; Wang, J. Analysis of Pollution Characteristics and Emissions Reduction Measures in the Main Cotton Area of Xinjiang. J. Environ. Res. Public Health 2023, 20, 2273. [Google Scholar] [CrossRef]
  53. Van Hooijdonk, I.G.S.; Clercx, H.J.H.; Abraham, C.; Holdsworth, A.M.; Monahan, A.H.; Vignon, E.; Moene, A.F.; Baas, P.; van de Wiel, B.J.H. Near-surface temperature inversion growth rate during the onset of the stable boundary layer. J. Atmos. Sci. 2017, 74, 3433–3449. [Google Scholar] [CrossRef]
  54. Yin, X.; Kang, S.; de Foy, B.; Ma, Y.; Tong, Y.; Zhang, W.; Wang, X.; Zhang, G.; Zhang, Q. Multi-year monitoring of atmospheric total gaseous mercury at a remote high-altitude site (Nam Co, 4730 m asl) in the inland Tibetan Plateau region. Atmos. Chem. Phys. 2018, 18, 10557–10574. [Google Scholar] [CrossRef]
  55. Lu, Z.; Streets, D.G.; Zhang, Q.; Wang, S. A novel back-trajectory analysis of the origin of black carbon transported to the Himalayas and Tibetan Plateau during 1996–2010. Geophys. Res. Lett. 2012, 39, 1–6. [Google Scholar] [CrossRef]
Figure 1. Locations of the National Environmental Monitoring stations in eastern Xinjiang (plots to the right are taken from Google Earth, https://earth.google.com, accessed on 7 September 2023).
Atmosphere 14 01670 g001
Figure 2. Daily AQI values of (a) Hami and (b) Turpan from 2018 to 2022 in eastern Xinjiang.
Atmosphere 14 01670 g002
Figure 3. Interannual changes in concentrations of criteria air pollutants based on hourly measurements for the whole sampling period. The boxes depict the median (dark line), inner quartile range (box), 10th and 90th percentiles (whiskers), and the mean (red diamond).
Atmosphere 14 01670 g003
Figure 4. Diurnal, weekly, and monthly variations of target pollutant concentrations based on hourly measurements for the whole period. The boxes depict the median (dark line), inner quartile range (box), 10th and 90th percentiles (whiskers), and the mean (red diamond).
Atmosphere 14 01670 g004
Figure 5. Distribution of trajectory clusters in eastern Xinjiang during the four seasons of 2022.
Atmosphere 14 01670 g005
Figure 6. PSCF analysis results for PM10, PM2.5, and O3 in eastern Xinjiang during different seasons in 2022.
Atmosphere 14 01670 g006
Table 1. Frequencies of being the main pollutant for each criteria pollutant (based on daily mean) in Hami and Turpan during 2018–2022.
SiteYearPM2.5PM10CONO2O3-8hSO2
20189.75%43.7%1.39%16.4%5.85%0.00%
20196.85%72.9%0.27%0.82%0.82%0.00%
Hami202012.6%56.8%0.00%1.37%0.55%0.00%
20210.00%70.4%0.27%0.82%0.82%0.00%
20220.55%68.5%0.00%0.82%3.56%0.00%
Total5.93%62.5%0.38%4.01%2.31%0.00%
201811.5%78.4%0.00%0.00%0.00%0.00%
201915.1%78.4%0.00%0.00%1.64%0.00%
Turpan202017.6%69.2%0.00%0.00%1.65%0.00%
202112.1%77.3%0.00%0.00%1.10%0.00%
202215.3%67.1%0.00%0.00%4.66%0.00%
Total14.3%74.1%0.00%0.00%1.81%0.00%
Disclaimer/Publisher’s Note: The statements, opinions and data contained in all publications are solely those of the individual author(s) and contributor(s) and not of MDPI and/or the editor(s). MDPI and/or the editor(s) disclaim responsibility for any injury to people or property resulting from any ideas, methods, instructions or products referred to in the content.

